Embed Size (px)
Citation preview

Dan Cloak Environmental Consulting September 15, 2013 1
Contra Costa Clean Water Program
IMP Monitoring Report
IMP Model Calibration and Validation Project
Municipal Regional Permit Attachment C
Submitted to the
California Regional Water Quality Control Board
San Francisco Bay Region
September 15, 2013

Dan Cloak Environmental Consulting September 15, 2013 2
Acknowledgements
Dan Cloak, of Dan Cloak Environmental Consulting, prepared
the project plan, oversaw implementation of the model
calibration and verification project, and prepared this report.
Tony Dubin, of Dubin Environmental Consulting, was involved
in developing the model documented in CCCWP’s 2005 HMP. He
conducted the modeling runs, calibrated and verified the model,
and prepared the tables, figures, and text in Chapter 6 of this
report.
Scott McQuarrie, of the Contra Costa Flood Control and Water
Conservation District, designed and implemented the
instrumentation, monitored the IMPs, and compiled the data
used in the model calibration and verification.
Tom Dalziel, of the Contra Costa Clean Water Program, has
provided project management and coordination since the advent
of this effort in 2003.
Jolan Longway, of the City of Pittsburg, provided project
coordination and troubleshooting during design and
construction of the facilities at the Pittsburg Fire Protection
Bureau Building.
Carlton Thompson, Michael Hawthorne, and Scott Wikstrom, of
the City of Walnut Creek, provided project coordination and
troubleshooting during and following design and construction of
the facilities at Walden Parks Commons.
Tom Mumley, Dale Bowyer, and Jan O’Hara, of the San
Francisco Bay Regional Water Quality Control Board, were
involved in developing and negotiating requirements for
implementation of HM measures and for the IMP calibration and
verification project.

Dan Cloak Environmental Consulting September 15, 2013 3
TABLE OF CONTENTS
0 ∙ EXECUTIVE SUMMARY ........................................................................ 5
1 ∙ BACKGROUND: HYDROGRAPH MODIFICATION MANAGEMENT ....... 7
1.1 Permit Definitions and Requirements ........................................... 7 1.2 Hydromodification, Control Methods, and Measurements ............. 9 1.3 LID and HM ............................................................................... 12 1.4 CCCWP Approach to HM ............................................................ 13
2 ∙ MODEL REPRESENTATION OF HYDROLOGIC PERFORMANCE ....... 16
3 ∙ MODEL VERIFICATION AND CALIBRATION PROJECT DESIGN ....... 18
3.1 Steps for Model Verification and Calibration .............................. 18 3.2 Evaluation of Sizing Factors ....................................................... 18
4 ∙ PROJECT TEST FACILITY CHARACTERISTICS AND PARAMETERS 19
4.1 Pittsburg Fire Protection Bureau Building .................................. 20 4.2 Walden Park Commons .............................................................. 24
5 ∙ DATA COLLECTION AND REVIEW ..................................................... 28
5.1 Exceptions Affecting Data Collection—Pittsburg ......................... 28 5.2 Exceptions Affecting Data Collection—Walden Park ................... 28 5.3 Data Review and Consistency Check .......................................... 29
6 ∙ ANALYSIS AND RESULTS.................................................................. 29
6.1 Comparison of Simulated and Recorded Data ............................ 30 6.2 Adjustment of Model Parameter Values ...................................... 43 6.3 IMP Performance Compared to Flow Duration Standard ............. 46
7 ∙ DISCUSSION ...................................................................................... 50
7.1 Why These Results Are Important .............................................. 50 7.2 Percolation Through Bioretention Planting Media ....................... 51 7.3 Infiltration to Native Soils .......................................................... 51 7.4 Applicability of Results Region-wide ........................................... 52
8 ∙ CONCLUSIONS AND RECOMMENDATIONS ...................................... 53
8.1 Next Steps for Use of the Calibrated and Validated Model ........... 53 8.2 Insights Concerning Bioretention Design and Construction ........ 54 8.3 Recommendations for Instrumentation ...................................... 55 8.4 Further Research ....................................................................... 56
REFERENCES ............................................................................................. 57
APPENDIX A:
IMP Modeling Analysis and Results

Dan Cloak Environmental Consulting September 15, 2013 4
TABLES
4-1. Pittsburg Fire Protection Building Facility Dimensions ............... 21 6-1. Seasonal Rainfall Totals ............................................................. 31 6-2. Pittsburg Fire Prevention Bureau Site Storm Events ................... 32 6-3. Walden Park Commons Site Storm Events .................................. 32 6-4. Pittsburg Fire Protection Bureau Monitored Events ................... 39 6-5. Pittsburg Fire Protection Bureau Modeled Events ....................... 41
FIGURES
1-1. A, V1, and V2 ............................................................................. 14
4-1. Pittsburg Site Pre-Project Aerial View .......................................... 20 4-2. Excavation of IMP #2 at Pittsburg Site ....................................... 20 4-3. Pittsburg Site Drainage Management Areas ............................... 21 4-4. Underdrain Orifice Detail ........................................................... 22
4-5. Walden Park Commons Storm Drainage Areas ........................... 24 4-6. Configuration of Walden Park Commons Bioretention ................ 26 6-1. Percolation and Infiltration, Pittsburg Site IMP #2 ..................... 34 6-2. Percolation and Infiltration, Pittsburg Site IMP #6 ..................... 34 6-3. Stormwater in Storage Pipe, Walden Park Commons #1 .............. 35 6-4. Stormwater in Storage Pipe, Walden Park Commons #2 .............. 36 6-5. Storm Recession Rates, Pittsburg Site IMP #2 ............................ 37 6-6. Storm Recession Rates, Pittsburg Site IMP #6 ............................ 37 6-7. Model Output and Monitoring Data Comparison, Pittsburg #2 ... 40 6-8. Model Output and Monitoring Data Comparison, Pittsburg #6 ... 40 6-9. Model Output and Monitoring Data, Walden Park Commons #1 . 41 6-10. Model Output and Monitoring Data, Walden Park Commons #1 42 6-11. Model Output and Monitoring Data, Walden Park Commons #2. 42 6-12. Model Output and Monitoring Data, Walden Park Commons #2. 43 6-13. Model Output and Monitoring Data, Walden Park Commons #1. 44 6-14. Model Output and Monitoring Data, Walden Park Commons #1. 44 6-15. Updated Model Output and Monitoring Data, Pittsburg #6 ........ 45 6-16. Updated Model Output and Monitoring Data, Pittsburg #6 ....... 46 6-17. Peak Flow Frequency Comparison, Pittsburg Site IMP #2 .......... 48 6-18. Flow Duration Comparison, Pittsburg Site IMP #2 .................... 48 6-19. Peak Flow Frequency Comparison, Walden Park Commons #1 .. 49 6-20. Flow Duration Comparison, Walden Park Commons #1 ............ 50

Dan Cloak Environmental Consulting September 15, 2013 5
0 ∙ Executive Summary
The Contra Costa Clean Water Program (CCCWP) comprises
Contra Costa County and the 19 cities and towns within the
County, all of which are Permittees under an NPDES permit
issued by the San Francisco Bay Regional Water Quality Control
Board (Water Board).
Pursuant to permit provision C.3.g., the Permittees require
Hydromodification Management (HM) measures to be
implemented on development projects. HM measures are
intended to control runoff flows so that they do not exceed pre-
project flow rates and durations for a specified range of flows.
The requirements apply to projects that create or replace an acre
or more of impervious area and increase the total amount of
impervious area on the project site.
Criteria for HM measures—including factors for sizing HM
facilities, called Integrated Management Practices or IMPs—are
incorporated in CCCWP’s Stormwater C.3 Guidebook. The IMPs
include bioretention and variations consisting of bioretention
combined with upstream or downstream storage.
The sizing factors were developed using a continuous-simulation
computer model. The model uses 30 or more years of hourly
local rainfall data and generates corresponding estimates of
hourly runoff. Model output is used to compare estimated runoff
in the site’s pre-development condition to runoff post-
development, including incorporation of HM measures. Sizing
factors represent the minimum IMP areas and volumes required
to fully control runoff flows to match the pre-development
condition.
The permit requires CCCWP to implement a model calibration
and verification project, which is the subject of this report. The
purpose of the project is to determine the flow-control
effectiveness of the IMPs. The permit specifies that IMPs at a
minimum of five locations be monitored for a minimum of two
years and that the observed flows be compared to flows that
would be estimated by the model.
Three IMPs (bioretention facilities) at an office building in
Pittsburg, and two IMPs (bioretention + downstream vault
facilities) at a townhouse development in Walnut Creek, were
monitored during the 2011-2012 and 2012-2013 water years.
Rainfall data was collected at each location. For the IMPs at the
Pittsburg site, the water level in the subsurface storage layer was
also continuously monitored.

Dan Cloak Environmental Consulting September 15, 2013 6
Results of the comparison show that the IMPs provide
considerably greater flow-control effectiveness than predicted by
the model. The primary reason is that model inputs
underestimated the amount of runoff that would be infiltrated by
the IMPs. In addition, it was found that runoff percolated
through the IMPs soil/compost planting mix more readily than
the model predicted. Following changes to input parameters,
including the infiltration rate of underlying soils, the model
outputs closely matched observed IMP flows and storage.
Local long-term rainfall records were then input to the calibrated
model to analyze how IMPs would perform in comparison to
current and potential future permit requirements. The
simulation indicates that the IMPs fully control runoff flows
between the thresholds specified in the current permit (two-
tenths of the 2-year pre-project peak flow, or 0.2Q2, and the 10-
year pre-project peak flow, or Q10). The Pittsburg bioretention
IMPs also control runoff flows within a range extended to the
potential future threshold of one-tenth of the 2-year pre-project
peak flow, or 0.1Q2. The Walnut Creek bioretention + vault
facilities could control flows within the extended range with
minor modifications.
In next steps, CCCWP will work with other Bay Area Permittees,
through the Bay Area Stormwater Management Agencies
Association (BASMAA), to propose appropriate flow-control
criteria and sizing factors to be used during the term of a
reissued Regional Municipal Stormwater NPDES permit. Lessons
learned with regard to facility design details have already been
incorporated into the current 6th edition of the Stormwater C.3
Guidebook.

Dan Cloak Environmental Consulting September 15, 2013 7
1 ∙ Background: Hydrograph Modification Management
1.1 Permit Definitions and Requirements
Provision C.3.g. in the San Francisco Bay Regional Water Quality
Control Board’s Municipal Regional Stormwater Permit (MRP),
titled “Hydromodification Management” (HM), defines HM
projects as those creating or replacing an acre or more of
impervious area, subject to various exclusions. Provision C.3.g.
requires that:
The stormwater discharges from HM Projects shall not
cause an increase in the erosion potential of the receiving
stream over the pre-project (existing) condition. Increases
in runoff flow and volume shall be managed so that post-
project runoff shall not exceed estimated pre-project rates
and durations, where such increased flow and/or volume
is likely to cause increased potential for erosion of creek
beds and banks, silt pollutant generation, or other
adverse impacts on beneficial uses due to increased
erosive force.
Specific requirements for design of HM controls are:
For Alameda, Contra Costa, San Mateo, and Santa Clara
Permittees, HM controls shall be designed such that post-
project stormwater discharge rates and durations match
pre-project discharge rates and durations from 10 % of
the pre-project 2-year peak flow up to the pre-project 10-
year peak flow. For Fairfield-Suisun Permittees, HM
controls shall be designed such that post-project
stormwater discharge rates and durations shall match
from 20 percent of the 2-year peak flow up to the pre-
project 10-year peak flow. Contra Costa Permittees, when
using pre-sized and pre-designed Integrated Management
Practices (IMPs) per Attachment C of this Order, are not
required to meet the low-flow criterion of 10% of the 2-
year peak flow. These IMPs are designed to control 20%
of the 2-year peak flow. After the Contra Costa Permittees
conduct the required monitoring specified in Attachment
C, the design of these IMPs will be reviewed. Nearly identical requirements for new development projects
appear in the 2010 East Contra Costa County Municipal NPDES
Permit issued by the California Regional Water Quality Control
Board for the Central Valley Region.
In the MRP, the referenced Attachment C specifies:

Dan Cloak Environmental Consulting September 15, 2013 8
The Program shall monitor flow from Hydrograph
Modification Integrated Management Practices (IMPs) to
determine the accuracy of its model inputs and
assumptions. Monitoring shall be conducted with the aim
of evaluating flow control effectiveness of the IMPs. The
Program shall implement monitoring where feasible at
future new development projects to gain insight into
actual versus predicted rates and durations of flow from
IMP overflows and underdrains.
At a minimum, Permittees shall monitor five locations for
a minimum of two rainy seasons. If two rainy seasons are
not sufficient to collect enough data to determine the
accuracy of model inputs and assumptions, monitoring
shall continue until such time as adequate data are
collected.
Permittees shall conduct the IMP monitoring as described
in the IMP Model Calibration and Validation Plan in
Section 5 of this Attachment. Monitoring results shall be
submitted to the Executive Officer by June 15 of each
year following collection of monitoring data. If the first
year’s data indicate IMPs are not effectively controlling
flows as modeled in the HMP, the Executive Officer may
require the Program to make adjustments to the IMP
sizing factors or design, or otherwise take appropriate
corrective action. The Permittees shall submit an IMP
Monitoring Report by August 30 of the second year of
monitoring. The IMP Monitoring Report shall contain, at a
minimum, all the data, graphic output from model runs,
and a listing of all model outputs to be adjusted, with full
explanation for each. Board staff will review the IMP
Monitoring Report and require the Program to make any
appropriate changes to the model within a 3-month time
frame.
Section 4 of MRP Attachment C states in part:
Monitoring shall be conducted with the aim of evaluating
flow control effectiveness of the IMPs. The IMPs were
redesigned in 2008 to meet a low flow criterion of 0.2Q2,
not 0.1Q2, which is current HMP standard for Contra
Costa County. The Program shall implement monitoring
at future new development projects at a minimum of five
locations and for a minimum of two rainy seasons to gain
insight into actual versus predicted rates and durations
of flow from IMP overflows and underdrains. If two rainy
seasons are not sufficient to collect enough data to

Dan Cloak Environmental Consulting September 15, 2013 9
determine the accuracy of model inputs and
assumptions, monitoring shall continue until such time
as adequate data are collected….
….The principal use of the monitoring data shall be a
comparison of predicted to actual flows. The Dischargers
shall ensure that the HSPF model is set up as it was to
prepare the curves in Attachment 2 of the HMP, with
appropriate adjustments for the drainage area of the IMP
to be monitored and for the actual sizing and
configuration of the IMP. Hourly rainfall data from
observed storms shall be input to the model, and the
resulting hourly predicted output recorded. Where sub-
hourly rainfall data are available, the model shall be run
with, and output recorded for, 15-minute time steps.
The Dischargers shall compare predicted hourly outflows
to the actual hourly outflows. As more data are gathered,
the Dischargers may examine aggregated data to
characterize deviations from predicted performance at
various storm intensities and durations.
Because high-intensity storms are rare, it will take many
years to obtain a suitable number of events to evaluate
IMP performance under overflow conditions. Underdrain
flows will occur more frequently, but possibly only a few
times a year, depending on rainfall and IMP
characteristics (e.g., extent to which the IMP is oversized,
and actual, rather than predicted, permeability of native
soils). However, evaluating a range of rainfall events that
do not produce underflow will help demonstrate the
effectiveness of the IMP.
Similar, but less detailed, requirements were incorporated into
RWQCB Order R2-2006-0050, whereby the San Francisco Bay
Regional Water Quality Control Board (Water Board) adopted
Contra Costa’s HMP in 2006. That Order was superseded by the
MRP.
1.2 Hydromodification, Control Methods, and Measurements
1.2.1 Hydromodification and Stream Erosion
The following brief summary of factors affecting stream erosion
was included in the HMP Work Plan submitted in November
2004. Subsequent research has upheld these points.
Contra Costa streams are subject to a myriad of
influences, and it is typically difficult, if not impossible,

Dan Cloak Environmental Consulting September 15, 2013 10
to generalize regarding causes and effects across the
entire County. Further, it is often difficult to attribute any
particular observed condition in a specific stream to only
one proximate cause. In general, it is necessary to
consider many potential causes and to consider their
relative significance. For example, Riley (2002) attributes
the incision of stream channels in the Bay Area over the
past 100 years primarily to climate changes and earth
movement, while noting that incision may be induced
accelerated by land use change as well.
As an illustration of the interaction of these influences,
consider the stream equilibrium equation identified by
Lane (1955).
(Sediment load × sediment size) α (slope × discharge)
A change in any one of these four factors may contribute
to disequilibrium (net erosion or deposition stream
sediments) and consequent changes in channel width
and depth.
Sediment load may increased by earth movement
(e.g., geologic uplift and mass wasting), land
disturbance (e.g., agriculture, road construction),
or loss of vegetation, or may be decreased by land
development (e.g., paving, terracing), by dams, or
by dredging.
Sediment size may be affected by changed balance
among different sediment loads (and the erosion
of different geologic strata), by dams, or by in-
stream mining.
Stream slopes are often increased by
straightening (removal of meanders), or may be
increased or decreased by the placement of
downstream culverts or grade controls.
Finally, stream discharge, and particularly
rainfall/runoff relationships, may be increased by
deforestation, agriculture, and other land use
changes, prior to and including urbanization, or
may be decreased by dams and diversions.
The above considerations address only system-wide
instabilities, those that are in effect over a long reach or
series of reaches. Bank erosion at specific sites may be
related to the presence or absence of vegetation and to

Dan Cloak Environmental Consulting September 15, 2013 11
localized channel conditions (e.g., placement or removal
of woody debris or riprap upstream or downstream).
1.2.2 Criteria for Control of Runoff Flows from Development Projects
Notwithstanding the complexity of factors affecting stream
erosion, and the watershed scale at which those factors interact,
California’s nine Regional Water Quality Control Boards (Water
Boards) have focused on controlling increased flows and
durations from individual development sites.
The nine Water Boards have adopted a variety of criteria, using a
mix of methodologies and engineering methods, to regulate land
development.
Some Water Boards use the estimated peak flow or volume
resulting from a specific storm event (“design storm”) as a
criterion. Examples of “design-storm” based criteria follow:
No increase in the predevelopment 2-year peak flow
(Orange County and the statewide Phase II permit for
small municipalities)
No increase in runoff volume resulting from the 85th
percentile storm or 95th percentile storm, depending on
development project location (Central Coast Region)
No increase in 2-year peak flow or peak duration or
increase in runoff volume from the 85th percentile storm
(North Coast Region)
Criteria required by other Water Boards involve an analysis of
rainfall and runoff over 30 years or more. This continuous
simulation approach is discussed in Section 2 below. To
determine whether the criteria are met, an hourly rainfall record
of 30 years or more is used. Hourly runoff volumes are estimated
using a continuous-simulation model applicable to the
development site. Runoff is simulated in the pre-project
condition and in the post-project condition with proposed IMPs
or other flow-control facilities.
The pre-project and post-project runoff statistics are compiled to
compare the duration of simulated flow at each flow rate, from
rare high flows to more frequent low flows.
The post-project flow durations must be equal to or less than the
pre-project flow durations for flows within a specified range.
The Water Boards have required different ranges to be used. The
basis for setting different ranges is, ostensibly, that different
streams have different thresholds of flow at which their beds or

Dan Cloak Environmental Consulting September 15, 2013 12
banks may be eroded and the resulting sediment transported
downstream. However, in fact, the ranges are often applied to all
the stream segments on all the streams in a whole city or even
an entire county.
The lower limit of the range is more critical to facility design. The
lower limit is commonly expressed as a fraction of the 2-year
pre-project peak runoff flow (Q2). Here are some low-flow
thresholds currently mandated by the various Water Boards:
Sacramento-area municipalities: 0.25Q2 or 0.45Q2
San Diego County municipalities: 0.1Q2, 0.3Q2, or
0.5Q2, depending on receiving channel material and
dimensions.
Cities of Fairfield and Suisun City: 0.2Q2
Santa Clara, Alameda, and San Mateo Counties: 0.1Q2
Contra Costa County: 0.2Q2 when applied to specified
IMPs.
1.3 LID and HM
The California Ocean Protection Council describes Low Impact
Development (LID) as a
… stormwater management strategy aimed at
maintaining or restoring the natural hydrologic functions
of a site to achieve natural resource protection objectives
and fulfill environmental regulatory requirements; LID
employs a variety of natural and built features that
reduce the rate of runoff, filter pollutants out of runoff,
and facilitate the infiltration of water into the ground…
…LID design detains, treats and infiltrates runoff by
minimizing impervious area, using pervious pavements
and green roofs, dispersing runoff to landscaped areas,
and routing runoff to rain gardens, cisterns, swales, and
other small-scale facilities distributed throughout a site.
LID was first developed as a comprehensive stormwater
management strategy by Prince Georges County (1999). The
hydrologic approach is described as follows:
The LID approach attempts to match the predevelopment
condition by compensating for losses of rainfall
abstraction through maintenance of infiltration potential,
evapotranspiration, and surface storage, as well as
increased travel time to reduce rapid concentration of
excess runoff.

Dan Cloak Environmental Consulting September 15, 2013 13
In essence, LID seeks to address potential hydrologic impacts of
land development by maintaining and restoring site
characteristics and conditions at the smallest scale possible.
Priority is placed on reducing runoff by limiting impervious
surfaces, then on dispersing runoff to landscape within a site,
and finally by directing runoff to small-scale facilities integrated
into the landscape.
In contrast, HM attempts to address hydrologic impacts of land
development at a watershed scale. Flow criteria are developed for
streams draining the watershed, and those criteria are then
translated to criteria for development of sites draining to the
watershed. (In the case of the San Francisco Bay Water Board’s
approach, criteria developed for flows within selected reaches of
three streams in Santa Clara County were applied to all Bay
Area development sites directly and without further analysis.)
LID promotes a multiplicity of approaches and promotes “green”
urban development, while HM specifies that runoff discharges
adhere to a specified hydraulic regime.
The HM criteria adopted by the San Francisco Bay Water Board
specify the use of flow duration control basins, and require “HM
controls shall be designed such that post-project stormwater
rates and durations match pre-project discharge rates and
durations….” In flow duration control basins, this “match” is
achieved through the sizing and placement of orifices draining a
basin. Cost-effectiveness and operational considerations favor
larger basins (the opposite of LID’s small-scale approach).
Indeed, the MRP allows compliance through the use of regional-
scale flow-duration control basins.
1.4 CCCWP Approach to HM
CCCWP committed to implementing LID beginning in 2003, and
published the first edition of the Stormwater C.3 Guidebook
(Guidebook), emphasizing LID design, in 2004. Faced with the
San Francisco Bay Water Board’s subsequent emphasis on HM,
as opposed to LID, CCCWP sought a way for local developers to
meet the HM criteria by using LID. This was accomplished by
creating designs for LID IMPs that can also demonstrably meet
HM criteria.
CCCWP guidance for HM compliance is incorporated in the
Guidebook. The Guidebook is referenced in stormwater
ordinances adopted by each Contra Costa municipality.

Dan Cloak Environmental Consulting September 15, 2013 14
The Guidebook provides applicants for HM projects the following
options for HM compliance. The options also appear in MRP
Attachment C:
1. Demonstrate there is no increase in impervious area.
2. Use the HM IMPs in the Guidebook.
3. Use a continuous simulation model and a rainfall record
of at least 30 years to show estimated post-project runoff
durations and peak flows do not exceed pre-project
durations and peak flows.
4. Show that there is a low risk of downstream erosion
because all downstream channels are pipes, hardened
channels, subject to tidal action, or aggrading, or that a
channel restoration project will be constructed that takes
the post-project flows into account.
For Option 2, the Guidebook incorporates sizing factors that land
development engineers may use to determine the minimum
required dimensions of a variety of IMPs. The land development
engineer divides the development site into discrete Drainage
Management Areas (DMAs), determines
the amount of equivalent impervious
area within each DMA, and uses the
Guidebook sizing factors to calculate
minimum values for the following
parameters for an IMP serving that
DMA:
area, A
surface storage volume, V1
subsurface storage volume V2
See Figure 1-1. The land development
engineer then shows how, for each
DMA, the IMP meets or exceeds
minimum values for each parameter.
1.4.1 Bioretention HM Facilities
Bioretention facilities are the most commonly used IMPs on
Contra Costa development projects. They are typically
constructed for runoff treatment and to maximize retention of
runoff via evapotranspiration and infiltration, but the design is
adapted to also provide HM. Bioretention facilities work as
follows:
Figure 1-1. A, V1, and V2. Note V2 is the free volume; gravel volume is multiplied by porosity

Dan Cloak Environmental Consulting September 15, 2013 15
Runoff enters the bioretention facility via sheet flow or pipes and
is detained in a shallow surface reservoir. The reservoir also
serves to spread runoff evenly across the facility surface. Runoff
then percolates through an engineered soil (sand/compost mix).
Some runoff is retained in soil pores and plant roots and is
subsequently evapotranspirated. Runoff that exceeds the
moisture-holding capacity of the soil percolates through the soil
layer and enters a subsurface storage layer (typically gravel). The
treated runoff subsequently then infiltrates into the soils below
the facility. If runoff enters the gravel layer more rapidly than it
infiltrates, the saturation level in the gravel layer rises until it
reaches the discharge elevation for a perforated pipe underdrain.
When this occurs, runoff will also discharge through the
perforated pipe underdrain to a discharge point (typically
connected to the municipal storm drain system). In general, this
discharge will occur rarely—a few times per year, or even once in
many years.
In facilities constructed for HM, this perforated pipe underdrain
is equipped with a flow-limiting orifice. This allows the
bioretention facility to act like a flow duration control basin
during the infrequent occasions when the storage layer fills, and
as a LID facility at other times.
The surface reservoir is also equipped with an overflow that will
become active under either of two scenarios: (1) runoff enters the
surface reservoir more rapidly than it percolates through the
engineered sand/compost mix, and the surface reservoir fills to
its maximum volume or (2) runoff enters the facility more rapidly
than it leaves via both infiltration to the soils below the facility
and discharge via the underdrain, and this continues until the
gravel and soil layers become fully saturated, and the surface
reservoir fills to its maximum volume.
In summary, a bioretention facility receives runoff from a specific
delineated area, retains that runoff via infiltration and
evapotranspiration, and discharges excess runoff via an
underdrain and an overflow.
1.4.2 Variations of Bioretention Facilities for HM
The Guidebook includes criteria and sizing factors for three
design variations:
1. The Flow-through Planter, which can be built above
ground or other locations where infiltration to native soils
cannot be allowed.

Dan Cloak Environmental Consulting September 15, 2013 16
2. Bioretention + Vault, which includes surface storage and
engineered soil, but provides for subsurface storage V2 in
a separate structure rather than a subsurface gravel
layer.
3. Cistern + Bioretention, which allows for upstream runoff
storage V1 in a tank or basin; runoff is then metered
through an orifice to be treated in a bioretention facility.
As described in Section 4, this model calibration and validation
project included monitoring of Bioretention + Vault facilities as
well as bioretention facilities.
The Guidebook also includes design criteria and sizing factors for
“direct infiltration” facilities, that is, facilities designed to
infiltrate runoff directly, without first routing it through a soil
layer to remove pollutants. These design criteria and sizing
factors for “direct infiltration” can be used to design infiltration
basins, infiltration trenches, and dry wells. This model
calibration and validation project did not include “direct
infiltration” facilities.
2 ∙ Model Representation of Hydrologic Performance
A project team comprising hydrologists and engineers from Philip
Williams & Associates and Brown & Caldwell developed the
continuous simulation model that is the subject of this model
verification and calibration project. The work was done during
2004-2005. The modeling results formed the basis for the
designs and sizing factors proposed in the CCCWP’s Hydrograph
Modification Management Plan (HMP), submitted to the Water
Board in May 2005 and approved by the Water Board, with
minor changes, in July 2006.
In 2009, Brown and Caldwell used the same continuous
simulation model—with the same input parameters and
assumptions—to create sizing factors for new IMP designs. The
new IMP designs and sizing factors were incorporated into an
addendum to the 4th Edition of the Stormwater C.3 Guidebook,
and subsequently carried forward through the 5th and 6th (most
recent) Guidebook edition.
The model was created in HSPF (Hydrologic Simulation Program
– Fortran). HSPF has a history going back to the 1960s, has
been used and endorsed by USEPA, and has been embraced in
many parts of the US for evaluation and design of the hydrologic
impacts of new developments. The Western Washington
Hydrologic Model (WWHM) consists of an HSPF-based simulation
and a user interface, as does the Bay Area Hydrology Model

Dan Cloak Environmental Consulting September 15, 2013 17
(BAHM) currently used in Alameda, Santa Clara, and San Mateo
Counties. Because HSPF is widely used, there is a significant
body of literature and a community of practitioners to support
use of the model in HSPF applications.
In HSPF, the various hydrologic processes are represented as
flows and storages. Each flow is an outflow from a storage,
which, at each time step, is typically a function of the storage
volume at that time step and the physical characteristics of the
storage. For undeveloped watersheds, HSPF models the
movement of water along three paths: overland flow, interflow,
and groundwater flow. A variety of storage zones are used to
represent storage that occurs on the land surface and in the soil
horizons.
The continuous-simulation model was developed and used to
demonstrate that, with the inclusion of appropriately sized IMPs
in a development project, increases in runoff flow and volume
are managed so that post-project runoff does not exceed
estimated pre-project rates and durations.
This requires that the model generate representation of pre-
project flows at each time step over a long period, as well as
post-project flows at each time step during that same period. It
is then possible to make statistical cumulative comparisons of
the two sets of generated data.
To develop the model, the consultant team:
Characterized pre-project runoff peaks and durations for
a range of soil groups, vegetation, and rainfall patterns
characteristic of Contra Costa County development sites.
Modeled outflow peaks and durations from several IMP
designs (based on a unit area of new impervious surface
draining to the IMP).
Compared modeled pre-project flows to modeled post-
project-with-IMP flows, using conservative assumptions.
Developed calculations for sizing factors for each IMP
associated with each pre-project condition.
To model the IMPs, the project team constructed representations
of each IMP in HSPF. For example, a bioretention facility is
represented in HSPF by length, cross-section geometry, layers of
soil and underdrain material, and transmissivity of underlying
soils.

Dan Cloak Environmental Consulting September 15, 2013 18
3 ∙ Model Verification and Calibration Project Design
This project compared model-predicted hydrologic performance
to actual hydrologic performance for five facilities at two test
sites.
3.1 Steps for Model Verification and Calibration
The experimental design of this project can be summarized as
follows:
1. Create a customized version of the HSPF model for each
test facility and its corresponding tributary area to
continuously simulate inflow, infiltration,
evapotranspiration, and underdrain discharge for that
test facility. The customized versions use the same values
as the 2004-2005 model for soil permeability and
bioretention planting soil characteristics, and facility-
specific values for the tributary drainage area size and
runoff factors and for facility dimensions.
2. Measure rainfall at each test site at each time increment.
3. Input site rainfall data, and use the model to predict, for
each time increment, the rates and volumes of inflow,
infiltration, evapotranspiration and underdrain discharge
for each test facility, as well as storage within each
component of the facility.
4. Directly measure the underdrain discharge for each
facility at each time increment. (Also, for three of the test
facilities, the saturation level in the gravel layer was
measured at each time increment.)
5. Compare predicted to measured flows and storage.
6. Adjust the previously assumed model parameter values
so that predicted flows and storage more closely
approximate measured flows and storage at each time
increment (that is, calibrate the model).
3.2 Evaluation of Sizing Factors
The procedure for calculating sizing factors, previously
implemented in 2004-2005 and again in 2009, was used with
the now-calibrated model to evaluate whether the current sizing
factors for bioretention and bioretention + vault facilities are
adequate.

Dan Cloak Environmental Consulting September 15, 2013 19
Long-term hourly rainfall records from two of the same rain
gauges previously used for calculating the sizing factors were
input into one of the calibrated site-specific models to examine
whether the facility met regulatory criteria.
This procedure was completed for two regulatory scenarios:
1. For a low-flow criterion of 0.2Q2, as specified under the
MRP adopted in 2009.
2. For a low-flow criterion of 0.1Q2.
Results are in Section 6.
4 ∙ Project Test Facility Characteristics and Parameters
The CCCWP sought to identify development projects with the
following characteristics (Cloak, 2009):
One or more facilities (bioretention, flow-through planter,
bioretention + vault, or cistern + bioretention).
Facilities must include an underdrain (as required on
sites where native soils are in Hydrologic Soil Groups “C”
or “D”).
Clearly defined and accurately sized Drainage
Management Areas.
Facilities designed according to the criteria in the
Guidebook 4th Edition, including documentation and
calculations of minimum and provided bioretention
surface area, surface storage volume, diameter of circular
orifice, and subsurface storage volume.
Arrangements/permissions to work with the project
contractor and inspector to document and verify
construction of the facilities.
24-hour access and permission from site owner to access
facilities to maintain monitoring equipment.
Above-ground location to mount a datalogger, rain gauge,
and telemetry.
There were five test facilities at two test sites. Three bioretention
facilities were monitored at the Pittsburg Fire Prevention Bureau
Building, and two bioretention + vault facilities were monitored
at Walden Park Commons, a 65-unit townhouse development in
Walnut Creek.

Dan Cloak Environmental Consulting September 15, 2013 20
4.1 Pittsburg Fire Protection Bureau Building
4.1.1 Site Description
The Pittsburg Fire Protection Bureau Building is located at 2329
Loveridge Road in Pittsburg. Total project site area is 1.09 acres.
The site is nearly flat. A single-story building of about 19,000
square feet houses offices of the Contra Costa Fire Protection
District. There is an accompanying parking lot with 35 spaces
and a trash enclosure. The site includes landscaping around the
building, around the perimeter of the site adjacent to Loveridge
Road and Loveridge Circle, and in parking medians. The project
was constructed during 2011.
As originally designed, the project included a paved overflow
parking area. With this area, the total new impervious surface
exceeded one acre. The City of Pittsburg required HM compliance
for the project. In later revisions to the project scope, the
overflow parking area was left graveled
rather than paved and the total new
impervious area was reduced to 26,457
square feet.
4.1.2 Pre-Project Condition and Site Soils
Figure 4-1 shows the site in its pre-project
condition. As can be seen in the photo,
the site was previously undeveloped;
however, it had been used for parking and
perhaps as a construction staging area.
Borings on the site were taken in 2004. According to the report
by Kleinfelder (2004), subsurface soils “consisted predominantly
of stiff to hard, moderately to highly plastic silty clays, extending
to depths ranging from about 4 to 14 feet below existing site
grade.” This covers the range of depths at the bottom of the
bioretention facilities. Surface soils were found to have high
shear strength and be highly plastic, as indicated by Atterberg
Limits: a Liquid Limit of 59% and a corresponding Plasticity
Index of 37. This indicates high expansion potential. The shear
strength of the soils is apparent in Figure 4-2.
Boring depths extended as deep as 31 feet, and groundwater was
not encountered.
Figure 4-2. Excavation
of IMP #2 at Pittsburg
Site.
Figure 4-1.
Pittsburg site pre-project

Dan Cloak Environmental Consulting September 15, 2013 21
4.1.3 Drainage Management Areas
The Pittsburg Fire Protection Bureau Building design for
treatment and HM compliance incorporates eight DMAs.
For the model verification project, the
completed site was inspected to verify that
DMA delineation corresponded to site
drainage as built. This included visual
verification of the location of rain gutters and
downspouts. In addition, the parking lot and
grounds were inspected to verify that grade
breaks correspond to the DMA boundaries
shown in the project plans.
See Figure 4-3 and Table 4-1.
DMA 7 is a self-treating pervious graveled
area. DMA 8 consists of driveway and
sidewalk areas that could not be made to drain to treatment
facilities. The remaining six DMAs each drain to a bioretention
facility. Three of these six bioretention facilities were selected to
be monitored as part of this project; these are designated as A2,
A4, and A6 in Table 4-1.
Table 4-1. Pittsburg Fire Protection Bureau Building Facility Dimensions.
Tributary Area Bioretention Facility Dimensions
Landscaped
(SF)
Impervious
(SF)
A (SF) A*
(gravel
layer)
V1
(CF)
Surface
Depth
(in.)
V2
(CF)
Gravel
Depth
(in.)
Orifice
diameter
(In.)
A1 1582 4230 558 558 316 7 379 21 0.51
A2 2415 12059 886 886 874 12 961 33 0.81
A3 0 992 60 72 72 12 72 30 0.21
A4 0 627 67.5 82.5 44 6 44 15 0.17
A5 180 2270 170 195 130 9.5 170 31 0.32
A6 562 3152 340 340 204 6 258 19 0.41
*The gravel layer on some facilities extended beyond the surface dimension due to
installation of a curb that extended only to top of the gravel layer.
Figure 4-3.
Pittsburg site Drainage Management Areas.
A1
A2
A3 A4
A5
A6
6
A7
6
A8
6

Dan Cloak Environmental Consulting September 15, 2013 22
4.1.4 Design of Bioretention Facilities
Each of the three test bioretention facilities was constructed
using the cross section and key features specified in the 4th
Edition of the Guidebook. Some specifications that were new for
the 5th (“MRP”) Edition were incorporated. All three facilities
have:
Surface reservoir depth as required for V1
18-inch depth sand/compost mix
Subsurface reservoir of Class 2 permeable (Caltrans
Specification 68-1.025), as required for V2
Underdrain of PVC SDR 35 perforated pipe
Underdrain discharge orifice
Curb inlets; these are constructed somewhat differently
from the standard 12-inch-wide curb cut and consisted
of pipe sections in the curb face.
Outlet structures consisting of 24" × 36" precast catch
basins; this larger size was to ensure the instrument
technician would be able to enter and access the tipping
buckets located where the underdrain discharges to the
outlet structure.
Monitoring wells, composed of a section of 6-inch PVC
pipe extending vertically through the soil and gravel
layers.
Bioretention facilities A2 and A4 were designed with perimeter
walls. Bioretention facility A6 was designed without perimeter
walls.
A discharge orifice design was
developed for this project; the
design was subsequently
included in the 5th Edition of the
Guidebook. The design
incorporates a solid PVC pipe
extending through the wall of
the outlet structure; the pipe is
fitted with a threaded cap. The
orifice is drilled into the cap.
This allows the cap to be
removed so that the orifice and
pipe can be cleaned if necessary;
it also allows the cap to be Figure 4-4. Underdrain Orifice Detail.

Dan Cloak Environmental Consulting September 15, 2013 23
replaced if the orifice size needs to be adjusted. See Figure 4-4.
As is typical on development sites, the area for some of the IMPs
substantially exceeds the minimum. See Table 4-1. This is done
for constructability. It is often easier and more cost-effective to
build a facility with dimensions that coincide with the available
space (such as a parking median) than to build the additional
walls and other structure necessary to minimize the size of the
IMP.
4.1.5 Construction of Bioretention Facilities
The bioretention facilities were constructed consequent with the
construction of the Fire Protection Bureau Building during 2011.
The facilities were constructed generally as designed. The
following issues were encountered during construction:
The outfall structures had to be constructed deep enough to fit
tipping buckets beneath the underdrain discharge elevation.
Because the site is flat, and because the municipal storm drain
in Loveridge Road is shallow, there was concern that during
storm events flow from the municipal storm drain would back up
into the site storm drains and flood the tipping buckets. To
address this concern, the most downstream on-site drainage
structure (not a bioretention outfall) was fitted with a weir wall
and a pump placed on the upstream side with discharge to the
downstream (municipal storm drain) side. The pump operated
successfully to maintain drainage over the weir wall.
The addition of curbs and widening of curbs for structural
stability resulted in reductions to the surface area of each test
facility. The reduced areas were noted in updated drawings (and
in Table 1) and incorporated into the customized model for each
facility.
Following excavation, the native clay soils at the bottom of each
bioretention facility were “ripped” using the toothed bucket of the
excavator.
4.1.6 Instrumentation
A rain gauge was located on the roof of the trash enclosure.
Each of the three bioretention facilities was equipped with the
following measuring devices:
A tipping bucket, Model TB1L made by Hydrological
Services Ltd., located in the facility overflow structure to
measure flows discharged through the underdrain orifice

Dan Cloak Environmental Consulting September 15, 2013 24
A piezometer, located in a monitoring well
The instruments were connected to a datalogger on the site via
wired connections. Some of the wired connections were strung
through the site storm drains—a notable convenience. The
datalogger was connected via telemetry to the County Flood
Control District’s data system.
4.2 Walden Park Commons
Walden Park Commons is a 65-unit multi-family development on
a 4.59-acre site fronting Oak Road in Walnut Creek. The site is
flat, sloping less than 0.5% away from Oak Road.
4.2.1 Pre-Project Conditions and Site Soils
The site was previously occupied by ten single-family homes with
pools, sheds, and associated driveways. These accounted for
74,000 square feet (1.7 acres) of pre-project impervious area.
A geotechnical study of the site (Korbmacher Engineering, 2006)
found site soils were native to the site (that is, not fill), and that
soils “consisted of a medium stiff to very stiff silty clay and sandy
clay.” The near-surface soils have moderate expansion potential.
The Korbmacher report indicates groundwater was encountered
in borings at a range of 7 to 11 feet below existing grade.
4.2.2 Drainage Management Areas
The applicant was required to ensure all site impervious surfaces
drain to LID treatment. The applicant was allowed to size and
design bioretention facilities for “treatment only” for new
impervious areas equivalent to the pre-project impervious area.
For the remainder of the site
(corresponding to the
increase in impervious area
as a result of the project), the
applicant was required to
provide both treatment and
HM control. See the
CCCWP’s “Guidance on Flow
Control for Development
Projects on Sites that are
Already Partially Developed,”
(March 2009).
The site was divided into
North, Central, and South
areas, with the Central area
Figure 4-5.
Walden Park Commons Storm Drainage Areas

Dan Cloak Environmental Consulting September 15, 2013 25
being routed to treatment-only bioretention facilities. See Figure
4-5. The Central area DMAs and treatment facilities are not
considered further in this report.
The North Area is divided into eight DMAs. There are six
impervious DMAs totaling 33,301 square feet of impervious roof
and driveway, and two landscaped DMAs with 5,948 square feet
of pervious area.
The South Area is divided into 19 DMAs. There are 14
impervious DMAs with 36,257 square feet of impervious area,
and five landscaped DMAs with 7,495 square feet of pervious
area.
All DMAs in the North and South Areas were drained to
bioretention facilities. Landscaped DMAs were assigned a runoff
factor of 0.7 as specified in the 2005 HMP; that is, landscaped
areas were assumed to be 70% impervious. Roofs and paved
areas were assumed to be 100% impervious.
4.2.3 Design of Bioretention Facilities
A sizing factor of 0.04 was applied to the resulting equivalent
impervious area. Bioretention facilities were sized to exceed this
minimum.
Key characteristics of the bioretention facilities are:
18 inches of sand/compost mix
Class 2 permeable drainage layer
Overflow constructed of vertical ADS pipe, cut to design
height
6-inch perforated pipe underdrain
Overflow and underdrain connected to large-diameter
storage pipe

Dan Cloak Environmental Consulting September 15, 2013 26
The bioretention facilities are located between the site’s loop road
and the site perimeter fence and are generally configured as
linear swales. According to construction drawings, the bottom of
the excavation was sloped toward a central line running the
length of the swale. The gravel (Class 2 permeable) layer is
likewise sloped. The
upstream sections do not
have underdrains; the most
downstream section of the
bioretention facilities (near
the rear of the development)
includes a perforated pipe
underdrain See Figure 4-6.
This configuration allows
runoff to infiltrate over
much of the bioretention
facility area; however,
runoff pooling in the gravel
layer of the most
downstream section will tend to enter the underdrain pipe rather
than infiltrate.
4.2.4 Design of Downstream Storage
The underdrain/overflow from the bioretention facilities is routed
to common storage facilities—one for the North Area and one for
the South Area. The storage consists of reinforced concrete pipe
of 30" and 42" diameter set at a slope of 0.005. This information
was used to establish stage-storage relationships within the
model (See Section 6.)
The concrete pipe storage facility is sealed, preventing
exfiltration to the Class A/B backfill material around the pipes
and eliminating the opportunity for subsequent infiltration to the
native soils around and beneath the storage pipe. This is a
significant variance from the design intent for Bioretention +
Vault facilities. The Guidebook design detail for Bioretention +
Vault shows a chamber with an open bottom.
The storage pipes for the North Area and South Area each
discharge into concrete vaults at the rear of the development.
Each vault is equipped with a weir wall. A pipe through each
weir wall conveys metered flows. Each of these pipes is equipped
with a PVC pipe and threaded cap. An orifice drilled into the cap
meters flows.
Figure 4-6. Configuration of Walden Park Commons Bioretention Facilities

Dan Cloak Environmental Consulting September 15, 2013 27
Should either of the storage pipes become full, flows would
overtop the corresponding weir wall. Downstream of the weir
walls, the vaults discharge to the City of Walnut Creek storm
drain system.
4.2.5 Construction of Facilities
Drainage facilities were constructed, along with most of the
townhouses, during 2011. The following were noted following
construction:
Because the bioretention facilities were designed without a hard
delineation of their perimeter (that is, they slope seamlessly to
surrounding landscaping), it is difficult to visually discern their
areal extent. The facilities were surveyed post-construction to
confirm the floodable area (that is, the area that lies below the
overflow height) corresponded to the areas shown in the
descriptions and calculations submitted by the applicant.
Data from the initial storm showed vault outflows began soon
after the beginning of a rain event, the facilities were inspected
for construction errors that might cause short-circuiting. It was
found that the overflow pipe risers had been constructed with
perforated pipe, which could have allowed ponded runoff to enter
the overflow rather than percolating through the soil/compost
mix layer. This was corrected on March 6, 2012.
4.2.6 Instrumentation
Because the bioretention areas were routed to common detention
vaults, the total area tributary to the vault is relatively large, and
the allowable discharge rate is correspondingly large. To
illustrate, the 0.1Q2 discharge from the North and South Areas
at Walden Park Commons is 0.07 and 0.08 cfs, respectively,
compared with 0.02 cfs for the largest of the bioretention
facilities (Facility A2) at the Pittsburg Fire Protection Bureau
Building. The larger flow rates allowed the use of electromagnetic
flow meters (“magmeters”) rather than tipping buckets. Model
#EX 81P-40 by Seametrics was selected. The correspondingly
larger orifice sizes (over an inch) also helped alleviate concerns
about potential orifice clogging.
The magmeters were installed in 1.5" diameter sections of pipe
extending upstream of the orifice discharge and through the
weir.
The selected magmeter sensors generate a frequency range from
0 – 550Hz over a velocity range of 0.28 – 20 feet per second

Dan Cloak Environmental Consulting September 15, 2013 28
respectively. This frequency was sampled by the data logger
every 15 minutes and velocity was calculated from frequency.
A rain gauge was located in the central courtyard of the
development.
The data was transmitted every half hour to a County mountain
top repeater and to the office base station where the entire data
base is maintained.
5 ∙ Data Collection and Review
Instrumentation and telemetry were established in September
2011 and maintained through May 2013. The instrumentation
was operating for all storms during this period. Following is a list
of occurrences that affected data collection.
5.1 Exceptions Affecting Data Collection—Pittsburg
5.1.1 Tips When Piezometer Levels Show No Outflow
During each sizable storm, tipping buckets recorded a single tip
although piezometer levels indicated the saturation level in the
gravel layer had not reached the height of the underdrain. These
tips could have been caused by small amounts of runoff entering
the underdrain rather than percolating through the unsaturated
gravel layer, or by rain falling directly into the tipping bucket.
5.1.2 Data Loss on October 22, 2012
Data for a storm on this date showed very high flows entering
the tipping bucket for IMP #2. On examination of the data, it was
determined that the recorded flows were outside the range of the
tipping buckets ability to record. On further investigation, it was
determined that moisture had caused wired connections between
the tipping buckets and the datalogger to short-circuit. The
wired connections were insulated with silicone rubber sealer.
The erroneous data was taken out of the data base at that time.
5.2 Exceptions Affecting Data Collection—Walden Park
5.2.1 Construction Error on Overflow Risers
As noted above, a construction error may have allowed short-
circuiting of flows during storms prior to March 6, 2012.
5.2.2 Cut-out at High Flows
It was noted that data for some events showed flows rising
following the onset of rain, suddenly dropping to zero, and then

Dan Cloak Environmental Consulting September 15, 2013 29
resuming with a falling limb as the storage pipe drained. On
investigation it was determined the most likely cause was
turbulent flow within the discharge pipe.
As a backup method of measuring flows, on January 17, 2013
level sensors were installed in the discharge vault. Also at this
time two feet of linear pipe was installed upstream of the
magmeters. It was planned to correlate the water levels and
measured flows to establish a rating curve and to use the rating
curve to estimate flows during intervals when the flow sensor
was not registering. However, there were not enough subsequent
storms to establish the rating curve, and no subsequent flows
were high enough to cause recurrence of the problem.
5.3 Data Review and Consistency Check
Data were reviewed for internal consistency and consistency with
expectations and visual observations. The following were noted:
Rainfall data was consistent with observed events and
other rain gauge data collected by the District.
Saturation levels in the Pittsburg bioretention facilities
rose to relative levels consistent with rainfall depths and
with facility sizing.
Discharge measured at the Walden Park facilities was
recorded at relative flows consistent with rainfall
intensity and depths.
In summary, the data collected covered most but not all storm
events during the monitoring period. In addition, the 2-year
monitoring period corresponded to a time of relatively few rainfall
events, and smaller rainfall events, compared with long-term
averages. There were no events intense enough to cause overflow
of bioretention facility surface reservoirs at either site, or with
enough intensity and volume to cause underdrain discharge at
the Pittsburg facilities.
However, the data collected are sufficient for comparison of
facility performance with the performance predicted by the
model. See Section 6.
6 ∙ Analysis and Results
This section describes the modeling and data analysis methods
that were used together to characterize the performance of the
Pittsburg and Walden Park Commons IMPs. This section
contains the following details:

Dan Cloak Environmental Consulting September 15, 2013 30
Evaluation of rain gauge data for the monitoring period
and a comparison of monitored storm events to long-term
rainfall statistics for the area.
Evaluation of IMP monitoring data and the potential
implications of the hydraulic characteristics on long-term
IMP performance.
Comparison of HMP model results and IMP monitoring
data.
Description of model parameter adjustments to produce
closer agreement between the model outputs and IMP
monitoring data.
Discussion of the current IMP sizing factors and their
adequacy for meeting the NPDES permit’s flow duration
control standard.
Additional modeling and analysis details are contained in
Appendix A.
6.1 Comparison of Simulated and Recorded Data
6.1.1 Storm Characteristics
Rainfall accumulations for the 2011-12 and 2012-13 monitoring
periods were examined to determine how the monitoring period
compares to long-term trends in the Pittsburg and Walnut Creek
areas. The purpose of this analysis was to assess whether the
monitored storms are representative for the area and whether
the storms produced enough rain to adequately characterize the
long-term performance of the IMPs at the Fire Prevention Bureau
Building in Pittsburg and Walden Park Commons in Walnut
Creek.
For the Pittsburg site, the closest rain gauge with a long-term
record is Los Medanos, which is located between Pittsburg and
Antioch. For Walnut Creek, the closest representative rainfall
gauge with a long-term record is the FCD11 gauge located in
Martinez.
Table 6-1 shows the seasonal rainfall totals at each project rain
gauge and the long-term seasonal averages at the Los Medanos
and Martinez gauges. At Pittsburg, the total rainfall was 13
percent below average for the first monitoring season and about
average for the second season. At Walden Park Commons, the
rainfall was 5 percent below average for the first monitoring
season and 24 percent below average for the second season.

Dan Cloak Environmental Consulting September 15, 2013 31
Table 6-1. Seasonal Rainfall Totals
Pittsburg Fire Prevention Bureau
Season Dates Project Site Rainfall (in)
Los Medanos Avg. Rainfall (in)
Difference
1 Oct-2011 – Apr-2012
6.84 7.85 -13%
2 Sept-2012 – May-2013
8.14 8.20 -1%
Walden Park Commons
Season Dates Project Site Rainfall (in)
Martinez Avg. Rainfall (in)
Difference
1 Nov-2011 – Apr-2012
17.19 18.05 -5%
2 Sept-2012 – May-2013
14.69 19.31 -24%
Even though the total rainfall was less than average over the
monitoring period, there were several significant events during
each season. Table 6-2 and Table 6-3 list the 10 and 13 largest
rainfall events that were recorded during the monitoring period
at the Fire Prevention Bureau and Walden Park Commons,
respectively. The Walden Park Commons list was expanded to
capture three events for which both outflow rates and storage
pipe levels were recorded. The “recurrence” column in the two
tables refers to how often a storm of similar magnitude would be
expected to occur, based on the long-term rainfall data. Depth-
duration-frequency curves were developed for the Los Medanos
and Martinez sites for this analysis.

Dan Cloak Environmental Consulting September 15, 2013 32
Table 6-2. Pittsburg Fire Prevention Bureau Site Storm Events
Start Date Duration (hours) Total (in) Recurrence (12-hr)
1/19/2012 90 1.45 3-month
3/15/2012 49 0.66 3-month
3/24/2012 13 0.65 3-month
4/12/2012 40 1.20 3-month
10/22/2012 26 0.51 <3-month
11/21/2012 9 0.45 <3-month
11/28/2012 56 1.64 2-year
12/1/2012 17 1.12 1-year
12/21/2012 46 1.00 3-month
12/25/2012 14 0.50 3-month
Table 6-3. Walden Park Commons Site Storm Events
Start Date Duration (hours) Total (in) Recurrence (12-hr)
1/19/2012 95 3.51 1-year
2/29/2012 36 1.01 <3-month
3/13/2012 109 2.59 3-month
3/24/2012 17 1.03 3-month
3/27/2012 16 0.89 <3-month
4/10/2012 79 2.81 3-month
11/20/2012 11 0.92 3-month
11/29/2012 69 4.64 2-year
12/21/2012 69 2.32 3-month
12/25/2012 24 0.79 <3-month
2/19/2013 9 0.34 <3-month
3/30/2013 36 0.76 <3-month
4/4/2013 8 0.29 <3-month
The number of significant storm events during the monitoring
period is very consistent with the long-term local rainfall record.
For example, there were 8 events that exceeded the 3-month
recurrence (for 12-hour rainfall accumulations) at the Fire
Prevention Bureau site and 7 events surpassing this threshold at
the Walden Park Commons site. This is important, because 3-
month storm events would be expected to produce flow rates
that approach the lower control threshold flow rate in the
County’s current NPDES permit (two-tenths of the two-year flow
rate, or 0.2Q2). Additionally, the Fire Prevention Bureau and
Walden Park Commons sites both experienced 2 rainfall events
that were larger than the 1-year (12-hour) storm. In conclusion,
the monitoring period included enough storms across a range of

Dan Cloak Environmental Consulting September 15, 2013 33
intensities and total accumulations to adequately demonstrate
how the IMPs perform.
6.1.2 Observed IMP Performance Characteristics
For each significant storm event, IMP monitoring data were
examined to better understand the following soil hydraulics and
performance characteristics:
1. Percolation of stormwater from the ponding layer through
the bioretention soils into the storage layer
2. Infiltration of treated stormwater from the storage layer to
the surrounding soils (note: this applies only to the Fire
Prevention Bureau bioretention IMPs)
3. Performance of storage layer and frequency of underdrain
discharges
4. Any evidence of performance problems
Percolation Characteristics
At the Fire Prevention Bureau site, a slotted-standpipe
monitoring well was installed within the gravel storage layer of
each monitored IMP. At the Walden Park Commons site, water
levels were monitored in the vaults at the downstream end of the
storage pipes. The IMP percolation characteristics were examined
by comparing the timing and volume of rainfall to the
appearance of water within the storage layer at each IMP.
The monitoring data shows that percolation begins after
relatively modest levels of rainfall. In the 2004-2005 HSPF
model, bioretention soils were modeled using the van Genuchten
relationship for water retention. This relationship dictates that
percolation rates in sandy-loamy soils would be minimal until
the soil reached about three-quarters saturation. However, water
appeared in the gravel layer before that volume was reached.
Similar runoff and percolation characteristics were observed at
the Fire Prevention Bureau and Walden Park Commons IMPs.
The bioretention soils are faster-draining than we expected when
creating HSPF models for the HMP.
Figure 6-1 shows an example percolation response for the March
16-18, 2012 storm event at IMP #2 at the Fire Prevention
Bureau. The observed depths in the gravel storage layer begin to
climb after the first 0.07 inches of rainfall. Based on the
tributary area and our initial assumptions about the soil’s water
retention characteristics, we expected this initial runoff to be

Dan Cloak Environmental Consulting September 15, 2013 34
fully absorbed within the bioretention soils, filling the available
pore spaces like water fills the void spaces in a sponge.
Figure 6-1. Percolation and infiltration, Fire Prevention Bureau IMP #2.
In general percolation in IMP #2 occurred after 0.07 to 0.16
inches of rain, except during an extended wet period from late-
November through December 2012 when soils remained wet
between storms and percolation began almost immediately after
the start of a rain event. In IMP #6 percolation started later in
storm events, usually after 0.3 to 0.8 inches of rain (Figure 6-2).
IMP #4 is much smaller than the other IMPs and is about two-
thirds larger the necessary, based on the HMP sizing factors. IMP
#4 did not produce a consistent response to rainfall.
Figure 6-2. Percolation and Infiltration, Fire Prevention Bureau IMP #6.
0
0.1
0.2
0.3
0.4
0.5
0.6
0.7
0.8
0.9
1
0
0.1
0.2
0.3
0.4
0.5
0.6
0.7
0.8
0.9
1
3/1
6/1
2 1
2:0
0
3/1
6/1
2 1
8:0
0
3/1
7/1
2 0
:00
3/1
7/1
2 6
:00
3/1
7/1
2 1
2:0
0
3/1
7/1
2 1
8:0
0
3/1
8/1
2 0
:00
3/1
8/1
2 6
:00
Rai
nfa
ll (i
n)
Leve
l of
Gra
vel L
ayer
IMP
#2
(ft
)
Level #2
Cumulative Precipitation
Percolation appears in gravel layer after 0.07 inches of rain.
0
0.1
0.2
0.3
0.4
0.5
0.6
0.7
0.8
0.9
1
0
0.1
0.2
0.3
0.4
0.5
0.6
0.7
0.8
0.9
1
3/1
6/1
2 1
2:0
0
3/1
6/1
2 1
8:0
0
3/1
7/1
2 0
:00
3/1
7/1
2 6
:00
3/1
7/1
2 1
2:0
0
3/1
7/1
2 1
8:0
0
3/1
8/1
2 0
:00
3/1
8/1
2 6
:00
Rai
nfa
ll (i
n)
Leve
l of
Gra
vel L
ayer
IMP
#6
(ft
)
Level #6
Cumulative Precipitation
Percolation appears in gravel layer after 0.3 inches of rain.

Dan Cloak Environmental Consulting September 15, 2013 35
The reasons for the different response times at IMP #2 and IMP
#6 were evaluated. The large roof area adjacent to IMP #2
discharges water via three downspout connections. This water
may be saturating the soils in the immediate vicinity of the
downspouts and generating percolation to the gravel layer
without wetting other portions of the bioretention facility.
Conversely, IMP #6 spreads inflows more broadly and provides a
larger soil volume to capture stormwater runoff.
At Walden Park Commons stormwater quickly appears in the
storage layer soon after rainfall begins. Figure 6-3 shows
accumulated rainfall and IMP outflow for an April 2012 storm
event at IMP #1 (North). The storage pipe has received enough
percolation to produce outflow after 0.1 inches of rainfall is
recorded.
Figure 6-3. Stormwater appears in storage pipe shortly after rain begins IMP #1 (North).
Figure 6-4 shows the start of percolation at IMP #2 (South). The
percolation starts later in IMP #2 (South) because a) bioretention
area is larger and b) more of the tributary area contains pervious
surfaces. The relative responses at IMP #1 (North) and IMP #2
(South) are similar for other storm events.
0
0.5
1
1.5
2
2.5
3
3.5
4
4.5
5
0.000
0.005
0.010
0.015
0.020
0.025
0.030
0.035
0.040
0.045
0.050
4/9
/12
12
:00
4/1
0/1
2 0
:00
4/1
0/1
2 1
2:0
0
4/1
1/1
2 0
:00
4/1
1/1
2 1
2:0
0
4/1
2/1
2 0
:00
4/1
2/1
2 1
2:0
0
4/1
3/1
2 0
:00
4/1
3/1
2 1
2:0
0
4/1
4/1
2 0
:00
4/1
4/1
2 1
2:0
0
4/1
5/1
2 0
:00
4/1
5/1
2 1
2:0
0
Rai
nfa
ll (i
n)
Ou
tflo
w f
rom
IMP
#1
(cf
s)
IMP #1 (North) Outflow (cfs)
Cumulative Rainfall
Outflow begins from storage pipe after 0.1 inches of rain.

Dan Cloak Environmental Consulting September 15, 2013 36
Figure 6-4. At IMP #2 (South) stormwater runoff appears in storage pipe more slowly than in IMP #1 (North)
In conclusion, the bioretention soils appear to allow percolation
at lower soil moisture content levels than we expected when
preparing the HMP. The effect is less pronounced in over-sized
bioretention installations, such as Fire Prevention Bureau IMP
#6 and Walden Park Commons IMP #2 (South). This
characteristic will probably have a negligible effect on IMP
performance. One potential benefit of the fast-percolating soils is
the reduced likelihood stormwater building up in the ponding
layer and spilling into the overflow in response to high-intensity
rainfall.
Infiltration Characteristics
The infiltration characteristics of the surrounding soils were first
evaluated at the Fire Prevention Bureau site, where the IMP
gravel layers discharge directly to the surrounding soils. Figure
6-5 shows the recorded water levels in the storage layer at Fire
Prevention Bureau IMP #2 for the November 28-30, 2012 storm
event. Figure 6-6 shows the same storm event at IMP #6.
0
0.5
1
1.5
2
2.5
3
3.5
4
4.5
5
0.000
0.005
0.010
0.015
0.020
0.025
0.030
0.035
0.040
0.045
0.050
4/9
/12
12
:00
4/1
0/1
2 0
:00
4/1
0/1
2 1
2:0
0
4/1
1/1
2 0
:00
4/1
1/1
2 1
2:0
0
4/1
2/1
2 0
:00
4/1
2/1
2 1
2:0
0
4/1
3/1
2 0
:00
4/1
3/1
2 1
2:0
0
4/1
4/1
2 0
:00
4/1
4/1
2 1
2:0
0
4/1
5/1
2 0
:00
4/1
5/1
2 1
2:0
0
Rai
nfa
ll (i
n)
Ou
tflo
w f
rom
IMP
#1
(cf
s)
IMP #2 (South) Outflow (cfs)
Cumulative Rainfall
Outflow begins from storage pipe after 0.19 inches of rain.

Dan Cloak Environmental Consulting September 15, 2013 37
Figure 6-5. Storm recession rates at Pittsburg Site37 IMP #2
Figure 6-6. Storm recession rates at Fire Prevention Bureau IMP #6
After the rain stops, the water level in the storage layer decreases
quickly—at a rate between 0.8 inches per hour and more than 1
inch per hour. Several storm events were examined and while
the rate varied by storm in all cases the recession rate was
higher than expected for NRCS Group D soils. Even late in the
winter season, there was no noticeable groundwater mounding-
related reduction in infiltration capacity. The Fire Prevention
Bureau infiltration rates surpass the assumed rate of 0.024
inches per hour used in the 2004-2005 HSPF model.
In conclusion, soils at the Fire Prevention Bureau infiltrate
runoff more rapidly than the reference values for NRCS Group D
0.0
0.2
0.4
0.6
0.8
1.0
1.2
1.4
1.6
1.8
2.0
2.2
2.4
0.0
0.2
0.4
0.6
0.8
1.0
1.2
1.4
1.6
1.8
2.0
2.2
2.4
11
/28
/12
0:0
0
11
/28
/12
6:0
0
11
/28
/12
12
:00
11
/28
/12
18
:00
11
/29
/12
0:0
0
11
/29
/12
6:0
0
11
/29
/12
12
:00
11
/29
/12
18
:00
11
/30
/12
0:0
0
11
/30
/12
6:0
0
11
/30
/12
12
:00
11
/30
/12
18
:00
12
/1/1
2 0
:00
12
/1/1
2 6
:00
12
/1/1
2 1
2:0
0
Rai
nfa
ll (i
n)
Leve
l of
Gra
vel L
ayer
IMP
#2
(ft
)
Level IMP #2 (ft)
Cummulative Rainfall (in)
Water level drops at rate of 0.8 inches per hour.
Water level drops at rate of >1.0 inches per hour.
0.0
0.2
0.4
0.6
0.8
1.0
1.2
1.4
1.6
1.8
2.0
2.2
2.4
0.0
0.2
0.4
0.6
0.8
1.0
1.2
1.4
1.6
1.8
2.0
2.2
2.4
11
/28
/12
0:0
0
11
/28
/12
6:0
0
11
/28
/12
12
:00
11
/28
/12
18
:00
11
/29
/12
0:0
0
11
/29
/12
6:0
0
11
/29
/12
12
:00
11
/29
/12
18
:00
11
/30
/12
0:0
0
11
/30
/12
6:0
0
11
/30
/12
12
:00
11
/30
/12
18
:00
12
/1/1
2 0
:00
12
/1/1
2 6
:00
12
/1/1
2 1
2:0
0
Rai
nfa
ll (i
n)
Leve
l of
Gra
vel L
ayer
IMP
#2
(ft
)
Level IMP #6 (ft)
Cummulative Rainfall (in)
Water level drops at rate of 0.8 inches per hour.

Dan Cloak Environmental Consulting September 15, 2013 38
soils. IMPs at this site will provide a higher overall onsite
stormwater capture fraction than previously expected. These
IMPs should also provide a higher level of performance relative to
the NPDES permit’s flow duration performance standard.
The native soil characteristics for the Walden Park Commons site
were indirectly evaluated using a combination of monitoring data
and modeling (see Section 6.1.3).
Storage Layer and Underdrain Performance
The Fire Prevention Bureau monitoring data for IMP #2, IMP #4
and IMP #6 were also examined to determine a) how often the
flow monitoring equipment registered underdrain discharge, and
b) whether these discharges were caused by the filling of the
gravel layer.
The items below describe the monitoring data results, which are
also summarized in Table 6-4.
IMP #2: Small underdrain discharges were recorded at 10
separate days over the 20 month monitoring period. The
total volume of these discharges was less than 3 cubic
feet. None of the discharges lasted more than 15 minutes
and only four occurred during the 10 largest rainfall
events. In all cases the corresponding water depth did not
reach the level of the discharge pipe. The mostly likely
reasons for the underdrain discharge are that a small
amount of water migrated into the underdrain pipe as it
was descending into the gravel layer, and/or that rain fell
directly into the tipping bucket.
IMP #4: Small underdrain discharges were recorded on
16 separate days with the total discharge over 20 months
of 4.4 cubic feet. Similar to IMP 2, the discharge volumes
are very small and not continuous. The observed water
level in the gravel layer never reached the elevation of the
under-drain pipe.
IMP #6: Small underdrain discharges were recorded on
21 separate days with the total discharge over 21 months
of 6.6 cubic feet. Similar to IMP 2 and IMP 4, the
discharge volumes are very small and not continuous.
The observed water level in the gravel layer never reached
the elevation of the underdrain pipe.

Dan Cloak Environmental Consulting September 15, 2013 39
Table 6-4. Pittsburg Fire Prevention Bureau
Monitored Discharge Events
IMP Number of Underdrain
Discharge Events* Number of Events Due to Filling of Underdrain Layer
Total Volume
IMP #2 10 0 2.7 ft3
IMP #4 16 0 4.4 ft3
IMP #6 21 0 6.6 ft3
*These discharge events each produced a small volume of water and were most likely due to the migration of water into the underdrain pipe as the water descended into the gravel layer, and/or rain falling directly into the tipping bucket.
Evidence of IMP Performance Issues
No significant or systematic IMP performance issues were
evident from the monitoring data or from anecdotal observations
during storm events. As noted in Section 5, the overflow risers in
the bioretention facilities at Walden Park Commons were
installed using perforated pipe, rather than the specified solid
pipe. This allowed an unknown portion of stormwater flow to
bypass the bioretention treatment. The contractor for the Walden
Park Commons project corrected the problem on March 6, 2012.
Summary of Observed IMP Performance
The IMPs at the Pittsburg Fire Prevention Bureau Building and
Walden Park Commons successfully captured, treated, detained,
and slowly discharged stormwater from all storms during the
two-year monitoring period. There were no overflows or
significant performance issues.
The infiltration capacity of the native soils at the Pittsburg site
will provide a higher level of onsite stormwater control and
should allow these IMPs to surpass the flow control
requirements of the NPDES permit. Additionally, the bioretention
soils allow for faster percolation than was assumed when
preparing the HMP. While this difference is not likely to affect the
IMP sizing factors, it will protect the system from overflows
during periods of very intense rainfall.
6.1.3 Comparison of Model Predictions to Measured Results
Model predictions and monitoring data (primarily water level)
were compared for the 10 largest storm events during the 20-
month monitoring period at the Fire Prevention Bureau (see
Table 6-2 above for list of events).
Figure 6-7 shows an example comparison for Fire Prevention
Bureau Building IMP #2 for the April 10-14, 2012 storm event.

Dan Cloak Environmental Consulting September 15, 2013 40
Figure 6-8 shows the same storm event for IMP #6. As expected
from the monitoring data review, the models do not produce
early-storm percolation to the gravel storage layer that was
observed in the monitoring data. The models also allow water to
remain in both IMP layers for longer periods, which will make
the Pittsburg site’s model simulations overstate the site’s
sensitivity to back-to-back storms.
Figure 6-7. Model output and monitoring data comparison at IMP #2 from 4/10/12 to 4/14/12
Figure 6-8. Model output and monitoring data comparison at IMP #6 from 4/10/12 to 4/14/12
The number of simulated and observed underdrain discharge
events was also compared for IMP #2, IMP #4, and IMP #6. The

Dan Cloak Environmental Consulting September 15, 2013 41
HSPF model predicts more frequent discharges through the
underdrain pipe. Table 6-5 summarizes the model results.
Table 6-5. Pittsburg Fire Prevention Bureau Model Discharge Events
IMP Number of Underdrain
Discharge Events Total Volume Notes
IMP #2 6 2,700 ft3 Each event lasts several hours
IMP #4 0 0 ft3
IMP #6 2 87 ft3 Each event lasts several hours
At the Walden Park Commons site, there were a limited number
of storms with water level data, but flow rates were recorded
through both monitoring seasons. Therefore the simulated and
observed outflow volumes were compared for the 13 largest
rainfall events during the monitoring period. Figure 6-9 and
Figure 6-10 show example results for two separate storm events
for IMP #1 (North), which is located in the northwest corner of
the Walden Park Commons development. Similar to the initial
Fire Prevention Bureau comparison, the monitoring data shows
a faster percolation response in the IMP. The model simulation
produces higher outflow volumes than were measured.
Figure 6-9. Model output and monitoring data comparison at Walden Park Commons IMP #1 (North) from 3/13/12 to 3/18/12

Dan Cloak Environmental Consulting September 15, 2013 42
Figure 6-10. Model output and monitoring data comparison at Walden Park Commons IMP #1 (North) from 4/10/12 to 4/14/12
Figure 6-11 and Figure 6-12 compare the simulated and
measured cumulative outflow volume for Walden Park Commons
IMP #2 (South) for March and April 2012 storm events. The
results of the comparison are similar to results for IMP #1
(North). The model simulation produces larger outflow volumes
than were observed in the monitoring data.
Figure 6-11. Model output and monitoring data comparison at Walden Park Commons IMP #2 (South) from 3/13/12 to 3/18/12

Dan Cloak Environmental Consulting September 15, 2013 43
Figure 6-12. Model output and monitoring data comparison at Walden Park Commons IMP #2 (South) from 4/10/12 to 4/14/12
6.2 Adjustment of Model Parameter Values
To reduce the simulated IMP outflow and better match the
monitoring data, the infiltration characteristics of each IMP were
adjusted. The initial effort focused on the following revisions to
Walden Park Commons IMP #1 (North):
1. The relationship between soil moisture and percolation in
the bioretention soil was modified to allow percolation to
begin soon after water enters the soil. The previous
version of the HPSF model held back most percolation
until the moisture content reached about 80 percent of
saturation.
2. A zone of influence was established around the
bioretention layer’s underdrain. Because the monitored
outflow was significantly less than the estimated inflow to
the IMP, we assumed a portion of the stormwater
entering the bioretention portion of IMP #1 (North) was
infiltrating to surrounding soils. Similar losses to
infiltration were evident in the data for IMP #2 (South).
The zone of influence value was iteratively modified until the IMP
outflow volume better matched the monitoring data across a
range of storm events. Figure 6-13 and Figure 6-14 show the
updated results for the same two storm events included in the
previous section (see Figures 6-9 and 6-10). For the zone of
influence value selected, the simulated outflow volume closely
matches the monitored outflow volume. For this value, 60
percent of the bioretention area drains to the underdrain and

Dan Cloak Environmental Consulting September 15, 2013 44
storage pipe, and the remainder infiltrates runoff to the
underlying soils.
Figure 6-13. Updated model output and monitoring data comparison at Walden Park Commons IMP #1 (North) from 3/13/12 to 3/18/12
Figure 6-14. Updated model output and monitoring data comparison at Walden Park Commons IMP #1 (North) from 4/10/12 to 4/14/12
The model was also calibrated to match the response of IMP #6
at the Fire Prevention Bureau. The IMP model parameters were
adjusted to a) represent the capacity of the bioretention soils to
hold water prior to start of percolation, b) mimic the rapid
percolation that occurs once the soil moisture threshold is met,
and c) approximate the rate at which water drops in the gravel
layer by adjusting the infiltration rate to surrounding soils. This

Dan Cloak Environmental Consulting September 15, 2013 45
parameter also affects the simulated water level in the gravel
layer during storm events.
Figure 6-15 shows an example of the calibrated model’s response
for the November 28, 2012 storm event. This was the largest
event during the monitoring period and represents about a 2-
year storm for the Pittsburg area. During the initial stages of the
storm the simulated water moisture content rapidly accumulates
in the bioretention soil while very little water appears in the
gravel layer. When the second phase of the storm occurs,
percolation occurs rapidly and the gravel layer fills with more
than 1 foot of water (note: the underdrain is located about 2½
feet above the bottom of the gravel layer). The simulated
maximum depth matches the monitored maximum depth to
within 1 inch. The simulated gravel water level recession is a
little more rapid than the monitored recession. In general, the
simulated and observed recession rates are similar across the
range of storm events.
Figure 6-16 shows calibration results for a smaller storm event
that occurred on March 25, 2012. This 0.65-inch event has
about a 3-month (12-hour) recurrence interval. Similar to the
larger event shown above, the initial rainfall is captured and held
within the bioretention soils. Once the soil moisture threshold is
met, stormwater percolates to the gravel layer. The simulated
and monitored water levels match precisely and recession rates
also agree very closely. There is an approximately one-hour offset
Figure 6-15. Updated model output and monitoring data comparison at Fire Prevention Bureau IMP #6 from 11/28/12 to 12/1/12

Dan Cloak Environmental Consulting September 15, 2013 46
between the simulated and monitored peak water levels, which
will have no impact on the ability of the model to predict long-
term IMP performance.
Figure 6-16. Updated model output and monitoring data comparison at Fire Prevention Bureau IMP #6 from 3/24/12 to 3/25/12
In conclusion, the bioretention characteristics were adjusted at
the Walden Park Commons and Fire Prevention Bureau sites to
achieve a closer agreement between the HSPF model predictions
and the monitoring data. The infiltration rate to the surrounding
soils was increased to 0.24 inches per hour for all the Fire
Prevention Bureau IMPs.
The calibrated model adequately represents the key processing
during and after storm events, specifically; a) the build-up of soil
moisture, b) the percolation from bioretention soils to the storage
layer and, c) the recovery of the IMP capacity through infiltration
to surrounding soils (at the Fire Prevention Bureau). The
calibrated model is suitable for the analysis of long-term IMP
performance.
6.3 IMP Performance Compared to Flow Duration Standard
The IMP performance monitoring data review suggested the
bioretention facilities at the Fire Prevention Bureau and the
bioretention plus vault facilities at Walden Park Commons are
likely to meet the NPDES permit requirements and may be
performing in excess of these requirements by reducing flow
durations below the pre-project flow durations for the specified
range of flows (0.2Q2 to Q10).

Dan Cloak Environmental Consulting September 15, 2013 47
Long-term HSPF simulations were run for the IMPs at both
project sites to more fully test the IMP performance against the
NPDES permit’s flow control standard. The Fire Prevention
Bureau simulations used hourly rainfall data collected at the Los
Medanos gauge from 1972 through May 2013. The Walden Park
Commons simulations used hourly data from the FCD 11 gauge
in Martinez gauge from 1969 through May 2013. The following
statistical analyses were then performed on the model outputs:
Flow frequency statistics. The model outflow time series
was divided into discrete flow events (i.e., a partial-
duration series) using a 24-hour period of no flow to
indicate the end of an event. The resulting table of events
was sorted and ranked based on the peak flow rate. Each
event was assigned a recurrence interval (sometimes
referred to as a return period) using the Cunnane plotting
position method. Partial duration series statistics were
computed for the pre-project runoff and the post-project
IMP outflows.
Flow duration statistics. The model outflow time series
was divided discrete bins (flow ranges). The number of
hours – or duration – for which outflow occurred in each
bin’s flow range was then counted. These durations were
computed for the pre-project runoff and the post-project
IMP outflows.
Figure 6-17 shows the peak flow frequencies for the pre-project
runoff and post-project (i.e., existing) outflow for Fire Prevention
Bureau IMP #2.
Figure 6-18 compares flow durations for the pre-project and
existing conditions. In both figures, the IMP outflows are below
the pre-project flows between 0.2Q2 and Q10. Additionally, IMP
#2 outflows are below the pre-project site flows down to the
0.1Q2 threshold. Because IMP #2 was constructed with
dimensions that are very similar to the minimum required
dimensions included in the HMP, this suggests IMP #2 would
comply with a stricter lower control threshold of 0.1Q2. The
infiltration rates at the Fire Prevention Bureau site allow for this
level of performance.

Dan Cloak Environmental Consulting September 15, 2013 48
Figure 6-17. Peak flow frequency comparison for pre-project runoff and
post-project outflows for Fire Prevention Bureau IMP #2
Figure 6-18. Flow duration comparison for pre-project runoff and post-
project outflows for Fire Prevention Bureau IMP #2
0.00
0.02
0.04
0.06
0.08
0.10
0.12
0.14
0.16
0.18
0.20
0 1 2 3 4 5 6 7 8 9 10
Pe
ak
Flo
w (
cfs
)
Recurrence Interval (years)
Post-Project IMP Peak Outflow (cfs)
Pre-Project Peak Flow (cfs)
0.2Q2
0.00
0.02
0.04
0.06
0.08
0.10
0.12
0.14
0.16
0.18
0.20
0.00 0.02 0.04 0.06 0.08 0.10 0.12 0.14 0.16 0.18 0.20
Flo
w (
cfs
)
% Time Exceeded
Post-Project Pre-Project
Q10 0.2Q2

Dan Cloak Environmental Consulting September 15, 2013 49
Figure 6-19 and Figure 6-20 compare peak flow frequencies and
flow durations for Walden Park Commons IMP #1 (North),
respectively. IMP #1 (North) reduces site runoff to levels below
the pre-project conditions between 0.2Q2 and Q10. However, the
model results indicate that IMP #1 (North) does not control flows
down to the 0.1Q2 flow rate. To meet this standard, the flow
control orifice diameter would need to be reduced and the
storage volume potentially increased by a modest amount,
and/or the storage volume would need to be allowed to infiltrate
to subsurface soils—as in the Guidebook criteria for bioretention
+ vault facilities.
0.00
0.10
0.20
0.30
0.40
0.50
0.60
0.70
0.80
0 1 2 3 4 5 6 7 8 9 10
Peak F
low
(cfs
)
Recurrence Interval (years)
Post-Project IMP Peak Outflow(cfs)
Pre-Project Peak Flow (cfs)
0.2Q2
Figure 6-19. Peak flow frequency comparison for pre-project runoff and
post-project outflows at IMP #1 (North)

Dan Cloak Environmental Consulting September 15, 2013 50
All the IMPs successfully control outflows to their pre-project
levels from 0.2Q2 to Q10. The Fire Prevention Bureau IMPs also
control flows down to the 0.1Q2 threshold – benefitting from the
infiltration capacity of site soil conditions. The Walden Park
Commons do not control IMP outflows to the 0.1Q2 threshold,
but the modeling results suggest this additional level of control
could be achieved by a one or more of the following: modifying
the orifice configuration, by allowing stored runoff to infiltrate to
underlying soils, or by increasing the storage volume modestly.
7 ∙ Discussion
7.1 Why These Results Are Important
The principal advantage of environmental modeling is the
capability of modeling to extrapolate limited data sets to make
predictions over an extended period and wide variety of
conditions. However, because of limited data and the
unpredictability of environmental conditions, a “garbage in,
garbage out” scenario can occur, where model results are
primarily a reflection of guesses and assumptions input to the
model.
The 2004-2005 model used to determine CCCWP IMP sizing
factors had the advantage of representing a relatively controlled
0.00
0.10
0.20
0.30
0.40
0.50
0.60
0.70
0.80
0.00 0.05 0.10 0.15 0.20 0.25 0.30
Flo
w (
cfs
)
% Time Exceeded
Post-Project
Pre-Project
Q10
0.2Q2
0.1Q2
Figure 6-20. Flow duration comparison for pre-project runoff and post-project outflows IMP #1 (North)

Dan Cloak Environmental Consulting September 15, 2013 51
system and the disadvantage of a paucity of available data
representing bioretention system performance. That is, the
model did, in concept, accurately represent the structure and
function of bioretention facilities as they are actually built;
however, there was a near-absence of data to inform the
selection of values for the parameters that most strongly affect
bioretention performance—most notably the rate at which
treated runoff infiltrates to native soils.
Data collection for this project fills this gap, and greatly
advances the CCCWP model. Previously the CCCWP model was
dependent primarily on guessed and assumed values for the
most important parameters; now it is based on empirically
derived values. The CCCWP data may also be useful in updating
similar models, such as the Bay Area Hydrology Model, that
currently use guessed and assumed values for the model
parameters that most strongly affect facility performance and
HM compliance.
7.2 Percolation Through Bioretention Planting Media
As noted in Section 6, the model was set up with the assumption
that the entire planting media layer would become mostly
saturated before treated runoff proceeded to percolate into the
underlying gravel layer. When modeled and measured results
were compared, it was noted that runoff was measured in the
gravel layer of the bioretetention facilties (at the Pittsburg Fire
Protection Bureau Building) and in the storage vaults (at Walden
Park Commons) much more quickly than the model predicted.
This may be occurring either because runoff percolates rapidly
downward near the inlet, and much of the planting media layer
did not get wet, or because the soil media exhibits less moisture-
holding capacity and matric head than the model predicted, or
both.
7.3 Infiltration to Native Soils
The capability of a bioretention facility to control volumes and
durations of discharge is dependent on, among other factors, the
rate of infiltration to native clay soils. This study demonstrated
that infiltration at the five test locations is approximately 10
times faster than estimated in the 2004-2005 CCCWP model.
The estimate in the 2004-2005 CCCWP model was drawn from
guidance for the use of HSPF at the watershed scale. The values
selected for continuous-simulation models are typically based on
calibration of models of runoff at the watershed scale—that is, to

Dan Cloak Environmental Consulting September 15, 2013 52
data sets consisting of local rainfall data and stream gauge data.
The stream gauges represent flows collected from watersheds
ranging from tens of acres to hundreds of acres.
Importantly, the resulting calibrated model values for key
parameters representing losses of surface runoff to infiltration
(in HSPF, “INFILT” is such a key parameter) do not necessarily
correspond to results of infiltrometer tests or other direct tests of
soil permeability. In fact, surface runoff losses at the watershed
scale and movement of water through the pores of saturated soil
are somewhat different physical processes.
The data collected by this project provide rare (perhaps unique)
infiltration rate data and represent actual bioretention
performance, rather than using an estimate of performance
extrapolated from watershed-scale model calibrations or soil
testing. Although limited to three bioretention facilities around a
single 1-acre site, the data show that silty clays can, at least in
some circumstances, infiltrate at rates in excess of 0.2 inches
per hour—as measured by the recovery of a bioretention
subsurface reservoir—and that these higher-than-expected rates
are consistent throughout the season, for a range of storm sizes,
and from facility to facility.
7.4 Applicability of Results Region-wide
The five IMP monitored locations are representative of typical
Bay Area development patterns and conditions.
As noted in Section 5, the two bioretention + vault facilities at
Walden Park Commons were constructed with some exceptions
to current Guidebook design recommendations; these exceptions
were incorporated into the customized model for the purposes of
model calibration. The three facilities at the Pittsburg Fire
Prevention Bureau Building were built very close to current
Guidebook design criteria and design recommendations.
As previously noted, the rate at which runoff infiltrates to soils
beneath the facility is a key factor determining overall
performance. Are the infiltration rates found at the Pittsburg site
representative of development sites in Contra Costa, or in the
Bay Area as a whole?
There are no observed characteristics that would suggest
otherwise. The site soils, described as “stiff to hard, moderately
to highly plastic silty clays” in the site geotechnical report
(Kleinfelder 2004) are typical of development sites throughout
the Bay Area. The site is quite flat. Only the lack of near-surface
groundwater would tend to suggest this site’s soils could be

Dan Cloak Environmental Consulting September 15, 2013 53
better-draining than similarly classified soils at another Bay
Area development site.
Collection of data from bioretention facilities at additional
locations would be necessary to accurately estimate the average
and variance of infiltration rates that might occur in similar
soils.
8 ∙ Conclusions and Recommendations
This project demonstrated that the IMPs and sizing factors
approved by the Water Board in 2006—and updated in
subsequent editions of the Guidebook—are adequate to meet
current regulatory requirements.
8.1 Next Steps for Use of the Calibrated and Validated Model
MRP Attachment C requires:
By April 1, 2014, the Contra Costa Clean Water Program
shall submit a proposal containing one or a combination
of the following three options (a.-c.) for implementation
after the expiration and reissuance of this permit:
a. Present model verification monitoring results
demonstrating that the IMPs are sufficiently overdesigned
and perform to meet the 0.1Q2 low flow design criteria; or
b. Present study results of Contra Costa County streams
geology and other factors that support the low flow design
criteria of 0.2Q2 as the limiting HMP design low flow; or
c. Propose redesigns of the IMPs to meet the low flow
design criteria of 0.1Q2 to be implemented during the
next permit term.
CCCWP intends to work with other Permittees (through
BASMAA, the Bay Area Stormwater Management Agencies
Association) and with Water Board staff to develop and agree
upon revised HM permit requirements applicable to all MRP
Permittees that:
Favor, rather than constrain, the implementation of LID
to meet HM requirements
Consider a potential range of low flow thresholds for
streams, with the aim of revising the thresholds to
provide for reasonable protection of beneficial uses
Have a more technically defensible basis for translation of
in-stream criteria to LID facility discharge criteria; this
basis should include consideration of the potential future

Dan Cloak Environmental Consulting September 15, 2013 54
extent of watershed development and the proportion of
the watershed that the proposed development represents
Take into account that IMPs tend to reduce flow
durations to below pre-project levels for flows in the
middle of the range (the most geomorphically significant
range, between 0.2Q2 and Q2)
Consider the extent of potential Bay Area development
that may be subject to HM requirements vs. the effort
expended so far, and that may be expended in the future,
on developing and implementing HM regulations
Apply exceptions, exclusions, and thresholds uniformly
among MRP Permittees
Incorporate design requirements and sizing factors that
reflect the results of this study
8.2 Insights Concerning Bioretention Design and Construction
The CCCWP project team worked with City of Pittsburg and City
of Walnut Creek staff and with the engineers and construction
project managers for each of the two developments. Overall
cooperation was excellent and contributed greatly to the success
of the CCCWP project.
The following insights are the author’s but resulted from the
work of all involved.
8.2.1 Bioretention Design
To maximize the volume of runoff infiltrated, the facility must be
configured so that each layer “fills up like a bathtub.” The top of
gravel layer should be at a consistent elevation so that all pore
areas within the gravel layer are filled evenly; likewise for the soil
layer and for the surface reservoir. The surface reservoir should
be surrounded by concrete curbs or landscape timbers to
maximize its volume (as compared to sloping sides toward the
center of the facility) and to facilitate verification that the
reservoir is level and will fill evenly.
The project design should be reviewed prior to construction to
ensure the stability of roads, walkways, and structures adjacent
to bioretention facilities has been adequately considered.
Because bioretention soils cannot be compacted, bioretention
walls must effectively resist lateral pressure from surrounding
soils. Where necessary, bioretention walls can be made
impervious as a precautionary measure to protect adjacent

Dan Cloak Environmental Consulting September 15, 2013 55
roads, walkways, and structures while leaving the bottom of the
bioretention facility open for infiltration.
Overflow structures are best constructed from precast manholes
or catch basins. Construction crews have experience setting
these structures at a precise elevation. Use of an adequately
sized catch basin with a grate makes it possible to verify
underdrain discharge visually and to access the underdrain pipe
for cleaning or maintenance. Setting the underdrain discharge
elevation at the top of the gravel layer may reduce the required
depth of the overflow structure.
Overflow structures can also accommodate connections to site
storm drainage pipes routed through the bioretention facilities.
Orifices on underdrains may be constructed of solid PVC pipe
extending a few inches into the overflow catch basin structure,
threaded, and equipped with a cap. The orifice is drilled into the
cap as shown in Figure 4-4.
8.2.2 Bioretention Construction
It is necessary to have an engineer familiar with the structure,
function, and details of bioretention to review construction at
each stage (layout, excavation, installation of underdrains and
overflows, installation of gravel and soil mix, irrigation systems,
and planting). In particular, elevations should be checked and it
should be ensured that the soils at the bottom of the excavation
are ripped.
8.3 Recommendations for Instrumentation
Success in data collection was largely attributable to the
participation of an experienced instrumentation technician (Scott
McQuarrie, of the Contra Costa Flood Control and Water
Conservation District). Installation of rain gauges, tipping
buckets, magnetic flow meters, piezometers, dataloggers, and
telemetry required considerable technical ingenuity and
experience to configure at each site.
For future projects monitoring the hydrologic performance of
bioretention facilities, including bioretention + vault facilities, it
would be possible to rely on level sensors (piezometers) rather
than flow sensors or tipping buckets. Piezometers are more
reliable to operate and also provide information on saturation
levels. Orifice factors and/or rating curves for each fabricated
orifice could be determined prior to installation. This could be
done by plumbing the fabricated orifices to a small tank or
reservoir and timing the falling head. Once installed, the

Dan Cloak Environmental Consulting September 15, 2013 56
discharge rate through the orifice, for each time interval, could
be calculated from the corresponding piezometer reading.
8.4 Further Research
As noted above, it would be meaningful to obtain data from
bioretention facilities installed in clay soils at additional sites. An
additional 3-8 sites could be sufficient to demonstrate the
regional applicability of the results found here.
This study showed the value of obtaining time-series for (1)
rainfall and (2) saturation depth of the subsurface storage (gravel
layer). It is recommended to select, where possible, facilities
located on public development projects, as it is easier to
coordinate documentation of design and construction of
bioretention facilities on these projects.
As noted above, the monitoring effort could be reduced by
installing only rain gauges at each site and only piezometers in
each facility. As a rough estimate, instrumentation could be
installed at an equipment cost of $7,000 and about 12 hours of
technical labor for each facility. This does not include the cost of
maintaining the instrumentation and downloading the data.

Dan Cloak Environmental Consulting September 15, 2013 57
References
California Ocean Protection Council. 2008. Resolution of the
California Ocean Protection Council Regarding Low Impact
Development. May 15, 2008.
California Regional Water Quality Control Board for the Central
Valley Region. 2010. East Contra Costa County Municipal
NPDES Permit. Order R5-2010-0102.
California Regional Water Quality Control Board for the San
Francisco Bay Region. 2006. Order R2-2006-0050. Order
revising Order R2-2003-0022 to incorporate new
Hydromodification Management requirements. Adopted July 12,
2006.
California Regional Water Quality Control Board for the San
Francisco Bay Region. 2011. Municipal Regional Stormwater
NPDES Permit. Order R2-2009-0074. Revised November 28,
2011.
CCCWP. Contra Costa Clean Water Program. 2004. Work Plan
and Literature Review for the Hydrograph Modification
Management Plan. Submitted to the California Regional Water
Quality Control Boards for the San Francisco Bay and Central
Valley Regions on May 12, 2004.
CCCWP. Contra Costa Clean Water Program. 2005. Hydrograph
Modification Management Plan. Submitted to the California
Regional Water Quality Control Boards for the San Francisco
Bay and Central Valley Regions on May 15, 2005.
CCCWP. Contra Costa Clean Water Program. 2012. Stormwater
C.3 Guidebook, 6th Edition. Also the 4th Edition, 2008, and
addenda to the 4th Edition, 2009.
Cloak, Dan. 2009. “IMP Model Calibration and Validation Plan:
Summary of Technical Requirements for HMP Monitoring Sites,”
memorandum to Tom Dalziel, Manager, Contra Costa Clean
Water Program. December 7, 2009.
Lane, E.W. “The Importance of Fluvial Morphology in Hydraulic
Engineering.” Proceedings of the American Society of Civil
Engineers, Volume 81, No. 745 (1955).
Kleinfelder, Inc. 2004. Geotechnical Investigation Report, Fire
Station No. 85, Loveridge Road, Pittsburg, California.

Dan Cloak Environmental Consulting September 15, 2013 58
Korbmacher Engineering, 2006. Geotechnical Study, Proposed
Walden Park Commons Residential Development
Prince Georges County, Maryland. 1999. Low Impact
Development Design Strategies: An Integrated Design Approach.
Department of Environmental Resources and Planning Division.
June 1999.
Riley, Ann L. “A primer on stream and river protection for the
regulator and program manager.” Technical Reference
Circular, W.D. 02-#1. California Regional Water Quality
Control Board for the San Francisco Bay Region. October
2002.

APPENDIX A IMP Modeling Analysis and Results
This appendix supplements the modeling and data analysis results included in Section 6 of the HMP Model Calibration and Verification report. This appendix includes a detailed description of the project site model development, rainfall analysis, model calibration and long-term simulation results.
Section 1: Project Site HPSF Model Development HSPF models were constructed for the Fire Prevention Bureau site in Pittsburg and the Walden Park Com-mons site in Walnut Creek. The models were adapted from the HPSF models that were developed for the HMP by including the drainage management area characteristics, IMP configurations of each site, and time series input data for each site.
The following site-specific modifications were made:
1. Setting up subcatchment areas within HSPF to represent the project site area
2. Modifying the bioretention IMP setup to represent the actual configurations of the IMPs – the con-structed areas and volumes instead of the volumes required by the HMP.
3. Incorporating local time series data, including project site rainfall data in 15-minute increments.
4. Changing the model time step from 1 hour to 15 minutes. This also necessitated changing several conversion factors within HSPF – particularly for quantities that are calculated in HPSF as volumes or depths per time step (rather than per second or per hour).
Following these modifications, various QA/QC checks (e.g., comparing IMP inflow to rainfall volumes, com-paring IMP layer 1 outflow and layer 2 inflow volumes) were performed to validate the model response.
1.1 Drainage Management Areas The HPSF model’s Drainage Management Area (DMA) characteristics were derived from drainage planning information provided by the Clean Water Program. For the Fire Prevention Bureau site, the Stormwater Treatment Plan (drawing sheet C-6, dated September 2009) included the drainage areas, soil types and other information needed for the model. For the Walden Park Commons site, the C.3 Plan – Stormwater Treatment Control Plan (drawing sheet C-1, dated July 2008) were used to characterize the DMAs. Table 1 lists the Fire Prevention Bureau DMA characteristics and Table 2 lists the Walden Park Commons DMA characteristics.
Table 1. Pittsburg Fire Prevention Bureau Site DMA CharacteristicsA
DMA Impervious Area Pervious Area Total Area
ft2 acres ft2 acres ft2 acres
DMA 2 (trib. to IMP 2) 12,059 0.2768 2,415 0.0554 14,474 0.3323
DMA 4 (trib. to IMP 4) 627 0.0144 0 0.0000 627 0.0144
DMA 6 (trib. to IMP 6) 3,152 0.0724 562 0.0129 3,714 0.0853

2
A. All pervious areas were simulated as NRCS Group D soil (PERLND 102)
Table 2. Walden Park Commons Site DMA CharacteristicsA
DMA Impervious Area Pervious Area Total Area
ft2 acres ft2 acres ft2 acres
Tributary to IMP #1 (North)
M 11,606 0.2664 2,153 0.0494 13,759 0.3159
N 21,695 0.4980 3,795 0.0871 25,490 0.5852
Total IMP #1 (North) 33,301 0.7645 5,948 0.1365 39,249 0.9010
Tributary to IMP #2 (South)
D 7,780 0.1786 1,381 0.0317 9,161 0.2103
E 7,574 0.1739 1,252 0.0287 8,826 0.2026
J 5,382 0.1236 2,120 0.0487 7,502 0.1722
K 8,996 0.2065 1,658 0.0381 10,654 0.2446
L 3,198 0.0734 575 0.0132 3,773 0.0866
P 3,597 0.0826 509 0.0117 4,106 0.0943
Total IMP #2 (South) 36,527 0.8385 7,495 0.1721 44,022 1.0106
A. All pervious areas were simulated as NRCS Group D soil (PERLND 102)
1.2 IMP Characteristics The DMA source data also contained information about the site IMPs. For the Walden Park Commons site, the SWQ and Hydrology Study for Subdivision 9147 drainage report, dated October 2010, was also re-viewed to obtain the total volume included in the storage pipes. Table 3 lists the Fire Prevention Bureau IMP dimensions and Table 4 lists the Walden Park Commons IMP dimensions.
At the Fire Prevention Bureau site, the IMPs were generally constructed with dimensions that were close to the requirements of the HMP. For example, the A (area) and V2 (gravel volume) components are IMP #2 are close to the IMP requirements while the V1 (ponding layer) component was larger than required. IMP #4 and IMP #6 were constructed with larger plan areas (A) but the volume ponding layer volume and gravel volume were close to the amount required by the HMP. The underdrain piping for the Fire Prevention Bureau IMPs were located near the top of the gravel layer to provide an opportunity for more of the treated water to infiltrate to the surrounding soils.
Table 3. Pittsburg Fire Prevention Bureau Site IMP Dimensions
IMP Required Areas, Volumes Constructed Areas, Volumes Constructed Depths Orifice Diameter
(in) A (ft2) V1 (ft3) V2 (ft3) A (ft2) V1 (ft3) V2 (ft3) Ponding (in) Soil (in) Gravel (in)
IMP #2 873 734 960 886 886 975 12 18 33 0.81
IMP #4 40 34 44 82.5 41 41 6 18 15 0.17
IMP #6 225 189 247 340 170 215 6 18 19 0.41

3
The Walden Park Commons bioretention plus vault IMPs were constructed with storage volume (V) compo-nents that approximated the HMP requirements. IMP #2 (South) was constructed with a bioretention area that is approximately 20 percent larger than required by the HMP.
Table 4. Walden Park Commons Site IMP Dimensions
IMP Bioretention Area (ft2) Storage Volume (ft3) Orifice Diameter (in)
IMP #1 (North) 1,500 2,419 1.24
IMP #2 (South) 1,917 2,698 1.31
1.3 Time Series Data Time series data were used to provide rainfall and evapotranspiration inputs to the HSPF model. Table 5 lists the time series datasets used and the periods covered by these datasets.
Table 5. HPSF Model Time Series Datasets
Dataset Type Source Period Usage
Fire Prevention Bureau Rainfall
Rainfall tipping bucket processed in 15-min increments
Contra Costa Flood Control District
Oct-2011 to May-2013
IMP hydraulic review and model calibra-tion
Walden Park Commons Rainfall
Rainfall tipping bucket processed in 15-min increments
Contra Costa Flood Control District
Nov-2011 to May-2013
IMP hydraulic review and model calibra-tion
Los Medanos Rainfall Long-term rainfall in hourly incre-ments
Contra Costa Flood Control District
Jul-1974 to Aug-2013
Long-term model simulations for Fire Pre-vention Bureau site
FCD11 Rainfall in Mar-tinez
Long-term rainfall in hourly incre-ments
Contra Costa Flood Control District
Feb-1969 to Aug-2013
Long-term model simulations for Walden Park Commons site
Brentwood Evaporation Long-term ET data in hourly in-crements CIMIS Jan-1986 to Aug-
2013 Model calibration and long-term simula-
tions (with Los Alamitos ET data)
Los Alamitos Evaporation Long-term ET data in hourly in-crements EPA Basins software Jul-1948 to Dec-
1985 Long-term simulations combined with
Brentwood. Provided pre-1986 ET data.
1.4 Model Time Step Adjustment The HSPF models were adapted to run in either 15-minute or hourly time steps. The shorter time step pro-vided better resolution of the IMP hydraulic processes during the model calibration process whereas hourly time steps were needed for the long-term simulations to match the available input time series data sources. Several hydrologic variables are computed by HSPF in time-dependent units (e.g., inches per time step), so conversion factors were needed to allow the model to run with different time steps. These conver-sions are documented within the HPSF input files (i.e., the UCI files) and listed in Table 6.

4
Table 6. HSPF Model Time Step Adjustments and Conversion Factors
HSPF Block Description Conversion Factor Revision
NETWORK
Outflow from upper layer of IMP (HYDR) is computed in cfs whereas input to lower layer (IVOL) is computed in acre-feet per time step
For 15-minute time steps: CONVERSION = [1 FT3/S] * [1/43560 AC/FT2] * [900 S/TS] CONVERSION = 0.0207
For 1-hour time steps: CONVERSION = [1 FT3/S] * [1/43560 AC/FT2] * [3600 S/TS] CONVERSION = 0.0826
NETWORK
IMP inflows (IVOL) are com-puted in units of acre-foot per time step and these data are converted to cfs for reporting via the PLTGEN file
For 15-minute time steps: CONVERSION = [43560 FT3/AC-FT] * [1/900 TS/S] CONVERSION = 48.4
For 1-hour time steps: CONVERSION = [43560 FT3/AC-FT] * [1/3600 TS/S] CONVERSION = 12.1
NETWORK
Pre-project site runoff rates (PWATER SURO) are com-puted in units of inches per time step. These data are converted to cfs for report-ing via the PLTGEN file
For 15-minute time steps: CONVERSION = [43560 FT2/AC] * [1/12 FT/IN] * [1/900 TS/S] * [AREA in AC] CONVERSION = 4.0333 * [AREA in AC]
For 1-hour time steps: CONVERSION = [43560 FT2/AC] * [1/12 FT/IN] * [1/3600 TS/S] * [AREA in AC] CONVERSION = 1.0083 * [AREA in AC]
After the conversions were applied, the model outputs were tested through a QA/QC process to validate the results.
Section 2: Rainfall Characteristics This section supplements the description included in Section 6.1.1 of the HMP Model Calibration and Verifi-cation report, specifically the estimate of recurrence intervals for the storms that were recorded during the monitoring period.
To understand the monitored storm events within the context of long-term local rainfall characteristics, depth-duration-frequency curves were developed from the long-term hourly datasets recorded at the Los Medanos gauge and the FCD11-Martinez gauge. The following method was used to develop the curves:
5. The rainfall data was parsed into discrete storm events. A dry period of 24-hours was used to sepa-rate rainfall into distinct, independent events. The resulting set of storm events is called as a par-tial-duration series.
6. Each rainfall event was examined to determine the maximum amount of rain that occurred within specific periods of the storm (e.g., the maximum 3-hour accumulation, 6-hour accumulation) from durations of 1-hour to 72-hours.
7. The accumulations for each duration were ranked and assigned a recurrence interval using the Cunnane plotting position method (e.g., all 12-hour accumulations were ranked, all 24-hour accu-mulations were ranked).
8. A logarithmic regression relationship was developed to relate rainfall depth to recurrence interval for each storm duration from 1-hour to 72-hour. The regression equations were then used to com-pute curves shown in Figure 1 and Figure 2. The plots only include the computed durations up to 24-hours.

5
Figure 1. Depth-Duration Frequency curve for Los Medanos rain gauge. Curve was used to estimate the re-
currence interval for storms monitored at the Fire Prevention Bureau site.
Figure 2. Depth-Duration Frequency curve for FCD11-Martinez rain gauge. Curve was used to estimate the
recurrence interval for storms monitored at the Walden Park Commons site.

6
After the depth-duration-frequency curves were computed from the long-term rainfall datasets, similar par-tial-duration series rainfall accumulations were computed for the Fire Prevention Bureau and Walden Park Commons rain gauge data. The rainfall depth was computed for each significant storm for durations rang-ing from 1 hour to 72 hours. The accumulations were then compared to the long-term curves (either Figure 1 or Figure 2) to determine the recurrence interval for the monitored data.
Table 7 and Figure 3 provide an example of how the monitoring period storm recurrence intervals were es-timated. The 11/28/2012 storm data provided a total of 1.64 inches of rain at the Fire Prevention Bureau gauge and Table 7 lists the maximum rainfall accumulation for specific periods within the storm event. These data are plotted over the long-term Los Medanos depth-duration-frequency curve in Figure 3 to pro-vide context. The 11/28/2012 storm was approximately a 6-month to 1-year event for durations less than 6 hours. The 12-hour and 24-hour accumulations were approximately equal to a 2-year storm event.
Table 7. Rainfall Accumulations the 11/28/2012 Storm at the Fire Prevention Bureau
Duration (hour) Rainfall (in)
1 0.31
2 0.38
3 0.44
6 0.69
12 1.20
24 1.32
48 1.33
72 1.64

7
Figure 3. The 11/28/2012 storm event at the Fire Prevention Bureau was approximately a 2-year storm over a 12-hour duration.
Rainfall accumulations were compared to the depth-duration-frequency curves for all of the significant storm events listed in Table 6-2 and Table 6-3. The approximate recurrence interval was reported for 12-hour durations. This duration was selected because it balances both the short-term intensities and long-term accumulations that can affect IMP performance.
Section 3: HSPF Modeling Results This section supplements the discussion included in Section 6.2 and 6.3 of the HMP Model Calibration and Verification report. It describes he model calibration process in greater detail and provides long-term simu-lation results for all IMPs.
3.1 Model Parameter Adjustments This section describes how the model parameters were adjusted and provides additional example calibra-tion results.
3.1.1 Bioretention Soil Characteristics
As described in Section 6.1.3, Fire Prevent Bureau bioretention soils produces faster percolation rates ear-lier and respond earlier in storm events than was predicted by the HPSF model used to develop the HMP. Additionally, the Fire Prevention Bureau IMPs produced significantly more infiltration to surrounding soils than the HPSF model predicted. The model calibration effort focused on these two key differences.
Rainfall and water level monitoring data and modeling results were examined to approximate a) what level of soil moisture is needed to initiative percolation from the bioretention soil to the gravel layer and b) at what rate does the percolation occur. The bioretention soils appear to produce little percolation until the soils reach about 50 percent of saturation. At this point, percolation occurs rapidly. While the precise rate was difficult to isolate, the monitoring data suggested percolation rates of up to 7.5 inches per hour could occur.
The HSPF model’s representation of the bioretention soils was iteratively modified based on the percola-tion response of Fire Prevention Bureau IMP #6 for different storm events. The adjustments focused on a) allowing the bioretention soils to hold almost all runoff during small storm events and b) percolating the appropriate volume of stormwater to the gravel layer during large storm events.
Figure 4 illustrates how the percolation characteristics were adjusted by showing the soil moisture-percola-tion relationship used in the HMP models and the modified relationship that was developed by examining the Fire Prevention Bureau monitoring data. The calibrated relationship allows water to move rapidly into the gravel layer when the bioretention soils fill with water and provides the appropriate level of soil drying between storm events.

8
Figure 4. Soil moisture-percolation relationship for bioretention soils at the Fire Prevention Bureau
3.1.2 Infiltration to Surrounding Soils
The observed water level recession rates indicate that the NRCS Group D soils at the Fire Prevention Bu-reau allow for a greater level of infiltration than was expected when preparing the HMP. The HSPF model’s rate of infiltration from the IMP gravel layer to the surrounding soils was adjusted iteratively until the shape of the water level curve approximated the level monitoring data across the largest storm events.
Several gravel layer-to-surrounding soils infiltration rates were tested and the best-fit rate for Fire Preven-tion Bureau IMP #6 was 0.24 inches per hour. Figure 5, Figure 6 and Figure 7 show the model results for the 11/28/2012 storm event with infiltration rates of 0.20 in/hr, 0.24 in/hr and 0.28 in/hr, respectively. The closest match occurs with the 0.24 in/hr simulation.
The IMP #6 calibration was then applied to the other Fire Prevention Bureau IMPs. The simulation results and monitoring data were compared for IMP #2 and the model results provided a good approximation of the monitoring data. A similar comparison was not practical at IMP #4 due to its small dimensions at IMP #4 and lack of a defined gravel layer response to rainfall.

9
Figure 5. IMP #6 infiltration = 0.20 in/hr. Simulation > monitoring data
Figure 6. IMP #6 infiltration = 0.24 in/hr. Simulation ~ monitoring data
Figure 7. IMP #6 infiltration = 0.28 in/hr. Simulation < monitoring data

10
3.2 Long-Term Model Performance This section describes the process for setting up the long-term model simulations and using the results to assess the performance of the Fire Prevention Bureau and Walden Park Commons IMPs in comparison to the HMP’s peak flow and flow duration control standard.
3.2.1 Long-Term Simulation Setup
The calibrated models for the Fire Prevention Bureau IMPs and Walden Park Commons IMPs (see Section 6.3 for these examples) were used to prepare long-term simulations. The following steps were needed to prepare the long-term simulation models:
1. The FTABLE representations of the calibrated IMPs were copied into the HSPF long-term simula-tion input file.
2. The HSPF input file was linked to the long-term time series datasets described above in Table 5. The Fire Prevention Bureau simulations used hourly rainfall data collected at the Los Medanos gauge from 1974 through May 2013. The Walden Park Commons simulations used hourly data from the FCD11 gauge in Martinez from 1969 through May 2013. The evaporation time series da-taset was composed of Los Alamitos data (pre-1985) and Brentwood data (1986 and later).
3. The HSPF input file unit conversions were applied as needed for the long-term simulations hourly time steps (see Table 6 for details).
4. The list of variables included model’s time series output file (i.e., the PLTGEN file) were modified to allow for a comparison of pre-project and post-project conditions.
3.2.2 Long-Term Simulation Results
The long-term simulation outputs were evaluated using flow frequency statistics and flow duration statis-tics (see Section 6.3). Next, the IMP outflows were compared to pre-project flows to determine of the IMPs reduced peak flows and flow durations below pre-project levels. This section includes peak flow and flow duration graphics for all of the IMPs. Figure 8 through Figure 13 show results for the Fire Prevention Bu-reau site and Figure 14 through Figure 17 show results for the Walden Park Commons sites. All IMPs con-trol flows to down to the current 0.2Q2 lower control threshold. Additionally, the Fire Prevention Bureau sites control flows down to the 0.1Q2 lower control threshold. The Walden Park Commons sites do not meet the stricter lower control threshold.

11
Figure 8. Peak flow frequency comparison for pre-project runoff and post-project outflows
for Fire Prevention Bureau IMP #2
Figure 9. Flow duration comparison for pre-project runoff and post-project outflows
for Fire Prevention Bureau IMP #2
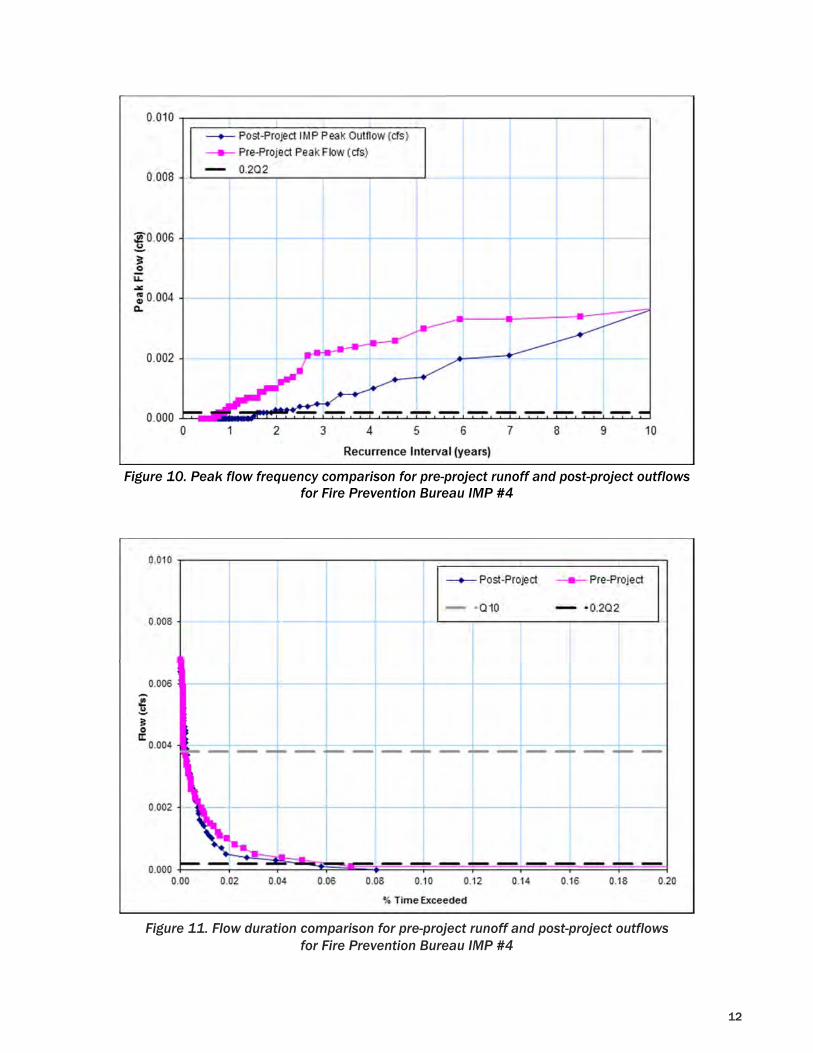
12
Figure 10. Peak flow frequency comparison for pre-project runoff and post-project outflows
for Fire Prevention Bureau IMP #4
Figure 11. Flow duration comparison for pre-project runoff and post-project outflows
for Fire Prevention Bureau IMP #4

13
Figure 12. Peak flow frequency comparison for pre-project runoff and post-project outflows
for Fire Prevention Bureau IMP #6
Figure 13. Flow duration comparison for pre-project runoff and post-project outflows
for Fire Prevention Bureau IMP #6

14
Figure 14. Peak flow frequency comparison for pre-project runoff and post-project outflows
for Walden Park Commons IMP #1 (North)
Figure 15. Flow duration comparison for pre-project runoff and post-project outflows
for Walden Park Commons IMP #1 (North)

15
Figure 16. Peak flow frequency comparison for pre-project runoff and post-project outflows
for Walden Park Commons IMP #2 (South)
Figure 17. Flow duration comparison for pre-project runoff and post-project outflows
for Walden Park Commons IMP #2 (South)