Embed Size (px)
Citation preview

IMP-I SPACECRAFT MAGNETIC TEST PROGRAM
by C. L. Parsons and C. A. Harris
Goddard Spuce Flight Center Greenbelt, M d .
N A T I O N A L AERONAUTICS AND SPACE A D M I N I S T R A T I O N 0 WASHINGTON, D.
https://ntrs.nasa.gov/search.jsp?R=19660012414 2019-03-28T15:49:38+00:00Z

TECH LIBRARY KAFB, NM
L ., . -., -- 0330244
NASA TN D-3376
IMP-I SPACECRAFT MAGNETIC TEST PROGRAM
By C. L. P a r s o n s and C. A. H a r r i s
Goddard Space Flight Center Greenbelt , Md.
NATIONAL AERONAUTICS AND SPACE ADMINISTRATION
For sale by the Clearinghouse for Federal Scientific and Technical Information Springfield, Virginia 22151 - Price $1.35
ABSTRACT
The magnetic tests of the IMP-I spacecraft (Explorer XVIII) include both individual component and integrated spacecraft test results. By having incorporated component testing in the early stages of the program, it was possible to obtain the following information: (1) individual com- ponent magnetic field disturbance magnitudes, (2) possible spacecraft field contribution due to assembled components, (3) to determine which components have excessive magnetic field, (4) a. means by which excessive field could be re- duced, and (5) possible results due to perming and deperm- ing effects.
Based upon the magnetic test results and upon the te- lemetered in-flight data, the design goal (magnetic) for the IMP-I w a s achieved.
ii

I
CONTENTS
Abstract . . . . . . . . . . . . . . . . . . . . . . . . . . . . . . . . . . . . . . . . . . . . . . . . . . . . . . . . INTRODUCTION . . . . . . . . . . . . . . . . . . . . . . . . . . . . . . . . . . . . . . . . . . . . . . . . . . . . TEST OBJECTIVES . . . . . . . . . . . . . . . . . . . . . . . . . . . . . . . . . . . . . . . . . . . . . . . . . TEST PLAN . . . . . . . . . . . . . . . . . . . . . . . . . . . . . . . . . . . . . . . . . . . . . . . . . . . . . .
Components Magnetic Field Measurements . . . . . . . . . . . . . . . . . . . . . . . . . . . . . . . Spacecraft Magnetic Field Measurements . . . . . . . . . . . . . . . . . . . . . . . . . . . . . . . .
TEST RESULTS . . . . . . . . . . . . . . . . . . . . . . . . . . . . . . . . . . . . . . . . . . . . . . . . . . . . . Components . . . . . . . . . . . . . . . . . . . . . . . . . . . . . . . . . . . . . . . . . . . . . . . . . . . . Spacecraft . . . . . . . . . . . . . . . . . . . . . . . . . . . . . . . . . . . . . . . . . . . . . . . . . . . . .
CONCLUSIONS AND RECOMMENDATIONS . . . . . . . . . . . . . . . . . . . . . . . . . . . . . . . . . Components . . . . . . . . . . . . . . . . . . . . . . . . . . . . . . . . . . . . . . . . . . . . . . . . . . . . Spacecraft . . . . . . . . . . . . . . . . . . . . . . . . . . . . . . . . . . . . . . . . . . . . . . . . . . . . .
ACKNOWLEDGMENT . . . . . . . . . . . . . . . . . . . . . . . . . . . . . . . . . . . . . . . . . . . . . . . . Bibliography . . . . . . . . . . . . . . . . . . . . . . . . . . . . . . . . . . . . . . . . . . . . . . . . . . . . . . Appendix A-Description of Spacecraft . . . . . . . . . . . . . . . . . . . . . . . . . . . . . . . . . . . . . Appendix B-Test Facilities . . . . . . . . . . . . . . . . . . . . . . . . . . . . . . . . . . . . . . . . . . . . Appendix C-Test Procedure . . . . . . . . . . . . . . . . . . . . . . . . . . . . . . . . . . . . . . . . . . . Appendix D-Test Activity Log . . . . . . . . . . . . . . . . . . . . . . . . . . . . . . . . . . . . . . . . . . Appendix E-Components Magnetic Test Data Summary Table . . . . . . . . . . . . . . . . . . . . . Appendix F-Components Magnetic Test Reports . . . . . . . . . . . . . . . . . . . . . . . . . . . . . . Appendix G-Facet C Comparison Data . . . . . . . . . . . . . . . . . . . . . . . . . . . . . . . . . . . . Appendix H- Atlantic Missile Range Magnetic Field Survey ....................... Appendix I-Perming Effects of Tools and Equipment ........................... Appendix J-Spacecraft Magnetic Check at Fredericksburg. Va ....................
ii
3
3
6
13
13
15
15
16
17
19
29
43
45
53
69
77
83
87
iii
r
IMP-I SPACECRAFT MAGNETIC TEST PROGRAM
by
Goddard Space Flight Center C. L. Parsons and C. A. Harris
INTRODUCTION
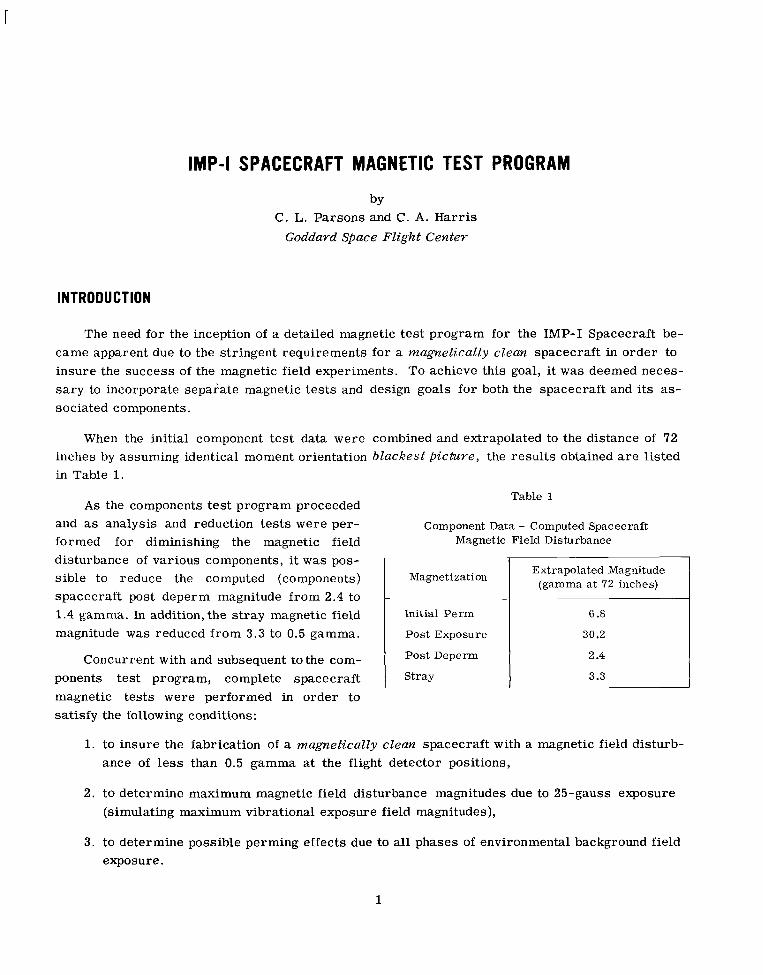
The need for the inception of a detailed magnetic test program for the IMP-I Spacecraft be- came apparent due to the stringent requirements for a magnetically clean spacecraft in order to insure the success of the magnetic field experiments. To achieve this goal, it w a s deemed neces- s a r y to incorporate separate magnetic tests and design goals for both the spacecraft and its as- sociated components.
When the initial component test data were combined and extrapolated to the distance of 72 inches by assuming identical moment orientation blackest picture, the results obtained a r e listed in Table 1.
As the components test program proceeded and as analysis and reduction tests were per- formed for diminishing the magnetic field disturbance of various components, it w a s pos- sible to reduce the computed (components) spacecraft post deperm magnitude from 2.4 to 1.4 gamma. In addition, the s t ray magnetic field magnitude was reduced from 3.3 to 0.5 gamma.
Concurrent with and subsequent to the com- ponents test program, complete spacecraft magnetic tests were performed in order to sat isfy the following conditions:
Table 1
Component Data - Computed Spacecraft Magnetic Field Disturbance
Magnetization
Initial Perm
Post Exposure
Post Deperm
Stray
Extrapolated Magnitude (gamma a t 72 inches)
6.8
30.2
2.4
3.3
1. to insure the fabrication of a magnetically clean spacecraft with a magnetic field disturb- ance of less than 0.5 gamma at the flight detector positions,
2. to determine maximum magnetic field disturbance magnitudes due to 25-gauss exposure (simulating maximum vibrational exposure field magnitudes),
3. to determine possible perming effects due to all phases of environmental background field exposure.
1
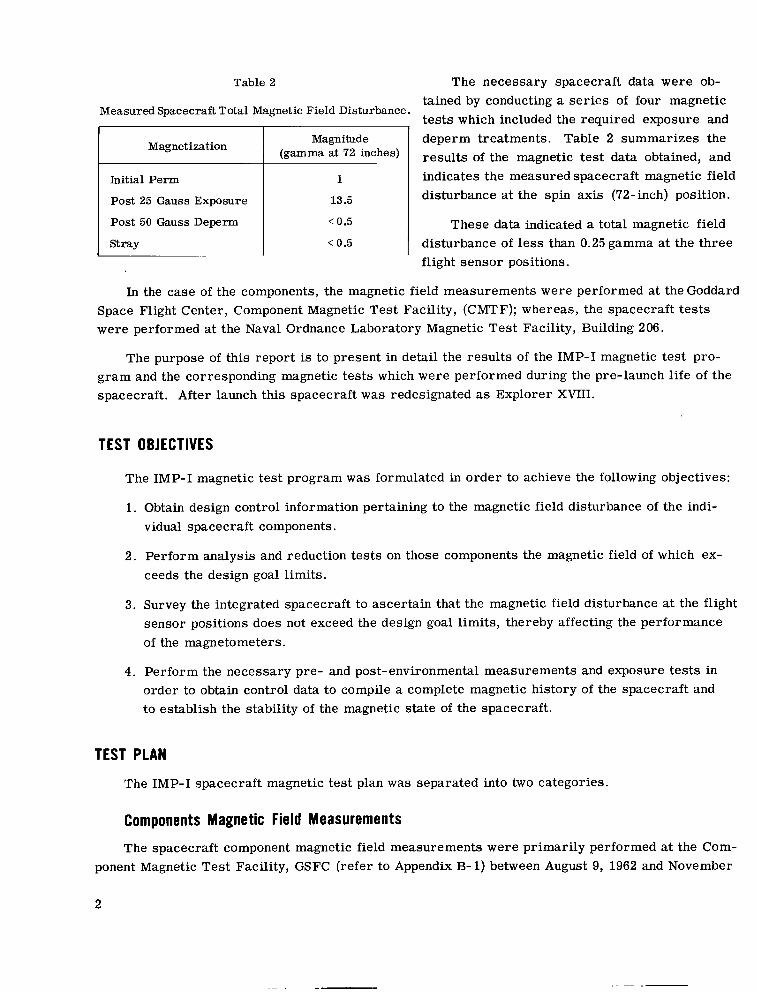
Table 2 The necessary spacecraft data were ob- tained by conducting a ser ies of four magnetic tests which included the required exposure and
Measured Spacecraft Total Magnetic Field Disturbance. -
Magnetization
Initial Perm
Post 25 Gauss Exposure
Post 50 Gauss Deperm
s t ray
Magnitude (gamma at 72 inches)
1
13.5
< 0.5
< 0.5
deperm treatments. Table 2 summarizes the results of the magnetic test data obtained, and indicates the measured spacecraft magnetic field disturbance at the spin axis (72-inch) position.
These data indicated a total magnetic field disturbance of less than 0.25 gamma at the three flight sensor positions.
In the case of the components, the magnetic field measurements were performed at the Goddard Space Flight Center, Component Magnetic Test Facility, (CMTF); whereas, the spacecraft tests were performed at the Naval Ordnance Laboratory Magnetic Test Facility, Building 206.
The purpose of this report is to present in detail the results of the IMP-I magnetic test pro- gram and the corresponding magnetic tests which were performed during the pre-launch life of the spacecraft. After launch this spacecraft was redesignated as Explorer XVIII.
TEST OBJECTIVES
The IMP-I magnetic test program was formulated in order to achieve the following objectives:
1. Obtain design control information pertaining to the magnetic field disturbance of the indi- vidual spacecraft components.
2. Perform analysis and reduction tests on those components the magnetic field of which ex- ceeds the design goal limits.
3. Survey the integrated spacecraft to ascertain that the magnetic field disturbance at the flight sensor positions does not exceed the design goal limits, thereby affecting the performance of the magnetometers.
4. Perform the necessary pre- and post-environmental measurements and exposure tests in order to obtain control data to compile a complete magnetic history of the spacecraft and to establish the stability of the magnetic state of the spacecraft.
TEST PLAN
The IMP-I spacecraft magnetic test plan was separated into two categories.
Components Magnetic Field Measurements
The spacecraft component magnetic field measurements were primarily performed at the Com- ponent Magnetic Test Facility, GSFC (refer to Appendix B- 1) between August 9, 1962 and November
2
- .

22, 1963. These component measurements generally included an initial test (pre-environmental) and a final test (post environmental). When applicable in the case of some components, various analysis and reduction tests were also performed. Appendix C-1 outlines the component test pro- cedure as adopted for measurements at the Component Magnetic Test Facility.
Spacecraft Magnetic Field Measurements
Due to the limitations of the Component Magnetic Test Facility, Le., size, fixturing, and perm- deperm capability, the spacecraft magnetic field disturbance measurements were performed at the Naval Ordnance Laboratory Magnetic Test Facility, Building 206 (refer to facility description in Appendix B-2) by GSFC Magnetic Test Section personnel with the assistance of NOL personnel. Four separate magnetic tests were performed at the NOL facility: deperm, initial, post vibration, and final. Appendix C-2 details the spacecraft magnetic test procedure for these tests as con- ducted at the NOL facility. Two separate spacecraft tests were performed prior to the environ- mental test sequence (balance, thermal-vacuum, and vibration) and subsequently, in order to de- termine the effects of the environmental testing, a special post-vibration exposure test w a s conducted. At the conclusion of the final vibration and balance tests, and prior to launch, the fourth and final magnetic test w a s performed.
TEST RESULTS
Components
The IMP-I spacecraft components and integral parts magnetic field measurements were ini- tiated in August 1962, and at this time, tests were performed on magnesium samples, which were to be utilized in the University of Chicago experiment. The actual components measurements be- gan later in December 1962, when an initial test w a s conducted on the Ames Proton Analyzer. Appendix D-1 is a log which summarizes the history of the component measurements. Since the Proton Analyzer's post 25-gauss exposure magnetic field disturbance magnitude was quite high (138 gamma at 18 inches), additional analysis and reduction tests were performed on the com- ponent and its integral parts. These tests indicated that the primary source of magnetic field con- tamination was the nickel wiring utilized within the circuit of the unit. A s a result of subsequent changes made by the experimenter, the magnetic field of this unit w a s then reduced to an acceptable level (post 25-gauss exposure magnitude less than 32 gammas at 18 inches). Data pertaining to this component as well as all other components tested, a r e presented in the-component summary table included in Appendix E. In addition to the Proton Analyzer, several other units had excessive perm fields. These units, after having been measured initially (as received state), were tested and analyzed in order to locate the possible sources of magnetic field contamination and subsequently cleaned up. Table 3 lists s ix components, the percentage of perm field reduction achieved and, the contributing sources of contamination. Further information pertaining to the analysis and reduc- tion tests and the sources of contamination is included in Appendix F.
3

Table 3
Components Perm Field Reduction Results.
Component
Proton Analyzer
Prime Converter
Ion Chamber
R vs dE/dx
Programmer #4
Relay and Despin Card
. .
Perm Field Magnitude in Gamma at 18 inches
Initial
138.4
117.6
51.4
118.0
34 .O
275.2
-
- - . .
Final
7.4
60.5
7.2
21.6
4.8
21.5 __
Reduction (%)
95
49
86
82
86
92
Prime Source of Magnetization
_ _
Nickel Wiring
Wiring and Components
P. S. Electronics Board
Photo Tubes and Leads
Relay
Relay .. -_
The problems encountered in the reduction of the permanent magnetic field disturbances varied with the component; notwithstanding this, the prime contributors were found to be wiring and leads, i.e., nickel ribbon wire, capacitor leads, and numerous transistor leads. An example of the prob- lems presented by magnetic wire leads would be a photo-multiplier tube (refer to R vs dE/dx test report Appendix F). When exposed, the photo-multiplier tube (similar to that in the R vs dE/dx telescope) was measured and determined to have a field magnitude of 71.1 gamma at 18 inches. When the leads were clipped short and measured separately by simulating the same special arrange- ment resulting from being attached to the tube, a field magnitude of 61.5 gamma w a s measured. By having cropped the leads as short as possible, the perm field of the tube was reduced 86 percent. Not only is it important to avoid the use of magnetic wiring in the construction of components, but, in addition, inner-connecting w i r e should also be non-magnetic. In the case of one range and range- rate unit (refer to Appendix F), it w a s determined that the harness had increased the perm field of the unit as much as 77 percent. Furthermore, the importance of continuous magnetic testing of parts and components cannot be overemphasized even when specified non- magnetic materials a r e utilized. To cite an example, one can refer to the case of the IMP spacecraft wiring harness (Ap- pendix F) which supposedly contained non-magnetic wire. In this particular instance one black insulated wire, 26 gauge w a s found to be magnetic while other sizes of the black wire, in addition to all other colors, were non-magnetic.
Another source of magnetic field disturbance which can be troublesome occurs when relays a r e incorporated in components. TWO possible solutions to this problem a r e cancellation by plac- ing two relays back-to-back o r replacement by selecting other equivalent types which a r e known to be less magnetic. The relay replacement method was utilized in the case of the programmer #4 card (Appendix G) and the relay and despin card by replacing the original relays with ones whose magnetic field was 1/10 as large (refer to components summary table Appendix E). Stray field (power on) analysis and reduction tests were also conducted on those components which exhibited excessive stray field magnetization. Table 4 lists such components and indicates the percentage reduction of the associated stray field achieved by compensation. As would be expected, units

Table 4
Components Stray Field Reduction Results.
Component
Battery
Pr ime Converter
Performance Parameter
E vs dE/dx
Stray Field Magnitude in Gamma at 18 inches
Initial
87.2
87.7
14.6
46.6
~
Final
4.9
4.2
1.6
3.5
Reduction (%)
95
95
93
93
Current (amperes)
n .s
2.5
5 &2
0.08
operating with currents above 1 ampere have rather high stray fields and require special attention. In the event where one is attempting to construct a magnetically clean spacecraft as in the case of the IMP, even low operating currents can generate excessive fields and require compensation, i.e., E v s dE/dx.
To prevent the creation of outside stray fields which might lead to erroneous stray field read- ings during the stray-field measurements, tightly twisted pair leads were used to connect the com- ponent to the external power supply. In order to achieve stray field reduction, two techniques were utilized: (1) rewiring the circuit ' to avoid current loops and (2) adding to the circuit special com- pensation loops. When the compensation loops were used to reduce or cancel the stray field (method 2), it became necessary to conduct additional tests in order to determine the most effec- tive loop size and position required for obtaining the desired field levels (stray field disturbance of < 5 gamma at 18 inches). A s indicated in Table 4, over 90 percent stray field reduction w a s ac- complished for each of the four listed components. Although the stray field could be reduced to a level of 10 gamma without much difficulty, for those levels of less than 10 gamma the positioning of the compensation loop became quite critical. Thus, to insure that the loop had not shifted ap- preciably after having been properly located, post-plotting checks were also performed.
The E vs dE/dx power supply is one example of a part which employed compensation loops (Appendix F). With the proper number of compensation loops, it w a s possible to reduce the stray field at 18 inches from 7 . 5 to 2.4 gamma for this sample unit. A s a result, by compensating the power supply it was further possible to reduce the s t r ay field of the complete unit. In effect, these compensation loops can either be return current leads whose fields a r e in opposition to that of the offending source or, they can consist of an expanded auxiliary loop which has been twisted 180 degrees to obtain the desired cancellation. Again in the case of the E vs dE/dx experiment, a problem arose with the use of a non-toroidal inductor which because of its permeable material, created a stray field problem. By switching to a toroid, this problem was thereby eliminated.
Due to the fact that the components (and spacecraft) a r e exposed to magnetic fields in excess of the ambient geomagnetic field (0.6 gauss) especially during the vibration phase of the environmental
5
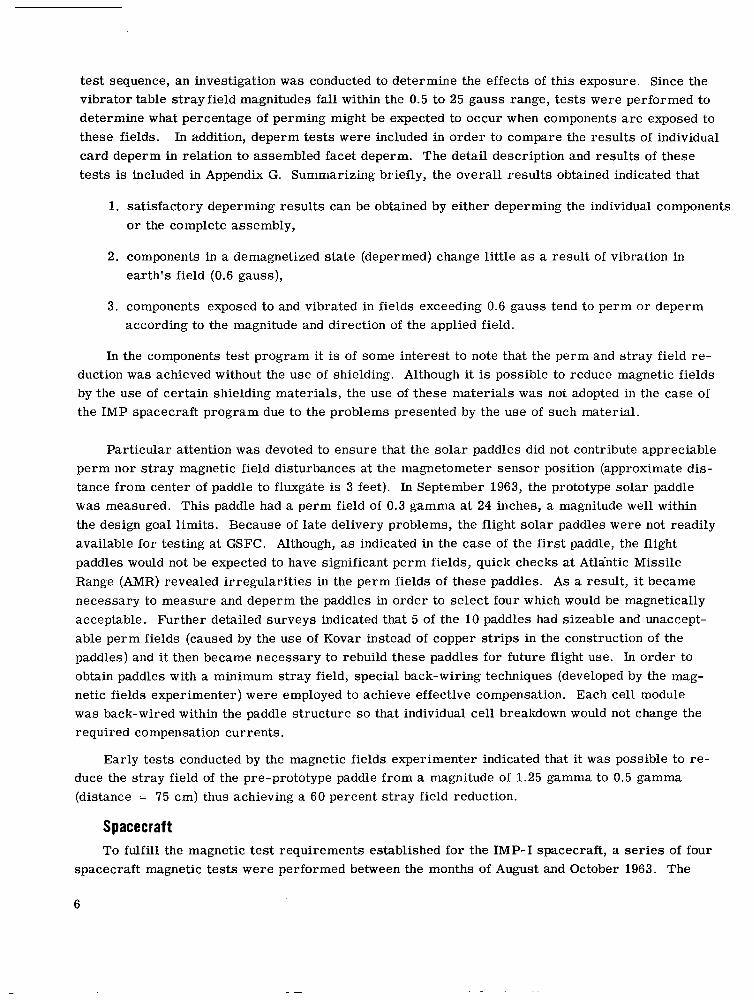
test sequence, an investigation was conducted to determine the effects of this exposure. Since the vibrator table stray field magnitudes fall within the 0.5 to 25 gauss range, tests were performed to determine what percentage of perming might be expected to occur when components a r e exposed to these fields. In addition, deperm tests were included in order to compare the results of individual card deperm in relation to assembled facet deperm. The detail description and results of these tests is included in Appendix G . Summarizing briefly, the overall results obtained indicated that
1. satisfactory deperming results can be obtained by either deperming the individual components o r the complete assembly,
2. components in a demagnetized state (depermed) change little as a result of vibration in earth's field (0.6 gauss),
3. components exposed to and vibrated in fields exceeding 0.6 gauss tend to perm o r deperm according to the magnitude and direction of the applied field.
In the components test program it is of some interest to note that the perm and stray field re- duction was achieved without the use of shielding. Although it is possible to reduce magnetic fields by the use of certain shielding materials, the use of these materials was not adopted in the case of the I M P spacecraft program due to the problems presented by the use of such material.
Particular attention was devoted to ensure that the solar paddles did not contribute appreciable perm nor s t r ay magnetic field disturbances at the magnetometer sensor position (approximate dis- tance from center of paddle to fluxggte is 3 feet). In September 1963, the prototype solar paddle was measured. This paddle had a perm field of 0.3 gamma at 24 inches, a magnitude well within the design goal limits. Because of late delivery problems, the flight solar paddles were not readily available for testing at GSFC. Although, as indicated in the case of the first paddle, the flight paddles would not be expected to have significant perm fields, quick checks at Atlantic Missile Range (AMR) revealed irregularities in the perm fields of these paddles. A s a result, it became necessary to measure and deperm the paddles in order to select four which would be magnetically acceptable. Further detailed surveys indicated that 5 of the 10 paddles had sizeable and unaccept- able perm fields (caused by the use of Kovar instead of copper s t r ips in the construction of the paddles) and it then became necessary to rebuild these paddles for future flight use. In order to obtain paddles with a minimum stray field, special back-wiring techniques (developed by the mag- netic fields experimenter) were employed to achieve effective compensation. Each cell module was back-wired within the paddle structure so that individual cell breakdown would not change the required compensation currents.
Early tests conducted by the magnetic fields experimenter indicated that it was possible to re- duce the stray field of the pre-prototype paddle from a magnitude of 1.25 gamma to 0.5 gamma (distance = 75 cm) thus achieving a 60 percent s t ray field reduction.
Spacecraft To fulfill the magnetic test requirements established for the IMP-I spacecraft, a ser ies of four
spacecraft magnetic tests were performed between the months of August and October 1963. The
6

Table 5
IMP-I Spacecraft Magnetic Tests.
No.
1.
2.
3.
4.
Test
Deperm
Initial
Post Environmental Exposure Final
Measurements
Perm, Deperm
Perm, Exposure, Stray, Deperm
Perm
Perm, Deperm
Condition
Pre- Environm ental
Pre-Environmental
Post Vibration
Post Environmental
Date
8/8/63
8/12-13/63
9/16/63
10/23/63
tests which were performed and the corresponding test procedures have been previously discussed under the test plan for spacecraft magnetic field measurements. Table 5 indicates the four tests, dates, and the specific measurements conducted.
Each of these tests included initial perm* and post deperm (when applicable) data, whereas, the initial test (August 12-13, 1963) included exposure and stray field measurements as outlined in the spacecraft test procedure (Appendix C-2). Although the spacecraft tests provided valuable design control data, the primary goal of these tests was to ensure that the magnetic field disturb- ance attributed to the spacecraft w a s less than 0.25 gamma at the flight detector positions. In ad- dition to the actual spacecraft tests, special tests and magnetic surveys were performed in order to determine those areas and those possible conditions which might tend to produce substantial changes in the magnetic field characteristics of the spacecraft; i.e., environmental testing and AMR pre-launch checks. The background magnetic field surveys of environmental test a r eas in Building 7, GSFC (thermal-vacuum, solar simulation, and vibration) indicated the presence of ambient background fields whose magnitudes corresponded to that of the regional geomagnetic field (0.6 gauss) except in the near vicinity of the vibration exciter tables. (Appendix G, Tables IV and V). In the case of the vibrators, the dc-field magnitudes ranged from 1 to 25 gauss depending upon the type of exciter table and the relative location about the table. By performing measure- ments on the spacecraft before and after the vibrational tests, it was possible to determine any magnetic field change which had occurred as a result of the vibrational field exposure. These data combined with the facet- C test results (Appendix G) provided reliable information concerning the perming effects which might be expected in the case of the IMP spacecraft. Additionally, it was possible to determine the perming effects resulting from normal spacecraft handling and move- ment by measuring the spacecraft before and after transporting the spacecraft to and from GSFC, NOL, and Fredericksburg Magnetic Observatory (FMO). In July 1963, a special magnetic-field survey was performed by Magnetic Test Section personnel at the Atlantic Missile Range in order
‘Initial perm measurements are performed during the various magnetic tests by measuring the permanent magnetization of the item while it is in the “as received” state and should be differentiated from other permanent magnetization states (Post Exposure, Post Deperm). The purposes of these initial measurements are (1) to show one possible level of perm which may exist for a newly manufactured item of the same design, (2) to obtain data which woald indicate what significant changes, if any, occurred after the previous test mensure- ments, and (3) to obtain a relative magnitude of field which is used to determine the effectiveness of the deperm treatment.
7

to obtain ambient magnetic field data, The three areas in which the spacecraft ordinarily would be located were surveyed at this time; be., checkout and storage building, spin facility, and launch complex. Although it was determined that the ambient magnetic-field magnitude was less than 1 gauss (Appendix H), a check was conducted on hand tools on a rack located in the spin facility and some were found to possess substantial magnetic fields. As a result of the AMR tool measure- ments, additional data were obtained at the Component Test Facility, GSFC, that illustrated the possible magnetizing effects resulting from the use of magnetic tools (Appendix I). Since tools of this type a r e normally used when working on the spacecraft, special provisions were made to in- sure that these tools remained in a demagnetized state by the use of a portable ac deperming coil.
Depevm Test Results
On August 8, 1963, prior to a calibration of the spacecraft flwgate and rubidium magnetom- eters* at the controlled zero field coil facility at Fredericksburg Magnetic Observatory, the IMP-I spacecraft w a s delivered to the NOL Test Facility, Building 206, for a magnetic survey and
210' 2W' l9O0
350' 340' 330° :ET IO-
320- 40'
Figure 1 -Magnetic f ie ld disturbance of spacecraft - Radial component (Hx). In i t ia l permanent magnetization i n gamma a t 27.8 inches.
deperm. At this time, the magnetic field dis- turbance of the spacecraft w a s measured and both rotational and fall-off data were obtained (refer to the IMP-I spacecraft magnetic test procedure included in Appendix C-2). Figure 1 is a polar graph representation of the magnetic field disturbance (radial component) of the space- craft as initiallymeasured. It should be noted that a simple dipole representation was not achieved due to the fact that the field magnitude was not measured at a distance of at least 3 times the overall dimension of the spacecraft (90 inches). Figure 2, indicates the facet arrangement for the spacecraft and its associated components. Because of the low fields associated with the spacecraft, particularly after deperming (Fig- ure 3), the measurements were performed at the indicated nearer distance. By referring to the magnetic- field change- versus- distance curves (fall off) shown on the logarithmic graphs in Figure 4, one notes that the radial component field diminished by the l/r5 instead of the ex- pected l/r3. However, then the data a r e read- justed so that the center of the facet nearest the detector (facet F) is considered to be the source of field (a reasonable assumption due to the facet
*In the case of the calibration checks at FMO, these checks were performed by the experimenter with the assistance of FMO personnel. Appendix J outlines the calibration procedure a s performed with the IMP-I spacecraft.
8

PROGRAMMER 4 PROGRAMMER 3 FLUXGATE ELECTRONICS A ION CHAMBER FLUXGATE SIGNAL PROCESSER PROTON ANALYZER \
GEIGER COUNTER TELESCOPE PROGRAMMER 1 PROGRAMMER 2 /
ENCODER CONVERTER TELEMETRY ENCODER DDP MOD C DDP MOD D OA SENSOR DDP M O D B O A CONVERTER
THERMAL ION EXPERIMENT FLUXGATE ELECTRONICS B SOLAR ARRAY REGULATOR PRIME CONVERTER
E vs dE/dX ELECTRONICS 2 E vs dE/dX ELECTRONICS 1 E vs dE/dX SENSOR TRANSMITTER OPTICAL ASPECT
ELECTRON ICs RANGE & RANGE RATE 3 RANGE & RANGE RATE 2 RANGE & RANGE RATE 1 PARAMETER RELAY & DESPIN TIMER
PLASMA ?ROBE ELECTRONICS 1 PLASMA PROBE ELECTRONICS 2 P L A S M A ?ROBE SENSOR
\ MULTI - CONVERTER R vs dE/dX 1 R vs dE/dx 2 CHICAGO RANGE SENSOR
Figure 2-IMP-I (Explorer XVIII) Spacecraft.
configuration and separation distances) the field falls off by the l/r 3 . In Figure 4, the fall-off data shows the spacecraft field magnitude to be less than 0.5 gamma at the sensor position. At the con- clusion of the initial perm measurements, the spacecraft received a spin axis deperm (Appendix C-2 111 E), and w a s then remeasured. The peak-to-peak rotational data obtained indicated that the vertical component (H,) magnitude of the spacecraft field had been reduced 71 percent (from 7 to 2 gamma). In the case of the radial component (Hx), only a 53 percent reduction w a s achieved (60 gamma to 28 gamma); however, after a second deperm treatment with the field directed along the horizontal axis of the spacecraft (Appendix C-2 I11 D) the peak-to-peak magnitude was reduced to 5 gamma (a 92 percent reduction of the initial magnitude). At the completion of the f u l l deperm treatment, the magnetic field disturbance at the three detector positions w a s less than 0.5 gamma. In addition, the resultant magnetic moment of the spacecraft was less than 31 cgs units.
Initial Test - August 12-13, 1963
Following the spacecraft magnetometer performance checks at FMO, the spacecraft was re- turned to NOL for intensive perm and s t r ay checks. After the brief initial perm measurements, the spacecraft w a s then exposed (spin and horizontal axes) to a 25 gauss dc field. While in the ex- posed state, rotational and fall-off data were obtained. In this state it was determined that the magnetic moment of the spacecraft had increased by a factor of twelve (moment magnitude of ,377 cgs units). Although the field of the spacecraft in the exposed state w a s quite high, the data obtained
9

40' 320'
3' 310'
60' 3"
70' 290'
80' 280C
90D 270'
100- 260'
110- 250'
120- 240-
130' 230-
140' 220-
Figure
Radial net i zai
320' 40-
310' 50-
3WO 60°
290- 70'
280' 80'
270' 90-
\ \ \
-\ - 1 1
\ \ \ \ \ \ \ \ - I 1 1 1 1
1c
L I I I U \ 10 100
DISTANCE (inches)
( a ) Center of facet F ( b ) Center of Spacecraft 3-Magnetic f i e ld disturbance of spacecraft - component (H~). post deperm permanent mag- Figure 4-Magnetic f ie ld change versus distance ( fa l l -
.ion i n gamma a t 27.8 inches. o f f ) from Facet F. In i t ia l perm.
during the component tests tended to indicate such an increase could be expected with the applica- tion of a 25-gauss exposure field. Figure 5, is a polar graph which represents post exposure mag- netic field disturbance of the spacecraft as measured at the mid-height and 27.8-inch distance position. Again, in the case of fall-off, the post exposure magnetic field along the flwgate "A" boom axis exceeded the inverse cube power (3.5 power); however, with the facet center distance adjust- ments the inverse cube falloff is substantiated as indicated in Figure 6. In the case of the measure- ments along the spin axis, as shown in Figure 7 an inverse cube falloff could be directly related to the center of the spacecraft (mid-height of facets). Upon application of the deperming treatment, the field of. the spacecraft (exposed state)was reduced to a level comparable to the post deperm magni- tude on August 8, 1963. Table 6 tabulates the magnetic field disturbance magnitudes at the three flight detector positions for the initial perm, post exposure and post deperm conditions and includes as well the other test results. Figure3 shows that at a distance of 27.8inches (from the center of the spacecraft), the magnetic field disturbance is approaching a magnitude of less than 1 gamma after deperming. Since the perm measurements were made with the spacecraft non-operative (no power), separate measurements were obtained with the spacecraft power on. Figure 8 is a polar graph which represents the stray magnetic field change which occurred as power w a s applied to the
10
I

0
P O S T E X P O S U R E P E R M A N E N T \
10-
$ 1 v
L y - 0 3 - c z -
0.1 '-1 1
Figure off)
\ \
\ - L A ,3.5 *
\ \
I I , , , , ,
100 DISTANCE ( fee t )
( a ) Center of Facets ( b ) Center of Spacecraft
6-Magnetic f ie ld change versus distance ( fa l l - along fluxgate-A boom Axis. Post expsoure.
Figure 5-Magnetic f i e ld disturbance of spacecraft - Radial component (Hx). Post exposure i n gamma at 2.7 inches. spacecraft. A s indicated in Figure 8, an 11 gamma
s t r ay field disturbance existed in the direction of facet H. Also, as the thermal Ion and Elec-
tron (%E) experiment calibration cycle occurred, an additional stray field pulse of 11 gammas was detected. Since this field was not directed towards either fluxgate A o r B and is of short duration it does not affect the magnetometers; * thus the stray magnetic field disturbance is less than 1/2 gamma at the flight detector positions (refer to Table 6).
The s t r ay magnetic field measurements also included a check on the solar paddle loading circuit in order to detect any large s t r ay field loops which might have been created by improper wiring.7 The spacecraft measurements were performed without the solar paddles attached to the space- craft; however, separate detailed solar paddle magnetic surveys were conducted at the Component Magnetic Test Facility (refer to Appendix E for component summary table data). The stray mag- netic field moment of the spacecraft was determined to be 530 cgs units.
*The I&E experiment i s not normally energized by the spacecraf t power system during the magnetic field measurements.
t An example of such a magnetic field disturbance i s that of the UK I1 spacecraft ,
These five current calibration s t eps occur at a time other than during the Rb magnetometer measuring sequence.
disturbance of 3 gamma at a dis tance of 53-3/4 inches from the center of the spacecraft that was attr ibuted to such a circuit . which had a spin ax i s s t ray field magnetic field
11

\
\ \ \ \ \ \ \ \
DISTANCE (feet)
40' 320'
50' 310'
60' 3W'
70' 290'
800 280'
PO' 270'
100' 260'
I 10' 250'
1200 240'
130' 230'
140' 220'
Figure 8-stray magnetic field disturbance of spacecraft - Radial component (Hx). (Magnitude i n gamma a t 27.8 inches. )
Figure 7-Magnetic field change versus distance (fall- off) along spin axis. Post exposure.
Table 6
IMP-I Spacecraft - Magnetic Test Results, Total Magnetic Field Disturbance in Gamma at Flight Sensor Positions
Magnetization
Initial
Post Deperm
Initial
Post Exposure
Post Deperm
Stray
Initial
Initial
Post Deperm - ..
*Measured **Extrapolated by l / r3 .
12
_ _ _ ~
Test Date
8/8/63
8/8/63
8/12
8/12
8/13
8/13
9/6
10/23
10/23 -
320' 40'
310. M.
300. 60'
290' 70'
280. 80.
270' PO.
260. 100.
2500 110'
240. 120'
230' 130.
220- 140'
Fluxgate "A" 82"*
<1
4 2
- 7
< 1/2
<1/2
< 1/2
< 1/2
< 1/2 -~ . - .-
.- ~-
Fluxgate "B" 82"*
<1 ..
< 1/2
- 4
< 1/2
< 1/2
< 1/2
< 1/2
< 1/2
-
Rubidium 72'!*

r
Final Test - October 23, 1963
The IMP-I spacecraft received a final deperm prior to being shipped to AMR. At this time the spacecraft was measured initially, depermed, and then remeasured. Although initially a mag- netic field disturbance of 7 gamma was measured at the spin axis detector position of 72 inches, this field was reduced to l e s s than 1 gamma after the deperm treatment. In addition, the mid- height peak-to-peak magnetic field disturbance w a s reduced 65 percent (from 34 to 12 gamma) re- sulting in a magnetic field disturbance at the fluxgate sensor position of less than 0.5 gamma. At the time of this test, the geiger counter telescope was not integrated in the spacecraft (facet E); however, it w a s depermed separately prior to integration into the spacecraft (refer to component test summary table in Appendix E). Since the spacecraft was revibrated between the time of the post-vibration test and the final test, this field of 7 gamma (spin axis) equivalent to a perm increase of 54 percent, indicates that the spacecraft had been exposed to a field with a magnitude of approx- imately 10 gauss.
CONCLUSIONS AND RECOMMENDATIONS
Components
The value of the components magnetic test program has been demonstrated simply on the basis of the final test results obtained. These data which show the magnetic field disturbances of numer- ous components whose magnitudes were reduced to desirable design goal limits a r e presented in the components summary tables in Appendix E. In addition, the overall effectiveness of the test program can be shown by combining all the components* data (normal spacecraft composition) and comparing the init ial test magnitudes with the final test results. Table 7 separately totals both the initial test results and the successive o r final test condition results. With these data it is also possible to determine the overall perm and stray field reduction achieved. The percentage reduc- tion for each condition is also indicated in Table 7.
Table 7
Component Magnetic Field Reduction Results.
Magnetization
Initial P e r m
Post Exposure
Post Deperm
Stray
Magnetic Field Magnitude in Gamma at 18 inches
Initial Results - 431.9
1932.9
152.9
209.4
Final Results
160.3
1396.5
89.8
33.0
Reduction (%)
71 *The simplest method of summarizing was adapted (i .e. , a l l moments are considered to have the same orientation) so that it was possible to add the component mag'nitudes to obtain the total magnitude. Due to the design of the spacecraft aod the component fabrication tech- niques, it i s expected that the individual cards would have quite similar magnetic moment orientations. This would be the c a s e espe- cially subsequent to the 25-gauss exposure where the moments would be directed primarily along the spin axis of the spacecraft.
13
L
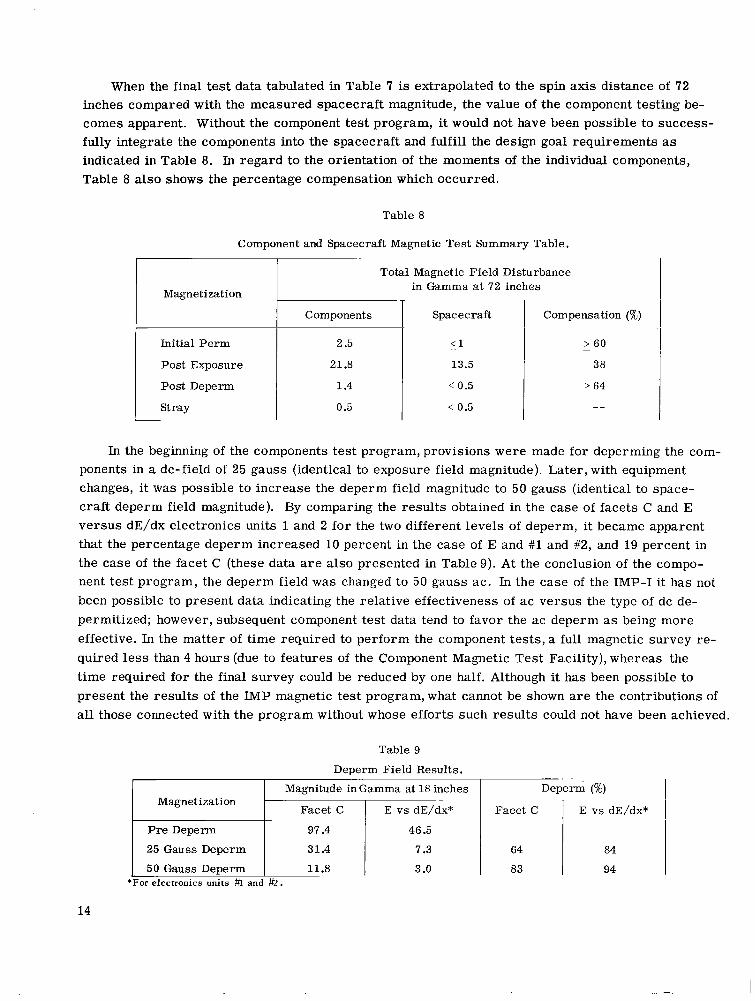
When the final test data tabulated in Table 7 is extrapolated to the spin axis distance of 72 inches compared with the measured spacecraft magnitude, the value of the component testing be- comes apparent. Without the component test program, it would not have been possible to success- fully integrate the components into the spacecraft and f u l f i l l the design goal requirements as indicated in Table 8. In regard to the orientation of the moments of the individual components, Table 8 also shows the percentage compensation which occurred.
Spacecraft
<1
13.5
< 0.5
0.5 < 0.5
-
I Components
Table 8
Component and Spacecraft Magnetic Test Summary Table.
Compensation (%)
> 60
38
> 64
-
_ _
Magnetization
97.4
31.4
11.8
Initial Pe rm
Post Exposure
Post Deperm
stray
46.5
7.3
3 .O
In the beginning of the components test program, provisions were made for deperming the com- ponents in a dc-field of 25 gauss (identical to exposure field magnitude). Later, with equipment changes, it was possible to increase the deperm field magnitude to 50 gauss (identical to space- craft deperm field magnitude). By comparing the results obtained in the case of facets C and E versus dE/dx electronics units 1 and 2 for the two different levels of deperm, it became apparent that the percentage deperm increased 10 percent in the case of E and #1 and #2, and 19 percent in the case of the facet C (these data a r e also presented in Table 9). A t the conclusion of the compo- nent test program, the deperm field was changed to 50 gauss ac. In the case of the IMP-I it has not been possible to present data indicating the relative effectiveness of ac versus the type of dc de- permitized; however, subsequent component test data tend to favor the ac deperm as being more effective. In the matter of time required to perform the component tests, a full magnetic survey re- quired less than 4 hours (due to features of the Component Magnetic Test Facility), whereas the time required for the final survey could be reduced by one half. Although it has been possible to present the results of the IMP magnetic test program, what cannot be shown are the contributions of all those connected with the program without whose efforts such results could not have been achieved.
Table 9
Deperm Field Results. I
I Magnetization
Pre Deperm
25 Gauss Deperm
50 Gauss DeDerm *For electronics uni ts #l a n
Magnitude in Gamma at 18 inches
Facet C
64
83
~ ~~
Deperm (%)
E vs dE/dx*
84
94
14
. .. -

Spacecraft
Based upon the magnetic test results and the in-flight measurements,* the IMP-I aptly achieved the magnetic field disturbance design goal by providing an integrated spacecraft whose total mag- netic field disturbance was l e s s than 0.25 gamma at the extended flight sensor positions. Although, as indicated by the component test results, it w a s possible to produce a magnetically clean space- craft, deperm treatments were utilized in order to remove any perming effects which may have resulted from the environmental test sequence. Because of the structural arrangement of the spacecraft and the location of the rubidium magnetometer, particular attention w a s paid to the radial component field magnitude along the spin axis. The measurements and tests performed con- cerning the possible perming effects resulting from exposure during environmental testing com- bined with the in-flight results* indicated that the spacecraft could be depermed after the environ- mental tests and then be expected to remain in this depermed state through calibration checks, earth's field exposure, shipping, and probably through launch.
The overall results obtained have clearly indicated the success of the IMP magnetic test pro- gram; and, even though the results obtained with successive IMP spacecraft have been as fruitful, the data obtained have indicated that minor physical changes can cause a significant change in the magnetic field characteristics of a spacecraft even where similar components a r e utilized. A s a result, continued, if not intensive, component and spacecraft testing is important to insure the further success of the program. The IMP-I was the first of a new spacecraft series, and as such, much w a s learned about the magnetic testing of this type of a spacecraft. Consequently, with the testing of successive IMP spacecraft, i.e., 02, 03, certain additional refinements have been utilized in the tests which have added even more background information as well as improving the relative accuracy of the measurement data.
ACKNOWLEDGEMENT
A major portion of the burden of insuring the assembly of a magnetically clean spacecraft w a s assumed by the magnetic fields experimenter, D r . Norman F. Ness, and members of his section who actively participated in the magnetic test program.
The success of the component test program was due in part to the availability of the Compon- ent Magnetic Test Facility at the Goddard Space Flight Center. Mr . William D. Kenney w a s the principal engineer responsible for the design and development of this facility which was efficiently operated by members of the Magnetic Test Section.
Magnetic tests of the completed spacecraft were performed at the Magnetic Test Facility at the U. S. Naval Ordnance Laboratory. The cooperation and assistance of Mr. James Ford and members of the facility staff is gratefully acknowledged.
*Ness, N. F., C. S. Scearce, and J. 8. Seek, Initial Results of the IMP-I Magnetic Field Experiment, J . Geophys. Res . . 69(17):3542, September 1, 1964.
15

The calibration of flight magnetometers was performed at the Fredericksburg Magnetic Ob- servatory of the Coast and Geodetic Survey, of the Environmental Services Administration. The cooperation and assistance of Mr. Richard Kuberry and members of the observatory s ta f f is grate- fully acknowledged.
BIBLIOGRAPHY
Heppner, J . P., Ness, N. F., Scearce, C. S., and Skillman, T. L., "Explorer 10 Magnetic Field Measurements," J. Geophys . Res . 68(1):1-46, January 1, 1963.
Ness, N. F., Scearce, C. S., and Seek, J . B., "Initial Results of the Imp I Magnetic Field Experi- ment," J. Geophys . R e s . 69(17):3531-3569, September 1, 1964.
Ness, N. F., "The Magnetohydrodynamic Wake of the Moon," J. Geophys . R e s . 70(3):517-534, February 1, 1965.
Ness, N. F., "Magnetic Field Restraints for IMP'S F and G," GSFC Document X-672-64-167, July 1964.
Ness, N. F., "The Earth's Magnetic Tail," GSFC Document X-612-64-392, December 1964 (re- vised, January 1965).
Ness, N. F., and Wilcox, J. M., "On the Solar Origin of the Interplanetary Magnetic Field," GSFC Document X-612-64-250, August 1964.
16
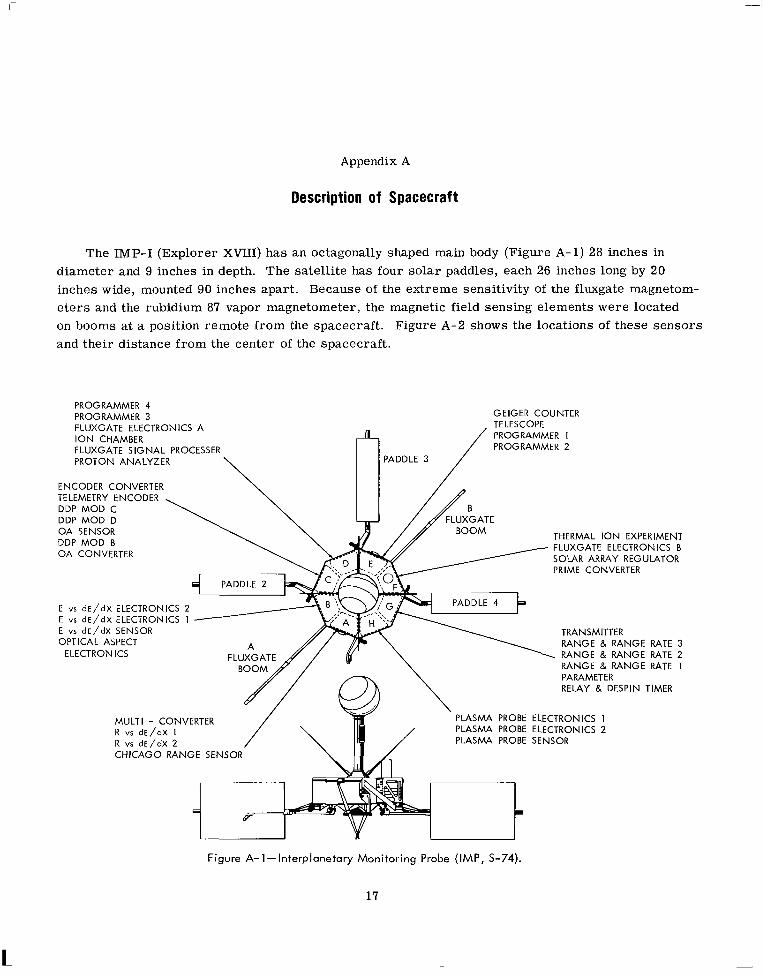
Appendix A
Description of Spacecraft
The IMP-I (Explorer XVIII) has an octagonally shaped main body (Figure A-1) 28 inches in diameter and 9 inches in depth. The satellite has four solar paddles, each 26 inches long by 20 inches wide, mounted 90 inches apart. Because of the extreme sensitivity of the flwgate magnetom- eters and the rubidium 87 vapor magnetometer, the magnetic field sensing elements were located on booms at a position remote from the spacecraft. Figure A-2 shows the locations of these sensors and their distance from the center of the spacecraft.
PROGRAMMER 4 PROGRAMMER 3 GEIGER COUNTER FLUXGATE ELECTRONICS A TELESCOPE I O N CHAMBER FLUXGATE SIGNAL PROCESSER
PROGRAMMER I / PROGRAMMER 2 PROTON ANALYZER
ENCODER CONVERTER TELEMETRY ENCODER DDP MOD C DDP MOD D OA SENSOR DDP MOD B OA CONVERTER
THERMAL ION EXPERIMENT FLUXGATE ELECTRONICS B SOLAR ARRAY REGULATOR PRIME CONVERTER
E vs dE/dX ELECTRONICS 2 E vs dE/dX ELECTRONICS 1 E vs dE/dX SENSOR OPTICAL ASPECT
ELECTRON ICs E Z Y " ' k G E RATE 3 RANGE 8, RANGE RATE 2 RANGE 8, RANGE RATE 1 PARAMETER RELAY & DESPIN TIMER
MULTI - CONVERTER R vs dE/dX 1 R vs dE/dX 2
PLASMA PROBE ELECTRONICS 1 PLASMA PROBE ELECTRONICS 2 / PLASMA PROBE SENSOR
CHICAGO RANGE w SENSOR
F Figure A-1-Interplanetary Monitoring Probe (IMP, 5-74).
17

65 "
- MAIN BODY
Figure A-2-Sketch o f the IMP Spacecraft i l lustrat ing location of fluxgate and rubidium magnetometer sensor.
18

Appendix B
Test Facilities
B-1 Component Magnetic Test Facility - (CMTF-GSFC)
Introduction
The Component Magnetic Test Facility w a s built primarily as a zero magnetic field facility for the testing of OGO spacecraft components. By the addition of a smaller sized gimbal fixture, the facility fulfilled the magnetic field measurement requirements of the IMP spacecraft program.
For a complete description of this facility see GSFC Document No. X-325-65-312, dated July 1965, entitled Component Magnetic Test Facility - Operations and Test Procedure Manual.
Building
The Component Magnetic Test Facility is housed in a wooden frame building (Figure B-1) 20 X 20 X 20 feet in size. Because of the urgent needs of the OGO program, the building w a s con- structed of conventional materials, i.e., wood, concrete, steel nails, steel bolts, and composition roofing. However, within the confines of the coils, all materials used are non-magnetic.
Coil System
The CMTF coil system consists of three orthogonal sets of square modified Helmholtz coils (Figure B-2) with a spacing of b = 0.6a (a = side length of coil). Table B-1 summarizes the dimensions and constants for the coils.
Normally, the coils are operated in the zero field mode by producing the following cancellation fields under the listed current conditions:
Coil Current (amps) Field (gamma)
X 1.22 13,200 Y 1.32 14,200 z, 0.89 56,000
-
0.89 Combined magnitude z2
With the external paver supply current adjusting controls, it is possible to obtain 50.2 gamma resolution of the field generated by the coils. As indicated by the normal X and Y coil fields, the
19
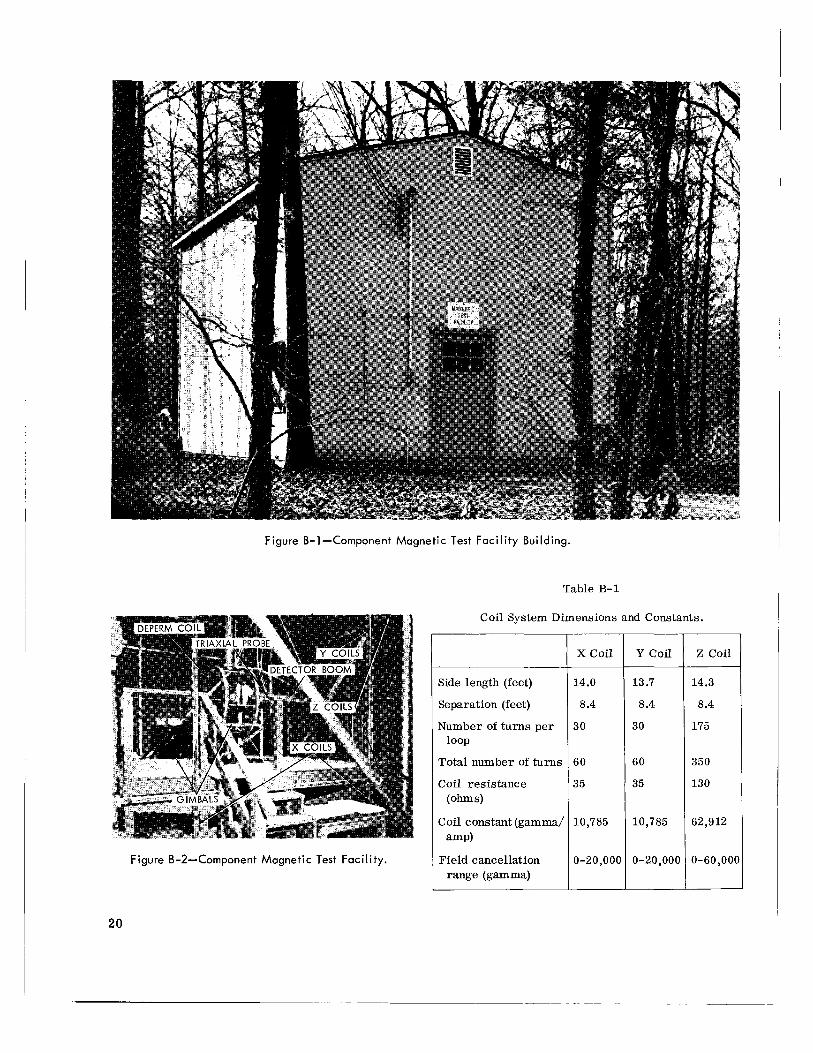
Figure B-1-Component Magnetic Test Fac i l i t y Building.
Figure B-2-Component Magnetic Test Faci l i ty.
20
Table B-1
Coil System Dimensions and Constants.
Side length (feet)
Separation (feet)
Number of turns per
Total number of turns
Coil resistance
loop
(ohms)
amp) Coil constant (gamma/
Field cancellation range (gamma)
X Coil
14.0
8.4
30
60
35
10,785
0-20,000
Y coi l
13.7
8.4
30
60
35
10,785
0-20,000
Z Coil
14.3
8.4
175
350
130
62,912
0-60,000

building is aligned such that the Y coil has a West magnetic declination of 043" When the coils are adjusted for zero field operation, the homogeneity for the center of the coil system within a sphere of 1 foot diameter is such that the field varies byless than 50 gamma from the value at the center. The field homogeneity for the system is as follows:
Spherical Spherical Pe r centage Diameter Radius Homogeneity
(Feet) (Inches)
1 2 3
6 0.12 12 0.31 18 0.66
2001 \ I 1
BELOW CENTER ABOVE CENTER HEIGHT (inches)
Figure B-3-Zero f i e l d - Z coi l axis.
The field change (gamma) with distance (inches) along each coil axis (3 component data) is shown in the enclosed graphs (Figures B-3, B-4, and B-5). Due to the structural limitations of the facil- ity, the vertical axis measurements were possible only for a distance of 14 inches above and below the center of the coil system. Additional X and Y coil axis data indicate that a gradient of less than 200 gamma/foot is maintained within a one and one-half foot radius of the center of the coils (Figures B-6 and B-7).
Perm-Deperm Coil
The coil used for the 25 gauss exposure field and the 50 gauss deperming field consists of a single axis circular Helmholtz coil pair (Figure B-2). The physical dimensions and coil constant of the coil a r e shown in Table B-2.
' O 0 I 50 1
I I I 1- -20016 12 8 4 0 4 8 12 16
SOUTH DISTANCE (inches) NORTH
Figure B-4-Zero f ie ld - Y coi l axis.
100 l J 0 I c
16 12 8 4 0 4 8 12 16 EAST WEST
DISTANCE (inches)
Figure B-5-Zero f i e l d - X coi l axis.
21

400
200
0
- 200
- 400
E
- z
E -600
v
x z -800
- 1000
- 1200
- 1400
- 1600
- 1800
I .I I
I I I I 1 - 1 I I 3 2 1 0 1 2 3
WEST EAST
DISTANCE ( f e e t )
Figure B-6-Hx horizontal axis gradient zero field.
Table B-2
Deperm Coil Data.
Radius (inches) 22.81
Separation (inches) 23.00
Number of turns per loop 676
Coil resistance (ohms) 14
Coil constant (gauss lamp) 5.2197
2oor
- 1400
- 1600
- 1800
H, COMPONENT I
\ \ ri ix COMPONENT
I I H, COMPONENT I
I - 2000 4 3 2 1 0 1
SOUTH DISTANCE ( f e e t )
‘I I I
I . I 2 3
NORTH
Figure 6-7-H horizontal axis gradient zero field.
The coil is wired in parallel and is con- structed so that the two coil frames can be re- moved from their position in the center of the coil system when required.
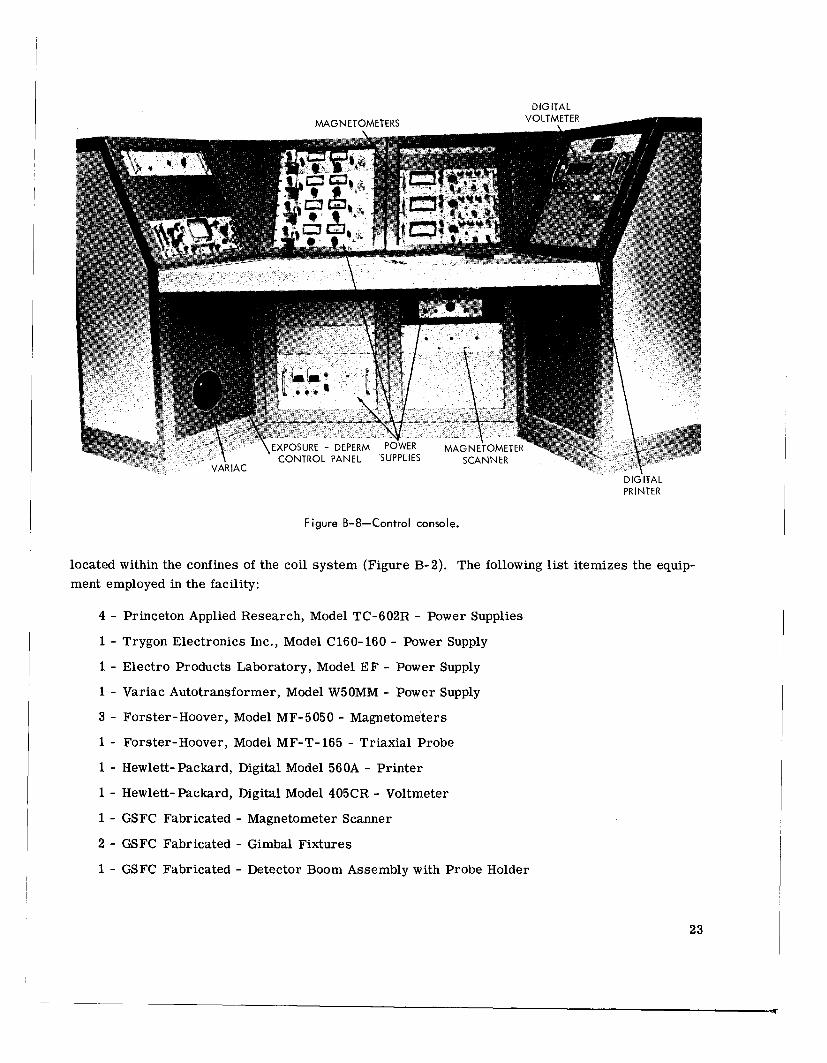
Equipment
All the equipment for the operation of the facility is housed in the control console (Figure B-8). Associated with this equipment a r e the fixtures utilized in the measurements of com- ponents. These fixtures, all non-magnetic, a r e
22
DIGITAL
_ _ _ -
E X P O S U R E - D E P E R M
D IG-ITA L P R I N T E R
Figure B-8-Control console.
located within the confines of the coil system (Figure B-2). The following list itemizes the equip- ment employed in the facility:
4 - Princeton Applied Research, Model TC-602R - Power Supplies
1 - Trygon Electronics Inc., Model C160-160 - Power Supply
1 - Electro Products Laboratory, Model E F - Power Supply
1 - Variac Autotransformer, Model W5OMM - Power Supply
3 - Forster-Hoover, Model MF-5050 - Magnetometers
1 - Forster-Hoover, Model MF-T-165 - Triaxial Probe
1 - Hewlett-Packard, Digital Model 560A - Printer
1 - Hewlett-Packard, Digital Model 405CR - Voltmeter
1 - GSFC Fabricated - Magnetometer Scanner
2 - GSFC Fabricated - Gimbal Fixtures
1 - GSFC Fabricated - Detector Boom Assembly with Probe Holder
23
B-2 Naval Ordnance Laboratory Magnetic Test Facility - Building 206
Introduction
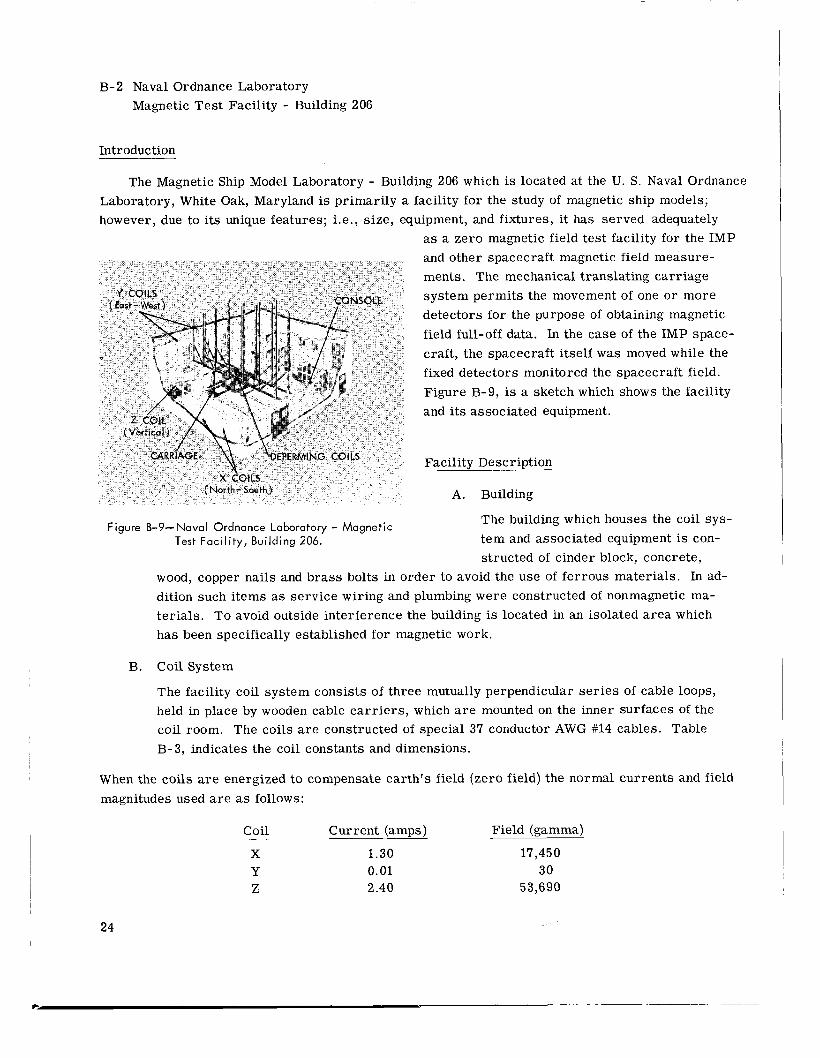
The Magnetic Ship Model Laboratory - Building 206 which is located at the U. S. Naval Ordnance Laboratory, White Oak, Maryland is primarily a facility for the study of magnetic ship models; however, due to its unique features; i.e., size, equipment, and fixtures, it has served adequately
as a zero magnetic field test facility for the IMP and other spacecraft magnetic field measure- ments. The mechanical translating carriage system permits the movement of one or more detectors for the purpose of obtaining magnetic field full-off data. In the case of the IMP space- craft, the spacecraft itself was moved while the fixed detectors monitored the spacecraft field. Figure B-9, is a sketch which shows the facility and its associated equipment.
Facility Description
A. Building
Figure B-9-Naval Ordnance Laboratory - Magnetic Test Faci l i ty , Building 206.
The building which houses the coil sys- tem and associated equipment is con- structed of cinder block, concrete,
wood, copper nails and brass bolts in order to avoid the use of ferrous materials. In ad- dition such items as service wiring and plumbing were constructed of nonmagnetic ma- terials. To avoid outside interference the building is located in an isolated area which has been specifically established for magnetic work.
B. Coil System
The facility coil system consists of three mutually perpendicular ser ies of cable loops, held in place by wooden cable carr iers , which a r e mounted on the inner surfaces of the coil room, The coils a r e constructed of special 37 conductor AWG #14 cables. Table B-3, indicates the coil constants and dimensions.
When the coils a r e energized to compensate earth's field (zero field) the normal currents and field magnitudes used a r e as follows:
Coil Current (amps) Field (gamma) -
X 1.30 17,450 Y 0.01 30 Z 2.40 53,690
24

Table E-3
Coil System Dimensions and Constants.
X Coil Y Coil Z Coil
Auxiliary
x2
36.3 29.1 29.1
7.3
6 ~~
2 * *
31 10 14
Auxiliary 7 Main
Xl
36.3 29.1 29.1
7.3
6
2 2 2
31 10 14
220
300
~
14,190
0-56,760
Main Z l
Dimensions (feet) North-South East- West Height
Spacing (feet)
Number of Loops per coil
Number of Cable Turns per Loop
Outer Middle Center
Number of conductors pe r Turn per Loop
Outer Middle Center
Total No. of Conductors
Coil Resistance (ohms)
Coil Constant (gamma/amp)
(ga"a ) Field Cancellation range
(4 amps limit)
37.9 30.3 30.3
7.6
37.1 29.7 29.7
7.4
5 5
2 1 1
33 18 27
3 2 3
37 15, 16 18, 10, 18
16, 15 18, 10, 18
220 195 330
300
14,190
0-56,760
370 300
12,870 22,370
0-51,480
~
0-89,480 0-89,480
*Shares conductors with main coi l .
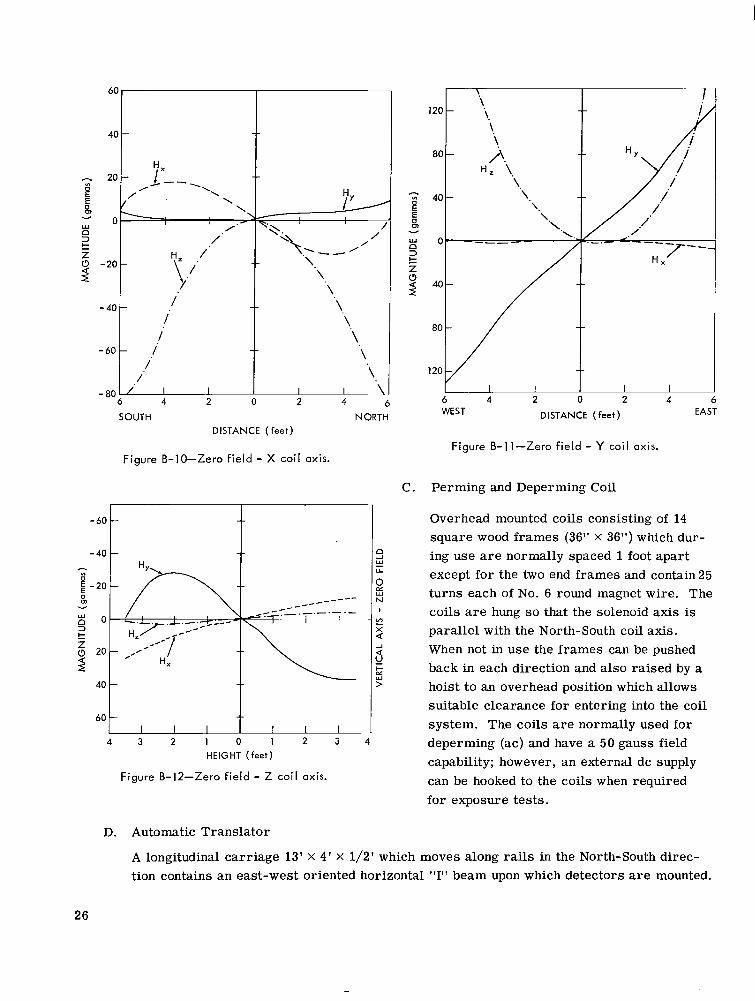
The geomagnetic field can be nulled to zero within 0.1% uniformity throughout a volume at the cen- ter of the coil of 6' x 6' X 12'. Since the center of the coil system is approximately 7 feet above the main floor and is occupied by rails and fixtures used for ship model testing, the spacecraft is not normally placed in the center of the coils except during the exposure and deperm treatment. A gradient survey w a s conducted throughout the normal zero field region in which the spacecraft is placed. Figures B-10, B-11, and B-12 show the Hx , Hy, and Hz component gradients for the X, Y, and Z coil axes for a center point which is 38-3/4" below the center of the coil system. The zero field homogeneity for the test volume is as follows:
Spherical Diameter (feet) Spherical Radius (inches) Percentage Homogeneity
1 6 0.02 2 12 0.04 3 18 0.06 4 24 0.08 6 36 0.14
25
SOUTH NORTH DISTANCE (feet)
Figure B-10-Zero f i e ld - X coi l axis.
80
120
- -"I 40
-
-
60 J 1 I I 1 I l l 1 4 3 2 1 0 1 2 3 4
HEIGHT (feet)
Figure B-12-Zero f ie ld - Z coi l axis.
D. Automatic Translator
DISTANCE (feet) WEST
I 2 I
4 EAST
Figure B-11-Zero f ie ld - Y coi l axis.
Perming and Deperming Coil
Overhead mounted coils consisting of 14 square wood frames (36" X 36") which dur- ing use a r e normally spaced 1 foot apart except for the two end frames and contain25 turns each of No. 6 round magnet wire. The coils a r e hung so that the solenoid axis is parallel with the North-South coil axis. When not in use the frames can be pushed back in each direction and also raised by a hoist to an overhead position which allows suitable clearance for entering into the coil system. The coils a r e normally used for deperming (ac) and have a 50 gauss field capability; however, an external dc supply can be hooked to the coils when required for exposure tests.
A longitudinal carriage 13' X 4 ' X 1/2' which moves along rails in the North-South direc- tion contains an east-west oriented horizontal "I" beam upon which detectors a r e mounted.
26

This detector boom can be raised or lowered in height a distance of approximately four feet. With this carriage it is possible to obtain translatory "fall-off" data by the follow- ing two means:
1. Detector motion with spacecraft stationary.
2. Spacecraft motion with detector stationary.
The longitudinal carriage is driven by a variable speed power system through a 27 f t K-monel shaft and silicon bronze roller chains. The drive controls a r e located in the console. The power system, which consists of a 1/2 hp dc motor and gear reducer, is located in the basement room annex outside the field area.
E. Master control console
The Master control console contains all the controls necessary for the operation of all the equipment in the facility. It is basically a 10 ft. diameter wood and brass cabinet (Figure B-9) within the console a r e the following controls and equipment.
10 - Magnaflw FM 204 Magnetometers
3 - NJE Corp QR-36-4 power supplies
1 - Huston Instrument Corp HR-97 X-Y plotter
1 - Dymec 2401A integrating digital voltmeter
1 - AC Deperming Shaker Circuit
1 - Carriage and Deperm Coil hoist motion and speed control.
27

Appendix C
Test Procedure
C- 1. IMP-I Components Magnetic Test Procedure
Introduction
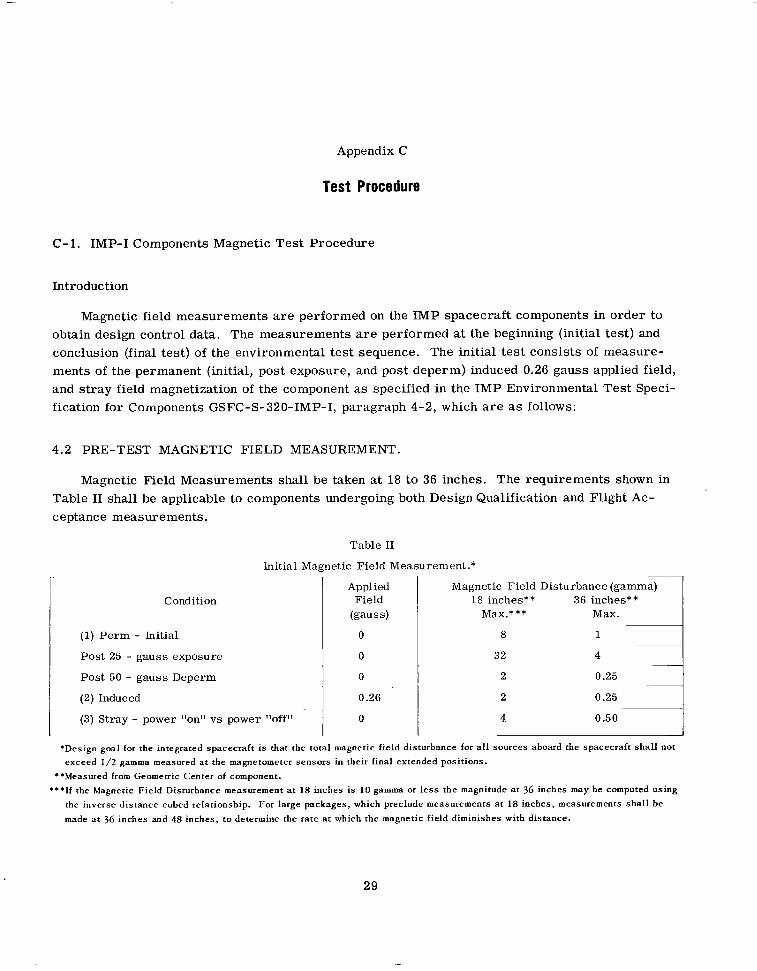
Magnetic field measurements are performed on the IMP spacecraft components in order to obtain design control data. The measurements are performed at the beginning (initial test) and conclusion (final test) of the environmental test sequence. The initial test consists of measure- ments of the permanent (initial, post exposure, and post deperm) induced 0.26 gauss applied field, and stray field magnetization of the component as specified in the IMP Environmental Test Speci- fication for Components GSFC-S-320-IMP-I, paragraph 4-2, which a re as follows:
4 .2 PRE-TEST MAGNETIC FIELD MEASUREMENT.
Magnetic Field Measurements shall be taken at 18 to 36 inches. The requirements shown in Table I1 shall be applicable to components undergoing both Design Qualification and Flight Ac- ceptance measurements.
Table I1
Initial Magnetic Field Measurement.*
Condition
(1) Pe rm - Initial
Post 25 - gauss exposure
Post 50 - gauss Deperm
(2) Induced
(3) Stray - power "on" vs power "offf'
Applied Field
(gauss)
0
0
0
0.26
0
Magnetic Field Disturbance (gamma) 36 inches**
0.25
0.50
18 inches** Max.***
8
32
2
2
4
*Design goal for the integrated spacecraf t is that the total magnetic field disturbance for all sources aboard the spacecraf t sha l l not exceed 1/2 gamma measured at the magnetometer sensors in their final extended posit ions.
**Measured from Geometric Center of component. "*If the Magnetic Field Disturbance measurement at 18 inches is 1 0 gamma or l e s s the magnitude at 36 inches may he computed using
the inverse dis tance cubed relationship.
made at 36 inches and 48 inches, to determine the rate at which the magnetic field diminishes with dis tance.
For large packages, which preclude measurements at 18 inches, measurements sha l l be
29

The final test is then performed at the conclusion of the environmental test sequence as specified in paragraph 4.9 which is listed below.
4.9 FINAL MAGNETIC FIELD MEASUREMENT
Magnetic Field Measurements shall be taken at 18 and 36 inches. The requirements shown in Table XVII shall be applicable to all components and a r e also applicable for both Design Qualifica- tion and Flight Acceptance measurements.
Table XVII
Condition L Post-Test Magnetic Field Measurement.
Magnetic Field Disturbance* (gamma)*
18 -inches** 36 inches**
2 0 2 5
Applied Field
(gauss)
0
'The measured magnetic field disturbance for any component sha l l not exceed the value measured in 4.2 Tab le I1 condition(1).
**Measured from geometric center of component.
The IMP components are measured in accordance with these specifications by following the de- tailed Magnetic Test Procedure.
INITIAL TEST
A. Initial Perm
1. With the component in zero field and the detector 18 inches from the geometric center of the component, measure the maximum positive and negative radial component by following the radial component magnitude determinations procedure listed in step 2 below.
2. Radial Component Magnitude Determinations
a. With the test assembly in the gimbal, rotate the gimbal in zenith and azimuth in order to locate the maximum radial component (plus peak), recheck with additional zenith and azimuth rotation. Then record the gimbal azimuth and zenith angles for the peak.
b. First, record the peak magnitude (angle), return the gimbal to the zero reference position (0), and then record the zero reference magnitude.
c. Repeat step b and then check the difference between the peak and zero magnitudes. If these values agree within 0.3 gamma continue to step d; if not, repeat step b.
d. Next, rotate the gimbal and locate the minus peak. Record these angles. Note: When the azimuth angle of rotation exceeds 180" use a 180" rotation in zenith instead.
30
.. . .... . . . - .. . .. .. . .. .

e. Repeat the measurement steps b and c in order to determine the magnitude of the minus peak.
f. Unclamp the gimbal to release the assembly.
g. With the assembly in the zero reference position, record the magnitude (assembly-in), then remove the assembly and record the background (assembly-out) magnitude.
h. Repeat step g in order to obtain 0.3 gamma agreement.
i. Once the magnitude of the assembly is known for the zero reference position (difference between out-and-in), the magnitude, when added to the mean difference between the zero position and the peak position determines the actual peak magnitude.
j . The magnitude reported is the maximum (positive or negative) magnitude which w a s measured.
k. Example ~. 1 - Positive Reference Magnitudes
Positive Peak __
Peak (angle) 4.5 4.7 Reference (0) 1.3 1.3 Difference +3.2 +3.4 Mean +3.3 Assembly in Assembly out
Mean Actual peak magnitude
~ ___
in vs out
+1.2 +3.3 +4.5
Example 2 - Negative Reference Magnitudes --
Peak (angle) Reference (0) Difference
Positive Peak 5.2 4.9
-3.5 -3.7 +8.7 +8.6
.. ~
__ __
Mean +8.7 Assembly in Assembly out
Mean Actual peak magnitude
in vs out
-3.8 +8.7
Negative Peak
-4.2 -4.2 1.3 1.3
-5.5 -5.5 -5.5
1.3 1.1 0.2 - 0.2
+ 1.1 +1.3 - -
+ 1.2
-3.1 . -3.3 0.5 0.7
-3.6 -4.0 -3.8
__ -
+ 1.2 -5.5 -4.3 __
Negative Peak -4.5 -4.7 -3.2 -3.1 -1.3 - 1.6 - ~
-1.4
-3.8 - 1.4 -5.2 -
+4.9
31

3. Record the measured data on the data sheet. If the magnetic field disturbance of the com- ponent exceeds 10 gamma, remeasure the component at 36 inches. .
4. Before the measurement probe is moved, check the zero field for drift, adjusting i f necessary, then move the probe to the second distance. Readjust the step compensation switches as re- quired in order to rezero the magnetometers.
5 . Measure the maximum radial component (step 1).
6. Return the probe to the initial measurement position (18 inches) and readjust the zero field compensation (reverse procedure of step 4).
B. Induced
1. With all the magnetometer sensitivity switches on zero, reverse the Y coil (field changed from compensating to aiding earth's field) by throwing the Y coil reversing switch from cancel to double. (Effective applied field 0.26 gauss).
2. Make a note of the position of the magnetometer compensation control settings (Y axis mag- netometer electronics). Return this magnetometer to the one scale by adjusting the step com- pensators as needed.
Note: Do not change the fine adjust compensating potentiometer.
3. Measure the maximum (plus and minus) radial components at the angles previously determined from initial perm measurements of paragraph A by following the radial component measurement procedure (paragraph A step 2).
4. Since these measurements are induced plus permanent magnetization, algebraically subtract the permanent magnetization, values obtained in paragraph A, from the induced plus perm mag- nitudes just obtained. These magnitudes represent the induced magnetization of the assembly for an applied field of 0.26 gauss.
5. Record the induced data on the data sheet. If the field exceeds 10 gamma, then second dis- tance (36 inches) measurements are to be performed.
6. When second distance measurements a r e made, move the probe to the second distance and then adjust the magnetometer compensation as needed.
7. Measure the maximum radial component (repeat steps 3, 4, and 5).
8. Return the probe to the initial measurement position, with the magnetometer range selector switch in the zero position, return the "Y" coil current reversing switch to cancel and the com- pensators to their original positions.
9. When the maximum induced plus permanent radial component has a direction other than that of the maximum permanent radial component, it will be necessary to determine the initial
32

permanent radial component magnitude for this direction in order to compute the maximum in- duced magnetization.
C. 25 Gauss Exposure
1. In order to expose the component to the 25 gauss field, determine the location and polarity of the permanent magnetic moment of the component by referring to the angles and magnitudes re- corded in paragraph A.
2. With the component in the gimbal, align the moment along the axis of the exposure coils so that both fields a r e in the same direction.
3 . Turn all the magnetometers to the zero position, then with the coils connected to the dc power supply, apply 5 amps of current to the coils-normal exposure time at least 3 seconds-.
4. Turn the current off and break the circuit. Turn the magnetometers to the appropriate sensitivity scale for measuring the magnitude of the component. Check the component to see if the direction of the peak has shifted. If the peak has shifted more than 10 degrees then repeat the 25 gauss exposure (step 6) on the new peak.
5. With the component in zero field, measure the maximum radial component following the procedure in paragraph A.
6. Record the measured data on the data sheet. If the post 25 gauss exposure magnitude at 18 inches exceeds 10 gamma remeasure the component at 36 inches.
D. Deperm
1. With the component removed from the gimbal, rezero the field. Replace the component in the gimbal and then clamp the component in the gimbal.
2. With the component turned to the maximum exposure angle (paragraph C-2) and the magnetom- eters turned to the zero position, apply 10 amperes of 60 cycle ac current to the Helmholtz perming coils. Decrease this current slowly to zero.
3. Turn the magnetometers to the one scale and locate the direction of the maximum radial component .
4. If the direction of the maximum radial component has shifted and, or, its magnitude is not below 95% of the maximum post exposure magnitude, repeat step 2 in the new direction or on the peak radial component.
5. When it is not possible to deperm the assembly below 95% of the post exposure magnitude, ascertain if the component contains parts with permanent magnets such as relays which would not deperm in the 50 gauss field.
33

6. Measure the maximum radial component following the procedure in paragraph A, step 2.
7. Record the measured data on the data sheet. If the magnitude at 18 inches exceeds 10 gamma remeasure the component at 36 inches.
E. Stray
1. With the probe located at the measurement distance (18 inches) connect the power cables to the component and then clamp the component in the gimbal.
2. After the experimenter or his representative has determined that the component is operating and the voltage and current adjustments have been completed, the stray field measurements can be made.
3. Record the operational voltage and current magnitudes for the component.
4. The s t r ay field measurements are then made by recording the field magnitude with the com- ponent operating and with the component non-operative (power-on vs power-off).
5. Obtain information from the experimenter as to possible current changes which would occur while the component is functioning, Le., calibration, step functions, stand-by o r transmit con- ditions. In the event several such modes of operation occur, record the maximum stray field magnitude condition.
6. Measure the stray field (radial component) along each face of the component (+X, -X, +Y, -Y, +z, -Z).
7. Select the component face which has the highest magnitude then shift the gimbal in azimuth and zenith to locate the peak stray field magnitude and direction.
8. When the magnitude at 18 inches exceeds 10 gamma, second distance measurements (18 inches) of the maximum radial component of the stray field a r e to be performed.
FINAL TEST
A. Permanent Magnetization
1. With the component in zero field, and the detector 18 inches from the geometric center of the package, measure the maximum positive and negative radial component by following the radial component magnitude determinations procedure in the initial test procedure-paragraph A, step 2.
2. Record the measured data on the data sheet. If the magnetic field disturbance of the component exceeds 10 gamma, remeasure the component at 36 inches.
34

B. Deperm
1. Deperm the component as outlined in the initial test procedure paragraph D, steps 1-5.
2. Measure the remanent magnetic field disturbance of the component (initial test procedure paragraph D steps 6 and 7).
ANALYSIS AND REDUCTION TESTS
In the event that a component or components have magnetic field disturbance magnitudes which exceed the design goal values, further (Analysis and Reduction) tests are then performed. These tes ts a r e utilized in order to determine the possible sources of magnetic field disturbance and means by which these magnitudes can be reduced. Since these tests vary with the component and the associated type of magnetic field disturbance problem (perm and/or stray), no one particular test procedure is followed; however, as a guide refer to the initial test procedure.
C-2 IMP-I Spacecraft Magnetic Test Procedure - NOL Facility
I. Facility Operational Procedure
11. Spacecraft Test Arrangement
111. Spacecraft Test Procedure
IV. Deperm Measurements
V. Initial Test Measurements
VI. Post Environmental Exposure Measurements
VII. Final Test Measurements
I. FACILITY OPEFtATIONAL PROCEDURE
A. Equipment
Bldg. 206 Coil Facility 3 - Flwgate Magnetometers MAGNAFLUX FM 204 3 - Tripole Detectors (X, Y, and Z probes) 3 - Power Supplies (Magnetically regulated) NJE Corp. Model QR-36-4 1 - Y-Y Plotter Huston Instrument Corp. Model HR-97 2 - Strip Chart Recorders - Mosley Model 681 1 - Integrating Digital Voltmeter (Current Measuring) Dymec Model 2401A 1 - Vertical Gimbal Fixture 1 - Horizontal Fixture 1 - AC Deperming Shaker Circuit (50 Gauss Capacity)
35

B. Equipment Operation
1. With the spacecraft removed from the facility, turn on all equipment listed in paragraph A excluding deperming and perming coils.
2. After at least 30 minutes warm-up, s e t zero field
Coil - Direction X Coil - South Y Coil - East z coi l - u p
Approximate Settings 389.53 volts 1.30 Amps
3.71 volts 10 M A 708.39 volts 2.40 Amps
C. Magnetometer Adjustments
1. After the detectors have been positioned (Section 11), the magnetometers a r e then adjusted.
2. Connect the three tripoles to the respective magnetometers which a r e to be used.
3. With the coil system operating - zero field - compensate the magnetometers to zero and then calibrate the magnetometers and the recorders.
11. SPACECRAFT TEST ARRANGEMENT
A. Vertical (Spin Axis) Detector at Rb Magnetometer Flight Position.
1. Remove overhead carriage and release pull cables.
2. Place detector #9 overhead and mount on top of the deperming coil hoist rails. Align the detector so that the center lines of the three probes a r e aligned with the vertical center line coil axis. Adjust the height of the detector by raising or lowering the deperm coils so that the vertical sensing probe (HZ) will be 72 inches from the center of the spacecraft (middle of facets). Figure C- 1 indicates the spacecraft test arrangement.
B. Tripod (Horizontal Axis) Detector at Fluxgate Sensor Flight Position
1. Mount a second detector on an adjustable tripod, align the X, Y, and Z probes so that their axes correspond with the coil system axes. X (North-South), Y (East-West) and, Z (Vertical).
2. Position the X probe so that it is 84 inches North of the center of the coil system.
3. Adjust the height of the tripole so that its center will be 10-1/4 inches below the center of the spacecraft (fluxgate sensor flight position).
4. Mark the tripod leg positions.
36

DETECTOR 1 + 1
DETECTOR POSITIONS
121- L = 28,30, or 40 INCHES I rL- ROTATION DIRECTION
Figure C-1-Test arrangement for vert ical spin axis rotat ion of spacecraft.
FLUXGATE 1+1-... DETECTOR M O T I O N
(a) Arrangement for detector runs along fluxgate boom axis.
DETECTOR MOTION
I ( b ) Arrangement for detector for runs
along Rb magnetometer boom axis.
Figure C-2-Test arrangement for fa l l -of f w i th dis- tance along spin and boom axis.
C. Carriage (Mid-Height) Detector
1. Position the third tripole (#5) on the car- riage detector beam and align in the center of the system.
2. Adjust the height of the detector until it wil l be at the spacecraft mid-height position.
3. Move the carriage until the E-W sensor is 28 inches North of the center of the coils.
D. Spacecraft Gimbal Fixture
1. Select the vertical rotational spindle and place it in the center of the coil system.
E. Carriage Fixture
I 1. Place the large mounting plate on the carriage and attach the spacecraft adapter ring to the plate. Center this fixture on the carriage so that the spacecraft (when mounted) will be centered in the coil system along the East-West axis.
2. Extend the East-West center line in the East side of the carriage and position a center line pointer on the side of the carriage (used for North-South distance measurements). Figure C-2 indicates the carriage test arrangement.
37

3. Step up the tripod detector so that it is centered along the X coil axis (North-South) and 60 inches North of the center of the coils.
4. Mark the position of the tripod legs.
5. With the tripod as zero and moving south, mark the even foot distances along the carriage track (from 3 to 7 feet) including a center of the coils mark.
6. Adjust the height of the vertical detector to 72 inches.
III. SPACECRAFT TEST PROCEDURE
A. Spacecraft Rotational Data
1. Connect the X-Y plotter to the carriage (#5) detector magnetometer and set the magnetom- eter selector switch on the X component position. Switch in the X compensator and compensate the magnetometer to zero.
2. Rotate the spacecraft 360 degrees while operating the X-Y plotter.
3. Adjust the recording speed so that two complete rotations of the spacecraft can be recorded on the graph paper.
4. Select the proper sensitivity range. Whenever possible use the 1 range (2 gamma per division sensitivity).
5. Connect the brush recorder to the vertical and tripod detector magnetometers. Select the X component and center the recording pens with the magnetometer compensation networks (normal adjustment of magnetometers for zero).
6. First start the recorders and then rotate the spacecraft (vertical rotational spindle) two complete revolutions while indexing each 45 degree increment of rotation with the recorder event markers.
7. Select the next component or adjust the position of the detectors as required and then repeat the rotational data procedure (steps 1-6).
B. Spacecraft Fall-Off Data - Spacecraft Motion
1. Set up the tripod detector at the fall-off data position (60 inches north of the coil center).
2. Mount the spacecraft on the carriage.
3. Rotate the spacecraft to the reference position.
4. Clamp the spacecraft to the fixture.
38
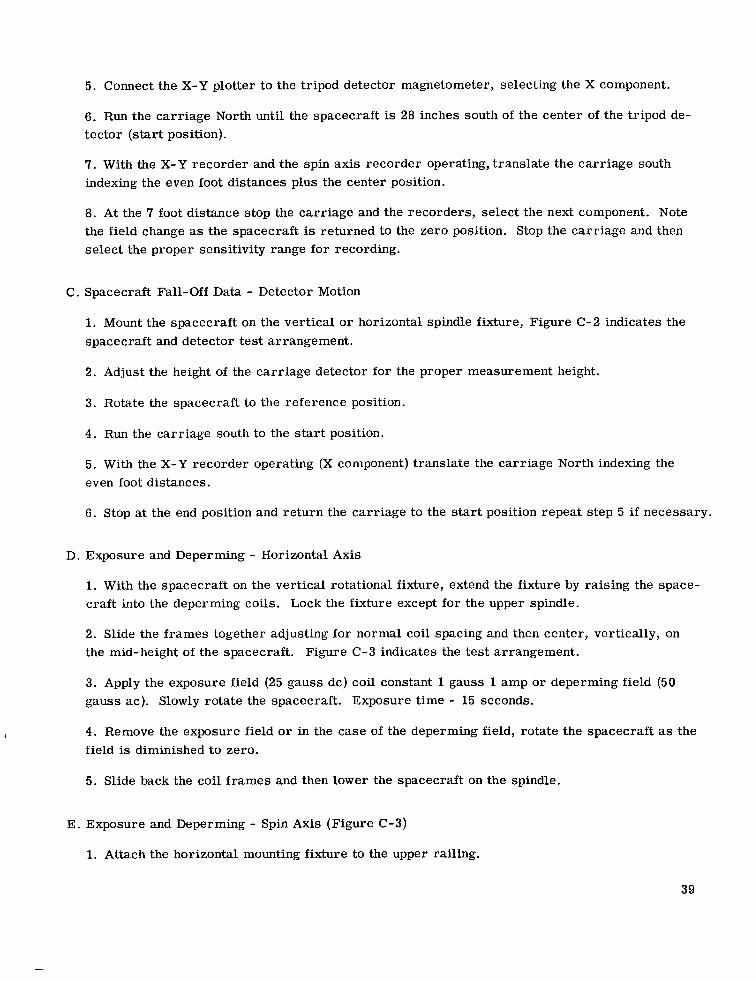
5. Connect the X-Y plotter to the tripod detector magnetometer, selecting the X component.
6. Run the carriage North until the spacecraft is 28 inches south of the center of the tripod de- tector (start position).
7. With the X-Y recorder and the spin axis recorder operating, translate the carriage south indexing the even foot distances plus the center position.
8. At the 7 foot distance stop the carriage and the recorders, select the next component. Note the field change as the spacecraft is returned to the zero position. Stop the carriage and then select the proper sensitivity range for recording.
C. Spacecraft Fall-Off Data - Detector Motion
1. Mount the spacecraft on the vertical o r horizontal spindle fixture, Figure C-2 indicates the spacecraft and detector test arrangement.
2. Adjust the height of the carriage detector for the proper measurement height.
3. Rotate the spacecraft to the reference position.
4. Run the carriage south to the start position.
5. With the X-Y recorder operating (X component) translate the carriage North indexing the even foot distances.
6. Stop at the end position and return the carriage to the start position repeat step 5 i f necessary.
D. Exposure and Deperming - Horizontal Axis
1. With the spacecraft on the vertical rotational fixture, extend the fixture by raising the space- craft into the deperming coils. Lock the fixture except for the upper spindle.
2. Slide the frames together adjusting for normal coil spacing and then center, vertically, on the mid-height of the spacecraft. Figure C-3 indicates the test arrangement.
3. Apply the exposure field (25 gauss dc) coil constant 1 gauss 1 amp or deperming field (50 gauss ac). Slowly rotate the spacecraft. Exposure time - 15 seconds.
4. Remove the exposure field o r in the case of the deperming field, rotate the spacecraft as the field is diminished to zero.
5. Slide back the coil frames and then lower the spacecraft on the spindle.
E. Exposure and Deperming - Spin Axis (Figure C-3)
1. Attach the horizontal mounting fixture to the upper railing.
39
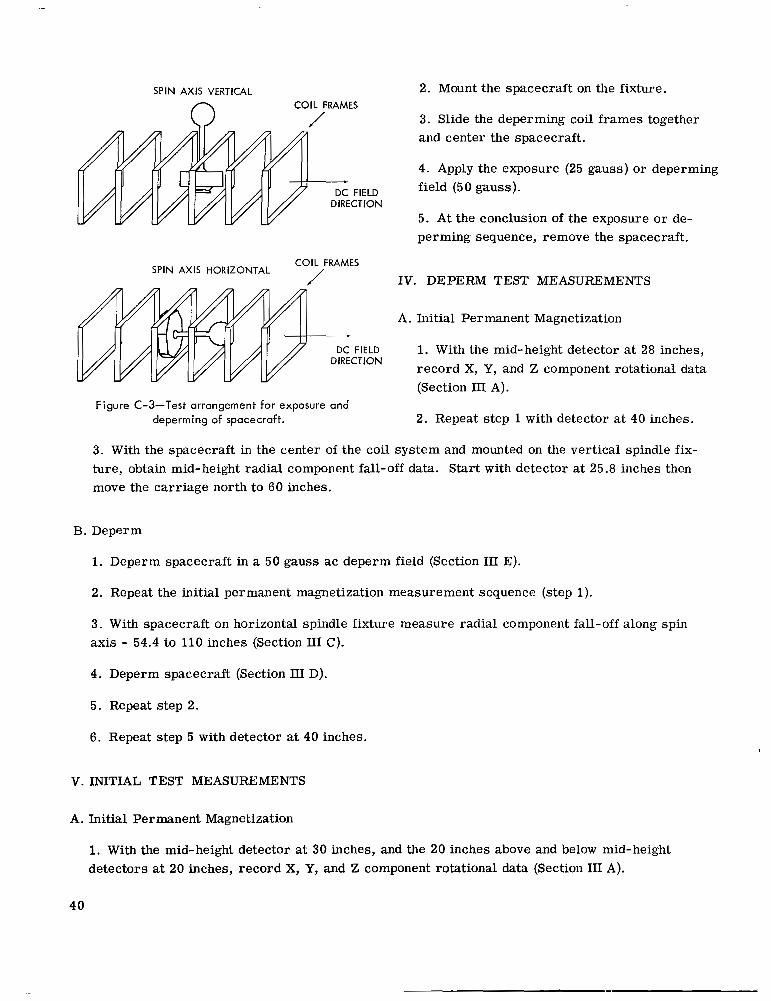
S P I N AXIS VERTICAL 2. Mount the spacecraft on the fixture. COIL FRAMES
3. Slide the deperming coil frames together and center the spacecraft.
4. Apply the exposure (25 gauss) or deperming field (50 gauss).
5. At the conclusion of the exposure or de- perming sequence, remove the spacecraft.
FIELD CTlON
COIL FRAMES
IV. DEPERM TEST MEASUREMENTS
A. Initial Permanent Magnetization
S P I N AXIS HORIZONTAL
FIELD 1. With the mid-height detector at 28 inches, record X, Y , and Z component rotational data (Section 111 A).
2. Repeat step 1 with detector at 40 inches.
DIRECTION
Figure C-3-Test arrangement for exposure and deperming of spacecraft.
3. With the spacecraft in the center of the coil system and mounted on the vertical spindle f ix- ture, obtain mid-height radial component fall-off data. Start with detector at 25.8 inches then move the carriage north to 60 inches.
B. Deperm
1. Deperm spacecraft in a 50 gauss ac deperm field (Section III E).
2. Repeat the initial permanent magnetization measurement sequence (step 1).
3. With spacecraft on horizontal spindle fixture measure radial component fall-off along spin axis - 54.4 to 110 inches (Section Lu: C).
4. Deperm spacecraft (Section III D).
5. Repeat step 2.
6. Repeat step 5 with detector at 40 inches.
V. INITIAL TEST MEASUREMENTS
A. Initial Permanent Magnetization
1. With the mid-height detector at 30 inches, and the 20 inches above and below mid-height detectors at 20 inches, record X, Y, and Z component rotational data (Section 111 A).
40

B. 25 Gauss Exposure
1. Expose the spacecraft (Section 111 D and E).
2. Repeat the initial permanent magnetization measurement sequence (Paragraph A).
C. Deperm
1. Deperm spacecraft (Section 111 D and E).
2. Repeat the initial permanent magnetization measurement sequence (Paragraph A).
D. 25 Gauss Exposure
1. Re-expose the spacecraft (Section 111 D and E).
2. Measure X, Y, and Z component fall-off with distance along fluxgate "A" boom axis. Start detector at 33 inches and stop at 90 ioches (Section I11 C).
3. Repeat step 2 and measure fall-off along fluxgate "Bt' boom axis.
4. Measure X, Y, and Z component fall-off along spin axis - 57.2 to 104 inches (Section III C).
5. Measure X, Y, and Z component fall-off along fluxgate "A" boom axis. Detector at 40 inches and spacecraft then moved outward to 150 inches. (Section 111 B).
6. Repeat step 5 and measure fall-off along fluxgate "Btt boom axis.
7. Deperm the spacecraft.
E. Stray Field Magnetization
1. Measure X, Y, and Z component s t r ay field for the following positions and distances:
Spin axis 74 inches Flwgate A axis Flwgate B axis
30, 40, 50, and 60 inches 30, 40, 50, and 60 inches
2. With detector 30 inches from spacecraft and at fluxgate height, measure 3 component rota- tional data (Section 111 A).
3 . With spacecraft on horizontal spindle fixture and large turntable, measure X, Y, and Z com- ponent rotational data with detector at 40.8 inches.
VI. POST ENVIRONMENTAL EXPOSURE MEASUREMENTS
1. Measure X, Y, and Z component fall-off data (Initial test measurements, Section V, D, steps 5 and 6). Place second detector overhead to obtain spin axis fall-off data.
41

VII. FINAL TEST MEASUREMENTS
A. Initial Permanent Magnetization
1. Obtain mid-height radial component rotational data (Section 111 A) with detector at 25.8 inches.
2. Repeat step 1 with detector at fluxgate height.
B. Deperm
1. Deperm spacecraft (Section 111 D and E).
2. Repeat initial permanent magnetization measurements, steps 1 and 2, Paragraph A.
42
-. . . . . _. _ _

Appendix D
Test Activity Log
D-1 Components Magnetic Test Log
Date __
8-12- 62
12-18-62
2-11-63
3-7-63
3-21-63
3-22-63
3-23-63
3-27 - 63
4-1-63
4-1-63
4-3-63
4- 18 -63
4-19-63
5-4-63
5-7-63
5-15-63
5-16 to 6-1 1-63
5-17-63
5-21-63
6-18-63
Item
Chicago Magnesium Samples
Proton Analyzer
Performance Parameter
Dumping Circuit Resistor
Battery
Prime Converter
E vs dE/dx Units
Battery
Ion Chamber
Wiring Harness
Ion Chamber Parts
Proton Analyzer
E vs dE/dx Power Supply
Perf or manc e Parameter
R vs dE/dx Photo Tube
Ion Chamber
Facet C Tests
Pr ime Converter
R vs dE/dx components
Deperm
7-3-63 E vs dE/dx
Test & Remarks
Pe rm Check
Initial Pe rm
Initial Stray
Stray
Initial Stray Check
Initial Pe rm & Stray
Initial Pe rm & Stray
Stray Analysis & Reduction
Initial Pe rm
P e r m Check
Pe rm Analysis & Reduction
Pe rm Reduction Check
Stray Analysis & Reduction
Stray Analysis & Reduction
Pe rm Analysis & Reduction
Pe rm Reduction Check
Deperm & Vibration
Stray Analysis & Reduction
Pe rm Analysis & Reduction
Increased dc Deperm Magni- tude to 50 gauss
Stray Analysis & Reduction
43

Date __ Item -~ Test & Remarks
7-10-63 Field Measurements
9-19-63 Solar Paddle
11 -22-63 Deperm
D-2 Spacecraft Magnetic Test Log
Date
7/8 -10/63
7/20/63
8/8/63
8/9/63
8/12-12/63
8/9/63
10/9/63
10/2 4/6 3
10/23/63
10/24/63
Item
AMR Background Field Measurements
Initial Pe rm & Stray
Changed to 50 Gauss ac Deperm
Remarks
AMR Survey
Perming of Tools
Deperm Test - NOL
Magnetometer Calibration- FMO
Initial Test - NOL
Post-Vibration Test - NOL
Magnetometer Calibration - FMO
Final Test - NOL
Final Magnetometer Cali- bration - FMO
Tool Depermer Utilized
Deperm
Full Survey
Pe rm Check
Final Survey and Deperm
44

Appendix E
Components Magnetic Test Data Summary Table
45


Item
FACET A
O.A. Electronics
E vs dE/dxElectronics#l
E vs dE/dxElectronics#2
E vs dE/dx Sensor
E vs dE/dx E.E. 1 & 2
E vs dE/dxE.E. 1 & 2, Sensor
FACET B
Multi-converter
Range vs dE/dx #1
Range vs dE/dx #2
Range vs dE/dx sensor
R vs dE/dx E 1 & 2, sensor
IMP-I Component Magnetic Test Data Radial Component Magnitude in Gammas a t 18 Inches.
Date
6/14
3/23 6/5
3/23 6/5
3/23 5/7 9/17
4/6 6/5 6/24 7/3 7/12,15 8/13
10/24 10/31
3/4 3/30 4/13 6/11 10/17 f0/24
4/3 4/9
4/3 4/9
4/3
4/3 5/7 6/21 10/24
Initial P e r m
2 .o 9.6 -
13.8 16.2
13.2 45.8 10.6
- - - 8.2 - -
20.0 19.9
3.1 2.1 1.3 2.2 2.5 8.6
4.6 35.9
4.0 1.4
105.7
118 38.9 21.6 42 .O
M ~
Post Expos.
9.8
24.2 -
29.6 38.9
107 160.4 134.8
- - -
47.4 - -
- -
- 22.3 55.7 26.6 26.8 -
45.5 58.1
57 .O 56.7
155.3
- 136.4 145.8
-
petizat ion
Post Deperm
1.0
0.9 - 4.8 2.5
3.8 5.2 0.8
- - - 3.4 - -
4.1 3.3
- .1.3 1.6 1.6 0.9 1 .o
2.8 9.6
5.4 1.5
8.3
- 4.4 1.0 3.5
nduced Stray (0.26 Gauss)
0.6
1.6 - 3.3 - 2.4
8.1 -
- - - 5.6 - -
- -
- 2.5 7.4 2.6 2.9 -
4.4 -
3.3 -
4.0
- -
11.6 -
- 23.8
5.6
23 .O 3.8
0.6
0.7
46.6 6.6 3.5 5.6 3.6 1.5
-
- -
1.4 4 .O 0.9 0.6 0.5 - - -
- -
- 0.7
1.1 -
-
Test
-
[
[
Stray
[
b&R
[
I [
Stray Stray A&R I A&R A&R
1 F
I I[
A&R 1 I F
I I
I I
I
I A&R I F -
02
- 01
01 01
01 02 03
02 01 02 03 03 04
04,04,03 04,04,03
0 1 02 02 03 06 06
02 02
02 02
02
02 02 02,04 04,03
Notes
lnitial Stray 5.1
Exposed to magne
Post chang
47

Magnetization
Item
FACET C
Encoder- Converter
Telemetry Encoder
DDP Model C
DDP Model D
O.A. Sensor
DDP Model B
3ptical Aspect Converter
DDP's + Encoder
3DP's + Enc. + Conv.
FACET D
Programmer #4
Programmer #3
?rogrammers 3 & 4
?luxgate A Elect.
'luxgate Sig. Proc.
?luxgate Electronics 1 & 2 + Sig. Proc.
'roton Analyzer
on Chamber
'ACET. E
;eiger Ctr. Tel.
' rogrammer #1
'rogrammer #2
'rogrammer 1 & 2
Date
3/28
1/28
1/22
1/22
1/22
11/22
3/21
f /8
L/10
L/10
v 9
i/2O ' / l o 1/20
./ 7 1/20
:/4 '/4 /18
i/28
2/18/6
0/24
2/7/62 /I / I5
/ 14 0/24 0/25 1/9
/10
/10
/8
Initial Perm
2 .o 23.2
24.0
11.2
23.2
2.4
29.9
27.0
34 .O 4.8
1.4
73.8
3.2 1.2
0.9
- < 8 3.2
2.4 11.2 2.8 4.1 2.2
< 8 7.6 1.8
20.8 10.7 9.9
31.4
1.3
1.1
2.5
~
Posl Expo:
10.4
- - -
-
5.6
- 154.0
166.5 L08.0
20.4
t30.8
31.7 10.6
1.2
-29 .O 31.7
.38 -38.4
7.1 17.3 -
- 51.4
7.2
66.4 - - -
16.4
7.9
20.2
Post Deperm
0.5
- - -
-
0.8
- 20.6
32.0 4.6
1.2
31.9
1.0 0.4
0.4
0.8 1 .o 1.6 0.7 2.8 1.9 1.7
- 3.9 0'.5
3.2 5.6 1.5 9.1
0.9
0.9
0.8
~
2.0
- - -
-
1.9
-
24.8
4.2 11.0
4.3
-
4.2 3.6
1.2
10.1 4.2
: 8 - 1.7 1.9 -
:8 3.2 1.7
23.2 - - -
1.3
1.5
zo.0
Induced Strs (0.26 Gauss
~
Test S/N
01
02
02
02
03
0 1
02,03,0
32,03,0
- 11
11
-
)1 - )1
)1 11
12 12 12 13 16
- - 13
1 2 2 1
1
2
1,02
Notes
o ribbon
48

Magnetization
Item
FACET F
rhermal Ion
Fluxgate Electr. rr13r'
solar Array Regulator
?rime Converter
?ACET G
I&RR Transmitter
I&RR #3
2&RR #2
I&RR # 1
I&RR Trans. 1, 2, & 3
'erformance Parameter
ielay & Despin timer
Date
1/13
1/20 ;/ 12
1/22
1/22 1/27 /10 /26 /29 /29 1/10 1/17 1/18 1/24 0/28 1/4
/29 /11
/11
/11
'/29 /11
/29 /I1
/29 /11 /20 /6 /28 /12 /4 /4 /4 /4 1/8
/2 0 / l o
1/9
,/29
8/29
0/24
Initial Pe rm
3.9
2 .o 0.5
0.4
8.8 24 .O 14.9 12.7 10.5 14.7 3.3 4.0 8.6
17.9 25.9
-
2 -4 3 .O
15.6 1.2
0.5 1.1
3.4 0.8
15.0 2 .o 1.2 1.1
1.0
-
- - - - - - 8.2
276 21.5 39.3 44.4
Post Expos.
28.9
21.1 13.3
2.1
117.6 - -
94.3 - -
94 60.5 79.9
82.5
-
-
- 6.5
- 14 .O
- 15.5
- 14.9
80.0 59.9
8.7 8.7
2.7
-
- - - - - - - -
266.5 - -
Post Deperm
1.9
0.7 0.1
0.1
10.4 - - 8.1 - - 8.1 3.3 2.5
2.0 1.5
-
1.7 I .8
0.4 1.8
0.5 0.5
0.9 0.8
0.5 3.5
0.3 0.3
0.4
-
- - - - - - 0.4
- 32.0 36.3 32.0
Induced Straj (0.26 Gauss)
4.2
2.4 4.1
0.5
10.4 - - 7.3 - - 7.3
14.7 7.7
6.5
-
-
- 1.8
- 2.4
- 0.3
- 1.0
10.9 7.0
0.6 0.6
1.3
-
- - - - - - - -
1.3 - -
159.6
- -
< 0.1
35.2 87.7 46.0 20.7 14.5
2.9 4.2 6 .O 5.1 9.1
-
-
- -
- -
- - - -
0.9 0.9
> 8 14.6 5.0
12.2 7.9 7.5 1.6 1.7 2.5 1.9 -
- 2.6 - -
Test
I
I I
I
I A&R A&R I A&R A&R I A&R I A&R A&R F
I I
I I
I I
I I
I I
I A&R A&R I A&R A&R Strag Strag I Straj F
I F F F
~
~
0 1
0 1
03
03 02 02 04 04 02 06 06 07 03 04 03
01 07
01 - 01 -
0 1 -
01 -
0 1 0 1 0 1 03 0 1 0 1 02 03 04 05 04
0 1 0 1 02 03
~
~
Notes
49

Magnetization
Item
FACET H
Plasma Probe #I
Plasma Probe #2
Plasma Probe Sensor
P.P. 1, 2, Sensor
R vs dE/dx Par t s
Photo-multiplier tube
S.S. Screws (12)
Solid State detector
Ames Exp. Transformers
E vs dE/dx P.S.
I'ransistors
tN1908
tN1724
STC 5553
Xelays
3abcock BR5
3R 9AX
?&E SLl lD
runing Fork
i3069
,896
3attery
lardney Cel l Si1 Cad 5AH
Date
4/ 15 5/9
5/9
5/9
12/4/6 5 / 8
1/23
&/23
1/23
5/6
%/19 $/26 5/14 5/20 3/20
5/17
5/25
5/25
v 4
1/4
1/4
/18
/I8
1/2 1 1/27 /6 /I3
1/20 1/1
/6 /6
1/26
Initial Perm
5.5 7.1
4.9
8.5
< 8 15.2
46
< 0.2
< 0.1
< 0.1
2.3 - - 1.4 -
3.3
2.3
0.3
6.9
10.8
72.0
1.3
2.4
<<0.1 - - - 0.1
< 0.1
0.1
-
-
Post Expos
48.8 44.3
26.6
29.6
- 114.6
85
< 0.5
< 0.1
< 0.5
20.2 - - 7.9 -
16.2
2.4
1.3
- - -
-28.4
31.6
0.1 - - - 0.1 - - - -
Post Deperm
0.3 0.9
1.1
5.7
- 7.9
6.9
:< 0.1
- :< 0.1
1.2 - - 0.7 -
0.4
0.3
0.1
-
-
-
0.9
0.9
:< 0.1 - - -
< 0.1 - - - -
[nduced Stra (0.26 Gauss
Test
I I
I
I
I I
I
I
I
I
I A&R A&R A&R A&R
I
I
1
r [
[
[
[
UZR S&R S&R S&R \&R F
Notes
'lastic cas6 cells back to back
50

Magnetization
eld Magnitude
Item
in Gammas at 24 Inches
Yardney Cell 12AH
12 AH
12 AH
Sonotone NICAD 3 AH
4 AH
12 AH
Ion Chamber Parts
GM Tube A
B
P.S. ML 165-1
Shield Assembly
Electronics board
GM Counter Telescope
U.V. Converter
U.V. Regulator
1 Yr. Timer
Dumping Circuit Resistor
Dale NH 50 500
RH 55 500
RH 55 130
NH 50 130
Wiring Harness
Solar Paddles
Date
4/6
4/6
4/6
4/ 6
4/6
4/6
3/4
3/4
3/4
3/4
9/10
6/24
3/30
6/17
4/10
3/7
3/7
3/7
5/1
4/1
9/19 11/5 11/5-6 11/5-6 11/5-6 11/6-8 11/8 11/9 11/9 11/9 11/9 11/22
Initial Perm
< 0.1
< 0.1
< 0.1
7
67
100
< 0.2
< 0.2
1.6
< 0.2
1.8
0.1
0.5
1.4
0.6
<0.1
< 0.1
< 0.1
< 0.1
64.8
Post Expos.
- - - - - -
0.9
1.0
13.2
< 0.2
20.1
0.1
3.8
7.9
1.5
-
- < 0.1 -
-
gnetic 1
Post Deperm
hduced Stray (0.26 Gauss)
~ ~
- - - - - -
0.2
0.2
1.0
< 0.2
2.2
0.1
1.1
1.4
1.0
- - - - -
Test
I
I I
I
I
I
I
I
I
I
I
I
I
I
I
I
I
I
A&R
I
S/N
4P
5P
6P
2P
1P
3P
223
223 - -
D
- - - 02
- -
- 6314 -
I I A&R A&R A&R A&R A&R A&R A&R A&R A&R A&R
05 02 08 10 11 09 10
03 06 07 02
Notes
Steel case
Steel case
Steel case
Post T.V.


Appendix F
Components Magnetic Test Reports
53

I -1 . . . ... . . . .- . . . ..
- .. . . ._ . . . . . .. .. . . _.. . .. I

(PRELIMINARY) REPORT OF AN ENVIRONMENTAL TEST GENERAL INFORMATION
4. T E S T D A T E 3. TAR NO. I 3336 I 4/1/63 PROJECT 2. T Y P E T E S T
s-74 IMP I MAGNETIC T E S T I T E M
IMP Wiring Harness I T E M LOCATION I N S/C: ( I F S / C T E S T , A X E S ORIENTATION)
. T E S T OBJECTIVE(S)
Test for magnetic components.
I l l . T E S T COORDINATOR
H.P. Norris 13. PROJECT MANAGER R E P R E S E N T A T I V E I I
TEST PERSONNEL 112. EVALUATION ENGINEER
6. T E S T S P E C I F I C A T I O N S :
6. M O D E L 17. SERIAL NUMBER 1 I Prototype
3. T E S T E O U I P M E N T / F A C I L I T Y
GSFC-MTF
TEST SET-UP 5. INSTRUMENTATION:
Forster/Hoover Model 331 Tripole MF-T-165 Digital Recorder RFL 1890 Gaussmeter
7. T E S T PROCEDURE:
I C. Harris 114. DESIGN GROUP
I F. Carr ~I
18. PREPARED BY:
C. Harris I 1 1 9 . COOROINATION:
EVALUATION ENGINEER I ~~
DISTRIBUTION: SCHEDULE "( )"
T E S T COORDINATOR
PAGE 1 OF-
55

TO: Magnetic Test Section Files April 3, 1963
FROM:
SUEUECT: S-74 IMP Inner-Connecting Wiring
C. A. Harris - Test Engineer
A series of magnetic tests were performed during the interval from March 29, 1963 to April 1, 1963 on various inner-connecting wires and inner-connecting wire samples. The wires which were tested were of the type which are to be used to inner-connect the components in the IMP spacecraft. In addition, the IMP wiring harness was tested as a unit. Subsequently, the individual harness wires were then tested separately.
The necessity for further tes ts of the IMP inner-connecting wires became evident when it was determined that the loops of Amphenol co-axial polyethlene teflon wire, which were used to inner- connect the Range & Rate Transmitter and Electronics units, indicated a permanent magnetism of 20 gamma at a distance of 12 inches from the magnetometer probe. The results obtained from further tests on various types of inner-connecting wires and wire samples is summarized in the attached table.
The magnetic test which was conducted on the IMP wiring harness (see attached Magnetic Test Report), revealed that the #26 black conductor Raychem wire had a magnetization of 20 gamma at a distance of 12 inches from the detector. On the basis of the data obtained from these tests, it is recommended that magnetic tests be conducted on samples of the actual wires which a r e to be used in the spacecraft.
C. A. Harris
Test Engineer Magnetic Test Section
MAGNETIC TEST RESULTS
MAGNETIZATION (GAMMA) WIRE TYPE - WIRE LENGTH ALIGNMENT AT 12 INCHES
Amphenol Coaxial Polyethylene Teflon - 8- 1/2" 1 5 I / 38
Amphenol #21-598 Coaxial - 10-1/2"
Raychem RG 178 Coaxial - 18"
Raychem RG 188 - 17" Belden RG 55/U - 3-3/4"
14 2
10 2 0.2 0 (1 inch dist.)
The inner-conductor and outer shield wires were tested for each type listed above and it was determined that the inner-conductor was magnetic while the shield w i r e was non-magnetic. After exposure to a 25 Gauss field, the magnetization for each wire increased except for the Belden RG 55/U wire which retained its non- magnetic properties.
56

I -
PROJECT s-74 IMP ITEM IMp .Wiring Harness
TEST DATE 4/1/63
(PRELIMINARY) REPORT OF AN ENVIRONMENTAL TEST
(CONTINUATION SHEET)
( C O N T I N U A T I O N OF ANY SECTION WHERE MORE SPACE IS REQUIRED.)
20. MAGNETIC TEST RESULTS:
The Imp Wiring Harness was first tested as a complete unit. The approximate center of the harness was at a distance of 19 inches from the magnetometer probe. The harness was then positioned so as to obtain its maximum measurable magnetization (this resulted in locating the outer group of wires and connectors approximately 12 inches from the probe). In this position, the harness indicated a magnetization of 54 gammas. Due to the fact that the harness was a complete unit, it was not possible to use the magnetometer to locate the source of magnetization. A s a result, the individual wires were tested with an RFL 1890 Gaussmeter. From these tests, it was determined that the black conductor Raychem wire size # 26 was the source of magnetization. Further tests were then made with the magnetometer when the individual harness wire samples were obtained. The other sizes (#20, # 2 2 , and t28) of the black conductor Raychem wires were tested and determined to be non-magnetic.
Results of tests on 3 feet of the black conductor #26 Raychem wire place with its nearest end 12 inches from the probe (parallel to the probe axis) and with the center of the wire 12 inches from the probe (perpendicular to the probe axis) ar as follows:
RAYCHEM #26 Black Conductor Magnetization (Three Feet) Distance - 12 inches
Parallel 20 gamma
Perpendicular 4 gamma
The other colors (green, yellow, red, orange, & brown) of Raychem wire sizes: # 20,22,26, & 28 was determined to be non-magnetic when tested at a distance of one inch from the probe.
Since the magnetic #26 black conductor wire was interlaced throughout th wiring harness, it was not possible to affirm the presence of other sources of mag- netization; however, there was an indication that some of the short buss wires and a printed circuit plate had some magnetization. Since the black conductor //26 wire was employed throughout the harness, there is every indication that the measured 54 gamma field (complete wiring harness unit) can be attributed to the #26 black conductor wire.
PAGE 5 OF 7
57

(PRELIMINARY) REPORT OF AN ENVIRONMENTAL TEST
GENERAL INFORMATION
2. T Y P E T E S T 3. TAR NO. 1 . PROJECT I 3331 6. MODEL
I MAGNETIC
Range & Range Rate Transmitter and Electronics Prototype 9. T E S T E O U I P M E N T / F A C l L I T Y
GSFC-MTT.'
I 5 , T E S T I T E M
8. I T E M LOCATION IN s/C: ( IF s / C T E S T . AXES ORIENTATION)
-~ ~
H.P. Norris
I
1 5 . INSTRUMENTATION: ~~
Forster/Hoover Model 331 Tripole MF-T-165 Dinital Recorder
16. T E S T S P E C I F I C A T I O N S :
17. T E S T PROCEDURE'
18. PREPARE0 0 Y : I- C. Harris
_ -
TEST PERSONNEL 112 . EVALUATION ENGINEER
C. Harris
J. Rodgers 14. OESIGN GROUP REPRESENTATIVE/EXPERIMENTER
TEST SET-UP
Environmental Test Specification No
Refer to Item # 16 .
E V A L U A T I O N ENGINEER
4. T E S T D A T E
3/29/63 7. S E R I A L NUMBER
It 10,09,08,07
5-2-90], para. 4.2.
T E S T COORDINATOR
1 9 . COOROINATION
H. P. Norris
I i 1 I I 1 I I I I I I I
PAGE 1 OF- DISTRIBUTION: SCHEDULE "( )"
58

ectr PROJECT s-74 IMP El I T E M R&RR Tr.
TEST DATE 3/29/63
0.9
TEST RESULTS
0.8
(PRELIMINARY) REPORT OF AN ENVIRONMENTAL TEST
I .
T Y P E O F MAGNETIZATION
ermanenr Initial Post 2 5 gauss exposure Post Deperm iduced 26,000 gamma applied tray
For 80 mamps. 240 ma. at 12 v o l t s 50 volts I. DIRECTION O F MAGNETIC MOMENT: (Show b y Sz
MAGNETIC TEST
RADIAL COMPONENT O F MAGNETIC FIELD IN GAMMA
AT 19 INCHES I6XLl. I A T 18 INCHES
l3XL1"
66.9
10.9
56.7
9.2
5.2
0.7
0.1 **
GIMBAL POSITION
AZIMUTH 0" ZENITH 180"
2. COMMENTS:
The complete R&RR unit - Transmitter, R&RR 83, R&R #2, and R&RR 81 was tested. At the conclusion of these tests, the complete unit was dissambled in order to determine which unit or units were the cause of the large initial perm value.
First, the inner-connecting loops of Amphenol coaxial Teflon wire were tested separately. At a distance of 12 inches each l o o p measured 20 gamma. With the inner-connecting wires removed from the complete unit, the following initial perm was measured at the 19 inch distance.
18" ** 19" 36**
Initial Perm- w/o innerconnectors 15.6 y 13.2 y 2.0 y
Next, the two mounting bolts were removed and the complete unit was measured with the following results: 18"** 19" 36**
Initial Perm- w/o innerconnectors & bolts 1 5 . 0 ~ 12.7 y 1.9 y
Post 25 Gauss Exposure- w/o i.&b. 80.0 y 67.8 y 10.0 y
Post Deperm- w/o i.&b. 0.5 y 0.4 y 0.1 y
MAXIMUM LENGTH D I M E N S I O N
PAGE 2 OF-
59

1. PROJECT 2. TYPE TEST
s-74 IMP Magnetic
TEST PERSONNEL
3. TAR NO. 4. TEST D A T E
3031 2/12/63
1 1 1 . T E S T COORDINATOR 1 1 2 . E V A L U A T I O N ENGINEER
5. T E S T ITEM 6. MODEL
Ames Proton Analyzer Assemblies 7. S E R I A L NUMBER
-1 1
8 . I T E M LOCATION I N S/C: ( IF S / C T E S T , AXES O R I E N T A T I O N )
TEST SET-UP 5. INSTRUMENTATION:
9. TEST E O U I P M E N T / F A C I L I T Y
GSFC Magnetic Test Facility
Forster/Hoover Model 331 Trioole MF-T-165 I
H. P. Norris
Dr. N. F. Ness 1 3 . PROJECT MANAGER REPRESENTATIVE
I Digital Recorder I
C. A. Harris
R. Hedlund 1 4 . O E S I G N GROUP REPRESENTATIVE/EXPERlMENTER
I 5. T E S T S P E C I F I C A T I O N S :
Environmental Test Specifications, IMP, S-74 (unpublished)
1. T E S T PROCEOURE:
Magnetic Test Procedure (unpublished)
1 1 8 . PREPARED BY: 1 1 9 . COORDINATION:
T E S T COORDINATOR C. A. Harris EVALUATION ENGINEER
P A G E 1 OF- DISTRIBUTION SCHEDULE "( )"
60

s-74 PROJECT
TEST iiF: * (PRELIMINARY) REPORT OF AN ENVIRONMENTAL TEST
TEST RESULTS MAGNETIC TEST
T Y P E O F MAGNETIZATION
ermanent Initial Post 25 g a u s s exposure P o s t Deperm duced 13,000 gamma applied )ray For- amps. at ~ V O l t S
. DIRECTION OF MAGNETIC M O M E N T : (Show b y Si,
0" 0"
R A D I A L COMPONENT O F MAGNETIC F I E L D IN GAMMA
AT- INCHES l 6 X L l '
AT AINCHES 1 3 X L I .
Trans. Elec. I
'e Diagram)
-17- I
-n- I
A T ~ & ~ I N C H E S
Trans. Elec .
TRANSFORMERS
ELECTRONICS
GIMBAL POSITIONS
AZIMUTH 180" ZENITH 310"
AZIMUTH 20' ZENITH 355'
PROBE PROBE
!. COMMENTS:
The transformer and etched circuits were tested first by being placed in the triangular mounting box (position in gimbal as indicated in above diagram). At the conclusion of these tests the electronics unit (without the transformer portion of the electronics) was placed in the mounting box and tested separately. Further tests were made on innerconnecting wire samples and duplicate electronic components (resistors, capacitors and resistors). Of these samples tested, the nickel wire ani component wire produced measurable magnetic properties (in gimbal at 18 in. from the measuring probe) :
45" folded in 1-1/2" strips Nickel Wire Initial Perm - 0 .4 Post Exposure - 10
3" length Component Wire Initial Perm - 0.8 Post Exposure - 2
** Extrapolated values. M A X I M U M LENGTH D I M E N S I O N
PAGE 2 OF -
61
I

(. PROJECT
s-74
( 1 . T E S T COORDINATOR
2. T Y P E T E S T 3. TAR NO. 4. T E S T D A T E
MAGNETIC I 3343 1 4/3/63
H. NORRIS
5. INSTRUMENTATION:
Forster/Hoover Model 331 Tripole MF-T-165 Digital Recorder
j. T E S T S P E C I F I C A T I O N S :
TEST PERSONNEL
112. E V A L U A T I O N ENGINEER
c. HARRIS
F. CARR 14. D E S I G N GROUP R E P R E S E N T A T I V E / E X P E R l M E N T E R
TEST SET-UP
Environmental Test Specifications S-74 IMP No. S-2-901, para. 4.2.
~
1. T E S T PROCEDURE:
Refer to Item # 16.
18. PREPARED BY: r-- C. HARRIS
DISTRIBUTION: SCHEDULE "( )"
EVALUATION ENGINEER
19. COORDINATION:
H. NORRIS T E S T COORDINATOR
PAGE 1 OF - -
I I 1 I I 1 I I 1 I 1 I I
62
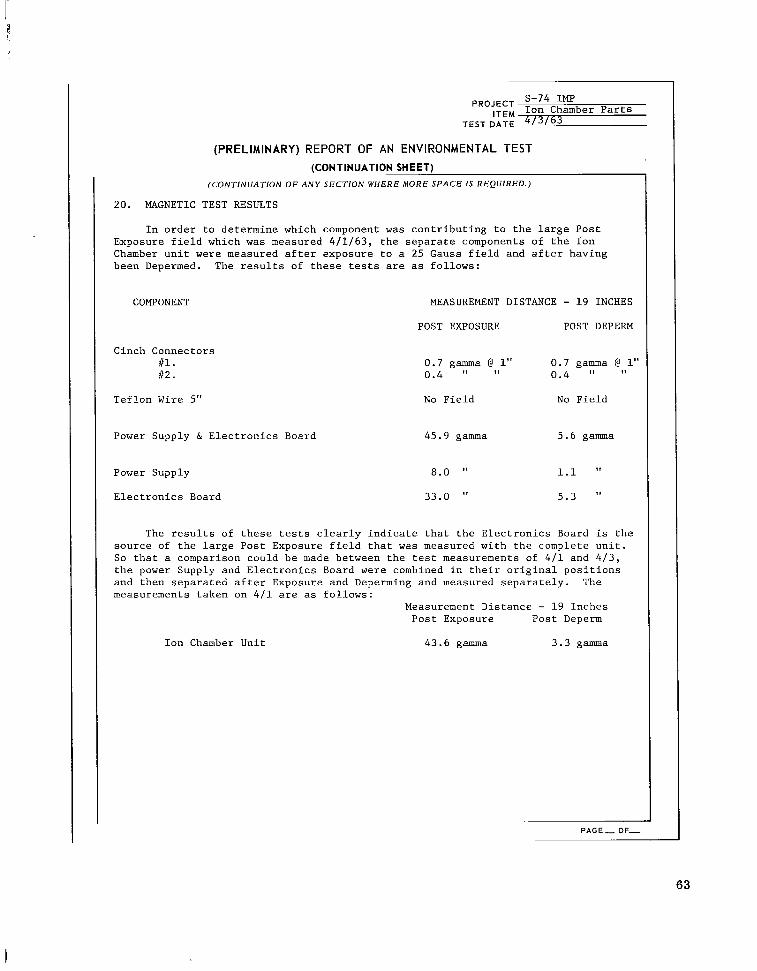
PROJECT s-74 'MF ,TEM Ion Chamber Parts
TEST DATE 4 / 3 / 6 3
(PRELIMINARY) REPORT OF AN ENVIRONMENTAL TEST (CONTINUATION SHEET)
(CONTINUATION OF ANY SECTION WHERE MORE SPACE IS REQUIRED.)
20 . MAGNETIC TEST RESULTS
In order to determine which component was contributing to the large Post Exposure field which was measured 4 / 1 / 6 3 , the separate components of the Ion Chamber unit were measured after exposure to a 25 Gauss field and after having been Depermed. The results of these tests are as follows:
COMPONENT MEASUREMENT DISTANCE - 19 INCHES
POST EXPOSURE POST DEPERM
Cinch Connectors 81. //2.
0.7 gamma @ 1" 0.7 gamma @ 1" 0.4 " " 0 . 4 ' ' "
Teflon Wire 5" No Field No Field
Power Supply & Electronics Board 45.9 gamma 5.6 gamma
Power Supply 8.0 " 1.1 "
Electronics Board 33.0 " 5.3 "
The results of these tests clearly indicate that the Electronics Board is the source of the large Post Exposure field that was measured with the complete unit. So that a comparison could be made between the test measurements of 411 and 413 , the power Supply and Electronics Board were combined in their original positions and then separated after Exposure and Deperming and measured separately. The measurements taken on 411 are as follows:
Measurement Distance - 19 Inches Post Exposure Post Deperm
Ion Chamber Unit 43.6 gamma 3.3 gamma
PAGE- OF-
63

1. PROJECT
S-74-IMP
Determine if photo multiplier tube is chief offender in Range vs. dE/dx Telescope.
2. T Y P E T E S T 3. TAR NO. 4. T E S T D A T E
. Magnetic 3134-35 5/7/63
TEST PERSONNEL
5. T E S T I T E M E vs . dE/dx Photo. Tubes 6. M O D E L EAgr Range vs. dE/dx Telescope & Photo. Tubes Proto
7. S E R I A L NUMBER
EE-3-00 ER-3-02
( 6 . T E S T S P E C I F I C A T I O N S '
Environmental Test Specification S-74-IMP
No. S-2-901, para 4.2.
8. I T E M LOCATION I N S /C: ( IF S / C T E S T . AXES O R I E N T A T I O N )
H-3 B-4
17. T E S T PROCEDURE:
See section No. 16
9. T E S T E O U I P M E N T / F A C l L I T Y
CTF/GSFC
11 . T E S T COORDINATOR
H. P. Norris 1 3 . PROJECT MANAGER R E P R E S E N T A T I V E
PAGE 1 OF 3 DISTRIBUTION: SCHEDULE "( )"
1 2 . EVALUATION ENGINEER
A . G. Barr
Dr. Ness, Dr. Simpson 14. DESIGN GROUP REPRESENTATlVE/EXPERlMENTER
64
18. PREPARED BY:
A . G. Barr EVALUATION ENGINEER
1 9 . COORDINATION:
H. P. Norris T E S T COORDINATOR

I
iST RESULTS I.
T Y P E OF MAGNETIZATION
ermanent Initial Pos t 25 gauss exposure Pos t Deperm ,duced
13,000 gamma applied
ray For ~ amps. at - volts
(PRELIMINARY) REPORT OF AN ENVIRONMENTAL TEST MAGNETIC TEST
R A D I A L COMPONENT O F MAGNETIC F I E L D I N GAMMA
AT- 1 9 INCHES
A
38.9 1 3 6 . 4
. DIRECTION OF M A G N E T I C M O M E N T : (Sbow by Simple Diapram)
A 0" I
z 0" I
I I Probe Probe
1 9
B
AT- INCHES
3.6 31.2
A T 1 8 INCHES REOUESTED
45.75 160.41 36.69
I Gimbal Positions
Column A Azimuth 180" Zenith 350'
Column B
-Azimuth go", 270" p Zenith 0", 0'
2. COMMENTS:
A comparison of the data on the sheet with that on the continuation
sheet indicates that the photo multiplier tube is indeed the chief source
of permanent field.
* Extrapolated by inverse cube from column indicated. MAXIMUM LENGTH D I M E N S I O N
I
65
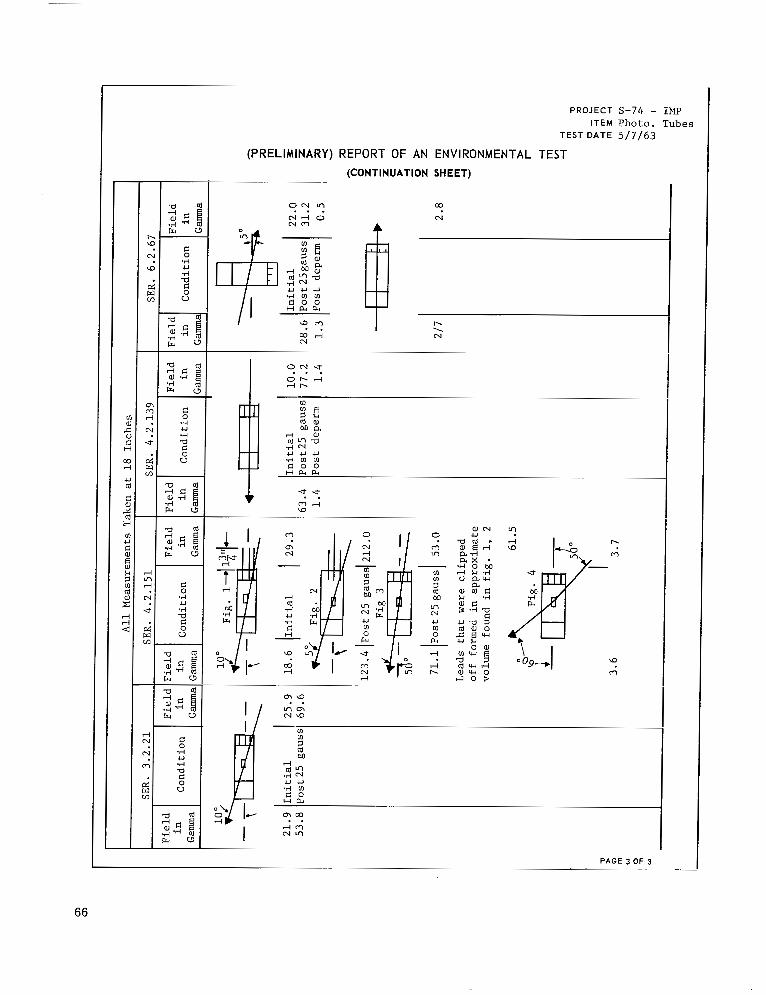
PROJECT S-74 - IMP I T E M Photo. Tubes
TEST DATE 5 / 7 / 6 3
(PRELIMINARY) REPORT OF AN ENVIRONMENTAL TEST (CONTINUATION SHE ET)
0" i vl . . Nrf 0 Nrrl
03
N
l a m w r f N
. . r- --- N
o m u o r - r l r l r -
. . .
2 2 m r l a
m
N m N ? I / 9
m vl : , I m m 2 M
a 009- ' I m
a
W 4
rf
rl r-
m
m w . . r l m N m
PAGE 3 OF 3
66

1. PROJECT
s-74 IMI! 2. T Y P E T E S T 3. TAR NO. 4. T E S T D A T E
MAGNETIC 3910 6120163
5. INSTRUMENTATION:
5. T E S T I T E M 6. MODEL I EE-2 POWER SUPPLY ENG
FORSTER/HOOVER MODEL 331 I TRIPOLE MF-T-165
7. SERIAL NUMBER
PS-811
DIGITAL RECORDER I
8. I T E M LOCATION I N S /C: ( I F S / C T E S T , AXES O R I E N T A T I O N )
H- 1
I 6. T E S T SPECIF ICATION:
T & E SPECIFICATION S-2-901 PARA. 4 . 2 .
9. T E S T E O U I P M E N T / F A C I L I T Y
GSFC-MTF
7 . T E S T PROCEDURE:
REFER TO ITEM 116
11 . T E S T COORDINATOR
H.P. NORRIS 1 3 . PROJECT MANAGER R E P R E S E N T A T I V E
1 2 . EVALUATION ENGINEER
e. HARRIS
P. JANNICHE 14 . DESIGN GROUP REPRESENTATIVE/EXPERIMENTER
67
18. PREPARED ey:
e. HARRIS E V A L U A T I O N ENGINEER
1 9 . REVIEWED:
T E S T COOROINATOR

PROJECT S-74 IMP ITEM EE#2MTRIX PS8 /
T E S T D A T E 6/20/63
(PRELIMINARY) REPORT OF AN ENVIRONMENTAL TEST (CONTINUATION SHEET)
(CONTINUATION OF ANY SECTION WHERE MORE SPACE IS REQUIRED. )
20. MAGNETIC TEST RESULTS. 20.
Matrix power supply PS 811 was initially measured for stray magnetization on 6/14 in order to determine if this part was the main source of the stray field of 6.6 gama (at 18") measured 614 - units EE # 1 & 2 combined. the stray field produced by the p.s. was 7.5 gamma (at.18").
the three arrangements of compensation loops. Three loops with 25 turns each were wound on the p.s. and located as shown in the following sketch. Measurements were made as the individual loops were inserted in the circuit in order to determine thc effectiveness of ehe compensation by each loop. All three loops effectively reduced the maximum stray field of the p.s.; however, due to the number of turns, each loop actually over compensated the field. differently, the resultant compensated field for the p.s. at right angles to the main axial field (side & top) varied slightly. The following diagrams indicate the magnitudes and directions of these components for the p.s. without and with thc compensation loops:
At this time (6/14),
Tests were conducted with the matrix p.s. to determine the effectiveness of
Since each loop was positioned
4 compensation loops il3 i12
1.1 / 2'
J
RADIAL COMPONENT OF MAGNETIC FIELD IN GAIW AT 18 INCHE Eo compensation w/loop ill wlloop #2 w/loop #3
+3. ,I..;:;. i I . 9 , 1.3 -&*lbo.2;L+1*l o.6
-0.6 0.1 +1.4 -1.4 -0.8 -1.0
PEAK -7.5 2.4 315 15
2.3 310 30
2.4
300 30
PAGE 2 OF 2
68
....

Appendix G
Facet C Comparison Data
69


REPORT OF AN ENVIRONMENTAL TEST
GENERAL INFORMATION
MAGNETIC l%~~,%06;3412 6. MODEL I ENG.
I 2. TYPE TEST s-74 IMP
FACET "C" 4 - CARDS
I I' I 9. TEST E Q U I P M E N T / F A C l L I T Y I 5 . TEST ITEM 8. ITEM LOCATION I N S/C: ( IF S / C T E S T , A X E S ORIENTATION)
FACET C I GSFC-MTF i o . TEST OBJECTIVE(S~
DEPERM AND VIBRATION COMPARISON TESTS
. . 7. SERIAL NUMBER I
TESTPERSONNEL I 1 1 . T E S T COORDINATOR 1 1 2 . EVALUATION ENGINEER
H. P. NORRIS C. HARRIS 1 1 3 . PROJECT MANAGER R E P R E S E N T A T I V E I 1 4 . DESIGN GROUP REPRESENTATIVE/EXPERIMENTER
I I P
IS. INSTRUMENTATION:
FORSTER/HOOVER MODEL 331
TRIPOLE MT-T-165
DIGITAL RECORDER
VIBRATION TESTS: MB C-50 SHAKER
TEST SET-UP
I
16. T E S T S P E C I F I C A T I O N S :
T & E SPECIFICATION S-2-901 TAR 3279 May 10, 1963
17. T E S T PROCEDURE:
REFER TO SECTION // 16
1 8 . PREPARED BY:
c. HARRIS PRELIMINARY FORM DESIGN
1 119. REVIEWED:
I EVALUATION ENGINEER T E S T COORDINATOR
PAGE-OF-
71

Magnetic Test Results
S-74 (IMP) Facet C Deperm and Vibration Tests
Summary
The results of the magnetic tests related to a comparison of differences between two modes of deperming and the effects of vibration of a depermed unit in either the geomagnetic field or the normal vibration exciter field which have been conducted with S-74 (IMP) Facet C components a r e presented. From these tes t results, the following information has been obtained:
1. The facet deperm is slightly more effective than the individual card deperm.
2 . The depermed state of the facet and the individual cards is not appreciably altered when the facet is vibrated in earth's field.
3. The permanent magnetization of the depermed facet (along the component parallel to and in the direction of the field generated by the vibration exciter) is increased 36% when the magnitude of the vibration exciter field is approximately 8.5 gauss at the center of the facet.
A ser ies of magnetic tests were conducted with S-74 (IMP) Facet C electronic card com- ponents to determine the differences between the deperming of individual cards and the deperming of the cards when assembled as a facet. In addition, tests were also conducted to determine the extent to which the depermed state of the components and the facet would be changed when they a r e vibrated in earth's field (0.5-0.7 gauss). Additional tests were performed with the depermed facet vibrated in a normal vibration exciter field in order to determine the possible perming effects of the vibration exciter.
For the purpose of these tests, the following electronic cards of the Facet C assembly were used: Encoder converter, DDP Model B, DDP Model C, and DDP Model D. When the electronic cards were combined in order to perform the facet measurements and tests, the cards were stacked in the following order: Encoder converter - top, DDP Model B, DDP Model C, and DDP Model D - bottom. The tests were conducted on the following dates: May 16, 1963 - Deperm and geomagnetic field vibration tests (table I); May 29, 1963 - Deperm and vibration in vibration exciter field (table 11); and June 11, 1963 - Vibration in vibration exciter field (table 111). All magnetic measurements were conducted at the Component Magnetic Test Facility and the vibration tests were performed in Building 7, on the C-50 vibration exciter (table IV and V).
The deperming tests which were performed in order to compare facet deperm vs card deperm were conducted in the following manner:
1. The individual cards were depermed along the axis of the maximum radial component.
2. The facet was depermed along the axis of the maximum resultant radial component.
In all cases, the measurements were made with the detector 18 inches from the center of the measured cards or facet. The results of these tests a r e listed in tables I and 11. A comparison
72

between the two types of deperming indicates that, in the case of the Facet C cards, a slightly more effective deperm is obtained by deperming the facet rather than the individual cards.
The vibration tests with the facet vibrated in the earth's field were performed in the following two ways: (1) vibration of the facet after the cards were depermed individually, and (2) vibration of the facet after the facet w a s depermed. In order to vibrate the facet in earth's field, it was necessary to place the C-50 in the horizontal position so that the facet could be mounted at a distance of 19 inches from the top of the exciter while being vibrated. This position was necessary since the peak magnetic field generated by the C-50 at a distance of one inch above the exciter is 20 gauss. (See enclosed C-50 Vibration Exciter table IV). The results of these tests (table I) indicate a 5% increase in the maximum radial component of the facet and a slightly smaller overall change in the maximum radial components of the individually depermed cards. The test data also indicate that the post deperm stability for the two types of deperming a r e comparable.
The tests on May 29, 1963 (table 11) were conducted with the facet mounted so that Card D was nearest to the top of the vibrator (field - 12 gauss) and the encoder converter card farthest away (field - 5 gauss). The vibration tests of June 11, 1963 (table 111) were conducted with the facet placed on the C-50 in an inverted position. The encoder converter was nearest to the top of the vibrator and the DDP Model D card farthest away. When the facet w a s vibrated on the C-50 in the normal upright position May 29, 1963, the moments of two cards and the facet were directed downward; therefore, these moments decreased in magnitude while the two cards whose moments were directed upward were increased in magnitude. June 11, 1963, the facet assembly w a s placed on the C-50 in the inverted position so that the moments of the facet and two cards were directed upward. This resulted in an increase of the moment when vibrated. The average percentage change in the maximum radial component of the facet w a s 27% while the radial components of the facet parallel to the vibration exciter field were changed 36%.
Since the exposure field of the C-50 w a s 1 2 gauss at the base of the facet and 5 gauss at the top, inversion of the facet resulted in a change in the exposure field for the individual cards. For this reason, the percentage changes due to the vibration tests as listed in tables 2 and 3 a r e not equal. Due to the limited accuracy in the measurements *0.2 gamma, the data for the Encoder Converter Card seem somewhat erratic and is shown for comparison purposes only. The location of the maximum radial component of the DDP Model B Card is such that the increase in the maximum radial component after vibration shows only a 26% change while the other measurements show a change of more than 100%.
73

TABLE I
MAY 16, 1963 S-74 IMP DEPERM & VIBRATION TESTS
MAXIMUM RADIAL MOMENT IN GAMMA AT 18 INCHES
CARD POST DEPERM - SEPARATE POST DEPERM - FACET '% CHANGE
Encoder Converter DDP Mod B DDP Mod C DDP Mod D Facet
1.0 8.2
11.1 15.8
(30.1)
0.5 5.9
10.3 15.4 31.2
50 28
7 3 1
2 PI
Encoder Converter w B
2 Facet w m
2; Encoder Converter
i b E c W D E Facet
VIBRATION TESTS - EARTH'S FIELD
PRE-VIBRATION
1.0 8.2
11.1 15.8
(30.1)
(0.7) (6.4)
(10.5) (15.4) 30.6
POST VIBRATION
0.7 8.6
11.0 15.9 29.5
0.7 6.0
10.6 15.7 32.2
30 5 1 1 2
0 7 1 2 5
w u c k
( ) values culled from data and not directly observed.
TABLE I1
MAY 29, 1963 S-74 IMP DEPERM & VIBRATION TEST
MAXIMUM RADIAL MOMENT M GAMMA AT 18 INCHES
CARD POST DEPERM - SEPARATE POST DEPERM - FACET % CHANGE
Encoder Converter 0.7 0.1 86 DDP Mod B 6.1 5.5 10 DDP Mod C 9.9 9.8 1 DDP Mod D 15.2 15.4 1 Facet 31.3 30.9 1
________________________________________---------------------------------_--------
VIBRATION TEST - 12 GAUSS FIELD - DIRECTED UPWARD
PRE- VIBRATION POST VIBRATION
Encoder Converter B
D Facet
0.1 4.7 9.8
15.4 30.9
- 1.7 5.9 8.3
12.0 22.4
2 15 22 28
Radial Component Co-axial with Vibration Field ...................... _-___--------_-_-----
Encoder Converter B C D Facet
0.0 1.5 9.4
12.4 26.0
-0.8 3.4 7.6 8.7
16.3
127 19 30 37
74
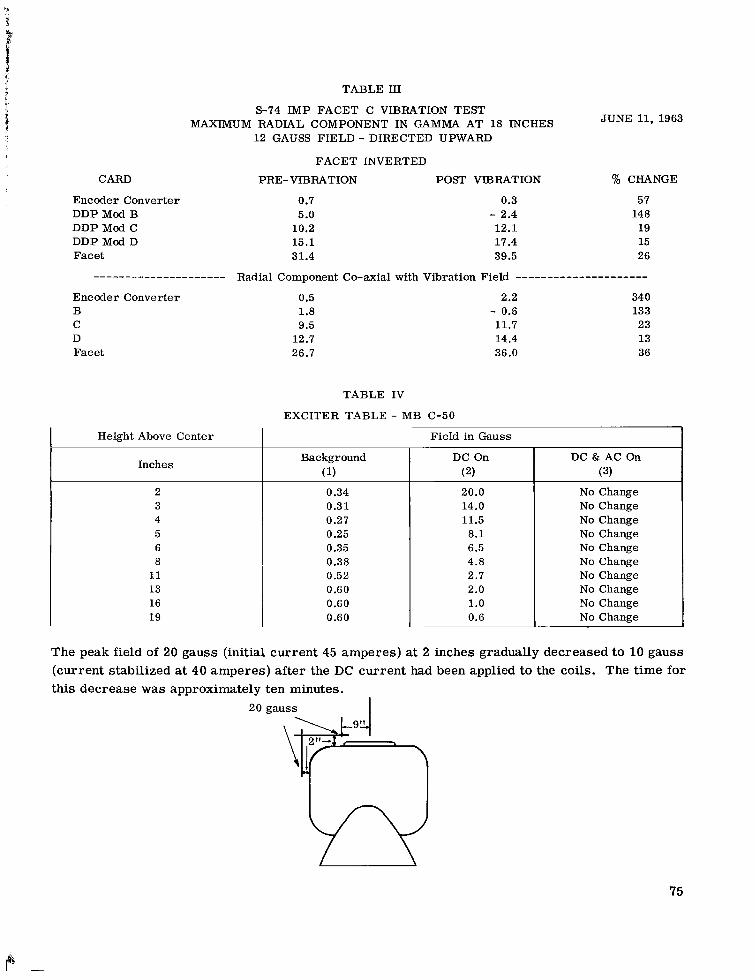
TABLE I11
S-74 IMP FACET C VIBRATION TEST JUNE 11, 1963 MAXIMUM RADIAL COMPONENT IN GAMMA AT 18 INCHES
12 GAUSS FIELD - DIRECTED UPWARD
FACET INVERTED
CARD PRE-VIBRATION POST VIBRATION % CHANGE
Encoder Converter DDP Mod B DDP Mod C DDP Mod D Facet
0.7 5.0 10.2 15.1 31.4
0.3 - 2.4 12.1 17.4 39.5
57 148 19 15 26
Radial Component Co-axial with Vibration Field ..................... .....................
Encoder Converter 0.5 B 1.8 C 9.5 D 12.7 Facet 26.7
TABLE IV
EXCITER TABLE - MB C-50
2.2 - 0.6 11.7 14.4 36.0
34 0 133 23 13 36
Height Above Center I Field in Gauss
Inches
2 3 4 5 6 8 11 13 16 19
Background ( 1)
0.34 0.31 0.27 0.25 0.35 0.38 0.52 0.60 0.60 0.60
DC On (2)
20.0 14.0 11.5 8.1 6.5 4.8 2.7 2.0 1.0 0.6
DC & AC On ( 3)
No Change No Change No Change No Change No Change No Change No Change No Change No Change No Change
The peak field of 20 gauss (initial current 45 amperes) at 2 inches gradually decreased to 10 gauss (current stabilized at 40 amperes) after the DC current had been applied to the coils. The time for this decrease was approximately
20 ten minutes. gauss
75

Height Above Center
Inches
1 2 3 4 5 6 7 8 9 10 11 12 16
TABLE V
EXCITER TABLE - MB C-125
Background (1)
2.5 2.2 1.8 1.7 1.4 1.2 1 .o 0.9 0.8 0.7 0.65 0.6 0.6
Field in Gauss
DC On (2)
20.0 17.0 14.0 12.0 10.0 8.2 6.7 5.7 4.7 4.0 3.4 2.8 1.0
DC & A C (3)
No Change No Change No Change No Change No Change No Change No Change No Change No Change No Change No Change No Change No Change
The peak field of 20 gauss gradually decreased to 13.5 gauss about ten minutes after the application of the DC power.
76
Appendix H
Atlantic Missile Range Magnetic Field Survey
MEMORANDUM Report No. 635-001
July 29, 1963
MEMORANDUM
To: Mr. Kenneth Mercy Acting Head, Systems Evaluation Branch
From: Mr. William Kenney Engineering Design Branch
Subject: Magnetic Measurements during Pre-Launch Operations of a Thor Delta Vehicle
SUMMARY
A magnetic survey was conducted for the S-74 (IMP) Project at the Atlantic Missile Range (AMR) to determine the magnetic environment present during the pre-launch operations. This is the first time magnetic measurements have been made of pre-launch operations. Three areas were covered: (1) the spacecraft laboratory, (2) the spin facility, and (3) the launch complex itself. The results of measurements taken in these areas indicate that there a re some high fields (a maximum of 2.2 kilogauss was recorded), but fortunately these high fields f a l l off rapidly. Some tools which could be used near the spacecraft were found to have a field Of 50 gauss.
The effect of the service tower as it moved away from the missile was measured and found to produce a change of 0.1 gauss. It is recommended that measurements be made at launch time to insure that handling equipment and tools o r modifications of facilities themselves do not introduce any high fields near the spacecraft. Reference: X-623-63-65, Project Delta, Test Plan for Magnetic Measurements at AMR.
INTRODUCTION
Magnetic measurements were made at AMR on July 8, 9, and 10. The referenced test plan was followed with few exceptions. The required instruments were obtained and calibrated before leaving GSFC. On arrival at AMR, it was determined to make measurements first at the launch
77

complex. The T-10 test of Syncom was in progress and measurements were made during very similar launch day operations. A brief physical tour of the a rea to be measured was made to determine possible sources of fields. Notes were made of these objects to assure a more detailed analysis later. For the most part, two portable gaussmeters were used, one for dc and one for ac. Readings were taken of the ac and dc fields present. The maximum value of fields was obtained by repositioning the probe. At high sources, the rate of fall-off was' determined by measuring ap- proximately 1 2 in. away from the source.
DETAILED ANALYSIS OF EACH AREA
Complex 17 - From Figure H-1, it can be seen that data was taken at all areas which could affect the spacecraft as it approaches the launcher. Possible sources of field were examined in
SPEAKER ON TOP,OF PAD - 10 LAUNCHER
17B
LAUNCHER 17A
LAUNCH OPERATIONS GATE BUILDING
NOTE: A.C. MEASUREMENTS WERE MADE AT SAME LOCATIONS ALL READING LESS THAN .l.
ALL VALUE LISTED ARE IN GAUSS
Figure H-1-Complex 17.
Function
Lower floors raised
Level 9A floors raised
Service tower moved back
more detail than others. Where values a re not listed, the values were approximately earth's field or less than .1 gauss ac.
Rather than measure the effect as the spacecraft was hoisted to level 9A, it was dicided that it would be more meaningful to examine each level for possible high sources. Figure H - 2 indicates magnetic fields that were observed on the various levels of the tower.
Effect of the Tower - An experiment was conducted to measure the over-all magnetic effect of the service tower a s it was moved away from the missile. Anticipating that it might be possible to do this, provision was made for a long cable to connect the probe to the measuring instrument. A Hewlett-Packard probe was attached to the skin of the fairing and the cable was brought down the umbilical tower to the instrument on the pad. A summary of results is shown below:
Change in Magnetic Field
0.06 gauss
0.13 gauss
0.10 gauss
78

4.3 ON CONTAINER
FLOOR MOTOR - 2 ( NON - OPERATING )
CRANE HOOK 8
WATER COOLER < . 1 A.C. UMBILICAL - 20
TOP OF 2nd STAGE 25
20 A.C. 60 CPS 15 D.C.
FLOOR MOTOR CONTROLLER
TERMINAL ROOM MISSILE CHECKOUT EQUIPMENT (NON-OPERATING) 7 . 1 A.C.
AIR-CONDITIONERS 1.5 UMBILICAL NUT 20
MOTOR TO RAISE FLOOR 2 A.C. OUTLET 1 (NON-OPERATING)
INTERSTAGE - 20
ELEVATOR WENT BY . 1 A.C. - 60 CPS
COMPRESSOR
ELEVATOR MOTOR CHECKED
5
A. .c.
Figure H-2-Thor-Delta tower.
Additional Items - The transporter dolly and transfer truck were in the area and were checked. A field of three gauss was found on the bolts on top of the dolly. Some batteries being used on level 8B to power equipment in the missile had a field of five gauss. These were 24-cell NiCad, manufactured by the Sonotone Corporation.
Spacecraft Laboratory - Figure H-3 shows various fields that were measured in the spacecraft laboratory. Some of these areas are not completed. Benches and shelves were not in their final positions in the assembly area. One of the motors for the crane was measured on the ground (2 gauss). The doors in the shipping area were not installed. There was no equipment in the solar room.
79

VERTICAL BEAM: - 3 STE,EL PLATES IN FLOOR - 14
ALL VALUE LISTED ARE IN GAUSS
‘ROL ’ cps
I AREA 1
Figure H-3-Spacecraft laboratory Building A-E.
Spin Facility - The physical layout of the equipment used in the spin facility with their meas- ured fields is shown in Figure H-4. It was here that the highest field was measured. In the bottom of the nozzle alignment jig, evidently some piece was permanently magnetized but localized to a very small area. One foot away earth’s field was measured. A new large spin jig facility which is to be used for I M P had not arrived.
Other Items Measured
Item Gauss
Hand Tools Screw driver Socket Wrench
Lifting harness Lifting beam with steel cables “lttach fitting
50 7 5 7 1

-- Item Gauss __
Fairing Connectors 20 Cable tie-down bolts 3 Carrying handle bolts 3
Canopy rivets 3 Locking clips 3
Rivets in explosive bolt ring 3
Spacecraft handling container
X-248 Rocket motor
Other par ts
CONCLUSIONS
Even though there a re several objects which could affect the spacecraft, these objects would definitely have to be moved close to the spacecraft itself. For the most part, the high field objects a r e separated by at least twelve inches and are not normally removable. One class of objects which a re movable and could be used on the spacecraft are hand tools. There- fore, it is recommended that non-magnetic tools be obtained and used. Also, it would be advis- able to obtain non-magnetic clips and hardware for the fairing and the spacecraft container. The removal of permeable objects in the vicinity of a spacecraft is desirable. Therefore, to insure a more successful flight, it is recom- mended that final precautions be made at launch time. Personnel assigned to the spacecraft can be given instructions that magnetic equipment is not allowed near the spacecraft, under any circumstances. Personnel, with the proper equipment, can be assigned to "guard" the space- craft from high fields. A check of areas can be made before the spacecraft is brought into the area. These last-minute measurements would take care of changes in facilities which could affect the spacecraft.
1
LIGHT FIXTURES 5 - CORD HOLDER> SHELVES - 3 -
N A I L S - 30
WORKSHOP 0 "l
D U C T 6
OVERHMD ARM
10' x 10'
T O O L CHEST ( 125 RPM) 4 K N O B S
OVERHMD ARM
10' x 10' LEGS,- 6 4
K N O B S
3 - S T A N D ' CONTROL
AREA 5 2.6 Kg
D O O R 5
(OPER)
Figure H-4-Spin facility.
81

1
Appendix I
Perming Effects of Tools and Equipment
Engineering Design Branch Files
Mr. Charles Harris Magnetic Test Section
Magnetization of Components with Magnetic Tools and Equipment
Information has been gathered regarding the magnetizing effects of magnetized tools and equipment which have been used to expose various samples. The results of the tests performed clearly indicate that magnetic tools can magnetize items; however, the intensity of magnetization would be somewhat less than that of an applied exposure field of equal magnitude. In addition, it is possible for the tools to demagnetize instead of magnetizing the item if their fields are in opposition. Where requirements demand that components o r spacecraft not be magnetized to any noticeable extent, then, in order to remove any possible magnetizing effects from tools either or both of the following courses of action a r e recommended:
1. Deperm all tools which might come in contact with the components o r spacecraft.
2. Monitor the components o r spacecraft so as to prevent the use of magnetic tools near the components or spacecraft.
There has arisen some question in regard to what effect tools and equipment which a r e mag- netic would have on components when the components a r e exposed to the tools. In order to resolve these questions, a number of measurements have been taken and the results a r e now summarized.
Data on the magnitude of the field which might be found with various tools is included in the enclosed list of tools (Table 1-1) which have been measured. In the case of these particular tools, the maximum field detected w a s 100 gauss (measured on the surface of the item). For all the tools, the fall off rate of the field w a s such that at 1 inch from the item, the magnitude of the field w a s less than one gauss. A t 12 inches, the field would be less than 500 gamma. In order for the tool to have any effect on the component, it would be necessary to bring the component to within a distance of less than 1 inch from the tool or vice versa.
The extent t o which a component is magnetized by a tool depends mainly upon the magnitude and uniformity of the exposure field and the internal composition of the component. An example of this increase in the permanent magnetization can be seen in the enclosed Table 1-2. In this case

Table 1-1
Assorted Tools.
Item
Holding Screwdriver
Diagonals (small)
Scissors (long)
6-inch Steel Tape
Red-Handled Strippers
Dividers
Diagonals (small)
12-inch Rule Steel
Phillips Screwdriver (6" long) (Table 1-3)
Long Nose Pliers (small)
Long Nose Pl iers (large)
Scriber
Socket Box
Scale 6-inch Steel
Hammer
Hatchet
Simpson Multimeter (on meter glass --.ce)
Table 1-2
Magnetic Field Effect.
EXPOSURE FIELD (gauss)
84
Maximum Field on Surface in G a u s s
-. .
30
33
12
5.5
20
25
14
30
55
13
10
100
8
20
5
4
+125
the exposure field is quite uniform so that the extent of magnetization is greater than that ob- tained with a tool which had the same magnitude of field. This table indicates that the normal component or item could be exposed to a field of less than 5 gauss without a significant increase in its initial permanent magnetization; whereas, a component with a smaller field is noticeably effected. A ser ies of comparison tests were performed with Raychem #26 wire (previously tested and determined to be magnetic). It was determined that when the wire was exposed to a field greater than 5 gauss, the permanent mag- netization of the wire increased, (Table 1-3). In the case where the wire was cut with diagonal cutters (maximum field on surface 33 gauss) the permanent magnetization of the wire increased from 0.8 gamma to 4.8 gamma (distance - 12 inches). When this wire was exposed to a uniformly
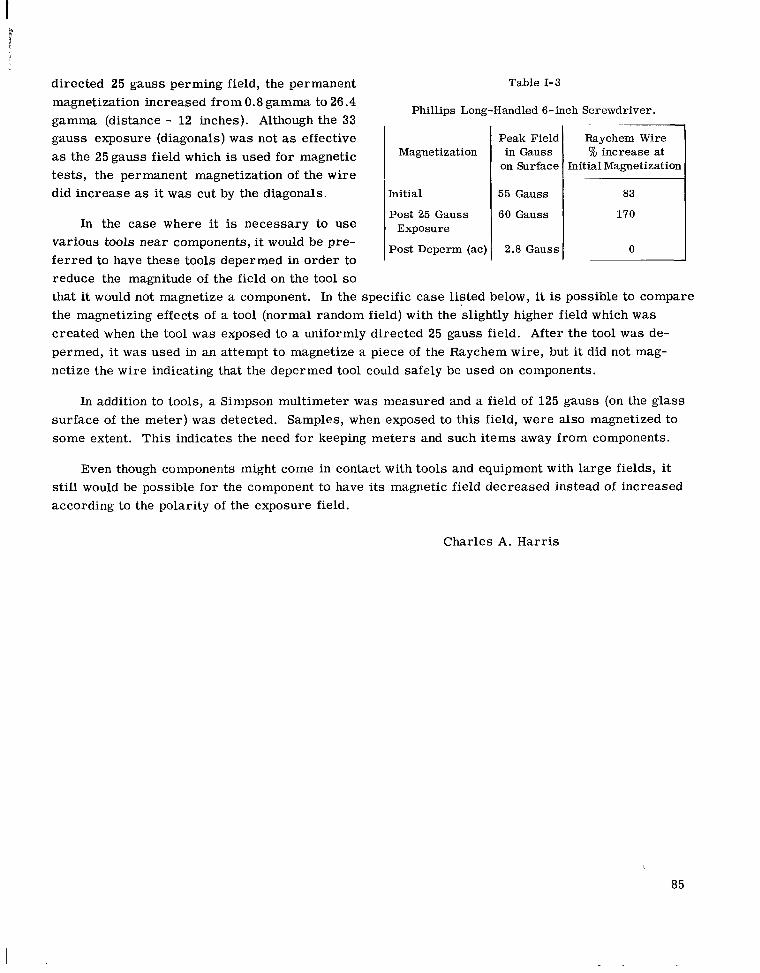
f' ~
t
directed 25 gauss perming field, the permanent magnetization increased from 0.8 gamma to 26.4 gamma (distance - 12 inches). Although the 33 gauss exposure (diagonals) w a s not as effective as the 25 gauss field which is used for magnetic tests, the permanent magnetization of the wire did increase as it was cut by the diagonals.
In the case where it is necessary to use various tools near components, it would be pre- ferred to have these tools depermed in order to reduce the magnitude of the field on the tool so
Table 1-3
Phillips Long-Handled 6-inch Screwdriver.
Magnetization
hitial
Post 25 Gauss Exposure
Post Deperm (ac)
Peak Field in Gauss
on Surface
55 Gauss
60 Gauss
2.8 Gauss ~
Raychem Wire '% increase at
hitial Magnetizatior
83
170
0
that it would not magnetize a component. In the specific case listed below, it is possible to compare the magnetizing effects of a tool (normal random field) with the slightly higher field which w a s created when the tool w a s exposed to a uniformly directed 25 gauss field. After the tool w a s de- permed, it w a s used in an attempt to magnetize a piece of the Raychem wire, but it did not mag- netize the wire indicating that the depermed tool could safely be used on components.
In addition to tools, a Simpson multimeter was measured and a field of 125 gauss (on the glass surface of the meter) w a s detected. Samples, when exposed to this field, were also magnetized to some extent. This indicates the need for keeping meters and such items away from components.
Even though components might come in contact with tools and equipment with large fields, it still would be possible for the component to have its magnetic field decreased instead of increased according to the polarity of the exposure field.
Charles A . Harris
85


Appendix J
Spacecraft Magnetic Check at Fredericksburg, Va.
In order to determine whether the magnetic field experiment aboard the IMP spacecraft is operating properly, it is necessary to simulate interplanetary magnetic field conditions and place the spacecraft in such an environment so that the magnetic field sensing equipment can be checked for range and calibration. The Fredericksburg Magnetic Observatory has a facility for creating this environment.
The purpose of these notes is to outline the tests and the procedure so that the personnel in- volved may be better informed and thus participate more fully in the orderly completion of the program.
The tests to be run fall into three general categories:
1. Fluxgate Magnetometers 2. Fluxgate Signal Processor 3. Rubidium Vapor Magnetometer
1. Fluxgate Magnetometers
There a r e five tests to be conducted on each fluxgate magnetometer: zero, sensitivity cali- bration, linearity, saturation, and polarity.
(a) Zero check and sensitivity calibration
These two tests a r e run at the same time. The fluxgate booms are aligned such that the flux- gate sensors lie in the north-south direction in the horizontal plane. The sensors a r e then, on alternate fluxgate encoder frames, unplugged and reversed. At each position the appropriate frame should be printed out from the portable de-com. and the sensor direction noted on the print out by a plus o r minus sign. To conform with previous convention and to assure uniformity, the white end of the sensor plugged into the cable is positive.
The sensitivity calibration is automatically recorded at each print out.
(b) Linearity check
Position of the sensors remains the same. This test is performed by connecting a constant current source directly to the FMO magnetic field coils. A field up to and including &50 gamma is produced in 10 gamma steps. At each step the results should be printed out and appropriately
87

labeled. It may be necessary to return to a zero reference in between the 10 gamma steps if the earth's magnetic field is noisy on the day in question.
(c) Saturation check
This check can be made at any convenient time. It consists of running each fluxgate in earth's field in both the plus and minus direction to determine the positive i d negative saturation levels. As in the other tests, the results should be printed out and properly documented.
(d) Polarity check
By using another fluxgate magnetometer whose polarity is known, one can determine the di- rection of the field within the coil system and hence ascertain the polarity of the spacecraft sensors.
2. Fluxgate Signal Processor
This test determines the minimum level at which the signal processor operates, and ascertains that the flux-maximum indication occurs at the proper time.
A sinusoidal current simulating spacecraft spin is fed from the flux-maximum panel to a coil placed over the fluxgate "A" sensor. The output from a Strobotac, which flashes on the optical aspect sensor, is sent to the flux-maximum panel. The signal level for operation of the fluxgate signal processor is monitored at the turn-on panel.
At the beginning of this test it would be advantageous to start with a signal level of 3 volts P-P and make sure everything is operating properly. Then the amplitude should be reduced to 0.5 volts P- P and gradually raised to 3 volts P- P in 0.5 volt P- P increments.
To determine whether the flux-maximum indication occurs at the proper time, a comparison is made in the time between the optical aspect pulse and the flux-maximum pulse in both the flux- maximum panel output and the telemetry output. This should correlate within 2 or 3 counts.
It is very important that the signals in the flux-maximum panel and the spacecraft be in phase. In other words, a positive field simulation from the current source in the flux-maximum panel should appear as a positive field to the fluxgate sensor.
3. Rubidium Vapor Magnetometer
The tests to be performed on the Rb magnetometer are: range, nulls, and bias sphere calibration
Sometime prior to these tests, the bias sphere and heat shield should be removed so that the Rb lamp can be heated to the proper operating temperature. These a r e not replaced until the bias sphere test is to be performed.
(a) Range test
For this test is is necessary that the spacecraft be oriented such that the Rb magnetometer, i.e., the spin axis, is at an angle of 45" with the horizontal, and aligned in the north-south direction. The entire fourth sequence should be printed out and appropriately labeled.
88
(b) Nulls test
For this test the payload is rotated about the east-west axis to determine how close to the null points the magnetometer wil l operate. Assuming the magnetometer tube is pointing directly north and designating this position as O", these null points would be 0", go", and 180". The magnetometer output is printed out and the angular position on each side of each null point at which the magnetom- eter signal "locks in" is recorded.
(c) Bias sphere calibration
The bias sphere must be replaced on the tube assembly for this test, and the payload oriented as in test 3(a). The entire fourth sequence should be printed out and labeled.
The following is a list of some of the equipment to be furnished by the integration personnel: portable de-com., turn-on panel, interrupter boxes (one for each type connector), flux-maximum panel, coils for flwgate sensors with cables and connectors for flux-maximum panel, and equip- ment necessary for exciting the sun sensor. In addition all curves (period count to temperature, period count to flwgate voltage or magnetic field) must be available. Also the experimenter re- quires the output of the fourth sequence from telemetry filtered sufficiently that it may be counted. The experimenter wil l furnish counter and printer for this output.
The following data should be provided for the experimenter:
1. All printouts properly labeled for all tests.
2. For the flux-maximum test the output counts from the telemetry and the flux-maximum panel must be in the same format so that comparison can be made.
3. Temperatures from PP-6 and PP-13.
NASA-Langley, 1966 G-656 89

“The aeronautical and space activities of the United States shall be conducted so as to contribute . . . to the expansion of hziman knowl- edge of phenomena in the atmosphere and space. The Administration shall provide for the widest practicable and appropriate dissemination of information concerning its actiuities and the resul/s thereof .”
-NATIONAL AERONAUTICS AND SPACE ACT OF 1958
NASA SCIENTIFIC AND TECHNICAL PUBLICATIONS
TECHNICAL REPORTS: important, complete, and a lasting contribution to existing knowledge.
TECHNICAL NOTES: of importance as a contribution to existing knowledge.
TECHNICAL MEMORANDUMS: Information receiving limited distri- bution because of preliminary data, security classification, or other reasons.
CONTRACTOR REPORTS: Technical information generated in con- nection with a NASA contract or grant and released under NASA auspices.
TECHNICAL TRANSLATIONS: Information published in a foreign language considered to merit NASA distribution in English.
TECHNICAL REPRINTS: Information derived from NASA activities and initially published in the form of journal articles.
SPECIAL PUBLICATIONS Information derived from or’ of value to NASA activities but not necessarily reporting the results .of individual NASA-programmed scientific efforts. Publications include conference proceedings, monographs, data compilations, handbooks, sourcebooks, and special bibliographies.
Scientific and technical information considered
Information less broad in scope but nevertheless
Details on the availability o f these publications may be obtained from:
SCIENTIFIC AND TECHNICAL INFORMATION DIVISION
NATIONAL AERONAUTICS AND SPACE ADMINISTRATION
Washington, D.C. 90546