Embed Size (px)
Citation preview
ORIGINAL ARTICLE
doi:10.1111/evo.12171
IMMUNE EVASION AND THE EVOLUTIONOF MOLECULAR MIMICRY IN PARASITESAmy Hurford1,2,3,4 and Troy Day1,5
1Department of Mathematics and Statistics, Queen’s University, Kingston, Ontario, Canada2Department of Biology, Memorial University of Newfoundland, St. John’s, Newfoundland and Labrador, Canada3Department of Mathematics and Statistics, Memorial University of Newfoundland, St. John’s, Newfoundland and
Labrador, Canada4E-mail: [email protected]
5Department of Biology, Queen’s University, Kingston, Ontario, Canada
Received December 3, 2012
Accepted May 8, 2013
Data Archived: Dryad doi: 10.5061/dryad.3vf7p
Parasites that are molecular mimics express proteins which resemble host proteins. This resemblance facilitates immune evasion
because the immune molecules with the specificity to react with the parasite also cross-react with the host’s own proteins, and
these lymphocytes are rare. Given this advantage, why are not most parasites molecular mimics? Here we explore potential factors
that can select against molecular mimicry in parasites and thereby limit its occurrence. We consider two hypotheses: (1) molecular
mimics are more likely to induce autoimmunity in their hosts, and hosts with autoimmunity generate fewer new infections
(the “costly autoimmunity hypothesis”); and (2) molecular mimicry compromises protein functioning, lowering the within-host
replication rate and leading to fewer new infections (the “mimicry trade-off hypothesis”). Our analysis shows that although both
hypotheses may select against molecular mimicry in parasites, unique hallmarks of protein expression identify whether selection is
due to the costly autoimmunity hypothesis or the mimicry trade-off hypothesis. We show that understanding the relevant selective
forces is necessary to predict how different medical interventions will affect the proportion of hosts that experience the different
infection types, and that if parasite evolution is ignored, interventions aimed at reducing infection-induced autoimmunity may
ultimately fail.
KEY WORDS: Antigenicity, autoimmunity, clonal deletion, immunopathology, pathogen, within-host.
Parasites that are molecular mimics express proteins which re-
semble host proteins (also termed “self proteins”). There are nu-
merous examples of parasites that mimic human cells (Oldstone
1998) including Campylobacter jejuni, which causes food poi-
soning and mimics a human ganglioside (Ang et al. 2004), human
cytomegalovirus, which infects 10% of infants under 6 months
age (Landolfo et al. 2004) and mimics endothelial receptors
(Michelson 2004) and the protozoan Trypanosoma cruzi, which
mimics myocardial cells (Petkova et al. 2000). Parasites that are
mimics are likely to evade the immune system because the host
is averse to harming itself. Autoimmunity refers to host tissue
damage caused by the host immune system. To the extent that
mimicking parasites are structurally similar to self-proteins, the
immunological processes that protect the host against autoimmu-
nity leave mimics protected from an immune response as well.
The process that prevents autoimmunity is clonal deletion. Dur-
ing clonal deletion lymphocytes are tested against self-proteins,
and highly self-reactive lymphocytes are destroyed as a means
of preventing an immune response to self (Goodnow et al. 2005;
Hogquist et al. 2005). Therefore, parasites that are molecular
mimics presumably obtain a fitness advantage over their non-
mimicking counterparts through the evasion of an immune re-
sponse (Damain 1964; Young et al. 2002; Elde and Malik 2009;
Wolfl and Rutebemberwa 2008).
Although these benefits of mimicry seem clear (Begon et al.
1990, p. 963; Elde and Malik 2009), the costs of such mimicry are
1C© 2013 The Author(s).Evolution

A. HURFORD AND T. DAY
less obvious. Such costs presumably exist, however, because there
are a great number of parasite species that have not evolved to be
molecular mimics. Although hypotheses for why mimicry does
not evolve have been presented, understanding why such mimicry
is not a ubiquitous feature of most organisms is a long-standing,
and unanswered, problem in evolutionary ecology (Ruxton
et al. 2004). Our goal is to use a mathematical model to explore
two hypotheses for how molecular mimicry is selected against in
parasites.
There exists substantial evidence that parasites which are
molecular mimics are more likely to induce an autoimmune re-
sponse in their host (Kirchoff 1993; Appelmelk et al. 1996; Kohm
et al. 2003; Ang et al. 2004; Rahbar et al. 2006; Dobbs et al.
2008). Our first hypothesis is therefore that hosts which develop
an autoimmune response are less productive for the parasite be-
cause they produce fewer new infections. Thus, the risk of in-
ducing autoimmunity selects against mimicry in parasites (the
“costly autoimmunity hypothesis”; Damain 1964). The autoim-
mune response occurs because, although clonal deletion in hosts
removes a large number of self-reactive lymphocytes, some self-
reactive lymphocytes nevertheless remain in circulation (Wing
2006). These lymphocytes might then be activated by parasites
that are molecular mimics and cross-react with self tissues, caus-
ing autoimmunity (von Herrath and Oldstone 1995, 1996; Ohashi
1996; Hausmann and Wucherpfennig 1997).
The second hypothesis is that the shape of the parasite’s
proteins is constrained, such that becoming a mimic necessarily
entails a compromise in other aspects of parasite function (the
“mimicry trade-off hypothesis”). There is evidence for such a
trade-off in influenza A, for example, because the viral nucleo-
protein that is targeted by cytotoxic T cells also plays a critical role
in viral replication (Docherty et al. 2006; Ye et al. 2006). Conse-
quently, there might be little scope for modifying this nucleopro-
tein to evade the immune response without also compromising its
function in viral replication and transmission.
To determine the conditions under which each of the above
hypotheses might provide a plausible explanation for the lack
of mimicry in parasites, we first construct a general mathemat-
ical model describing the epidemiological dynamics of parasite
spread (section “Model”). We then determine the evolutionarily
stable level of parasite mimicry under each hypothesis, and these
results are used to determine if there are characteristics of protein
expression or predictions specific to each hypothesis that allow us
to distinguish between them (sections “General properties of the
parasite ESS” and “Selection for mimicry”). Finally, we consider
the potential consequences of certain public health interventions
on the evolution of parasite mimicry and on the occurrence of
the different types of host disease (section “The effect of medical
interventions on the evolutionarily stable parasite phenotype and
the types of infections that are induced in the host”).
ModelTo derive our mathematical model, we begin by describing the
between-host epidemiological spread of a parasite. Different par-
asite genotypes are assumed to correspond to different parasite
phenotypes and are represented in the epidemiological model as
different parameter values. We derive an expression for parasite
fitness as it depends on the between-host spread (section “Epi-
demiological dynamics”). Next, we formalize each of our two
hypothesis in terms of between-host spread and parameters corre-
sponding to the within-host reproduction of the parasite (section
“Formalizing the costly autoimmunity and the mimicry trade-off
hypotheses”). We then link the within-host and between-host pa-
rameters that have been defined (section “Relating the parasite
phenotype to the types of infections”), and finally, we derive an
expression that quantifies mimicry (section “Defining mimicry”).
Definitions of the notation used are provided in Table 1.
EPIDEMIOLOGICAL DYNAMICS
The epidemiological model describes the rate of change in the
number of hosts that are susceptible to an infection, S, or that are
experiencing one of three different kinds of infectious states (de-
noted with I , A, and U ), or either of two different postinfection
states (denoted Z and R; Fig. 1). For the three different types of
infectious states, the type of disease that is induced depends on
the nature of the interaction between the parasite and the host’s
immune system. The first type of infection that may occur is an
acute infection. An acute infection occurs if lymphocytes effec-
tively react with the parasite, but not with normal host cells (i.e.,
self). We use I to denote the number of these infections. The
second type of infection is one that leads to autoimmune disease.
This can occur if lymphocytes react with both the parasite and with
self (i.e., cross-react). We use A to denote the number of hosts
that experience an infection that is cross-reactive and may lead
to autoimmunity. The third type of infection is an uncontrolled
infection. An uncontrolled infection can occur if the immune re-
sponse is ineffective against the parasite, and we use U to denote
the number of such infections in the population.
Hosts that experience an acute infection or an infection that
may lead to autoimmune disease may clear the parasite, thus be-
coming noninfectious. We use R to denote the number of hosts
that are postacute infection and no longer infectious or susceptible,
and we use Z to denote the number of hosts that have autoim-
munity, but are no longer infectious. It is assumed that hosts that
develop autoimmunity cannot be reinfected, because the contin-
ued immune response to self prevents the establishment of the
parasite. We use a general model formulation where, following
an acute infection, hosts may either return to the susceptible state
(SIS) or recover (SIR). In applying this model to a particular
parasite species, either the SIS or the SIR formulation will be
2 EVOLUTION 2013

IMMUNE EVASION AND THE EVOLUTION OF MIMICRY
Table 1. List of notation
Characteristics of the parasiteα j The probability the parasite activates a type j lymphocyte.�α A vector of length k with elements given by the α j ’s.z j The contribution that a protein targeted by a type j lymphocyte makes to parasite replication.ρ = corr(α j ,� j ) Mimicry. If ρ > 0 a parasite is then classified as is a mimic.|�α| = 1
k
∑kj=1 α j Antigenicity, i.e., the potential for a parasite to elicit an immune response.
f (�α) = ∑kj=1 α j z j The parasite replication rate.
Characteristics of host immunology� j The self-reactivity of a type j lymphocyte.ω j The frequency of type j lymphocytes.r The total number of lymphocytes that the parasite is tested against.
Jointly determined immunological parametersα = ∑
α jω j The probability that a randomly selected lymphocyte reacts to the parasite.α� = ∑
α j� jω j The probability that a randomly selected lymphocyte cross-reacts.q = 1 − (1 − α)r The probability of an effective immune response.p = (1 − (1 − α�)r )/q The probability of an autoimmune disease given an effective immune response.
Epidemiological parametersRi The number of secondary infections generated by a host with a disease of type i .βi = β(·)νi The transmission rate for a disease of type i . The parameter νi is a scalar that reflects the effect
of the type of disease on the transmission rate.β(·) The transmission rate of the parasite as it depends on the parasite replication rate.Ri = Ri/β(·) A factor that multiplies β(·) to give Ri .φ = 1 − RU −RI
RU −RAThe relative cost of autoimmunity.
ψ = RU −RIRU
The relative cost of an acute infection.τ = 1 − 1−(1−ωk c)r
1−(1−ω1c)r The relative rarity of highly self-reactive lymphocytes.
more appropriate, but these different cases can be treated within
the general framework by setting the appropriate rate parameters
equal to 0.
Given an infection, let q be the probability of an effective
immune response to the parasite, and let p be the probability of
autoimmunity given that an immune response occurs. Then, the
above assumptions can be embodied in the following system of
differential equations:
d S
dt= −�S + bS S + bI I + bA A + bU U + bR R + bZ Z
+ γI I + γA A − d S,
d I
dt= �S(1 − p)q − vI I − uI I − γI I − d I,
d A
dt= �Spq − vA A − u A A − γA A − d A,
dU
dt= �S(1 − q) − vU U − dU,
d R
dt= uI I − d R,
d Z
dt= u A A − vZ Z − d Z , (1)
where � = βA A + βI I + βU U is the force of infection, bi is thebirth rate, γi is the rate of becoming noninfectious and suscepti-
ble, ui is the rate of becoming noninfectious (and either recovered
or with an autoimmune disease), vi is the disease-induced mor-
tality rate for hosts in the state i ∈ {S, I, A, U, Z , R}, and the
background mortality rate is d (Fig. 1).
Our model is structured such that given an infection, one of an
acute infection, autoimmunity, or an uncontrolled infection, will
occur. This is an appropriate formulation given that our objective
is to understand parasite evolution rather than to faithfully recre-
ate the epidemiology of modern day parasites. In other words,
it is irrelevant if uncontrolled infections are rare among extant
parasite species, because we are interested in considering all of
the phenotypes that are theoretically possible. Nevertheless, there
are several examples of extant parasite species that support our
model formulation (Table 2).
From the model of the epidemiological dynamics, we de-
termine the parasite evolutionarily stable strategy (ESS). This is
a parasite phenotype that, if it becomes established in the host
population, cannot be invaded by another phenotype given that
the new phenotype is rare (Maynard Smith 1982). The probabil-
ities p and q depend jointly on characteristics of the host and
the parasite, but for this analysis we assume that host phenotypes
are fixed on the time scale of parasite evolution, and so we can
assume that different parasite phenotypes may result in different
values of p and q . If there are two types of parasites present in
the population simultaneously (one of which is rare), and these
EVOLUTION 2013 3
A. HURFORD AND T. DAY
ΛSq(1-p)
ΛSpq
ΛS(1-q)dS
u A
u I
dR
S
I
A
U
R
Z
b S + b I + b A + b U + b R + b Z
S I A
U R Z(v + d)II
(v + d)AA
(v + d)UU
(v + d)ZZ
γ II
γ AA
infectious
I
A
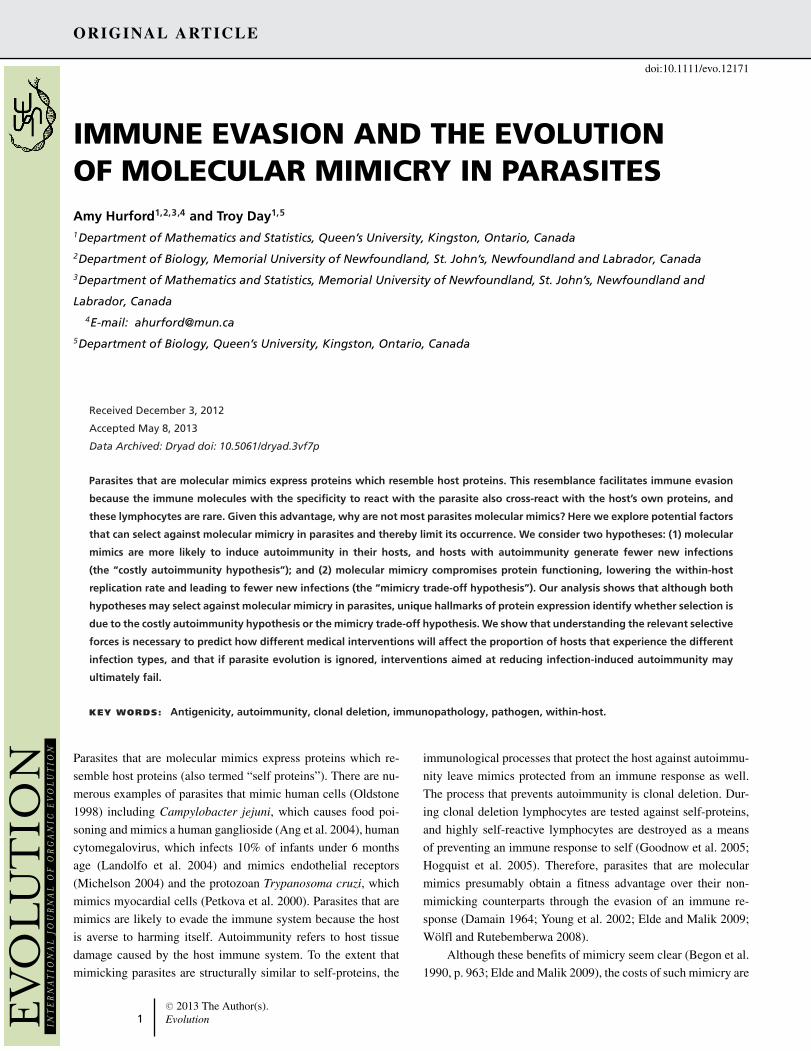
Figure 1. Given an infection susceptible hosts, S, will develop one of three types of diseases: an acute infection, I , an autoimmune
disease, A, or an uncontrolled infection, U . In each of these three states ( I , A, and U), hosts are infectious and may transmit the parasite
to susceptible hosts. Hosts with an acute infection either recover (R) or become susceptible again. Host with autoimmune disease may
clear the parasite then becoming uninfectious but still experiencing autoimmunity (Z), or return to the susceptible state. The prevalence
of lymphocytes and the types of lymphocytes that are activated by the parasite determines the probability that susceptible hosts enter
the I , A, or U state given an infection (see section “Relating the parasite phenotype to the types of infections”). Biological evidence to
justify this framework is provided in Table 2.
parasites compete to infect susceptible hosts, then the ESS is the
phenotype p and q that maximizes,
R0 = RI (1 − p)q + RA pq + RU (1 − q), (2)
(see Appendix A of Supporting Information for the derivation).
This quantity is the expected number of secondary infections that
the host generates while infected with a parasite of a particular
phenotype. Here Ri is the expected number of secondary infec-
tions generated by a host with an infection of type i , where
RI = βI
vI + d + γI + uI, RA = βA
vA + d + γA + u A,
and RU = βU
vU + d.
Understanding parasite evolution requires identifying trade-
offs that exist between different parameters in the expression for
R0. Next, we will explicitly characterize the dependence of p,
q, and the Ri s on characteristics of the host immune system
and properties of the proteins expressed by parasites, to mech-
anistically characterize the interrelatedness of the parameters in
eq. (2).
FORMALIZING THE COSTLY AUTOIMMUNITY
AND THE MIMICRY TRADE-OFF HYPOTHESES
The parasite phenotypeEach parasite genotype is assumed to correspond to a distinct
parasite phenotype. Parasite phenotypes affect the probability of
inducing autoimmunity, an acute infection, or an uncontrolled
infection through the expression of different types of proteins that
are broken down into antigens and presented to immune system
molecules (i.e., lymphocytes). Lymphocytes are indexed by j
from 1 to k, where this index is chosen so that more highly self-
reactive lymphocytes have higher values of j . This indexing is
needed to distinctly identify each different lymphocyte, and the
assumption that higher values of j correspond to higher values of
self-reactivity is made so that some meaning can be taken from
the indexing, rather than using an arbitrary labeling scheme.
Each parasite phenotype activates different lymphocytes with
different probabilities. The parasite phenotype is �α, a vector whose
elements, 0 ≤ α j ≤ 1, are the probabilities of activating the differ-
ent types of lymphocytes, j . All else equal, a parasite’s within-host
reproductive success will always increase with reduced reactivity.
Thus, natural selection will tend to favor those parasites with as
little reactivity as possible (i.e., parasites whose phenotype �α has
elements that are as small as possible), however, many parasites
have not evolved such complete mimicry and our goal is to ex-
plore potential reasons why. The costly autoimmunity hypothesis
is based on the idea that constraints exist among the elements of
�α. The mimicry trade-off hypothesis is based on the idea that there
is a trade-off between low reactivity (i.e., having all elements of
�α be small) and other aspects of parasite function.
Both the costly autoimmunity hypothesis and the mimicry
trade-off hypothesis can be formulated using a common model-
ing framework. To do so, let f (χ(�α), θi ) represent the average
4 EVOLUTION 2013
IMMUNE EVASION AND THE EVOLUTION OF MIMICRY
Table 2. The model assumes that a parasite may generate any of three different possible diseases (Fig. 1). Biological evidence jus-
tifying this framework is provided for four different parasites. An acute infection occurs when parasite proliferation is limited by the
immune system. Autoimmunity occurs when the lymphocytes activated by a parasite cross-react and destroy human tissues. Uncontrolled
infections are defined by the absence of an immune response to the parasite.
Parasite Acute infection Autoimmunity Uncontrolled infection
Campylobacter jejuni Gastroenteritis, Asymptomatic(Havelaar et al. 2009)
Guillain Barre, Miller-Fisher Syndrome(Rees et al. 1995; Nachamkin 2002)
In an immunocompromisedpatient (Johnson et al.1984)
Human cytomegalovirus Latent infection shedthroughout lifetime,Asymptomatic(Landolfo et al. 2004)
Systemic lupus erythematosus, Crohn’sdisease and ulcerative colitis(Hrycek et al. 2005; Rider et al. 1997;Chang et al. 2003; Rahbar et al. 2006)
In immunocompromisedpatients (Landolfo et al.2004)
Trypanosoma cruzi None Chagas’ disease(Higuchi et al. 1993; Kirchoff 1993)
Chagas’ disease(Tarleton et al. 1999;Tarleton 2001)
Helicobacter pylori None Idiopathic Parkinsonism, H. pylori-linkedautoimmunity, Thyrobocytopenia(Dobbs et al. 2008; Appelmelk et al.1996; Franchini et al. 2007)
Gastritis, peptic ulcers(Kuipers et al. 1995)
within-host density of the parasite during an infection, as a func-
tion of the parasite’s replication rate, χ(�α), and parameters related
to the type of infection induced, θi . Furthermore, suppose that
the between-host transmission rate is an increasing function of
average within-host parasite density. This assumption is sup-
ported by empirical results (Mackinnon and Read 1999; Fraser
et al. 2007; de Roode et al. 2008) and is related to the common
transmission-virulence trade-off assumption made in theoretical
evolutionary epidemiology (Antia et al. 1994; Alizon et al. 2009).
Thus, we define the between-host transmission rate when an
infection of type i is induced as,
βi = β[ f (χ(�α), θi )], (3)
where βi is a monotonically increasing function of f (χ(�α), θi )
to reflect the assumption that higher between-host transmission
occurs for parasites with higher within-host densities. The two hy-
potheses can then be viewed, mathematically, as corresponding to
different assumptions about the form of the function f (χ(�α), θi ).
The costly autoimmunity hypothesisThe costly autoimmunity hypothesis is based on an assumption
that there are constraints among the elements of �α. In particular,
we suppose that the average of the α j across all lymphocytes must
be at least c. Put another way, there is a minimum level of conspic-
uousness that the parasite must exhibit, and alternative parasite
phenotypes differ in terms of which lymphocytes they activate. Bi-
ologically, this assumption is made because the immune system
possesses the potential to respond to almost any antigen (Kindt
et al. 2007; p. 12, 111, 248). Mathematically, this hypothesis is
modeled by assuming that the parasite’s replication rate χ(�α) is a
constant for all values of �α yielding an average at least as large as
c, and 0 otherwise:
χ(�α) ={
c if 1k
∑kj=1 α j ≥ c
0 otherwise.(4)
The assumptions, thus far, constrain parasite evolution to pre-
vent the evolution of a parasite that completely evades the immune
system. To embody the necessary property that autoimmunity is
costly, we additionally require that RU > RI > RA. As such, the
cost of autoimmunity is that the fewest number of new infections
are generated when autoimmunity occurs.
The mimicry trade-off hypothesisFor the mimicry trade-off hypothesis, selection against mimicry
occurs because specific proteins contribute to some other aspect
of parasite function, and evolving mimicry would compromise
functionality in these other respects. For example, known tar-
gets of the immune system are a viral nucleoprotein of Influenza
A (Docherty et al. 2006) and a component of bacterial flagel-
lum (Hayashi et al. 2001), and failure to express these proteins
compromises viral replication (Ye et al. 2006) and bacteria loco-
motion. Therefore, we assume that the parasite’s replication rate,
χ(�α), is given by the function,
χ(�α) = 1
k
k∑j=1
α j z j . (5)
The quantity z j is the maximum contribution that the para-
site antigen targeted by a lymphocyte j could make to the rate of
production of new parasites. We assume that this maximum con-
tribution can only be realized when α j = 1 because the immune
EVOLUTION 2013 5

A. HURFORD AND T. DAY
system targets proteins that contribute to parasite replication as
discussed earlier. For simplicity we assume that a particular pro-
tein is either functional or nonfunctional, and therefore, we let
z j be equal to either 0 or 1 for all j . Under the mimicry trade-
off hypothesis, the number of secondary infections generated by
hosts that have autoimmunity is no different than for hosts that
have an acute infection, and so RI = RA; however, we still as-
sume that RU > RI owing to the lack of immune response when
an uncontrolled infection occurs. Notice that these assumptions
do not imply that greater reactivity leads to greater within-host
density per se, but rather that reactivity to certain specific lym-
phocytes (i.e., those for which z j is not equal to 0) leads to greater
average within-host density because certain specific antigens are
necessary for significant parasite replication.
RELATING THE PARASITE PHENOTYPE TO THE TYPES
OF INFECTIONS
Upon infection we assume that a parasite is tested against a subset
of r lymphocytes, where r j is the number of type j lymphocytes in
this subset, and r = ∑kj=1 r j . Before an infection, many different
unactivated lymphocytes circulate in the lymphatic system and the
blood, and these lymphocytes have a particular specificity which
is indexed by j . The probability that a type j lymphocyte reacts
with the infecting parasite and is activated is α j .
Unactivated circulating lymphocytes may also be activated
by proteins derived from self. The probability that a type j
lymphocyte is activated by a self protein is � j . Although the
self-reactivity of a type j lymphocyte may be any value between
zero and one, for simplicity we assume that the lymphocytes of
all different specificities are evenly spaced such that,
� j = j − 1
k − 1for j from 1 to k where k is large. (6)
Lymphocytes that are highly self-reactive are less common, and
so ω j , the expected fraction of lymphocytes that are of the type j ,
is a decreasing function of � j with∑k
j=1 ω j = 1. The composi-
tion of the subset of lymphocytes that the parasite is tested against
is given by the multinomial distribution with the parameters ω j
and r . We assume that the probability of an uncontrolled infec-
tion, 1 − q , is the probability that none of the r lymphocytes that
the parasite is tested against are activated by the parasite. From
the multinomial theorem, this is calculated as,
1 − q =∑
r1,r2,...,rk
r !
r1! · · · rk!ω
r11 · · · ωrk
k (1 − α1)r1 · · · (1 − αk)rk ,
=⎛⎝ k∑
j=1
ω j (1 − α j )
⎞⎠
r
= (1 − α)r , (7)
where
α =k∑
j=1
α jω j , (8)
is the probability that a randomly selected lymphocyte reacts with
the parasite.
A similar argument is used to derive an expression for the
probability that an autoimmune disease occurs, pq , which is as-
sumed to be the probability that at least one lymphocyte cross-
reacts. In particular,
pq = 1 −⎛⎝ k∑
j=1
ω j (1 − α j� j )
⎞⎠
r
= 1 − (1 − α�)r , (9)
where
α� =k∑
j=1
α j� jω j , (10)
is the probability that a randomly selected lymphocyte cross-
reacts.
The term “antigenic” refers to the potential to cause an im-
mune response, whereas “immunogenic” is when this potential is
actually realized (Sulitzeanu and Weiss 1981; Kindt et al. 2007,
p. 77). For our model formulation, the antigenicity of a particular
parasite is,
α = 1
k
k∑j=1
α j , (11)
and under the costly autoimmunity hypothesis, parasite pheno-
types are constrained to have a minimum level of antigenicity (see
section “Formalizing the costly autoimmunity and the mimicry
trade-off hypotheses”). This is in contrast with the immunogenic-
ity of a parasite which is α (eq. 8). The difference between the
values of antigenicity and immunogenicity reflect the benefit of
mimicry under the costly autoimmunity hypothesis; namely, that
parasites that are mimics are less immunogenic for a fixed level of
antigenicity, owing to the lower prevalence of highly self-reactive
lymphocytes.
DEFINING MIMICRY
So far, we have related the parasite phenotype to characteris-
tics of the immune response (p and q) and the number of new
infections (the Ri s), which then corresponds to parasite fitness
(R0), but we also need to determine whether a particular para-
site phenotype should be classified as a mimic. When random
mutations produce a parasite with different proteins, the result
is that a different type of lymphocyte j will be activated, and
this lymphocyte type will correspond to a different probability of
self-reaction, 0 ≤ � j ≤ 1. We develop a definition of mimicry
that captures the functional significance of structural similarities
6 EVOLUTION 2013

IMMUNE EVASION AND THE EVOLUTION OF MIMICRY
between host and parasite proteins. A parasite is classified as a
mimic if lymphocytes respond in the same way to the parasite
and to self. Our definition of mimicry accounts for the similarity
between the parasite and self that might occur by chance, de-
pending on the range of parasite phenotypes that are possible. To
this end, suppose we take a sample of lymphocytes and deter-
mine the values of α j and � j for each. We define mimicry as the
correlation,
ρ = corr(α j ,� j ), (12)
where this correlation is taken over the frequency of the different
lymphocyte types, j . Thus, if there is little difference between
how lymphocytes react to the parasite and to self this correlation
will be high. However, if the correlation is 0, then there is no
relationship between the parasite and self on average, and thus
no mimicry. Also note that, with this definition, anti-mimicry can
occur if the correlation is negative. In this case, the parasite would
react most strongly with lymphocytes that are very unreactive
to self, and in this way, parasites that are anti-mimics would be
more noticeable to the immune system than phenotypes that occur
purely by chance. The correspondence between this definition of
mimicry and one based on the structural similarity of parasite and
host proteins is shown in Figure 2.
This definition can be used to test for mimicry by specifying
a null hypothesis (e.g., that the parasite is not a mimic, ρ ≤ 0) and
performing an appropriate statistical test (e.g., Sokal and Rohlf
1994, p. 576; noting that this significance test assumes that α j and
� j are distributed according to a bivariate normal distribution).
ResultsHaving defined the relationships between the parasite pheno-
type, mimicry, and fitness, we now determine the conditions for
mimicry to be evolutionarily stable. The parasite ESS is denoted
as �α∗ which is a vector with the elements α∗j . In Appendix A
of Supporting Information, we show that the parasite ESS max-
imizes eq. (2). In this section “Results”, first we describe the
general characteristics of the parasite ESS by solving a con-
strained (the costly autoimmunity hypothesis), and an uncon-
strained (the mimicry trade-off hypothesis) optimization prob-
lem. Next, we describe the conditions that select for mimicry.
Finally, we describe how two different medical interventions af-
fect parasite evolution and the probabilities of the different host
infections.
GENERAL PROPERTIES OF THE PARASITE ESS
For the costly autoimmunity hypothesis, the minimum value of R0
occurs when χ(�α) < c (eqs. (3–4)). Therefore, the parasite pheno-
type that maximizes fitness must satisfy χ(�α) ≥ c. The selection
A B
C D
4
3
21
1
2
4
3
1
2
43
parasiteparasiteself4
3
21
prob reacting with self, Δ
, pr
ob r
eact
ing
with
par
asite
α
prob reacting with self, Δ
e,
prob
rea
ctin
g w
ith p
aras
itα
parasite
self
Normal parasite Molecular mimic
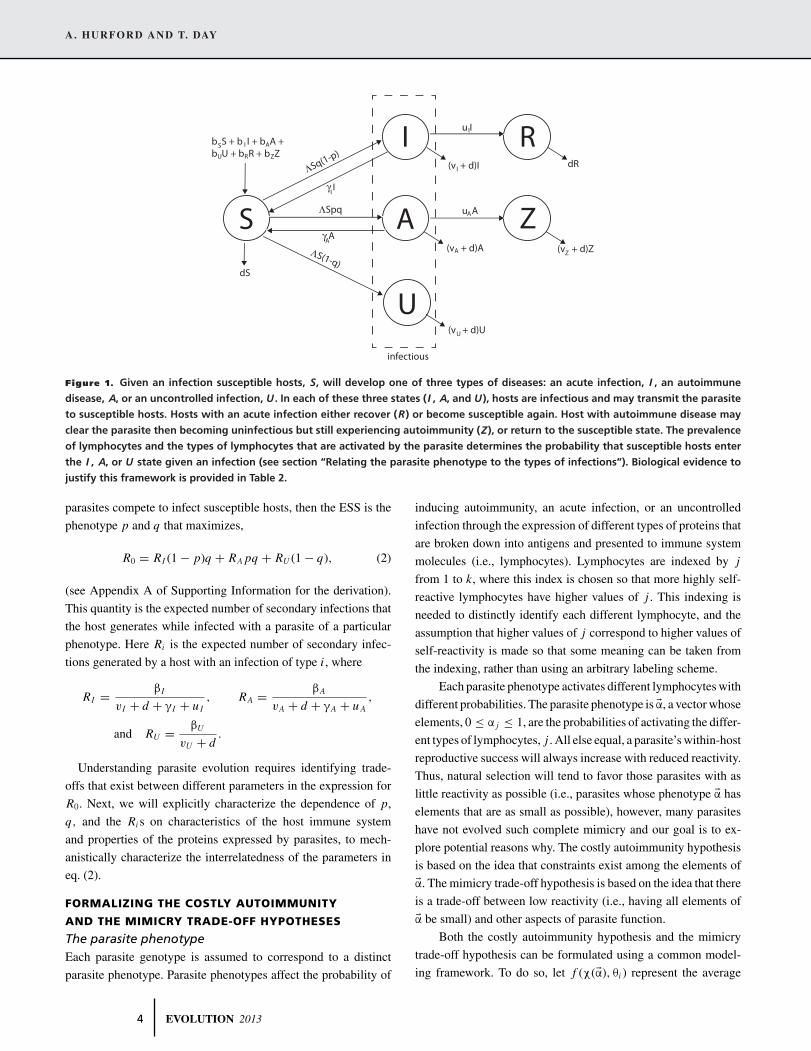
Figure 2. A normal parasite (A) and a molecular mimic (B) drawn
in structural space as conceptualized in Perelson and Oster (1979).
Nearness in structural space indicates that the parasite and self
antigens have the same shape and that the parasite is a mimic
(B). The parasite’s structure is represented as the center of the
gray circle, while the structure of the self antigen is the cen-
ter of the white circle. Different lymphocytes (numbered 1–4)
have specificities that match most closely with particular points in
structural space. The probability that a particular lymphocyte re-
acts with an antigen depends on the distance in structural space.
For the parasite that is a mimic (B), α j ≈ � j for all j (D), and
so the lymphocytes cannot discriminate between self and para-
site antigens, and as such, we define mimicry as a correlation
(see eq. (12)).
gradient is a vector whose elements are the partial derivatives of
R0 with respect to each α j . Assuming that χ(�α) ≥ c,
∂ R0
∂α j= −r (RU − RI )(1 − α)r−1ω j − r (RI − RA)
×(1 − α�)r−1� jω j ,
(13)
where this partial derivative describes the direction and magnitude
of natural selection to express proteins that activate the different
lymphocytes, j . This derivative is negative for all j , because an
increase in the probability that any lymphocyte reacts to the para-
site decreases the chance of an uncontrolled infection and thereby
decreases fitness (see eq. 2; recall that RU > RI > RA for the
costly autoimmunity hypothesis). Because the selection gradi-
ent is negative, R0 (eq. 2) is maximized for the smallest value
of χ(�α) = 1k
∑kj=1 α j such that χ(�α) ≥ c. Therefore, the parasite
ESS for the costly autoimmunity hypothesis is a constrained op-
timization problem: to maximize R0 (eq. 2) under the constraint
that χ(�α) = c.
EVOLUTION 2013 7

A. HURFORD AND T. DAY
The shape of the selection gradient (eq. 13) is either mono-
tonically increasing, monotonically decreasing, or increasing to
a single maximum and then decreasing (see Appendix B of Sup-
porting Information, Lemma 1). The parasite ESS is to activate
the lymphocytes that correspond to the least negative values of the
selection gradient, and these occur near j = 1 and/or j = k. Fur-
thermore, for the costly autoimmunity hypothesis, a parasite phe-
notype that is evolutionarily stable displays an all-or-nothing phe-
notype; for each j , the parasite will have either α j = 0 or α j = 1
(except under exceptional circumstances). This result arises from
a direct application of the Karash–Kuhn Tucker theorem as shown
in Appendix B of Supporting Information (Lemma 2). Therefore,
under the costly autoimmunity hypothesis, the parasite ESS has
the general form,
α∗j =
⎧⎪⎨⎪⎩
1 for � j < x∗,0 for x∗ < � j < 1 − c + x∗,1 for 1 − c + x∗ < � j ,
(14)
provided that � + ω(�)/ω′(�) is monotonically increasing
where ω(� j ) = ω j (see Appendix B of Supporting Information;
Theorem 1 for details). The implication of eq. (14) is that, for
the costly autoimmunity hypothesis, the parasite ESS will either
activate strongly or weakly self-reactive lymphocytes, or both.
The quantities x∗ and 1 − c + x∗ correspond to the minimum and
maximum self-reactivities of lymphocytes that are not activated
by the parasite. A procedure for identifying these values numeri-
cally is described in Appendix C of Supporting Information and
the computer code for all numerical results is publicly available
at Dryad Digital Repository, doi:10.5061/dryad.3vf7p. Parasite
ESSs as described by eq. (14) are shown in Figure 3A and B,
and the corresponding selection gradients are shown in Figure 3C
and D.
For the mimicry trade-off hypothesis, there is no antigenicity
constraint, and so the sign of the derivative of R0 with respect to
α j for each α j , determines whether selection favors the expression
of proteins that activate the lymphocyte, j . The selection gradient
for the mimicry trade-off hypothesis is,
∂ R0
∂α j= −r (RU − RI )(1 − α)r−1ω j
+ ((1 − q)RU + qRI )z jβ′( f ),
(15)
where Ri = Ri/β[ f (χ(�α), θi )], β′( f ) = ∂β[ f (χ(�α),θi )]∂ f (χ(�α),θi )
and∂ f (χ(�α),θi )
∂α j= z j . The first term in eq. (15) is negative since
expressing proteins decreases the probability of an uncontrolled
infection and decreases fitness (recall that an assumption of the
mimicry trade-off hypothesis was that RU > RI , see section
“The mimicry trade-off hypothesis”). The second term in eq. (15)
is positive when z j = 1, and 0 otherwise, because expressing
proteins that contribute to parasite replication and transmission
increases fitness. Highly self-reactive lymphocytes are less
prevalent, such that ω j is a decreasing sequence in j , and the
first term of eq. (15) is negative. Therefore, there may exist a
threshold value of j for which the selection gradient (eq. 15)
changes sign from negative to positive, z∗. For any j , such
that the selection gradient is positive, expressing a protein that
activates the lymphocyte j increases parasite fitness, and so the
parasite ESS is α∗j = 1, for all j where eq. (15) is positive. For
any j , such that the selection gradient is negative, expressing a
protein that activates the lymphocyte j decreases parasite fitness,
and so the parasite ESS is α∗j = 0, for all j where eq. (15) is
negative. As such, the general form of the parasite ESS under the
mimicry trade-off hypothesis is,
α∗j =
{0 for � j < z∗,
1 for z∗ ≤ � j and z j = 1.(16)
where z∗ ≥ 0. If z∗ > 1 there is no value of j corresponding to
a positive value of the selection gradient. The interpretation of
eq. (16) is that only proteins that contribute to parasite function
are expressed, and in some cases only a subset of these are ex-
pressed. Examples of the parasite ESS for the mimicry trade-off
hypothesis are shown in Figure 3E and F along with the corre-
sponding selection gradients (Fig. 3G,H).
SELECTION FOR MIMICRY
Given the general forms of the parasite ESS, under both the costly
autoimmunity hypothesis and the mimicry trade-off hypothesis
mimicry may be selected for, or selected against, depending on the
magnitude of the parameters in R0 (Fig. 4). Let, φ be the relative
cost of autoimmunity, ψ be the relative cost of an acute infection,
and τ be the relative rarity of highly self-reactive lymphocytes,
where
φ = 1 − RU − RI
RU − RA, ψ = RU − RI
RU,
and τ = 1 − 1 − (1 − ωkc)r
1 − (1 − ω1c)r.
(17)
Note that each of these quantities lie between 0 and 1. In gen-
eral, as shown in Figure 4, mimicry is selected against when τ
is small (i.e., when highly self-reactive lymphocytes are com-
mon). Then, the effect of clonal deletion is mild such that weakly
and highly self-reactive lymphocytes have relatively equal fre-
quencies, and so the probability that a mimic fails to elicit an
immune response is only marginally greater than the same prob-
ability for any other parasite phenotype (Fig. 4D,H). Under the
costly autoimmunity hypothesis, a high cost of autoimmunity
(i.e., that hosts with autoimmunity generate substantially fewer
secondary infections relative to hosts with other infection types)
8 EVOLUTION 2013

IMMUNE EVASION AND THE EVOLUTION OF MIMICRY
0 0.2 0.4 0.6 0.8 10
0.2
0.4
0.6
0.8
1
0 0.2 0.4 0.6 0.8 10
0.2
0.4
0.6
0.8
1
0 0.2 0.4 0.6 0.8 1−40
−30
−20
−10
0
10
0 0.2 0.4 0.6 0.8 10
0.2
0.4
0.6
0.8
1
0 0.2 0.4 0.6 0.8 10
0.2
0.4
0.6
0.8
1
0 0.2 0.4 0.6 0.8 10
0.2
0.4
0.6
0.8
1
0 0.2 0.4 0.6 0.8 1−60
−40
−20
0
0 0.2 0.4 0.6 0.8 1−600
−400
−200
0
Costly autoimmunity hypothesis
Mimicry trade-off hypothesis
Selection against mimicry Selection for mimicry
Selection against mimicry Selection for mimicry
Par
asite
ES
S, α
∗P
aras
ite E
SS
, α∗
,S
SE etisara
Pα∗
,S
SE etisara
Pα∗j j
j j
Self-reactivity, Δ
Self-reactivity, Δ Self-reactivity, Δ
Self-reactivity, Δ
Self-reactivity, Δ Self-reactivity, Δ
Self-reactivity, Δ Self-reactivity, Δ
j
j j
j
j j
j j
tneidarg noitceleS
tneidarg noitceleS
tneidarg noitceleS
tneidarg noitceleS
C D
E F
G H
A B
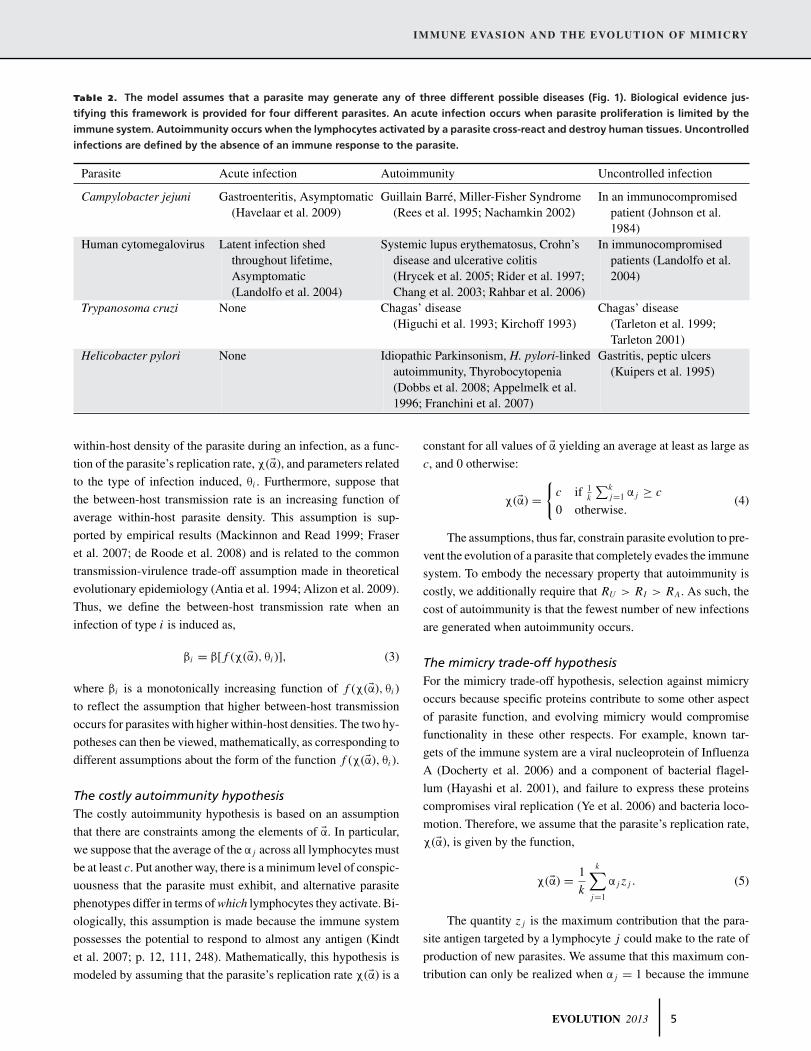
Figure 3. Examples of parasite ESSs corresponding to selection against mimicry (A and E ) and selection for mimicry (B and F ) for
the costly autoimmunity hypothesis and the mimicry trade-off hypothesis and the corresponding selection gradients (C , D, G, and H ).
The conditions for selection against mimicry are described in section “Selection for mimicry”. The general form of the parasite ESSs are
described by eq. (14) (the costly autoimmunity hypothesis) and eq. (16) (the mimicry trade-off hypothesis) and the formulae for the
selection gradients are given by eqs. (13) and (15). In E –H , the zj are Bernoulli random variables with probability 0.5. The two lines that
appear in H correspond to zj = 0 and zj = 1. In G, the selection gradient when � j ≈ 1 and zj = 1 is positive and the selection gradient
is close to 0, but slightly negative when � j ≈ 1 and zj = 0. All parameters and functions are described in the Appendix C of Supporting
Information. The same parameters and functions are used for Figs. 3–5.
EVOLUTION 2013 9
A. HURFORD AND T. DAY
0 0.2 0.4 0.6 0.8 10
0.2
0.4
0.6
0.8
1
0 0.2 0.4 0.6 0.8 1−0.5
0
0.5
1
0 0.2 0.4 0.6 0.8 10
0.2
0.4
0.6
0.8
1
0 0.2 0.4 0.6 0.8 1−0.5
0
0.5
1
0 0.2 0.4 0.6 0.8 10
0.2
0.4
0.6
0.8
1
0 0.2 0.4 0.6 0.8 1−0.5
0
0.5
1
0 0.2 0.4 0.6 0.8 10
0.2
0.4
0.6
0.8
1
0 0.2 0.4 0.6 0.8 1−0.5
0
0.5
1
Mim
icry
, ρ
Costly autoimmunity hypothesis
Mimicry trade-off hypothesis
Rarity of highly self-reactive lymphocytes,τ
Par
asite
ES
S, α
∗ j
,S
SE
etisaraP
α∗j
Par
asite
ES
S, α
∗ j
,S
SE
etisaraP
α∗j
Mim
icry
, ρ
Selection against mimicry Selection for mimicry
Selection against mimicry Selection for mimicry
Mim
icry
, ρ
Rarity of highly self-reactive lymphocytes, τ
Relative cost of an acute infection, ψ
Relative cost of autoimmunity, φ
Relative cost of autoimmunity, φ
Rarity of highly self-reactive lymphocytes,τRelative cost of an acute infection, ψ
Mim
icry
, ρ
A B
C D
E F
G H
Rarity of highly self-reactive lymphocytes, τ
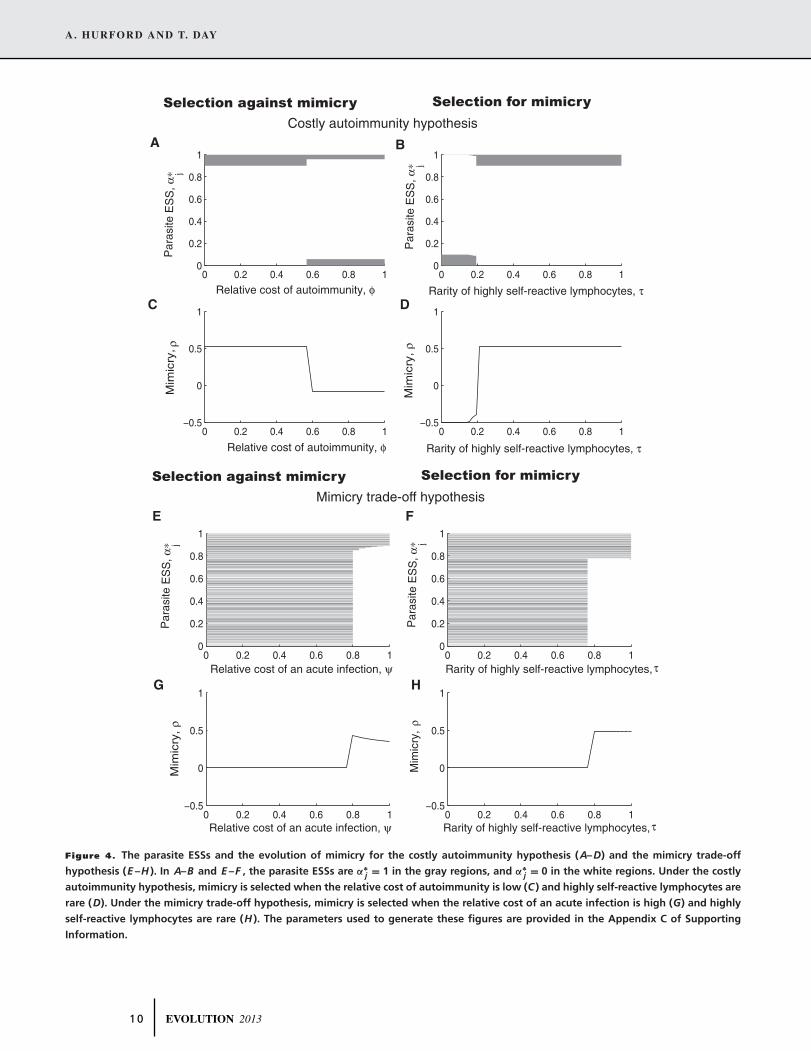
Figure 4. The parasite ESSs and the evolution of mimicry for the costly autoimmunity hypothesis (A–D) and the mimicry trade-off
hypothesis (E –H ). In A–B and E –F , the parasite ESSs are α∗j = 1 in the gray regions, and α∗
j = 0 in the white regions. Under the costly
autoimmunity hypothesis, mimicry is selected when the relative cost of autoimmunity is low (C ) and highly self-reactive lymphocytes are
rare (D). Under the mimicry trade-off hypothesis, mimicry is selected when the relative cost of an acute infection is high (G) and highly
self-reactive lymphocytes are rare (H ). The parameters used to generate these figures are provided in the Appendix C of Supporting
Information.
1 0 EVOLUTION 2013

IMMUNE EVASION AND THE EVOLUTION OF MIMICRY
selects against mimicry because mimics are more likely to induce
autoimmunity (Fig. 4). Under the mimicry trade-off hypothesis,
when ψ is small there is little difference between the number
of secondary infections generated by hosts with uncontrolled in-
fections, or acute infections, and so the incentive to express all
proteins, irrespective of whether they activate highly or weakly
self-reactive lymphocytes, is nearly the same (Fig. 4G).
A simple condition for the evolution of mimicry under the
costly autoimmunity hypothesis can be derived by assuming that
c is small, that is, that the expression of only a few surface proteins
is necessary for transmission to occur (eq. (4)). When RI − RA
is large, autoimmunity is extremely costly in terms of the reduc-
tion in the number of secondary infections (large φ) and the least
negative values of the selection gradient occur near j = 1 (these
lymphocytes are weakly self-reactive), and possibly near j = k
(depending on how rare these highly self-reactive lymphocytes
are, and how likely it is that an uncontrolled infection will occur).
When autoimmunity is less costly, there is no longer a signifi-
cant drawback to evolving mimicry, and so the maximum in the
selection gradient occurs at j = k, because autoimmunity or an
uncontrolled infection is likely to result.
Formally, the condition for mimicry to be selected against
when c is small is determined by comparing the values of R0
(eq. (2)), when the parasite phenotype corresponds to mimicry
(x∗ = 0), and when the parasite phenotype corresponds to anti-
mimicry (x∗ = c). These are approximated as,
RU + (RA − RU )(1 − (1 − ωkc)r ) (mimicry), (18)
RU + (RI − RU )(1 − (1 − ω1c)r ) (anti-mimicry). (19)
Here, ωkc and ω1c approximate∑
j α jω j for small c, for mimicry
and anti-mimicry, respectively. The condition that mimicry is se-
lected against is that eq. (18) is less than eq. (19), and this re-
duces to the inequality τ < φ, which has an interpretation that is
consistent with the above general discussion of selection against
mimicry for the costly autoimmunity hypothesis.
From eq. (15), we can discern that mimicry would be se-
lected if functional protein expression happened to coincide with
activating highly self-reactive lymphocytes (i.e., if z j and � j are
positively correlated). If this were the case, then mimicry would
evolve because parasites that are mimics are the most functional,
rather than necessarily because expressing proteins that corre-
spond to highly self-reactive lymphocytes increases the chance
of an uncontrolled infection. There is no evidence to suggest
a relationship between the contribution of proteins to parasite
replication and the self-reactivity of the lymphocytes that these
proteins activate, and so we assume no such relationship. There-
fore, from eq. (15) for mimicry to be selected, RU must be much
bigger than RI (i.e., large ψ), and there must be some func-
tional proteins (z j = 1) for which the benefit of expressing these
proteins exceeds the cost of detection by the immune system
(i.e., there must be some j for which the selection gradient is
positive).
THE EFFECT OF MEDICAL INTERVENTIONS ON THE
EVOLUTIONARILY STABLE PARASITE PHENOTYPE
AND THE TYPES OF INFECTIONS THAT ARE INDUCED
IN THE HOST
From a human disease perspective, the two most serious types
of infections are an uncontrolled infection (since then there is no
effective immune response) and autoimmunity (since then the im-
mune system causes damage to the host itself). Here, we consider
two possible types of medical interventions and we determine
whether these interventions would select for the types of para-
sites that cause the most serious types of human infections. Our
analysis focuses on the probability of an uncontrolled infection,
1 − q , and the probability of autoimmunity, pq , given a parasitic
infection. We note that these quantities are different than the num-
ber of people who experience each type of disease, as this would
depend both on the transmission rate and the duration of the dif-
ferent disease types. In particular, a decreased probability of an
uncontrolled infection, or autoimmunity, given an infection does
not imply that fewer individuals will experience these diseases.
Referring to Table 1 in Hausmann and Wucherpfennig
(1997), Influenza A, Herpes Simplex Virus, and Mycobacterium
bovis (the infectious agent of bovine tuberculosis; also causing
tuberculosis in humans) are parasites that activate lymphocytes
that cross-react with host cells, and may lead to infection-induced
autoimmunity. The spread of the acute infections due to these par-
asites may be reduced by school closures (Influenza A), antiviral
drugs (Herpes Simplex Virus), and antibiotics (tuberculosis). The
first medical intervention that we consider is one that reduces the
spread of parasites that induce acute infections only. Such inter-
ventions would decrease φ, the relative cost of autoimmunity, and
increase ψ, the relative cost of an acute infection to the parasite.
Among the proposed treatments for autoimmune diseases are
gene therapies (Alderuccio et al. 2009) and the targeted elimina-
tion of self-reactive lymphocytes (Lopez-Diego and Weiner 2008;
Berger and Houff 2009). The suggested method of action for gene
therapy is that the increased expression of defined self antigens
leads to an increase in the presentation of these self antigens in
the thymus, and to an increased chance that the lymphocytes spe-
cific for these self antigens are destroyed during clonal deletion
(Alderuccio et al. 2009). Antigen-specific therapies, such as oral
myelin basic protein (MBP) or intraveneous MBP8298, result in
the presentation of these self antigens (which resemble human
MBP) to lymphocytes in the absence of costimulatory molecules.
This results in partial activation of the corresponding self-reactive
lymphocytes which then undergo apoptosis owing to the lack of
full activation (Lopez-Diego and Weiner 2008). The effect of these
EVOLUTION 2013 1 1

A. HURFORD AND T. DAY
0 0.2 0.4 0.6 0.8 1−0.5
0
0.5
1
Rarity of highly self−reactive lymphoctyes, τ
0 0.2 0.4 0.6 0.8 1−0.5
0
0.5
1
Relative rarity of highly self−reactive lymphoctyes, τ
0 0.2 0.4 0.6 0.8 1−0.5
0
0.5
1
Relative cost of autoimmunity, φ
0 0.2 0.4 0.6 0.8 1−0.5
0
0.5
1
Relative cost of an acute infection, ψ
AutoimmunityUncontrolled Mimicry
A B
C D
Costly autoimmunity hypothesis
Mimicry trade-off hypothesis
Effect of intervention
Figure 5. The probability of an uncontrolled infection and infection-induced autoimmunity under the costly autoimmunity hypothesis
and the mimicry trade-off hypothesis for two different medical interventions: one which decreases φ or increases ψ; and one which
increases τ (the direction of the arrows indicate the direction of the effect of the medical intervention). In all cases, when mimicry
evolves (gray line) there is an increased risk of an uncontrolled infection (dashed line). For the mimicry trade-off hypothesis (C ,D), when
mimicry evolves the risk of infection-induced autoimmunity decreases (solid line), while under the costly autoimmunity hypothesis, this
risk may increase (A,B). For B , the risk of infection-induced autoimmunity increases for intermediate τ, but then decreases for large τ.
The parameters used are the same as for Fig. 4.
therapies on the immune system is that some highly self-reactive
lymphocytes are destroyed. The second type of medical interven-
tion that we consider is therefore one that decreases the frequency
of highly self-reactive lymphocytes, thereby increasing τ.
The effect of both of these interventions is to select for molec-
ular mimicry (Fig. 5, recall that the effect of the interventions are
to decrease φ (A), to increase ψ (C), and to increase τ (B,D)).
In all cases, selection for mimicry results in an increase in the
probability that the infecting parasite induces an uncontrolled in-
fection. A difference between the costly autoimmunity hypothesis
and the mimicry trade-off hypothesis is that under the mimicry
trade-off hypothesis the parasite ESS continues to change after
a threshold value of ψ is exceeded, but for the costly autoim-
munity hypothesis, apart from the one major shift, there is little
change in the parasite ESS (Fig. 4A,B and E,F; note the correspon-
dence between Figs. 4 and 5). In particular, under the mimicry
trade-off hypothesis, the antigenicity of the ESS phenotype (pro-
portional to the total number of α∗j = 1, see eq. (11)) continues
to evolve; this is in contrast with the costly autoimmunity hy-
pothesis, which requires that antigenicity is fixed. This change in
antigenicity determines whether evolved mimicry also implies a
higher probability of infection-induced autoimmunity. Consider
a parasite strategy which is to activate all lymphocytes (α j = 1
for all j) versus one which is to activate only the most self-
reactive lymphocyte (only αk = 1): the latter strategy has high
mimicry, but the former has a greater chance of inducing autoim-
munity, solely because more antigens are expressed. In Figure 5A,
under the costly autoimmunity hypothesis, antigenicity is fixed,
and so when mimicry evolves uncontrolled infections and
infection-induced autoimmunity are both more likely (Fig. 5A). In
Figure 5C, under the mimicry trade-off hypothesis lower levels
of antigenicity, and higher levels of mimicry evolve concurrently
(Fig. 4E), and the net effect is that the probability of autoimmu-
nity given an infection decreases as a result of the intervention
(increasing ψ).
When τ changes, the probability of infection-induced au-
toimmunity in-and-of-itself changes, even if there is no parasite
evolution. This can be seen in Figure 5B. Under the costly autoim-
munity hypothesis, for 0.25 < τ < 1 the parasite ESS changes
very little (Fig. 4B), however, the probability of autoimmunity
given an infection steadily decreases in this same range (Fig. 5B).
This is owing to the effect of the intervention; that highly
1 2 EVOLUTION 2013

IMMUNE EVASION AND THE EVOLUTION OF MIMICRY
self-reactive lymphocytes are destroyed to reduce the chance that
infections lead to autoimmunity. Under the costly autoimmunity
hypothesis, given the effect of both parasite evolution and
the effect of increasing τ itself, there is a range of τ values
(0.2 < τ < 0.5 in Fig. 5B) where the effect of the intervention
is insufficient to offset the increased chance of autoimmunity
arising from the evolution of mimicry.
Returning to the initial question of how these two medical
interventions will impact the chance of the two most serious types
of human pathologies, the answer depends on which factors are
affecting parasite evolution (i.e., the costly autoimmunity hypoth-
esis or the mimicry trade-off hypothesis), and also which inter-
ventions are initiated. In all cases, these interventions increase
the risk of an uncontrolled infection, and so they should only be
considered if the risk of autoimmunity is reduced (i.e., the second
most serious type of human infection). For the intervention that
reduces the number of new infections generated by hosts with
acute infections only; this intervention should be considered if
the mimicry trade-off hypothesis is the trade-off that affects the
evolution of mimicry. For the intervention that increases the rar-
ity of highly self-reactive lymphocytes, this intervention could be
considered under either hypothesis, but under the costly autoim-
munity hypothesis, only when highly self-reactive lymphocytes
are made extremely rare should this intervention be considered
(Fig. 5B). In noting that the rationale for implementing an inter-
vention that eliminates highly self-reactive lymphocytes was to
decrease the risk of autoimmunity given an infection, we deter-
mined that the evolution of mimicry can potentially undermine
this intended effect if not all types of highly self-reactive lympho-
cytes are eradicated, or if eradication is only partially successful
(i.e., if τ < 0.6).
DiscussionA general problem in evolutionary epidemiology is to understand
the evolution of parasite transmission. A more specific version of
this problem is to understand why immune evasion is not more
common. To understand how selection acts to prevent the evolu-
tion of mimicry, our analysis considers two hypotheses that may
explain why immune evasion via molecular mimicry is not ubiq-
uitous among parasite species. Under the costly autoimmunity
hypothesis, parasites that are molecular mimics are both more
likely to evade the immune response and to induce autoimmunity
in their hosts, and hosts with autoimmunity generate fewer new
infections relative to hosts with other types of infections (Damain
1964; Graham et al. 2005). Under the mimicry trade-off hypoth-
esis, trade-offs on the structure of proteins mean that proteins
may either mimic host cells, or contribute to parasite replication
resulting in more new infections, but not both. We showed that
the parasite ESS (Fig. 4) and two different medical interventions
have different impacts on human health (Fig. 5) depending on
which of these two trade-offs explain selection against mimicry
in a particular parasite.
A difference between the parasite ESSs for each of the
two hypotheses is that, under the costly autoimmunity hypoth-
esis, intermediately self-reactive lymphocytes are never activated
(eq. (14); Appendix B of Supporting Information, Lemma 1),
whereas under the mimicry trade-off hypothesis, intermediately
self-reactive lymphocytes can be activated (eq. (16)). The reason
that intermediately self-reactive lymphocytes are not activated un-
der the costly autoimmunity hypothesis is that these lymphocytes
are neither rare nor unreactive to self antigens, and therefore pose
the greatest risk of inducing autoimmunity in the host. The risk
of inducing autoimmunity for each lymphocyte is � jω j , and for
most reasonable choices of ω j , the risk of inducing autoimmunity
is highest for intermediate values of j . Some empirical evidence
supports the conclusion that intermediately self-reactive lympho-
cytes do indeed pose the greatest risk of inducing autoimmunity.
Qa-1-restricted CD8+ T cells protect mice against autoimmunity
and this protection occurs because these Qa-1-restricted CD8+
T cells destroy intermediately self-reactive lymphocytes (Chen
et al. 2007). Therefore, although both the costly autoimmunity
hypothesis and the mimicry trade-off hypothesis are plausible,
unique hallmarks of protein expression can be used to distinguish
between each of these to understand which selective force is af-
fecting parasite evolution.
The differences in the parasite ESSs given the different selec-
tive forces also results in differences in how parasites will evolve
in response to changes due to medical interventions. Given our
focus on the evolution of molecular mimicry, we reported these
results in terms of the changes in the types of infections that
are induced given an infection; however, the number of individ-
uals that are infected may also change as a result of parasite
evolution, although we have not considered this in the current
analysis. In addition to gene therapies and the targeted elimina-
tion of self-reactive lymphocytes (discussed in section “The ef-
fect of medical interventions on the evolutionarily stable parasite
phenotype and the types of infections that are induced in the
host”), other proposed treatments for autoimmune disease include
immunosuppressive therapies, such as B-cell depletion agents that
destroy both self-reactive and non-self-reactive lymphocytes. In
that B-cell depletion agents affect lymphocytes of all specificities
there is no reason that mimics or any other parasite phenotype
would have a particular selective advantage. Therefore, B-cell de-
pletion agents are not expected to affect the evolution of mimicry
in parasites.
In addition to these contributions, our model derivation pro-
vides mathematical definitions for the terms mimicry, immuno-
genicity and antigenicity. The definition of mimicry that we
EVOLUTION 2013 1 3

A. HURFORD AND T. DAY
derive (eq. (12)) avoids anthropocentric biases and instead de-
fines mimicry from the point of view of the lymphocyte. Quan-
tification of mimicry from our definition requires estimating the
probabilities of lymphocyte activation by self and parasite anti-
gens. Past work has shown that approximately 5% of 800 mono-
clonal antibodies that reacted with one of 15 viruses cross-reacted
with normal tissues (Shrinivasappa et al. 1986; Bahmanyar et al.
1987). The different measures of sequence homology, the rela-
tionship between primary and quaternary protein structure, and
the complexity of antigen processing and presentation, make it
difficult for general links to be established between amino acid
sequence homology and the probability of lymphocyte activation.
We suggest bypassing these complications by defining mimicry
using the lymphocyte reaction probability. Therefore, we have
developed a definition of mimicry that is simple and meaning-
ful, because our definition reflects the functional significance of
mimicry.
Several aspects of our model formulation warrant further
discussion. In suggesting that molecular mimicry may facili-
tate immune evasion, we have assumed that when parasites ex-
press only proteins that correspond to very highly self-reactive
lymphocytes, an uncontrolled infection is very likely. This fol-
lows from the theory of clonal deletion: that highly self-reactive
lymphocytes undergo apoptosis to prevent autoimmunity. Given
this effect of clonal selection, the only lymphocytes with the speci-
ficity to the parasite are also highly self-reactive and may not exist,
resulting in an uncontrolled infection. Previous work states that
parasites that are mimics are more likely to evade the immune
system, however, in most cases this statement is made without
any supporting evidence (Damain 1964; Young et al. 2002; Elde
and Malik 2009). In fact, we are aware of only one study that
has directly shown that immune evasion can arise from mimicry
(Wolfl and Rutebemberwa 2008).
Our model refers to infection-induced autoimmunity only,
and we note that autoimmunity is caused by many genetic and
environmental factors, and only a subset of observed autoimmune
disease is caused by cross-reacting lymphocytes activated by par-
asites that are molecular mimics. The immunological details of
why some individuals develop autoimmunity and others do not are
not well known (Arnold 2002). If parasites activate cross-reactive
lymphocytes that are suppressed, or do not lead to a clinical form
of disease, it may be difficult to accurately estimate the prevalence
of molecular mimicry in parasites.
Parasite evolution has practical consequences in terms of evo-
lutionary medicine, and the nature of these implications depend on
the constraints and life history trade-offs that act on the parasite.
In that the immune system aims to destroy parasites, character-
istics of the immune system strongly impact parasite evolution.
Evolutionary biologists (Nesse and Williams 1995; Graham et al.
2005) have suggested that autoimmunity is an unavoidable cost
of an immune system that is able to respond to a wide range of
parasites, and as such, autoimmunity is a relevant consideration
for understanding how the immune system shapes parasite evolu-
tion. Now that several broadly immunosuppressive therapies are
promising treatments for autoimmune diseases (Lopez-Diego and
Weiner 2008), a timely consideration is to understand how these
therapies would impact parasite evolution, and ultimately, what
the consequences would be for human health.
ACKNOWLEDGMENTSThe authors thank two anonymous reviewers for their attention to detailand for suggestions that helped improve this manuscript. AH was sup-ported by Queen’s University. TD acknowledges financial support froman NSERC Discovery Grant and the Canada Research Chairs Program.
LITERATURE CITEDAlderuccio, F., J. Chan, D. W. Scott, and B.-H. Toh. 2009. Gene therapy
and bone marrow stem-cell transfer to treat autoimmune disease. TrendsMol. Med. 15:344–351.
Alizon, S., and M. van Baalen. 2005. Emergence of a convex trade-off betweentransmission and virulence. Am. Nat. 165:E155–E167.
Alizon, S., A. Hurford, N. Mideo, and M. van Baalen. 2009. Virulence evo-lution and the trade-off hypothesis: history, current state of affairs andfuture. J. Evol. Biol. 22:245–259.
Ang, C. W., B. C. Jacobs, and J. D. Laman. 2004. The Guillain-Barre syn-drome: a true case of molecular mimicry. Trends Immunol. 25:61–66.
Antia, R., B. R. Levin, and R. M. May. 1994. Within-host population dynamicsand the evolution of maintenance of microparasite virulence. Am. Nat.144:457–472.
Appelmelk, B. J., I. Simoons-Smit, R. Negrini, A. P. Moran, and G. O. As-pinall. 1996. Potential role of molecular mimicry between Helicobacterpylori Lipopoysaccharide and host Lewis blood group antigens in au-toimmunity. Infect. Immunol. 64:2031–2040.
Arnold, B. 2002. Levels of peripheral T cell tolerance. Transpl. Immunol.10:109–114.
Bahmanyar, S., J. Srinivasappa, P. Casali, R. S. Fujinami, M. B. A. Oldstone,and A. L. Notkins. 1987. Antigen mimicry between measles virus andhuman T lymphocytes. J. Infect. Dis. 156:526–527.
Begon, M., J. L. Harper, and C. R. Townsend. 1990. Ecology: individuals,populations, and communities. 2nd ed. Blackwell Science Ltd., U.K.
Berger, J. R., and S. Houff. 2009. Opportunistic infections and other riskswith newer multiple sclerosis therapies. Ann. Neurol. 65:367–377.
Chang, M. G., Y. M. Shiu, Y. W. Chu, and J. L. Lan. 2003. The antibody tohuman cytomegalovirus (HCMV) pp65 lower matrix protein is highlyelevated for Systemic Lupus Erythematosus (SLE) patients. FASEB J.17:C185–C186.
Chen, W., B. Liang, Y. Saenger, J. Li, L. Chess, and H. Jiang. 2007. Perceivingthe avidity of T cell activation can be translated into peripheral T cellregulation. PNAS 104:20472–20477.
Damian, R. T. 1964. Molecular mimicry: antigen sharing by parasite and hostand its consequences. Am. Nat. 98:129–149.
de Roode, J. C., A. J. Yates, and S. Altizer. 2008. Virulence-transmissiontrade-offs and population divergence in virulence in a naturally occurringbutterfly parasite. Proc. Natl. Acad. Sci. USA 105:7489–7494.
Dobbs, J. R., S. M. Dobbs, C. Weller, A. Charlett, and I. T. Bjanason. 2008. He-
licobacter hypothesis for Idiopathic Parkinsonism: before and beyond.Helicobacter 13:309–322.
1 4 EVOLUTION 2013

IMMUNE EVASION AND THE EVOLUTION OF MIMICRY
Docherty, P. C., S. J. Turner, R. G. Webby, and P. G. Thomas. 2006. Influenzaand the challenge for immunology. Nat. Immunol. 7:449–455.
Elde, N. C., and H. S. Malik. 2009. The evolutionary conundrum of parasitemimicry. Nat. Rev. Micro. 7:787–797.
Franchini, M., M. Cruciani, C. Mengoli, G. Pizzolo, and D. Veneri. 2007. Ef-fect of Helicobacter pylori eradication on platelet count in idiopathicthrombocytopenic purpura: a systematic review and meta-analysis.J. Antimicrob. Chemother. 60:237–246.
Fraser, C., T. D. Hollingsworth, R. Chapman, F. de Wolf, and W. P. Hanage.2007. Variation in HIV-1 set-point viral load: epidemiological analysisand an evolutionary hypothesis. Proc. Natl. Acad. Sci. USA 104:17441–17446.
Goodnow, C. C., J. Sprent, B. Fazekas de St Groth, and C. G. Vinuesa. 2005.Cellular and genetic mechanisms of self tolerance and autoimmunity.Nature 435:590–597.
Graham, A. L., J. E. Allen, and A. F. Read. 2005. Evolutionary causes and con-sequences of immunopathology. Annu. Rev. Ecol. Evol. Syst. 36:373–397.
Hausmann, S., and K. W. Wucherpfennig. 1997. Activation of autoreactive Tcells by peptides from human parasites. Curr. Opin. Immunol. 9:831–838.
Havelaar, A. H., W. van Pelt, C. W. Ang, J. A. Wagenaar, J. P. M. vanPutten, U. Gross, and D. G. Newell. 2009. Immunity to Campylobacter:its role in risk assessment and epidemiology. Crit. Rev. Microbiol. 35:1–22.
Hayashi, F., K. D. Smith, A. Ozinsky, T. R. Hawn, E. C. Yi, D. R. Goodlett,J. K. Eng, S. Akira, D. M. Underhill, and A. Aderem. 2001. The innateimmune response to bacterial flagellin is mediated by Toll-like receptor5. Nature 410:1099–1103.
Higuchi, M. L., T. Brito, M. Reis, G. Bellotti, A. C. Pereira-Barreto, and F.Pileggi. 1993. Correlation between T. cruzi parasitism and myocardialinflammatory infiltrate in human uncontrolled—light-microscopy andimmunohistochemical findings. Cardiovasc. Pathol. 2:101–106.
Hogquist, K. A., T. A. Baldwin, and S. C. Jameson. 2005. Central tolerance:learning self control in the thymus. Nat. Immunol. Rev. 5:772–783.
Hrycek, A., D. Kusierz, U. Mazurek, and T. Wilczok. 2005. Human cy-tomegalovirus in patients with Systemic Lupus Erythematosus. Autoim-munity 38:487–491.
Johnson, R. J., C. Nolan, S. P. Wang, W. R. Shelton, and M. J. Blaser. 1984.Persistent Campylobacter jejuni infection in an immunocompromisedpatient. Ann. Int. Med. 100:832–834.
Kindt, J. T., R. A. Goldsby, and B. A. Osborne. 2007. Kuby immunology. 6thed. W.H. Freemann and Co., New York.
Kirchoff, L. V. 1993. American trypanosomiasis (Chagas’ disease)—a tropicaldisease now in the United States. N. Eng. J. Med. 329:639–644.
Kohm, A. P., K. G. Fuller, and S. D. Miller. 2003. Mimicking the way to au-toimmunity: and evolving theory of sequence and structural homology.Trends Microbiol. 11:101–105.
Kuipers, E. J., J. C. Thijs, and J. P. M. Festen. 1995. Helicobacter and pepticulcer disease. Aliment. Pharmacol. Ther. 9:59–69.
Landolfo, S., M. Gariglio, G. Gribaudo, and D. Lembo. 2004. The humancytomegalovirus. Pharmacol. Therapeut. 98:269–297.
Lopez-Diego, R. S., and H. L. Weiner. 2008. Novel therapeutic strategies formultiple sclerosis—a multifaceted adversary. Nat. Rev. Drug Discov.7:909–925.
Mackinnon, M. J., and A. F. Read. 1999. Genetic relationships betweenparasite virulence and transmission in the rodent malaria Plasmodium
chabaudi. Evolution 53:689–703.Maynard Smith, J. 1982. Evolution and the theory of games. Cambridge Univ.
Press, U.K.
Michelson, S. 2004. Consequences of human cytomegalovirus mimicry. Hum.Immunol. 65:465–475.
Nachamkin, I. 2002. Chronic effects of Campylobacter infection. MicrobesInfect. 4:399–403.
Nesse, R. M., and G. C. Williams. 1995. Why we get sick: the new science ofDarwinian medicine. Random House. New York.
Ohashi, P. S. 1996. T cell selection and autoimmunity: flexibility and tuning.Curr. Opin. Immunol. 8:808–814.
Oldstone, M.B.A. 1998. Molecular mimicry and immune-mediated diseases.FASEB J. 12:1255–1265.
Perelson, A. S., and G. F. Oster. 1979. Theoretical studies of clonal selec-tion: minimal antibody repertoire size and reliability of self-non-selfdiscrimination. J. Theor. Biol. 81:645–670.
Petkova, S. B., H. B. Tanowitz, H. I. Magazine, S. M. Factor, J. Chan, R. G.Pestell, B. Bouzahzah, S. A. Douglas, V. Shtutin, S. A. Morris, et al.2000. Myocardial expression of endothelin-1 in murine Trypanosoma
cruzi infection. Cardiovasc. Pathol. 9:257–265.Rahbar, A., L. Bostrom, and C. Soderberg-Nauder. 2006. Detection of cyto-
toxic CD13-specific autoantibodies in sera from patients with ulcerativecolitis and Crohn’s disease. J. Autoimmun. 26:155–164.
Rider, J. R., W. E. R. Olliver, R. J. Lock, S. T. Brookes, and D. H. Pam-philon. 1997. Human cytomegalovirus infection and Systemic LupusErythmatosus. Clin. Exp. Rheumatol. 15:405–409.
Rees, H. J., S. E. Soudain, N. A. Gregson, and R. A. Hughes. 1995. Campy-
lobacter jejuni infection and Guillain-Barre syndrome. N. Engl. J. Med.333:1374–1379.
Ruxton, G. D., T. N. Sherratt, and M. P. Speed. 2004. Avoiding attack: theevolutionary ecology of crypsis, warning signals and mimicry. OxfordUniv. Press, Oxford, U.K.
Sokal, R. R., and F. J. Rohlf. 1994. Biometry, 3rd ed. W.H. Freeman and Co.New York.
Shrinivasappa, J., J. Saegusa, B. Prabhakar, M. Gentry, M. Buchmeier, T. J.Wiktor, H. Koprowski, M. B. A. Oldstone, and A. L. Notkins. 1986.Molecular mimicry: frequency of reactivity of monoclonal antiviralantibodies with normal tissues. J. Virol. 57:397–401.
Sulitzeanu, D., and D. W. Weiss. 1981. Antigen and immunogen—a questionof terminology. Cancer Immunol. Immunother. 11:291–292.
Tarleton, R. L. 2001. Parasite persistence in the aetiology of Chagas’ disease.Int. J. Parasitol. 31:550–554.
Tarleton, R. L., and L. Zhang. 1999. Chagas’ disease etiology: autoimmunityor parasite persistence? Parasitol. Today 15:94–99.
von Herrath, M. G., and M. B. A. Oldstone. 1995. Role of viruses in theloss of tolerance to self-antigens and in autoimmune diseases. Trends.Microbiol. 3:424–430.
———. 1996. Virus-induced autoimmune disease. Curr. Opin. Immunol.8:878–885.
Wing, K., Z. Fehervari, and S. Sakaguchi. 2006. Emerging possibilities in thedevelopment and function of regulatory T cells. Int. Immunol. 18:991–1000.
Wolfl, N., and T. Rutebemberwa. 2008. Hepatitis C virus immune escape viaexploitation of a hole in the T cell repertoire. J. Immunol. 181:6435–6446.
Ye, Q., R. M. Krug, and Y. J. Tao. 2006. The mechanism by which influenza Avirus nucleoprotein forms oligomers and binds RNA. Nature 444:1078–1082.
Young, D., T. Hussel, and G. Dougan. 2002. Chronic bacterial infections:living with unwanted guests. Nat. Immunol. Rev. 3:1026–1032.
Associate Editor: J. Wilkins
EVOLUTION 2013 1 5

A. HURFORD AND T. DAY
Supporting InformationAdditional Supporting Information may be found in the online version of this article at the publisher’s website:
Appendix A. The proof that the evolutionarily stable parasite strategy maximizes R0.
Appendix B. The proof that eq. (14) is the evolutionarily stable parasite strategy under the costly autoimmunity hypothesis.
Appendix C. The numerical methods used to generate Figs. 3–5.
1 6 EVOLUTION 2013