Embed Size (px)
Citation preview

Journal of Public Transportation, Vol. 21, No. 2, 2018 1
Immigration, Income, and Public Transit Perceptions: Findings from an Intercept Survey
© 2018 Jesus M. Barajas, Asha Weinstein Agrawal & Daniel G. Chatman http//dx.doi.org/10.5038/2375-0901.21.2.1ISSN: 1077-291X | Licenced under Creative Commons License Attribution - Noncommercial 4.0
The Journal of Public Transportation is published by the Center for Urban Transportation Research at the University of South Florida
Journal of Public Transportation | scholarcommons.usf.edu/jptVol. 21 No. 2 [2018] pp. 1-18
Journal of Public Transportation
Immigration, Income, and Public Transit Perceptions:
Findings from an Intercept SurveyJesus M. Barajas
University of Illinois at Urbana-Champaign
Asha Weinstein AgrawalSan José State University
Daniel G. ChatmanUniversity of California, Berkeley
AbstractAlthough a significant fraction of public transit riders in the United States are immigrants, relatively little research explores whether immigrants have unique transit experiences. This paper analyzes intercept survey data from 1,247 transit riders in the San Francisco Bay Area to explore how mode choices and travel experiences differ for low-income immigrants compared to higher-income immigrants and US-born residents. We find that some public transit experiences are similar across all immigrant status and income groups, while in other ways low-income immigrants differ from their higher-income counterparts or from US-born respondents. In particular, low-income immigrants were less likely to have a bus pass or bicycle access. They were far more likely to substitute driving for taking public transit than all other immigrant and income groups. The results underscore the importance of collecting data on country of origin together with travel behavior data, because many experiences are more burdensome for low-income immigrants.
Keywords: Latino immigrants, travel behavior, perceptions, surveys
IntroductionMore than 40 million immigrants live in the United States, comprising about 13% of the population (Migration Policy Institute 2015), and the U.S. Census Bureau projects that the foreign-born population will grow to around 20% by 2060 (Colby and Ortman 2015). If recent trends continue, evidence suggests that new
2 Journal of Public Transportation, Vol. 21, No. 2, 2018
Immigration, Income, and Public Transit Perceptions: Findings from an Intercept Survey
immigrants will earn substantially lower incomes than their US-born counterparts and experience slower wage growth than earlier immigrant cohorts (Borjas 2015). There is a rich national discourse on how this influx of low-income immigrants will influence and integrate into employment, education, and health care in the United States, but few researchers or policy makers have explored how newcomers will access those jobs and services or how their demand will affect transportation systems (Chatman and Klein 2009). The impacts could be substantial; for example, public transit ridership levels are closely tied to the rise and fall of immigration (e.g., FHWA 2011). The impacts are particularly crucial for low-income immigrants; they take transit at more than twice the rate of higher-income immigrants (FHWA 2011) and face unique challenges, such as language barriers, when doing so (e.g., Liu and Schachter 2007). Furthermore, the jobs lower-income immigrants often hold, such as those in the service or construction industries, are spatially dispersed and not well connected by transit (Chatman and Klein 2011; Chatman 2014).
To help fill this gap in knowledge, the paper addresses two questions about travel by low-income immigrants. We focus on the experiences of those who ride public transportation:
1. How, and how often, do low-income immigrant public transit riders travel compared to others?
2. How do their attitudes toward and perceptions of public transit compare to those of others?
To explore these questions, we relied on an intercept survey that we designed and administered in the central San Francisco Bay Area, a region in which 7% of unlinked trips are by public transit (Caltrans 2013). Most survey sites were at transit stops that served a high proportion of Latin American immigrants. The survey data allowed us to quantify transportation mode use and to measure transportation experiences, and then make comparisons between immigrant and US-born respondents, and low- and higher-income groups. We focused particularly on comparing low-income immigrants to other groups because we expected that the former are likely to face unique barriers in accessing and using public transportation.
The remaining sections of this paper review relevant research, describe the research design, and then compare low-income immigrant travel patterns and experiences with the US-born and those of higher income. The paper concludes by discussing the broader relevance of the findings, describing future research needs, and offering recommendations for policy.
Immigrants and Travel: A Brief Literature ReviewThere is relatively little information available about immigrants and travel because most travel surveys do not ask about immigrant status. Most of the information about immigrant travel in the United States comes from nationally representative travel surveys, such as the National Household Travel Survey or custom-designed surveys, but other travel surveys typically do not identify a respondent’s birth country. However, a few scholars have specifically looked at immigrant travel in the United States. They found that immigrants are more likely to take public transit, carpool, bicycle, and walk compared to non-immigrants, after controlling for a variety of demographic, socioeconomic, and spatial characteristics (Blumenberg and Evans 2010; Blumenberg 2009; Blumenberg and Smart 2010; Smart 2010; Tal and Handy 2010; Liu and Painter 2012).
Immigrants are not a homogeneous group, and several of these studies have looked specifically at low-income immigrants. Low-income immigrants own fewer cars, drive less, and generally use autos less than higher-income immigrants, though the estimated magnitudes of these differences often vary by country of origin (Chatman 2014; Tal and Handy 2010). Others have found that lower-income immigrants use transit and carpool more often than higher-income immigrants (Blumenberg and Smart 2010; Liu and Painter 2012). Finally, Smart (2010)
Journal of Public Transportation, Vol. 21, No. 2, 2018 3
Immigration, Income, and Public Transit Perceptions: Findings from an Intercept Survey
found that lower-income immigrants are more likely to bicycle than higher-income immigrants, with the effects of income on bicycle use stronger for immigrants than for US-born residents.
There are several arguments and patterns of evidence about why immigrants might travel differently than the US-born. Some have suggested there is an unexplained “immigrant effect”—latent cultural attributes that affect daily travel. As immigrants remain in the United States and replace their sustainable transportation trips with driving over time, these differences diminish, but persist even two decades after first immigrating (FHWA 2011; Tal and Handy 2010). Others argue that workplace area characteristics and neighborhood preferences may account for much of the remaining variation in travel instead (Chatman and Klein 2011; Chatman 2014; Liu and Painter 2012). For example, strong social network ties for those living in immigrant enclaves may promote carpooling if neighbors are commuting to shared occupational locations (Blumenberg and Smart 2010; 2013). Smart (2015) found that living in an immigrant neighborhood predicts mode choice more strongly for immigrants than for non-immigrants, with the strongest influences seen for bicycling and walking. But most immigrants do not live in immigrant enclaves; they may drive more if they move to the suburbs or take public transit more if they live in the urban core like their US-born counterparts (Yu and Myers 2007).
Few studies have explored immigrants’ perceptions of the transportation options in their communities, despite evidence that attitudes and perceptions may significantly influence travel (Bohte, Maat, and van Wee 2009; Cao, Mokhtarian, and Handy 2009; Spears, Houston, and Boarnet 2013). A focus group study found that Mexican immigrants in California valued several features of public transit, including the cost savings, geographic reach, and comfort, while identifying long wait times, limited routes, and limited frequency as common disadvantages (Lovejoy and Handy 2007). Another study found that immigrants in New Jersey who had limited English proficiency perceived public transit systems as discriminatory because there were not instructions in their languages or because bus operators treated non-English speakers poorly (Liu and Schachter 2007).
Research DesignWe administered a self-completion intercept survey to explore mode use and public transit perceptions among public transit users whom we intercepted at 44 sites across the San Francisco Bay Area. We chose an intercept survey over other methods to obtain enough responses from low-income immigrants who use public transit. Because they make up such a small share of the population, the best way to reach a sufficient number was to approach travelers in neighborhoods with a high share of low-income immigrants while on their way to or from a transit stop. Also, intercept methods are often more successful than random mail or phone surveys at reaching “shy” groups, including undocumented immigrants (Wofinden 2003). The non-random nature of the intercept survey prohibits us from generalizing the data to the full metropolitan area population, but the method does allow us to conduct comparisons between low-income immigrants and others in our sample (Groves 1989).
Questionnaire
The survey asked 21 questions that fall into three categories: recent travel, transportation experiences, and personal information. (See Barajas, Chatman, and Agrawal [2016] for the full survey instrument.) In the recent travel section, people reported their travel in the seven days prior to taking the survey. They noted how many days they drove, carpooled, cycled, walked, or took public transportation. Respondents who traveled by bus or rail reported their access and egress modes. Respondents also reported the number of days they had access to a bicycle and a motor vehicle. We asked about vehicle access rather than ownership because some low-income and immigrant families rely on borrowing cars as a mobility strategy (Lovejoy and Handy 2008; Clifton 2004).

4 Journal of Public Transportation, Vol. 21, No. 2, 2018
Immigration, Income, and Public Transit Perceptions: Findings from an Intercept Survey
Transportation experiences refer to respondents’ attitudes, perceptions, and constraints with respect to daily travel. We asked respondents to estimate how much more they would have taken public transit and bicycled given hypothesized changes in crime, the ease of using bikes with transit, transit cost, and bikeway provision. We also asked them to report how often they substituted one mode for another and how much they agreed or disagreed with statements about public transit and bicycling. Finally, the personal information section collected standard demographic and socioeconomic information, as well as a home address or a street intersection near their home.
To develop the questions, we reviewed other travel survey questionnaires and analyzed interviews with Latin American immigrants recruited through social service organizations (see details in Barajas, Chatman, and Agrawal [2016]). Before finalizing the questionnaire, we pre-tested the survey on a convenience sample of respondents in both English and Spanish and then pilot tested in the field.
Survey Locations and Procedures
We designed the sampling method to overrepresent low-income Latino immigrants who ride transit, with additional emphasis on obtaining responses from people who access transit by bicycle. We targeted this group of immigrants because Latin America is the most common region of origin for immigrants in the San Francisco Bay Area, representing 35% of immigrants (U.S. Census Bureau 2015). To find our desired respondents within the central Bay Area, we used 2007-2011 American Community Survey data to identify census tracts that ranked in the top third within each large urban county along the following dimensions: the proportion of foreign-born residents, the proportion of the foreign-born population that earned less than $25,000 per year, the median income of the census tract, and the share of workers who took public transportation to work. This set of criteria was chosen after we tested several other combinations of variables that yielded similar neighborhood selections.
Within the selected census tracts, we surveyed at 44 locations of different types: mainly high-ridership rail and bus stops (two-thirds of sites), and also public plazas, businesses that cater to immigrants, and sites where day laborers congregate waiting for work opportunities. Figure 1 shows the survey locations and number of responses at each site.
To sample as diverse a set of people as possible at high-traffic locations, surveyors requested participation from every fifth person who arrived. At lower-traffic locations, surveyors approached every person who arrived or was present. Surveyors were also instructed to prioritize bicycle riders at high-traffic sites to achieve a sufficient sample of cyclists. At least one Spanish-speaking surveyor was present at each intercept site for 65% of the survey shifts.
The survey was completed between October 2014 and March 2015, excluding only four weeks during the winter holidays. The survey took approximately five minutes for each respondent to complete and was designed to be finished at the intercept point, although 4% of respondents mailed their surveys back. Surveyors administered the survey orally to those who requested it, allowing people with limited literacy to participate. The surveyors offered potential respondents a granola bar as an incentive to participate.

Journal of Public Transportation, Vol. 21, No. 2, 2018 5
Immigration, Income, and Public Transit Perceptions: Findings from an Intercept Survey
Transportation experiences refer to respondents’ attitudes, perceptions, and constraints with respect to daily travel. We asked respondents to estimate how much more they would have taken public transit and bicycled given hypothesized changes in crime, the ease of using bikes with transit, transit cost, and bikeway provision. We also asked them to report how often they substituted one mode for another and how much they agreed or disagreed with statements about public transit and bicycling. Finally, the personal information section collectedstandard demographic and socioeconomic information, as well as a home address or a street intersection near their home.
To develop the questions, we reviewed other travel survey questionnaires and analyzed interviews with Latin American immigrants recruited through social service organizations (see details in Barajas, Chatman, and Agrawal [2016]). Before finalizing the questionnaire, we pre-tested the survey on a convenience sample of respondents in both English and Spanish and then pilot tested in the field.
Survey Locations and Procedures
We designed the sampling method to overrepresent low-income Latino immigrants who ride transit, with additional emphasis on obtaining responses from people who access transit by bicycle. We targeted this group of immigrants because Latin America is the most common region of origin for immigrants in the San Francisco Bay Area, representing 35% of immigrants (U.S. Census Bureau 2015). To find our desired respondents within the central Bay Area, we used 2007-2011 American Community Survey data to identify census tracts that ranked in the top third within each large urban county along the following dimensions: the proportion of foreign-born residents, the proportion of the foreign-born population that earned less than $25,000 per year, the median income of the census tract, and the share of workers who took public transportation to work. This set of criteria was chosen after we tested several other combinations of variables that yielded similar neighborhood selections.
Within the selected census tracts, we surveyed at 44 locations of different types: mainly high-ridership rail and bus stops (two-thirds of sites), and also public plazas, businesses that cater to immigrants, and sites where day laborers congregate waiting for work opportunities. Figure 1 shows the survey locations and number of responses at each site.
To sample as diverse a set of people as possible at high-traffic locations, surveyors requested participation from every fifth person who arrived. At lower-traffic locations, surveyors approached every person who arrived or was present. Surveyors were also instructed to prioritize bicycle riders at high-traffic sites to achieve a sufficient sample of cyclists. At least one Spanish-speaking surveyor was present at each intercept site for 65% of the survey shifts.
The survey was completed between October 2014 and March 2015, excluding only four weeks during the winter holidays. The survey took approximately five minutes for each respondent to complete and was designed to be finished at the intercept point, although 4% of respondents mailed their surveys back. Surveyors administered the survey orally to those who requested it, allowing people with limited literacy to participate. The surveyors offered potential respondents a granola bar as an incentive to participate.
Source: Authors’ map using base layer design by Stamen Design and base layer data from OpenStreetMap.
Thirty-three percent of people we approached completed a survey, generating 2,087 responses; twenty-nine percent of those completed it in Spanish. Here we analyze responses from the 1,247 survey respondents who reported their household income, reported whether they were born in the United States, and said that they took transit at least once in the previous seven days. (The remaining 840 responses were missing data for at least one of those categories.)
Definitions
For clarity, we define three terms used throughout this paper. Immigrant means anyone who was born outside of the United States. (The analysis includes all immigrants, regardless of race, ethnicity, or country of origin, though about 70% of immigrants in our dataset were from Latin America or identified as Hispanic or Latino.) A transit rider is someone who took public transportation at least one day in the previous seven days. We use the term low-income to denote households that earned less than $25,000 in the previous year. We chose this income
FIGURE 1.Intercept survey locations coded by number of responses received and survey site type

6 Journal of Public Transportation, Vol. 21, No. 2, 2018
Immigration, Income, and Public Transit Perceptions: Findings from an Intercept Survey
threshold for both theoretical and practical reasons. The average household in the survey sample had 3.6 people, so we looked for poverty guidelines for families of four. The federal poverty limit for a family of four in 2014 was $23,850 (HHS 2015), while the U.S. Department of Housing and Urban Development defined extremely low-income families of four in the San Francisco Bay Area as those earning less than a threshold dollar amount ranging between $27,600 and $33,200, depending on the county (HUD 2014). The threshold also happens to be about the median for household income in the dataset, which is convenient for analysis purposes.
Results
Respondent Demographics
The survey sampling method successfully oversampled immigrants, and Latino immigrants in particular. About 44% of respondents said they were born outside the United States, compared to 32% in the central San Francisco Bay Area (U.S. Census Bureau 2015). On average, these immigrants had lived in the country for 15 years, though 22% had arrived within the previous 5 years. The most common country of origin was Mexico, at just under half of immigrants who answered that question. In total, 68% of immigrant respondents reported they were from Central America. By comparison, the American Community Survey estimated that 29% of San Francisco Bay Area immigrants were from Central America (which includes Mexico).
Immigrant transit riders earned less than the US-born, on average. Of respondents who provided their household income, 62% of immigrants reported a household income of less than $25,000, compared to 44% of the US-born. The median household income category for immigrant respondents was $15,000–$24,999, while it was $25,000–$49,999 for the US-born. Figure 2 shows respondent income distribution classified by nativity.
Low-income immigrants faced socioeconomic disadvantage in several other key ways (Table 1). Nearly half of low-income immigrants had less than a high-school education, almost five times as many as the next highest group. They were less likely to be employed than people in the higher-income group, and less likely to be in school than those born in the United States. Fewer than 1 in 10 low-income immigrants owned their homes, compared to a quarter of higher-income immigrants and a third of higher-income US-born respondents.
Note: Bold indicates significant differences from low-income immigrant group, using two-sample equality of proportions or means tests (p < 0.05). Responses for individual variables differ from total responses because of missing values.
Use of Transit and Other Travel Modes
The questionnaire asked respondents how frequently they had used various modes of transportation in the previous seven days (Table 2). Most differences in travel patterns between low-income immigrants and other groups were small. The single biggest difference between groups was the number of days walking. Low-income immigrants walked one day more often than higher-income immigrants did, although about the same amount as the US-born in both income groups. Low-income and higher-income immigrants bicycled with about the
TABLE 1.Comparison of Respondent Sociodemographic Characteristics by Nativity and Income Group
Note: Vertical bar divides chart into low-income and higher-income categories as defined in this paper.
FIGURE 2.Income distribution by nativity status

Journal of Public Transportation, Vol. 21, No. 2, 2018 7
Immigration, Income, and Public Transit Perceptions: Findings from an Intercept Survey
Low-income immigrants faced socioeconomic disadvantage in several other key ways (Table 1). Nearly half of low-income immigrants had less than a high-school education, almost five times as many as the next highest group. They were less likely to be employed than people in the higher-income group, and less likely to be in school than those born in the United States. Fewer than 1 in 10 low-income immigrants owned their homes, compared to a quarter of higher-income immigrants and a third of higher-income US-born respondents.
Note: Bold indicates significant differences from low-income immigrant group, using two-sample equality of proportions or means tests (p < 0.05). Responses for individual variables differ from total responses because of missing values.
Use of Transit and Other Travel Modes
The questionnaire asked respondents how frequently they had used various modes of transportation in the previous seven days (Table 2). Most differences in travel patterns between low-income immigrants and other groups were small. The single biggest difference between groups was the number of days walking. Low-income immigrants walked one day more often than higher-income immigrants did, although about the same amount as the US-born in both income groups. Low-income and higher-income immigrants bicycled with about the
TABLE 1.Comparison of Respondent Sociodemographic Characteristics by Nativity and Income Group
Low-income immigrant
Higher-income immigrant
Low-income US-born
Higher-income US-born
Proportions (%)
Race/ethnicity
Hispanic 82 53 41 31
Asian 13 34 5 6
White 1 8 24 31
Black 1 3 22 21
Two or more 1 1 4 6
Education
Less than high school 45 10 5 1
High school 33 27 42 17
More than high school 22 63 53 83
Employed 58 78 56 81
In school 18 25 33 32
Female 46 49 48 44
Renter 93 76 90 67
Means
Time in United States (years) 16.1 15.0
Age (years) 42.4 40.4 37.1 36.9
Household size (total) 3.9 3.9 3.6 3.3
Under age 16 1.3 1.2 0.9 0.8
Age 16 and over 2.8 2.7 3.0 2.5

8 Journal of Public Transportation, Vol. 21, No. 2, 2018
Immigration, Income, and Public Transit Perceptions: Findings from an Intercept Survey
Low-income immigrant
Higher-income immigrant
Low-income US-born
Higher-income US-born
Transit 4.9 4.7 5.1 4.9
Transit access mode
Drive to transit 0.3 0.5 0.2 0.4
Ride to transit 0.4 0.5 0.4 0.6
Walk to transit 4.0 3.4 3.9 3.4
Bike to transit 0.4 0.5 0.8 0.9
Drive 0.6 1.1 0.7 1.3
Ride 0.8 0.9 0.9 1.1
Walk 2.7 1.7 2.5 2.3
Bike 0.6 0.7 0.9 1.0
same frequency, which was less than the US-born in both income groups. By contrast, when it came to driving, low-income immigrants and the low-income US-born were similar. Both these groups drove less than either higher-income immigrants or higher-income US-born residents.
The survey also asked about transit rider access to a motor vehicle, a bicycle, or a bus pass. For motor vehicles and bicycles, respondents were asked how many days in the previous seven they had access to a “working motor vehicle” and to a “working bicycle” (Figure 3). Fewer low-income immigrants had access to a motor vehicle than both higher-income groups, though their access was about the same as that for low-income US-born respondents. Only about one-quarter of low-income immigrants had access to a vehicle in the week prior to taking the survey, and only 12% had access every day that week. In contrast, almost one-quarter of higher-income immigrants and about one-third of the higher-income US-born had access to a vehicle every day. Low-income immigrants also had less access to bicycles than other comparison groups; only 15% had access to a bicycle every day, compared to one-quarter or more of all other groups. Also, four of every five low-income immigrants lacked any access at all to a bicycle. Finally, low-income immigrants were the least likely group to have a bus pass. Fewer than half did, compared to about 60% for all other groups. In short, the low-income immigrant respondents had less access to transportation resources, constraining their ability to travel.
TABLE 2.Mean Number of Travel Days per Week, per Mode, by Nativity and Income Group
Note: Bold indicates significant differences from the low-income immigrant group, using equality of means tests (p < 0.05).

Journal of Public Transportation, Vol. 21, No. 2, 2018 9
Immigration, Income, and Public Transit Perceptions: Findings from an Intercept Survey
Note: Error bars represent 95% confidence intervals. An X indicates that the value for that group is statistically significantly different from the value for the low-income immigrant group (p < 0.05).
FIGURE 3.Transportation resource access by nativity and income group
10 Journal of Public Transportation, Vol. 21, No. 2, 2018
Immigration, Income, and Public Transit Perceptions: Findings from an Intercept Survey
Transportation Experiences
The second section of the survey asked respondents 12 questions about their experiences with public transportation. All differences or comparisons we report in the text below are statistically significant at the 95% confidence interval according to two-sample proportion tests.
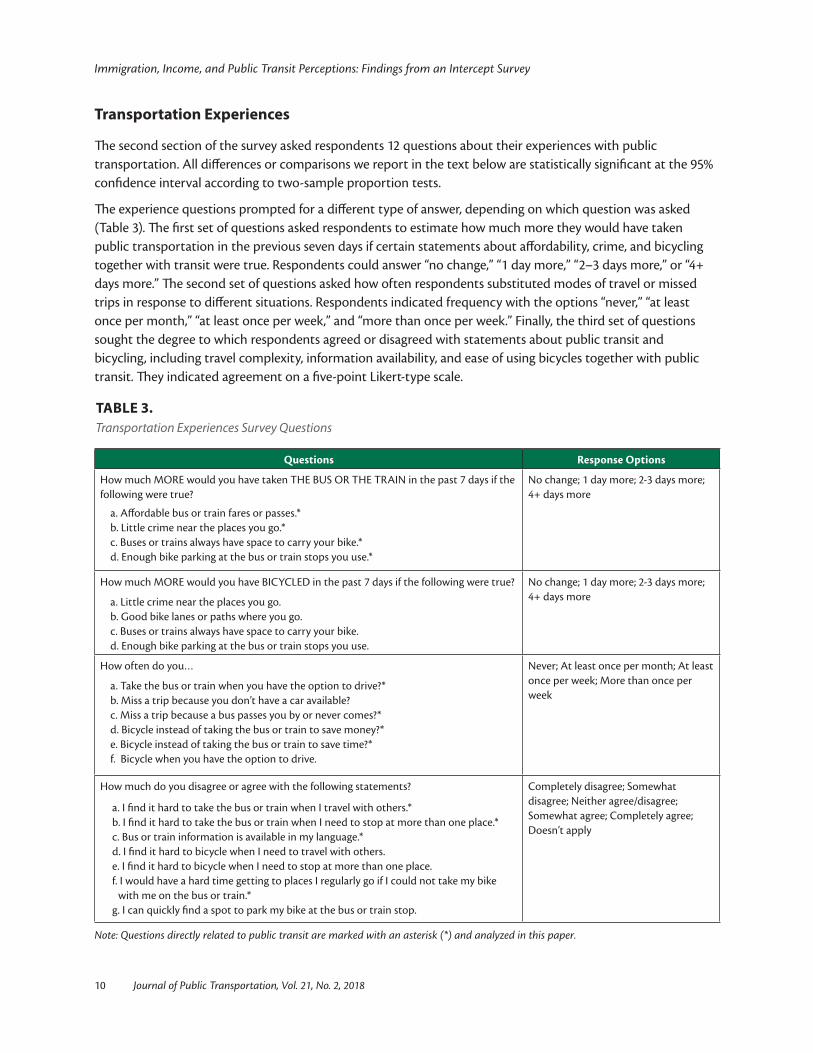
The experience questions prompted for a different type of answer, depending on which question was asked (Table 3). The first set of questions asked respondents to estimate how much more they would have taken public transportation in the previous seven days if certain statements about affordability, crime, and bicycling together with transit were true. Respondents could answer “no change,” “1 day more,” “2–3 days more,” or “4+ days more.” The second set of questions asked how often respondents substituted modes of travel or missed trips in response to different situations. Respondents indicated frequency with the options “never,” “at least once per month,” “at least once per week,” and “more than once per week.” Finally, the third set of questions sought the degree to which respondents agreed or disagreed with statements about public transit and bicycling, including travel complexity, information availability, and ease of using bicycles together with public transit. They indicated agreement on a five-point Likert-type scale.
Note: Questions directly related to public transit are marked with an asterisk (*) and analyzed in this paper.
TABLE 3.Transportation Experiences Survey Questions
Questions Response Options
How much MORE would you have taken THE BUS OR THE TRAIN in the past 7 days if the following were true?
a. Affordable bus or train fares or passes.* b. Little crime near the places you go.* c. Buses or trains always have space to carry your bike.* d. Enough bike parking at the bus or train stops you use.*
No change; 1 day more; 2-3 days more; 4+ days more
How much MORE would you have BICYCLED in the past 7 days if the following were true?
a. Little crime near the places you go. b. Good bike lanes or paths where you go. c. Buses or trains always have space to carry your bike. d. Enough bike parking at the bus or train stops you use.
No change; 1 day more; 2-3 days more; 4+ days more
How often do you…
a. Take the bus or train when you have the option to drive?* b. Miss a trip because you don’t have a car available? c. Miss a trip because a bus passes you by or never comes?* d. Bicycle instead of taking the bus or train to save money?* e. Bicycle instead of taking the bus or train to save time?* f. Bicycle when you have the option to drive.
Never; At least once per month; At least once per week; More than once per week
How much do you disagree or agree with the following statements?
a. I find it hard to take the bus or train when I travel with others.* b. I find it hard to take the bus or train when I need to stop at more than one place.*c. Bus or train information is available in my language.*d. I find it hard to bicycle when I need to travel with others. e. I find it hard to bicycle when I need to stop at more than one place.f. I would have a hard time getting to places I regularly go if I could not take my bike
with me on the bus or train.*g. I can quickly find a spot to park my bike at the bus or train stop.
Completely disagree; Somewhat disagree; Neither agree/disagree; Somewhat agree; Completely agree; Doesn’t apply

Journal of Public Transportation, Vol. 21, No. 2, 2018 11
Immigration, Income, and Public Transit Perceptions: Findings from an Intercept Survey
Figure 4 shows the responses for each question about public transit experiences by nativity and income category. The cost of taking transit was reported as a significant barrier by all transit riders except the higher-income US-born group. About 60% of low-income immigrants said they would have taken public transit at least one more day in the previous week if fares were more affordable. Low-income US-born residents and higher-income immigrants responded in much the same way. By contrast, among higher-income US-born residents, fewer than half reported they would take public transit more often if fares were cheaper. What did not vary among the four groups was that for respondents to whom transit fares mattered at all, they mattered a lot. In every comparison group, “four more days per week” was the most common response among people who said they would take transit more if costs were lower—even for many respondents who were already taking transit four or more days per week.
Immigrants were less likely than the US-born to view bicycling as a way to reduce their spending on public transit. Only 20% of low-income immigrants said they ever chose bicycling over public transit to save money—as compared to one-quarter of low-income US-born respondents and one-third of higher-income US-born residents. Each group had a similar response to whether they bicycled rather than took transit to save time. Low-income immigrants were also significantly less likely than US-born respondents to say that they could quickly find bicycle parking at bus or train stops.
Given the option, low-income immigrants were more likely than all other groups to drive instead of taking transit. Nearly 60% of low-income immigrants responded that they never took transit when they had the option to drive. In contrast, less than half of each of the other comparison groups drove instead of taking transit. Of those who chose to take transit over driving, most low-income immigrants did so more than once per week, significantly less than other groups. Despite these responses, both low-income groups drove fewer days than higher-income immigrants or US-born residents and had less access to a motor vehicle.

12 Journal of Public Transportation, Vol. 21, No. 2, 2018
Immigration, Income, and Public Transit Perceptions: Findings from an Intercept Survey
Note: Error bars represent 95% confidence intervals. An X indicates that the value for that group is statistically significantly different from the value for the low-income immigrant group (p < 0.05).
FIGURE 4.Transportation experiences by nativity and income group

Journal of Public Transportation, Vol. 21, No. 2, 2018 13
Immigration, Income, and Public Transit Perceptions: Findings from an Intercept Survey
Although a significant proportion of each group responded that reduced crime would change how often they took transit, a majority of respondents indicated that a reduction in crime would not affect their transit use. There were no significant differences in how low-income immigrants responded as compared to the other groups.
There was no consistent pattern in how low-income immigrants responded to the complexity of taking public transit compared to other groups (Figure 4, bottom panel). About 60% of all respondents did not think it was difficult to take transit when traveling with others, and there were no significant differences by immigrant or income status. But low-income immigrants were more likely than higher-income groups to agree it was easier to take transit to multiple locations; about half, compared to slightly more than a third of high-income immigrants and US-born respondents. Although most low-income immigrants agreed that public transit information was available in their language, 23% disagreed, significantly more than those born in the United States (14%).
Discussion and Summary of FindingsLow-income immigrant respondents shared many travel behaviors and experiences with higher-income immigrants and US-born respondents. For example, respondents across all four groups reported a similar number of days per week that they used transit, carpooled, or drove to access transit. About the same share had partial access to a vehicle or bicycle. And people in all four groups were equally concerned with affordability, neighborhood crime, service reliability, transit access, and sufficient information about public transit. The fact that respondents in all four groups had these similar behaviors and experiences suggests that other factors, such as transit service or neighborhood characteristics, shape their behavior in ways that are not directly influenced by income or immigrant status.
But there were a few cases where differences stood out. In particular, low-income immigrants were distinct from the other three groups in being less likely to have a bus pass, to have a bicycle, or to take transit when they had the option to drive. Regardless of income, immigrants tended to respond differently from the US-born on most of the bicycling-related questions. Immigrants were less likely than the US-born to have access to a bicycle every day, and they bicycled fewer days per week for any purpose, bicycled fewer days per week to access transit, and were less likely to bicycle instead of taking transit as a way to save money. Finally, in other ways, low-income immigrant respondents were similar to the low-income US-born but different from higher-income respondents regardless of immigrant status. Lower-income respondents had less access to a private vehicle, drove fewer days per week, walked to transit more frequently, and were less likely to quickly find bike parking at transit stops.
Why is there so much similarity among immigrants and US-born residents, regardless of income? A number of barriers to public transit use are nearly universal. Most regular transit riders are equally concerned with affordability, neighborhood crime, reliability, transit access, and having sufficient information about public transit. We surveyed a variety of people in the same neighborhoods who would be affected by transit service quality and transportation infrastructure in the same ways. These findings suggest that the local environment predicts travel behavior and attitudes more than household income or immigrant status do. At the same time, still other demographic variables may be more important than income, immigrant status, or the local environment. For example, low-income immigrants were more likely to find it difficult to take transit with other people. The association might not result from anything related to their immigrant status, but rather from household structure and the need to travel with young children. Low-income immigrants averaged 1.3 children under the age of 16 in their households, compared to 0.9 and 0.8 children for the low-income US-born and higher-income US-born respondents, respectively.
14 Journal of Public Transportation, Vol. 21, No. 2, 2018
Immigration, Income, and Public Transit Perceptions: Findings from an Intercept Survey
Based on findings from interviews in a parallel research effort (Barajas, Chatman, and Agrawal 2016), we expected that low-income immigrant transit riders might miss trips because buses passed them by more frequently than other riders. Several interviewees recalled instances when buses drove by, apparently still with open seats, or when bus operators were intentionally rude because the rider spoke limited English. A bus passing by a rider is not an event unique to low-income immigrants—among all four groups, the share of people reporting that a bus passed them by was about the same. It is encouraging that there do not appear to be disparate impacts with respect to missed trips because of transit unreliability. On the other hand, over half of each respondent group indicated buses passed them by at least once per month, and a quarter of all respondents had a bus pass them by at least once per week, suggesting everyone could benefit from service improvements.
We also expected concerns about crime to be a bigger issue for low-income immigrants than for other respondents, as low-income immigrants are known anecdotally to be more exposed to crime in public places and near their homes and workplaces. However, because we sampled in neighborhoods that did not vary much in urban form, we cannot determine whether there is any such correlation across the region. Significantly more low-income immigrants reported affordability to be a bigger barrier to travel than crime; and crime appears to impact the comparison groups about as much as it affects low-income immigrants. This concurs with other research on transit access (Kim, Ulfarsson, and Hennessy 2007). Another possible explanation is the fact that the surveys themselves were administered mainly at transit stops in low-income neighborhoods, which research has linked to the incidence of transit crime (Loukaitou-Sideris, Liggett, and Iseki 2002). It is possible that respondents thought about safety from crime based on the location of the stop rather than their home or work locations.
The largest difference between groups was the fact that low-income immigrant transit riders were far less likely to take public transit for trips where they had the option to drive, which might be true for a few reasons. Compared to higher-income groups, low-income immigrants in the sample have less access to personal vehicles. They may need to negotiate for vehicle access for a specific purpose that transit does not serve. In other words, low-income immigrants may drive only when they have no other good options for trips such as accessing health care when ill, buying bulk groceries, or traveling outside the region (Lovejoy and Handy 2008). Others who have more ready access to vehicles may be able to make a conscious decision whether to take transit or drive based on factors other than vehicle availability.
ConclusionDifferences in travel patterns and attitudes among low- and higher-income immigrants and US-born respondents reveal the diversity of the immigrant experience. In several respects, particularly with respect to bicycling, immigrant respondents are similar regardless of income. In other ways, low-income immigrants are unlike higher-income immigrants and instead more likely to face the same barriers as US-born low-income individuals, such as with respect to auto availability and the difficulty of using public transit to travel to multiple places. Our results also suggest that low-income immigrants cycle less often than other groups, a novel finding but, because of different methods and data, one that is not strictly comparable to other research that comes to an opposite conclusion (Smart 2010). And the largest difference among groups is how often low-income immigrants are willing to take transit when they have the option to drive.
The study design limits the findings in a few ways. First, the dataset is limited to transit riders and cannot be generalized beyond the transit-riding population. Second, the non-random sampling method prevents generalizing the results to all low-income immigrants and transit riders in the San Francisco Bay Area. The

Journal of Public Transportation, Vol. 21, No. 2, 2018 15
Immigration, Income, and Public Transit Perceptions: Findings from an Intercept Survey
low-income immigrant group was predominantly Latino, suggesting that the conclusions we draw about immigrants might be more applicable to Latino immigrants. Nevertheless, in the context of data collection that historically underrepresents the low-income immigrant population, we collected a large number of responses that give us confidence in the differences we found between population groups and provide some insight into likely travel behavior and attitudes for low-income immigrants in general. In the future, an option for generalizing claims more broadly would be to systematically oversample immigrants in regional household transportation surveys. Oversampling is already typically done in such surveys to better represent other populations of interest.
Lastly, the analysis presented here does not control for factors that might explain differences in travel according to immigrant status and income group, such as other socioeconomic characteristics, the length of residence in the United States, urban form, or transportation services and infrastructure. We plan to address this in future analysis of the dataset so that we can better explain the relationships between immigrant status, transportation experiences, and mode use.
The study findings suggest implications for policy around fares, data collection, and access. Notably, less than half of low-income immigrants had a bus pass to save them money in the long-term—a lower proportion than even other low-income individuals. This difference suggests that cost may not be what prevents low-income immigrants from obtaining passes, but rather other barriers such as poor knowledge of fare options or no access to a bank account. (A bank account is required to obtain a recurring monthly pass.) To overcome these barriers, transit agencies considering changes to their fare structure may want to work with community groups to help educate people who may not be reached through traditional public information campaigns. Further, transit agencies should consider ways to provide passes without requiring a linked bank account. For example, AC Transit, the bus operator in the East Bay, automatically converts cash payments to a day pass on passengers’ electronic fare cards when their cash payments for the day exceed the cost of the day pass. A similar system for monthly passes would eliminate the need for an upfront lump-sum payment for riders, while still providing the benefit of a frequent-rider discount.
Another recommendation is for public transit agencies to routinely collect immigrant status data in their periodic onboard surveys to better understand the needs and issues of immigrants. Although providing surveys in different languages proxies somewhat for country of origin, our results suggest that some differences in experiences between immigrants and others are strong enough to warrant closer attention to immigrant status. Finally, the fact that fewer low-income immigrants take transit when they have the option to drive suggests they have needs that public transit does not meet. The reasons behind those decisions and ways to solve them should be explored in more detail through community-based transportation plans that improve specific mobility and accessibility options.
AcknowledgementsThe authors thank the Mineta Transportation Institute for funding this research. The authors also thank Cecilia Chavez for assistance translating the survey and coordinating survey data collection, and the following people for administering the survey: Sana Ahmed, Dylan Baker, Sergio Escobedo, Rigo Garcia, Norma Guzman, Mariana Herrera, Christian Hunter, Melissa Jeng, Michelle Li, Oscar Ruiz, Keith Tanner, and Tina Tran. Comments from three anonymous reviewers greatly improved this paper. The views expressed are the authors’ alone, as is the responsibility for any errors or omissions.

16 Journal of Public Transportation, Vol. 21, No. 2, 2018
Immigration, Income, and Public Transit Perceptions: Findings from an Intercept Survey
ReferencesBarajas, J. M., D. G. Chatman, and A. W. Agrawal. 2016. Exploring Bicycle and Public Transit Use by Low-Income
Latino Immigrants: A Mixed-Methods Study in the San Francisco Bay Area. MTI Report 12-57. Mineta Transportation Institute, San José State University.
Blumenberg, E. 2009. “Moving in and Moving Around: Immigrants, Travel Behavior, and Implications for Transport Policy.” Transportation Letters: The International Journal of Transportation Research 1 (2): 169–80. doi:10.3328/TL.2009.01.02.169-180.
Blumenberg, E., and A. E. Evans. 2010. “Planning for Demographic Diversity: The Case of Immigrants and Public Transit.” Journal of Public Transportation 13 (2): 23–45.
Blumenberg, E., and M. Smart. 2010. “Getting by with a Little Help from My Friends…and Family: Immigrants and Carpooling.” Transportation 37 (3): 429–46. doi:10.1007/s11116-010-9262-4.
. 2013. “Brother Can You Spare a Ride? Carpooling in Immigrant Neighbourhoods.” Urban Studies 51 (9): 1871–90. doi:10.1177/0042098013502825.
Bohte, W., K. Maat, and B. van Wee. 2009. “Measuring Attitudes in Research on Residential Self-Selection and Travel Behaviour: A Review of Theories and Empirical Research.” Transport Reviews 29 (3): 325–57.
Borjas, G. 2015. “The Slowdown in the Economic Assimilation of Immigrants: Aging and Cohort Effects Revisited Again.” Journal of Human Capital 9 (4): 483-517.
Caltrans (California Department of Transportation). 2013. 2010-2012 California Household Travel Survey. Accessed July 26, 2016. http://www.nrel.gov/transportation/secure_transportation_data.html.
Cao, X., P. L. Mokhtarian, and S. L. Handy. 2009. “Examining the Impacts of Residential Self-Selection on Travel Behaviour: A Focus on Empirical Findings.” Transport Reviews 29 (3): 359–95.
Chatman, D. G. 2014. “Explaining the ‘Immigrant Effect’ on Auto Use: The Influences of Neighborhoods and Preferences.” Transportation 41 (3): 441–61. doi:10.1007/s11116-013-9475-4.
Chatman, D. G., and N. Klein. 2009. “Immigrants and Travel Demand in the United States: Implications for Transportation Policy and Future Research.” Public Works Management & Policy 13 (4): 312–27. doi:10.1177/1087724X09334633.
. 2011. “Immigrants and Automobility in New Jersey: The Role of Spatial and Occupational Factors in Commuting to Work.” In Auto Motives: Understanding Car Use, edited by K. Lucas, E. Blumenberg, and R. Weinberger, 253–76. Bingley, UK: Emerald Group Publishing.
Clifton, K. J. 2004. “Mobility Strategies and Food Shopping for Low-Income Families: A Case Study.” Journal of Planning Education and Research 23 (4): 402–13. doi:10.1177/0739456X04264919.
Colby, S. L., and J. M. Ortman. 2015. Projections of the Size and Composition of the U.S. Population: 2014 to 2060. Current Population Reports, P25-1143. Washington, DC: U.S. Census Bureau.
FHWA (Federal Highway Administration). 2011. National Household Travel Survey. Accessed July 26, 2016. http://nhts.ornl.gov/.
Groves, R. 1989. Survey Errors and Survey Costs. Hoboken, NJ: John Wiley & Sons, Inc.

Journal of Public Transportation, Vol. 21, No. 2, 2018 17
Immigration, Income, and Public Transit Perceptions: Findings from an Intercept Survey
HHS (US Department of Health & Human Services). 2015. Prior HHS Poverty Guidelines and Federal Register References. Accessed May 24, 2016. https://aspe.hhs.gov/prior-hhs-poverty-guidelines-and-federal-register-references.
HUD (US Department of Housing and Urban Development). 2014. FY 2014 Income Limits. Accessed May 24, 2016. https://www.huduser.gov/portal/datasets/il/il14/index.html.
Kim S., G. F. Ulfarsson, and J. T. Hennessy. 2007. “Analysis of Light Rail Rider Travel Behavior: Impacts of Individual, Built Environment, and Crime Characteristics on Transit Access.” Transportation Research Part A: Policy and Practice 41 (6): 511–22.
Liu, C. Y., and G. Painter. 2012. “Travel Behavior among Latino Immigrants: The Role of Ethnic Concentration and Ethnic Employment.” Journal of Planning Education and Research 32 (1): 62–80. doi:10.1177/0739456X11422070.
Liu, R., and H. L. Schachter. 2007. “Mobility Information Needs of Immigrants with Limited English Proficiency (LEP) in New Jersey.” Journal of Immigrant & Refugee Studies 5 (2): 89–108. doi:10.1300/J500v05n02_05.
Loukaitou-Sideris, A., R. Liggett, and H. Iseki. 2002. “The Geography of Transit Crime: Documentation and Evaluation of Crime Incidence on and around the Green Line Stations in Los Angeles.” Journal of Planning Education and Research 22 (2): 133–51. doi:10.1177/0739456X02238443.
Lovejoy, K., and S. L. Handy. 2007. Transportation Experiences of Mexican Immigrants in California: Results from Focus Group Interviews. Research Report UCD-ITS-RR-07-32, Institute of Transportation Studies, University of California.
. 2008. “A Case for Measuring Individuals’ Access to Private-Vehicle Travel as a Matter of Degrees: Lessons from Focus Groups with Mexican Immigrants in California.” Transportation 35 (5): 601–12.
Migration Policy Institute. 2015. U.S. Immigration Trends. Accessed July 7, 2016. http://www.migrationpolicy.org/programs/data-hub/us-immigration-trends.
Smart, M. 2010. “US Immigrants and Bicycling: Two-Wheeled in Autopia.” Transport Policy 17 (3): 153–59.
2015. “A Nationwide Look at the Immigrant Neighborhood Effect on Travel Mode Choice.” Transportation 42 (1): 189–209. doi:10.1007/s11116-014-9543-4.
Spears, S., D. Houston, and M. G. Boarnet. 2013. “Illuminating the Unseen in Transit Use: A Framework for Examining the Effect of Attitudes and Perceptions on Travel Behavior.” Transportation Research Part A: Policy and Practice 58: 40–53.
Tal, G., and S. Handy. 2010. “Travel Behavior of Immigrants: An Analysis of the 2001 National Household Transportation Survey.” Transport Policy 17 (2): 85–93.
US Census Bureau. 2015. 2009–2013 5-Year American Community Survey. Accessed July 7, 2016. http://factfinder.census.gov/faces/nav/jsf/pages/index.xhtml.
Wofinden, D. 2003. “Non-Household Surveys.” In Transport Survey Quality and Innovation, edited by P. Stopher and P. Jones, 377–402. Oxford, UK: Elsevier.
Yu, Z., and D. Myers. 2007. “Convergence or Divergence in Los Angeles: Three Distinctive Ethnic Patterns of Immigrant Residential Assimilation.” Social Science Research 36 (1): 254–85. doi:10.1016/j.ssresearch.2006.01.001.
18 Journal of Public Transportation, Vol. 21, No. 2, 2018
Immigration, Income, and Public Transit Perceptions: Findings from an Intercept Survey
About the AuthorsJesus M. Barajas ([email protected]) is a distinguished postdoctoral research associate in the Department of Urban and Regional Planning at the University of Illinois at Urbana-Champaign. He is also affiliated with the Safe Transportation Research and Education Center at the University of California, Berkeley. He received a PhD in City and Regional Planning from UC Berkeley. Broadly speaking, his research focuses on transportation equity. He is interested in three main questions: Why and how do people travel? What accounts for the differences we see in travel behavior and safety, particularly for historically marginalized population groups? And what do those differences mean for planning and policy?
Asha Weinstein Agrawal ([email protected]) is director of the MTI National Transportation Finance Center and also a professor in the Department of Urban and Regional Planning, both at San José State University. Her research explores planning and policy tools that encourage environmentally friendly travel and improve accessibility for people struggling with poverty or other disadvantages. She has explored these issues most deeply through transportation finance policy and travel behavior research. Dr. Agrawal has a BA from Harvard University, an MURP from the London School of Economics and Political Science, and a PhD from the University of California, Berkeley.
Daniel G. Chatman ([email protected]) is an associate professor at the University of California, Berkeley, appointed in the Department of City and Regional Planning. He conducts research on travel behavior and the built environment; residential and workplace location choice; and the connections among public transportation, immigration, and the economic growth of cities. His ongoing research projects include studies addressing the economic costs and benefits of smart-growth strategies; the effects of TOD-caused displacement on auto use; and the relationship of transit investments to firm births and agglomeration economies in US cities.