Embed Size (px)
Citation preview
DI
SC
US
SI
ON
P
AP
ER
S
ER
IE
S
Forschungsinstitut zur Zukunft der ArbeitInstitute for the Study of Labor
Immigration and the Occupational Choice of Natives: A Factor Proportions Approach
IZA DP No. 5451
January 2011
Javier OrtegaGregory Verdugo

Immigration and the
Occupational Choice of Natives: A Factor Proportions Approach
Javier Ortega City University London,
CEP (LSE), CReAM, FEDEA and IZA
Gregory Verdugo Banque de France
and IZA
Discussion Paper No. 5451 January 2011
IZA
P.O. Box 7240 53072 Bonn
Germany
Phone: +49-228-3894-0 Fax: +49-228-3894-180
E-mail: [email protected]
Any opinions expressed here are those of the author(s) and not those of IZA. Research published in this series may include views on policy, but the institute itself takes no institutional policy positions. The Institute for the Study of Labor (IZA) in Bonn is a local and virtual international research center and a place of communication between science, politics and business. IZA is an independent nonprofit organization supported by Deutsche Post Foundation. The center is associated with the University of Bonn and offers a stimulating research environment through its international network, workshops and conferences, data service, project support, research visits and doctoral program. IZA engages in (i) original and internationally competitive research in all fields of labor economics, (ii) development of policy concepts, and (iii) dissemination of research results and concepts to the interested public. IZA Discussion Papers often represent preliminary work and are circulated to encourage discussion. Citation of such a paper should account for its provisional character. A revised version may be available directly from the author.
IZA Discussion Paper No. 5451 January 2011
ABSTRACT
Immigration and the Occupational Choice of Natives: A Factor Proportions Approach*
This paper evaluates the impact of immigration on the labor market outcomes of natives in France over the period 1962-1999. Combining large (up to 25%) extracts from six censuses and data from Labor Force Surveys, we exploit the variation in the immigrant share across education/experience cells and over time to identify the impact of immigration. In the Borjas (2003) specification, we find that a 10% increase in immigration increases native wages by 3%. However, as the number of immigrants and the number of natives are positively and strongly correlated across cells, the immigrant share may not be a good measure of the immigration shock. When the log of natives and the log of immigrants are used as regressors instead, the impact of immigration on natives’ wages is still positive but much smaller, and natives’ wages are negatively related to the number of natives. To understand this asymmetry and the positive impact of immigration on wages, we explore the link between immigration and the occupational distribution of natives within education/experience cells. Our results suggest that immigration leads to the reallocation of natives to better-paid occupations within education/experience cells. JEL Classification: J15, J31 Keywords: immigration, occupations Corresponding author: Gregory Verdugo Banque de France DGEI-DEMS-SAMIC 31 rue Croix-des-petits-champs 75049 Paris Cedex 01 France E-mail: [email protected]
* We thank Herbert Brücker, Denis Fougère, Núria Rodríguez-Planas, Patrick Sevestre, and seminar participants at the Banque de France, CEP (LSE), Université de Lille, IFN (Stockholm), LAGV 2010 (Marseille), EALE-SOLE 2010, and IV Inside Conference (Barcelona) for useful comments and helpful discussions. We also thank INSEE and the Centre Maurice Halbwachs (CMH), in particular Alexandre Kych, for giving us access to the data and for their help. The data used in this paper can be accessed through the CMH. This paper does not necessarily reflect the views of the Banque de France.

Introduction
Recent years have seen a renewed interest in the research on the impact of immigration on the
labor market outcomes of natives. Until the 1990s, the methodology exploited the variation in
the share of immigrants across geographical locations.1 After Borjas, Freeman and Katz (1997)
underlined some potential problems of this approach,2 a new strand of literature has proposed
to measure the impact of immigration by relating the variation over time in the number of spe-
cific groups of immigrants with the outcomes of the natives with similar characteristics.
In her study of mass-migration of Russian workers in Israel in the 1990s, Friedberg (2001)
chooses occupation as the relevant dimension and finds no evidence of a negative relation be-
tween the inflow of immigrants to certain occupations and the wage growth of natives working
in the same occupation. This is interpreted as evidence for the existence of immigrant-native
complementarity within occupations.
In Peri and Sparber (2009) immigrants and natives with little educational attainment in the
U.S. are assumed to belong to the same group if they perform the same type of production tasks
in a given state. Again, immigration does not have a large, adverse effect on the wage of less
educated natives, mainly because natives respond to immigration by specializing in language
intensive tasks —for which they have a comparative advantage and which are better remuner-
ated than manual-physical tasks.
The dimension that has attracted most attention is the education/experience dimension, as
proposed initially by Borjas (2003), which assumes that natives and immigrants within educa-
tion/experience cells are perfect substitutes, and uses the variation in the immigrant share at the
cell level over time to identify the impact of immigration. Using this approach, Borjas (2003)
finds a large negative impact of immigration on natives’wages.3 A series of papers have sug-
1See e.g. Card (1990), Altonji and Card (1991) or Hunt (1992). The consensus was that the effect of immigra-tion on natives was small, see for instance Friedberg and Hunt (1995) or Borjas (1994).
2Borjas et al. (1997) argues that this approach may understate the impact of immigration for two importantreasons. First, natives may respond to immigrant inflows by moving out to other locations, which would diffusethe impact of migration across locations but would not be captured in a spatial correlation approach. Second, im-migrants may choose the best locations, which would tend to generate a positive correlation between immigrationand labor market outcomes. For a paper treating these biases, see Pischke and Velling (1997). Recent evidence onthe response of natives to immigrations flows is relatively mixed, see Card and DiNardo (2000), Card (2001), andBorjas (2006).
3Aydemir and Borjas (2007) finds also a large negative impact for Canada, Mexico, and the U.S. However,the same approach applied to European countries (see Bonin, 2005, for Germany; Carrasco, Jimeno and Ortega,
2

gested different modifications or refinements of Borjas (2003) keeping the analysis along the
education/experience dimension. In particular, Card (2009) argues that, in the case of the U.S.,
a model with four groups of education (high-school dropouts, high-school graduates, individ-
uals with some college, and college graduates) as in Borjas (2003) or Borjas and Katz (2007)
does not fit well the data. In addition, Manacorda, Manning, and Wadsworth (2010) for the
U.K. and Ottaviano and Peri (2007, 2008) and the U.S. argue that natives and immigrants are
imperfect substitutes within education/experience cells. However, Borjas, Grogger and Hanson
(2008) argues that one cannot reject that immigrants and natives are perfect substitutes in the
U.S. case.
This paper contributes to the literature by explicitly identifying occupations as an important
source of imperfect substitutability between natives and immigrants within education/experience
cells. Indeed, we show that in France the average wage within a given education/experience
cell strongly depends on the allocation across occupations of the individuals in the cell. Then,
we provide evidence that the arrival of immigrants to a particular education/experience cell re-
sults in a reallocation of natives within the cell towards better paid occupations, which is likely
to be at the origin of the positive impact of immigration on natives’ wages identified in the
regressions where occupations are not accounted for.
We first follow Borjas (2003) to evaluate the impact of immigration in France for the pe-
riod 1962-1999.4 In contrast with other European studies, our sample size is large —25% of
the Census population for most of the censuses available in this period. In addition, our long
time span allows for a lot of variation in the proportion of immigrants over time. In the base-
line specification à la Borjas (2003), we find that a 10% increase in the immigrant share is
associated with wages higher by 3%.5 Similar results are found when the immigrant share is
2008, for Spain; and Dustmann, Fabbri and Preston, 2005 for the U.K.) has produced much smaller impacts ofimmigration. Some of these studies have been criticized by Aydemir and Borjas (2011) on the basis that theytypically use a relatively small sample to compute the share of immigrants per education/experience cell.
4To the best of our knowledge, this is the first paper applying a factor proportion approach to France. Hunt(1992) studies the impact of immigration on natives exploiting the spatial variation in the settlement of the repa-triates from Algeria in 1962.
5The impact is still positive and significant but the coefficients are smaller when a geographical dimension isadded. Ortega (2000) proposes a theoretical rationale for why immigration may increase native wages and lowernative unemployment.
3

instrumented by its lagged values at the cohort level to account for a potential endogeneity of
immigrant inflows to education/experience cells.
Next, we show that the number of immigrants and the number of natives are highly pos-
itively correlated across education/experience/time cells. As a result, even if the number of
natives enters the immigrant share in the denominator, the immigrant share is actually posi-
tively correlated to the number of natives. For this reason, the immigrant share may not be a
good measure of the immigration shock. When the log of natives and the log of immigrants
are used as regressors instead, the impact of immigration on natives’ wages is shown to be still
positive but much smaller, and natives’ wages are shown to be negatively related to the number
of natives.
To understand the positive impact of immigration on wages and the asymmetry in the ef-
fects of the number of natives and the number of immigrants, we explore the link between
immigration and the occupational distribution of natives within education/experience cells. We
consider between 30 and 300 occupations, defined using the interaction between professional
status and industry classifications at different aggregation levels. We proceed by first estimat-
ing occupational wage premia for each of the occupations using separate regression models
for each year with flexible controls for education and experience. From this, we compute the
average occupational premium for each education/experience cell.
In principle, immigrants can simultaneously affect wages within occupations and the al-
location of natives across occupations. To test whether immigration triggers a reallocation of
natives across occupations, we include the occupational premium at the education/experience
level as an explanatory variable for the wage of natives, together with the log of natives and
the log of immigrants. If immigrants influence the occupational distribution of workers, the
error term might be correlated with our occupational premium. To deal with this issue, we
instrument the current occupational premium using a shift-share model constructed using the
past occupational distributions of the cohort. We also use the past change in the occupational
distribution at the cohort level as an instrument. This last instrument is valid if the initial oc-
cupational distributions are unrelated with future fluctuations or changes in the contemporary
immigrant share over time. We find the wage differences within education/experience cells to
4
be strongly related to differences in the occupational distribution of workers across cells. When
accounting for the potential endogeneity of the occupational premium, we find a strong positive
(resp. negative) effect of the number of immigrants (resp. the number of natives) on the wage,
while the point estimates of the occupational premium are generally not significant anymore.
At the national level, natives in cells with more immigrants tend thus to work in better-paid
occupations than other natives.
However, these results may come from immigrants self-selecting to the same best-paid oc-
cupations as the natives from their same education/experience cell. For this reason, following
Peri and Sparber (2009), we construct a measure of the relative occupational premium of natives
versus immigrants within each education/experience cell. This relative occupational premium
thus indicates the distance between the respective average job quality of immigrants and natives
within education/experience cells. We find that the relative premium of natives increases with
the number of immigrants while the occupational premium of immigrants decreases with the
immigrant share. These results not only suggest that the occupational choices of natives and
immigrants are different but that they are related.
Finally, we extend the analysis by adding a geographical dimension, which enables us to use
the settlement patterns of immigrants as an alternative instrument for migration shocks across
cells. We show that the results on the relative premium and the specialization of immigrants
still hold, and that the positive (resp. negative) correlation between the occupational premium
of natives and the number of immigrants (resp. natives) also holds at the regional level.
Section 1 describes the data and the main trends of immigration into France, Section 2
presents the econometric models, and Section 3 presents the results.
1 Data
We use data from six successive French censuses from 1962 to 1999 (1962, 1968, 1975, 1982,
1990, and 1999) to compute the number of immigrants and natives with a given level of ed-
ucation and labor market experience in each year. Since the French Census does not include
information on income or wages, we rely on other surveys to construct our wage sample.6 For6We are thus following Katz and Murphy (1992) in constructing separate count and wage samples.
5

Table 1: Distribution of Educational Attainment in the French Population (percentage)1962 1968 1975 1982 1990 1999
Primary School 78.3 68.3 56.5 50.2 39.5 24.5Secondary School 13.0 20.1 26.1 28.9 35.9 40.7High School 4.9 7.5 9.5 11.2 11.2 14.7College 3.7 4.2 7.8 9.7 13.4 20.1
Notes: Tabulations include men aged between 18 and 64 years old, not enrolled in school nor in military.
1982, 1990, and 1999, the best available information on wages is given by the corresponding
French Labor Force Survey (LFS), which provides information since 1982 on monthly wages
in the month preceding the survey month. For 1962, we use the data on annual wage income
from the 1964 Enquête Formation et Qualification Professionnelles (FQP). Finally, as no infor-
mation on wages is available for 1968 and 1975, the best approximation is the 1969 and 1976
data available in the 1970 and 1977 FQPs. As we use labor force surveys to compute wages,
we do not include immigrants’ wages in the analysis, due to the small number of observations
by education/experience cell.
As common in the literature,7 we restrict our attention to males aged 18-64. Men are clas-
sified into four educational groups depending on their highest attained diploma: no education
or primary education (less than six years of education), secondary education (between 6 and 9
years), high school (11 or 12 years), and college (at least 14 years).8
Table 1 shows the evolution of the educational composition of the male French labor force
over the period. The most striking feature is that the share of individuals with only primary
education decreased from about 80% in 1962 to 24.5% in 1999, while the share of individuals
with high-school or college diploma rapidly increased.
Labor market experience is measured as the age of the individual minus the entry age into
the labor market. As the entry age into the labor market is not observed, we assume that in-
dividuals with primary, secondary, high school, and college education enter the labor market
respectively when 15, 16, 19, and 24 years old. In addition, we restrict the analysis to individ-
7See for instance Borjas (2003) or Manacorda et al. (2010)8A detailed match between French diplomas reported across censuses and these educational groups is provided
in Appendix 1. We follow here the diploma classification which serves as a reference for French labor relations.The distinction between individuals with some college (“Bac+2” and “Bac+3”) and college graduates frequentlyused in the literature is only available from the 1982 Census, so we cannot create a category “some college” forthe entire period. However, given the relatively low educational level of the French labor force at the beginning ofthe sixties, such distinction is not fundamental for the period of time under consideration.
6

uals between 1 and 40 years of labor market experience. For each education level, we group
individuals in 5-years experience groups.
Following Borjas (2003), the immigration shock experienced by natives with education i,
experience j at year t could be measured by pijt, the relative share of immigrants among all
individuals in the cell:
pijt =Mijt/(Mijt +Nijt), (1)
where Nijt and Mijt denote respectively the number of natives and the number of immigrants
in the corresponding cell. Table 2 reports pijt for the male population between 1962 and 1999
as computed from the Census data. From this table, it appears that the evolution of the share
of immigrants over time greatly varies across educational groups. For individuals with primary
school education, the share first rises and then declines. 9
Instead, the share of immigrants among individuals with secondary education rises over the
period, although not always in a monotonous fashion. Finally, for higher educational levels
(high school and college graduates), the share of immigrants generally decreases until 1982
and then rises in the 80s and the 90s, an evolution opposite to the evolution for individuals with
primary education.
Alternatively, one can simply use the log of immigrants as a measure of the immigration
shock. Table 3 shows that the general picture of the immigration shock provided by this mea-
sure is similar to that provided by the immigrant share when we consider individuals with
primary or secondary education. Instead, the number of immigrants with high-school or col-
lege education rises throughout the entire period, while the immigrant share for these groups
follows a U-shape, as the educational level of natives was rising fast already before the 1980s
(see Table 1).
Using the LFS and FQP data, we compute the average log monthly wage and convert it into
2007 euros using the CPI deflator from the French Statistical Institute (INSEE). Average log
wages per experience and education level over the period are reported in Table 4. The picture
9For this education group, the starting date for the decline is staggered over time across experience groups,with the decline for the high-experienced coming later. Intuitively, this may simply reflect a large inflow oflow-educated and low-experienced immigrants stopping in the mid 1970s and affecting in turn higher experiencegroups as they move up the experience ladder.
7

Table 2: Percent of Male Labor Force that is Foreign Born per Education/Experience cellEducation Experience 1962 1968 1975 1982 1990 1999
Primary 1-5 10.7 7.1 8.5 9.6 8.3 6.5School 6-10 12.5 14.1 14.6 10.6 12.0 11.8
11-15 12.4 20.4 23.4 15.6 14.9 13.716-20 11.2 16.9 27.5 21.1 16.1 16.521-25 11.3 13.5 21.4 25.1 19.1 16.526-30 13.4 12.1 16.0 22.8 21.7 16.631-35 11.1 12.2 12.8 16.8 24.3 19.236-40 9.9 12.3 11.8 13.0 18.7 21.6
Secondary 1-5 2.9 2.6 3.9 4.1 5.1 3.9School 6-10 2.3 3.0 3.4 3.7 4.7 5.6
11-15 2.1 3.4 4.0 3.8 5.0 6.016-20 3.2 3.2 3.9 3.8 5.1 6.421-25 4.5 3.7 3.8 3.8 5.1 6.426-30 6.1 5.7 3.5 3.6 4.9 6.231-35 3.8 6.2 4.9 3.1 4.5 6.036-40 4.3 5.6 5.9 4.0 4.3 6.0
High 1-5 3.9 2.6 3.5 3.3 4.6 3.9School 6-10 3.4 2.7 3.7 4.8 5.7 5.2
11-15 3.5 3.2 4.1 4.8 6.9 8.616-20 4.2 3.4 4.1 4.2 6.5 9.921-25 4.2 3.9 3.4 4.3 4.8 9.326-30 5.3 5.0 4.0 4.1 4.7 7.831-35 5.6 5.6 4.8 3.8 4.5 6.436-40 7.7 5.6 5.9 4.7 4.0 6.7
College 1-5 6.3 4.0 3.2 3.8 4.4 3.7Graduates 6-10 5.2 5.0 5.2 5.5 7.4 6.2
11-15 6.5 5.9 6.4 5.4 10.3 10.416-20 6.2 5.4 6.7 6.4 8.0 11.921-25 8.5 5.6 5.6 6.5 7.3 11.126-30 7.4 6.8 5.2 5.8 8.3 8.431-35 7.8 6.8 6.1 5.3 7.9 9.036-40 8.6 7.9 7.4 5.5 7.1 10.3
Notes: For each census year, the Table reports the percentage of immigrants among workers with similareducation level and labor market experience. Sources: Census of Population, 1962-1999
8

Table 3: Log Immigrants per Education/Experience cellEducation Experience 1962 1968 1975 1982 1990 1999
Primary 1-5 10.40 10.51 10.47 10.39 9.73 9.00School 6-10 11.46 11.57 11.60 11.14 10.85 10.12
11-15 11.87 11.98 12.25 11.67 11.25 10.7016-20 11.88 12.04 12.23 12.14 11.48 11.0521-25 11.89 11.98 12.17 12.18 11.82 11.1526-30 11.67 11.89 12.07 12.11 12.03 11.3131-35 11.72 11.74 11.90 12.02 11.95 11.6736-40 11.72 11.52 11.81 11.86 11.88 11.81
Secondary 1-5 8.24 9.12 9.59 9.70 9.55 9.30School 6-10 8.85 9.63 10.21 10.32 10.64 10.34
11-15 8.72 9.54 10.19 10.30 10.77 10.7716-20 8.87 9.39 9.75 10.24 10.69 11.0521-25 9.03 9.32 9.62 9.73 10.61 11.0426-30 8.68 9.47 9.38 9.52 10.35 10.9531-35 8.33 9.22 9.42 9.23 9.84 10.8436-40 8.20 8.85 9.41 9.17 9.68 10.53
High 1-5 7.47 8.06 8.55 8.63 8.70 9.15School 6-10 7.79 8.38 9.06 9.43 9.56 9.86
11-15 7.88 8.39 8.86 9.44 9.81 10.0516-20 8.08 8.36 8.66 9.13 9.77 10.1521-25 7.88 8.46 8.37 8.81 9.47 10.0726-30 7.88 8.68 8.48 8.60 9.06 9.8231-35 7.90 8.22 8.61 8.45 8.81 9.5336-40 8.03 8.26 8.32 8.57 8.55 9.19
College 1-5 7.74 7.61 8.67 8.84 9.34 9.67Graduates 6-10 8.14 8.41 9.41 9.70 10.21 10.48
11-15 8.45 8.49 9.18 9.72 10.53 10.8516-20 8.35 8.41 8.94 9.40 10.31 10.8621-25 8.09 8.42 8.68 9.07 9.97 10.7226-30 8.17 8.10 8.55 8.72 9.58 10.4331-35 8.04 8.20 8.47 8.51 9.20 10.1136-40 7.99 8.22 8.27 8.45 8.96 9.78
Notes: For each census year, the Table reports the log of immigrants with similar education level andlabor market experience. Sources: Census of Population, 1962-1999
9

for wages over time is quite simple and uniform across education/experience cells. Indeed,
with few exceptions, wages rise during the period 1962-1976 and then decrease throughout the
1976-1999 period.
2 Econometric Model
2.1 Borjas model
The initial specification (Borjas, 2003) relates the labor market outcomes of natives to the
immigrant share across education/experience groups:
yijt = θpijt + ψFE + ϕijt (2)
where yijt is a labor market outcome at period t for natives with education i and experience j,
pijt is the immigrant share, and ψFE is a set of education, time, and experience fixed effects s
with their corresponding interactions i.e. ψFE = si+ sj + st+(si× sj)+ (si× st)+ (sj × st).
A problem might arise if the immigrants with given education/experience levels are attracted
by the labor market outcomes of specific cohorts of natives, defined here as a group of workers
entering the labor market at a specific time and with a specific educational level.10 Indeed, as
(2) does not control for cohort effects, our results could be biased if the error term includes
unobserved cohort effects correlated with the immigrant share. Figure 1 represents the evolu-
tion over time of the immigrant share for each cohort as defined in Table 5.11 The variation
in the immigrant share over time is generally important for workers with primary education,
particularly in cohorts 1, 8, and 10. For the other educational groups, the variation is smaller
but non-negligible. Still, most of the differences in the immigrant shock arise (i) across ed-
ucational groups within given cohorts, or (ii) across cohorts within given educational groups.
10As recognized in the literature, cohort effects might influence labor market outcomes, as shown for instanceby Card and Lemieux (2001) who argues that cross cohort differences in size and education can explain recenttrends in wage inequality in the U.S. Alternative explanations for cohorts effects have been proposed by Beaudryand DiNardo (1991) and Gibbons and Waldman (2004). As first emphasized by Deaton (1985), a cohort, definedas a group with fixed membership, can be tracked over time using repeated cross-section.
11Given that censuses in France have not been conducted in regular intervals of 5 or 10 years, an alternativewould be to change over time the age brackets definition of the experience intervals.
10

Table 4: Log Monthly Wage of Full Time Male Native Workers Per Education/ExperienceEducation Years of Experience 1962 1969 1976 1982 1990 1999
Primary 1-5 6.132 6.593 6.351 6.825 6.586 6.445Education 6-10 6.480 6.875 7.061 6.981 6.923 6.927
11-15 6.627 7.009 7.207 7.089 7.021 7.02616-20 6.683 7.027 7.299 7.179 7.109 7.11221-25 6.668 7.113 7.296 7.237 7.185 7.15426-30 6.653 7.109 7.303 7.248 7.256 7.19331-35 6.646 7.131 7.285 7.232 7.264 7.2836-40 6.626 7.115 7.242 7.238 7.234 7.348
Secondary 1-5 6.417 6.855 6.605 6.917 6.842 6.667Education 6-10 6.683 7.084 7.219 7.093 7.023 7.010
11-15 6.879 7.234 7.388 7.246 7.165 7.13316-20 6.984 7.354 7.521 7.374 7.256 7.23621-25 7.057 7.438 7.559 7.444 7.354 7.31126-30 7.082 7.537 7.566 7.489 7.443 7.37131-35 7.071 7.459 7.566 7.477 7.463 7.43836-40 7.223 7.575 7.666 7.520 7.455 7.490
High 1-5 6.739 7.184 7.033 7.100 7.089 6.951School 6-10 7.074 7.432 7.521 7.350 7.233 7.118
11-15 7.473 7.637 7.784 7.545 7.421 7.35816-20 7.600 7.714 7.800 7.698 7.596 7.53921-25 7.662 7.874 7.965 7.828 7.697 7.63026-30 7.458 7.811 7.961 7.857 7.765 7.64031-35 7.539 7.854 8.047 7.813 7.784 7.77536-40 7.384 7.836 7.99 7.915 7.808 7.885
College 1-5 7.176 7.764 7.506 7.423 7.393 7.304Graduates 6-10 7.798 8.074 7.960 7.700 7.650 7.510
11-15 8.099 8.244 8.173 7.941 7.802 7.75316-20 7.911 8.368 8.223 8.149 7.945 7.93421-25 7.997 8.486 8.499 8.283 8.044 7.98226-30 8.317 8.485 8.426 8.314 8.144 8.10731-35 8.052 8.492 8.529 8.271 8.164 8.19036-40 8.274 8.609 8.679 8.220 8.181 8.288
Notes: The table provides the average log monthly wage of native men, working full time, per groupof education and experience. See text for details. The population excludes self-employed and civilservants. Wages are deflated in 2007 Euros using the CPI computed by the INSEE. Sources: FQP 1964,1970, 1977 and LFS 1982, 1990, 1999.
11

0.1
.2.3
0.1
.2.3
0.0
5.1.
15
0.0
5.1
.15
.05
.1.1
5
0.2
.05.
1.15
.2
.05.
1.15
.2
0 10 20 30 40 0 10 20 30 40 0 10 20 30 40
0 10 20 30 40 0 10 20 30 40 0 10 20 30 40
0 10 20 30 40 0 10 20 30 40
Cohort 1 Cohort 2 Cohort 3
Cohort 4 Cohort 5 Cohort 8
Cohort 9 Cohort 10
Primary SecondaryHigh−School College
Imm
igra
nt S
hare
Labor Market Experience
Figure 1: Fluctuations of the immigrant share by educational group in specific cohortsSources and notes: Each panel represents the evolution over time of the immigrant share for given cohorts ofworkers for each educational level. The definition of the cohorts is given in Table 5. The sample includes menwith experience between 1-40. Data from censuses 1962-1999.
Finally, despite the large number of fixed effects in the OLS regressions, estimates of
θ are biased if the immigrant share depends on the particular outcomes of a cell. Assuming
there is no autocorrelated cohort effect in the error term, a plausible instrument for pijt is the
immigrant share of the same cohort of workers in the preceding census pi,(j,t)−1 , i.e. i-level
educated workers with j − k to j − k + 5 years of experience in census year t − k.12 Indeed,
given that most immigrants stay in the host country independently of changes in labor mar-
ket conditions,13 pi,(j,t)−1 is likely to be correlated with the contemporary immigrant share pijt
and uncorrelated to contemporary outcomes in the cell conditional on the inclusion of other
covariates.
2.2 Log of natives and log of immigrants
Clearly, if the number of natives within given education/experience cells is stable over time,
changes in the immigrant share will essentially capture variations in the number of migrants
12For instance, the immigrant share in 1968 for primary education workers with 20-25 years of experience isinstrumented by the immigrant share in 1962 for primary education workers with 15-20 years of experience
13For example, Schor (1996) shows that subsidies to the return of immigrants to their country of origin duringeconomic downturns were never successful in the French case.
12

Table 5: Definition of CohortsExperience groups in the indicated census
Cohort Number 1962 1968 1975 1982 1990 19991 1-5 6-10 16-20 21-25 30-35 36-402 6-10 11-15 21-25 26-30 36-403 11-15 16-20 26-30 31-354 16-20 21-25 31-35 36-405 21-25 26-30 36-406 26-30 31-357 31-35 36-408 1-5 6-10 16-20 21-25 31-359 1-5 6-10 16-20
10 1-5 11-15 16-2011 1-5 11-15
over time in these cells. However, if the number of natives is not stable, using the immigrant
share constrains the effect of an increase in the number of immigrants and a decrease in the
number of natives to be the same. Given that France experienced a large increase in general
high-school graduation rates in the period under consideration (see Table 1),14 a specification
where both the number of natives and the number of immigrants are included as regressors may
be preferable. In addition, if immigrants are not perfect substitutes with natives, immigrants
might still have an impact on the outcomes of natives even if their share within the cell is fairly
constant over time. For these reasons, as an alternative, we estimate a model including both the
log of number of natives and the log of the number of mmigrants as regressors:15
yijt = θM logMijt + θN logNijt + ψFE + ϕijt. (3)
The previous model is very close to the one proposed by Borjas (2003, p. 1361, eq. 14)
to estimate the elasticity of substitution between experience groups except that it allows for a
separate effect of the log of natives and the log of immigrants on the outcomes of the cell.
14Instead, in the U.S. the educational attainment of the population remained fairly constant over this period, seeGoldin and Katz (2008).
15This alternative is not used by Borjas (2003) because in his data 15.3% of the education/experience cells bystate of residence have no immigrants. Instead, with our very large sample extracts, only 2.5% of our educa-tion/experience cells at the regional level have no immigrants.
13

2.3 Including occupations
Models (2) and (3) directly estimate the relationship between immigration and wages within
education/experience cells. However, immigrants may simultaneously affect wages within oc-
cupations and the allocation of workers across occupations. Formally, if immigrants have an
impact on the occupational distribution of natives, then the changes in the wage of workers in a
particular (i, j, t) cell following the presence ofMijt immigrants in that cell can be decomposed
into the effect of immigration on wages and the effect of immigration on occupations k:
∂ logwijt
∂Mijt
=∑k
∂skijt∂Mijt
logwkijt +
∑k
skijt∂ logwk
ijt
∂Mijt
(4)
where logwkijt is the average log wage in cell (i, j, t, k) and skijt is the share of workers from
cell (i, j, t) working in occupation k. In particular, if natives move to better paid occupations
in response to immigrants flows, it is thus theoretically possible that immigration increases av-
erage wages within cells (i, j, t) even if it decreases wages within some or all occupations.
Recently, some papers have highlighted a link between immigrant flows and natives’ oc-
cupations. In particular, Peri and Sparber (2009) provides evidence across US states that low-
skilled natives respond to immigration by specializing in language intensive tasks for which
they have a comparative advantage and which are better remunerated than manual-physical
tasks, while Card and Lewis (2007) find that low skill immigrant inflows change the skill in-
tensity within industries without affecting relative wages across US states. Here, we try to
disentangle the effect of immigration on wages and occupations by directly estimating an oc-
cupational premium, following the well established "industry premium" literature initiated by
Krueger and Summers (1987, 1988).16
Formally, we decompose average wages within occupations k in a cell i, j by an invariant
across occupations part and an invariant across cells part, i.e. logwkijt = aijt + logwk
t + εijtk.
The first term aijt corresponds to the cohort-specific component of wages, which might de-
pends on the supply of education and experience across cohorts (Card and Lemieux, 2001) and
16In contrast with the tasks-content index in Peri and Sparber (2009), our estimated occupational premium isyear-specific and thus can vary over time, which is a nice feature if immigration alters the educational compositionof workers within industries as emphasized by Card and Lewis (2007).
14

is constant across occupations by assumption. The second term logwkt is the wage premium
for workers in occupation k at time t invariant across education/experience cells, and εijtk is an
error term assumed to be i.i.d. with a zero average. Adding up across occupations, the average
log wages within education/experience cells can be rewritten as:
logwijt = aijt +∑k
skijt logwkt + uijt (5)
where uijt is an error term.
To estimate logwkt , we regress individual wage data from labor force surveys for each year
on education and experience fixed effects and interactions which absorb the effect of differ-
ences in workers characteristics across occupations. Then, the occupational premia are com-
puted taking blue collar agricultural workers as the reference occupation. However, the relative
wages may vary over time, which would affect the level of occupational premia across years.
Thus, we standardize average occupational premia within cells with respect to the average pre-
mium in the workforce each year. In other words, denoting by Occupt =∑
k,i,j skijt logw
kt
the average occupational premium in year t for the entire workforce, we compute for each cell
Occupijt =∑
k skijt logw
kt − Occupt i.e. the average occupational premium within the cell
normalized with respect to the average year t premium.17
An occupation is here defined as a professional status (white collar worker, technician, or
blue-collar worker) within a particular industry at various levels of aggregation (from 10 to 100
industries), implying that we have between 30 and 300 occupations.18 Interacting professional
status with industry allows us to identify the impact of immigration on natives occupations both
within and across industries after an immigration shock.
Figure 2 presents the average wage within education/experience cell against the occupa-
tional premium computed using 300 occupations. Both variables are strongly and positively
17Alternatively, note that our occupational premium can be interpreted as the average rent of workers within aneducation/experience cell, as workers in high wages industries are likely to earn substantial rents (see Krueger andSummers, 1988, and Katz and Summers, 1989).
18Professional status corresponds to the catégories socio-professionnelles (cadre, technicien, and ouvrier) es-tablished by INSEE. Industries are defined using the NAP industry classification. As industry codes are notreported at the four digit level in the 1962 Census, the analysis only includes data from the 1968 to 1999 censuses.The industry classification system used across censuses has been harmonized to keep the definition of occupationsunaffected by changes in classification systems over time in the data. Appendix 1 provides details on crosswalktables for industry classifications.
15

Figure 2: Average Log Wages and Occupational PremiumNotes: The figure plots the average log wage of workers in education/experience cells against the estimated occu-pational premium. See text for details. Sources: FQP, LFS, and Census data 1962-1999.
correlated, with a 0.93 correlation coefficient over the whole sample,19 which suggests that
the variation in average wages across education/experience cells is strongly related to differ-
ences in the occupational distribution of the individuals within the cells.20 After including the
occupational premium Occupijt, our model becomes:
logwijt = θ1 logNijt + θ2 logMijt + γOccupijt + ψFE + ϕijt. (6)
The occupational premium will absorb the differences in wages across cells coming from dif-
ferences in the occupational distribution of workers across occupations. Then, we can also
test whether immigrants influence the average "quality" of natives’ occupations within educa-
tion/experience cells, i.e. whether Occupijt is itself a function of logMijt. To test that hypoth-
19The correlation is also high for each census year taken separately.20Our assumption of an invariant across-groups wage premium for occupations is consistent with French data,
as it is for U.S. data (see Krueger and Summers, 1987, 1988). Indeed, the occupational premia estimated separatelyfor given education/experience levels happen to be highly correlated. For example, the correlation between theoccupational premia for individuals with 1-20 years of experience and the premia for workers with 20-40 years ofexperience is 0.96 (resp. 0.97) when we consider 63 (resp. 30) occupations. Similarly, the correlation coefficientbetween estimates using only either low educated (primary and secondary) workers or highly educated (high-school and college) workers is 0.88 with 63 occupations (0.91 with 30). These correlations remain strong forindustry classifications at different levels of aggregation, which confirms that occupational premia are relativelyunrelated to individual characteristics.
16
esis, we estimate:
Occupijt = β1 logNijt + β2 logMijt + ψFE + uijt. (7)
Finally, we estimate models to determine whether immigrants and natives within given educa-
tion/experience cells specialize in the same occupations. Following Peri and Sparber (2009),
we look at the relation between the log of natives and immigrants and the relative occupational
distribution of immigrants versus natives. We first compute the occupational premium of immi-
grants across cells Occupimmigijt =
∑k s
k,immigijt logwk
t − Occupt where sk,immigijt is the share of
immigrants in cell (i, j, t) working in industry k. The relative occupational differential between
natives and immigrants within cells is then simply Relatijt = Occupijt−Occupimmigijt .21 If im-
migrants and natives specialize in similar occupations within education/experience cells, one
should not expect a different impact of the number of natives and the number of immigrants on
the relative occupational premium of natives. This hypothesis can be tested by estimating the
following specification:
Relatijt = δ1 logNijt + δ2 logMijt + FE + ϕijt. (8)
Similarly, we estimate the relationship between the number of natives and immigrants and the
average occupational premium of immigrants across cells using the following regression:
Occupimmigijt = η1 logNijt + η2 logMijt + FE + υijt. (9)
If large immigrant shares come from the immigrants being attracted by better-paid jobs avail-
able in the cell for both immigrants and natives, we expect to observe a positive correlation
between the occupational premium of immigrants and the log of immigrants in the cell.
As we do not need wages to compute the relative occupational premium, we can also study
how this premium depends on the number of natives and immigrants when a geographical di-
mension is added to the analysis. In addition to providing a robustness check, this enables us
21We use the difference instead of the ratio because Occup represents differences in log wages, which impliesthat Relatijt =
∑k
(skijt − s
k,immigijt
)logwk
t .
17
to use the proportion of co-nationals in the region as an instrument, as e.g. in Altonji and Card
(1991) and Cortes (2008). Specifically, the instrument is given for each year t and region C by
∑C
(ImmigrantsCR,Ref
ImmigrantsC,Ref
)∗ ImmigrantsC,ijt, (10)
where ImmigrantsCR,Ref
ImmigrantsC,Refis the proportion in year Ref of country-C immigrants living in region
R, while ImmigrantsC,ijt is the total number of immigrants from country C with education
i and experience j in France in year t. Given our large sample size, we distinguish groups of
immigrants by using the maximum number of nationalities available, namely the 54 different
countries of birth which are always reported separately across censuses. 22 Using the variation
in the occupational distribution of natives and immigrants across regions, we then compute for
each education/experience cell the occupational premium of immigrants and natives at the re-
gional level, together with the relative occupational premium.23
There are several potential econometric problems to the estimations of the model (6). Even
if one assumes the number of natives (N ) and the number of immigrants (M ) to be exoge-
nous in (6) and (7), ϕ and u might be correlated or equivalently, the occupational premium
Occup might be correlated with ϕ, leading the OLS estimates of (6) to be inconsistent. We use
2SLS with various instruments for occupations to deal with this issue. We first construct two
instruments using a shift-share model following Bartik (1991). We use the national trends in oc-
cupations across education/experience cells to predict the change in the occupational premium
over time within cells. By construction, this evolution is common to all groups and thus un-
related with the variations over time of the immigrant share across education/experience cells.
More specifically, denoting by Nkt the number of workers in occupation k at year t, we predict
the number of workers in occupation k within cell (i, j, t) by Nkijt = Nk
i,j−l,t−l(1 + gt,k) where
gt,k =Nk
t
Nkt−l− 1 is the growth rate of employment in sector k between census t and year t − l
22We use two versions of this instrument. The first version uses 1968 as the reference year for all censuses,while our second version uses the lagged census year as a reference year. The two versions are likely to be quitedifferent given that the stock of immigrants in 1968 is concentrated in regions with large cities and comes mainlyfrom Europe and the Maghreb, while post-1970s immigration comes also from Asia and Sub-Saharan Africa andis more spread across regions. Therefore, in some sense, the first version of the instrument uses traditional longrun immigrant flows while the second instrument is related with more recent immigrant waves.
23This implicitly assumes a constant occupational premium across regions. We have found no evidence thatoccupational premia would vary across regions, as in the literature on industry premiums mentioned above.
18

for the whole labor force. Then, we use the predicted number of workers across occupations
to compute a counterfactual occupational premium of the cell assuming employment in each
occupation follows the national trend, i.e., ˆOccupijt =∑
k skijt logw
kt where skijt =
Nkijt
Nijtand
Nijt =∑
k Nkijt. We also construct a second counterfactual shift-share premium using only
industrial affiliations of workers within education/experience cells. This variable measures the
pure industry wage differential, i.e. does not take into account that workers within a given in-
dustry will have different wages depending on their professional status.
Finally, we also use an instrument which exploits cohort effects across occupations. Indeed,
existing evidence shows that the distribution of workers across industries depends on labor de-
mand across industries at the time of entry of the cohort in the labor force (Autor and Dorn,
2009) and it persists over time since industry specific human capital makes it costly for cohort
members to change industry (Neal, 1995). Then, the successive occupational distributions of
cohorts are correlated over time, and this does not depend on variations in immigrant flows over
time but rather on labor market opportunities across industries at the time of entry in the labor
force. So a simple instrument for Occupijt is to use the lag of the occupational premium across
cohorts Occupi,(j,t)−1 , with cohorts still being defined by Table 5.
3 Results
This section presents the main empirical findings of the paper. Section 3.1 presents the esti-
mates of the Borjas (2003) specification, section 3.2 uses a specification including the log of
natives and the log of immigrants, and Section 3.3 presents the estimates when occupations are
explicitly taken account for in the analysis.
3.1 Borjas model
Table 6 presents estimates of the Borjas (2003) model in (2). The upper panel presents esti-
mates using OLS or WLS. In the baseline case (row 1), and in contrast with Borjas (2003),
the immigrant share is found to be positively and significantly correlated with the average log
monthly wage (column 1), the employment to population ratio (column 2) and the employment
19

Table 6: Impact of Immigrant Share per Education/Experience CellsA. WLS/OLS
Specification Av. Log Employment Employment Cragg-Donald NMonthly wage Population Labor Force Wald F-stat
1. Basic Estimates 0.403** 0.380*** 0.312*** 192(0.186) (0.112) (0.071)
2. Unweighted Regression 0.277 0.492** 0.364*** 192(0.286) (0.210) (0.117)
3. Experience 0.278 0.194*** 0.213*** 96between 11 and 30 (0.210) (0.042) (0.042)4. Only Primary 0.480** 0.294*** 0.288*** 96and Secondary Education (0.205) (0.094) (0.085)5. Estimates without 0.301 0.361*** 0.261***1-10 years exp. (0.189) (0.112) (0.055) 144
B. 2SLS6. Basic Estimates 0.338*** 0.364*** 0.275*** 180.8 116
(0.128) (0.063) (0.034)7. Without weights 0.272** 0.542*** 0.312*** 179.4 116
(0.139) (0.152) (0.048)8. Experience 0.407** 0.267*** 0.277*** 25.9 64between 11 and 30 (0.197) (0.061) (0.070)9. Only Primary 0.432*** 0.286*** 0.252*** 64.4 58and Secondary Education (0.139) (0.036) (0.030)10. pi,(j,t)−2
as IV 0.393*** 0.267*** 0.154*** 80.8 72(0.153) (0.071) (0.028)
11. pi,(j,t)−3as IV 0.259* 0.352*** 0.162*** 30.9 40
(0.136) (0.105) (0.012)
Notes: The table reports the coefficient of the immigrant share from regressions with the indicateddependent variables using observations from the period 1962-1999. For rows 6 to 11, the model isestimated using 2SLS taking pi,(j,t)−1
as an instrument. The fourth column reports the Cragg-DonaldStatistic for weak instrument. The last column reports the number of observations. The critical valueat 10% is 16.38 (Stock and Yogo, 2005). Robust heteroscedastic standard errors reported in parenthesisare adjusted for clustering within education/experience cells. Controls (fixed effects) are added foreducation, experience, year, and for interactions between education and experience, year and experience,education and year. When the dependent variable is the employment to population or the employmentto labor force rate, weights are the number of natives per cell divided by the total number of nativesin the census year. When the dependent variable is the average log wages, weights are the numberof observations per cell used to compute the average wage with the LFS or FQP divided by the totalnumber of observations used to compute average wages per year. *, ** and *** denotes significant atrespectively 10%, 5% and 1% level. Sources: Census of Population 1962-1999, FQP 1964, 1970, 1977and LFS 1982, 1990, 1999.
20
to labor force ratio (column 3). Quantitatively, the estimated impact of is quite large: a 10%
increase in the immigration share is estimated to raise native’s wages by 3.4%, the employ-
ment/population ratio by 3.2%, and the employment/labor force ratio by 2.7%.24
A first concern for the validity of these initial estimates is that changes in participation
rates and wages across demographic groups over this period might be spuriously correlated
with variations of the immigrant share. Although France and the U.S. experienced similar
employment-population ratios during the 60s, the employment population ratio in France fell
dramatically after that period both for both young workers (under 25) and old workers (above
55). Even if our model controls for interactions between experience and year which should
absorb the effect of this change across education groups over time, our results may potentially
reflect these changes if immigration was lower for some cells within education groups. As a
check of the robustness of our findings, Row 3 eliminates from the sample the cells of less than
11 years of experience and more than 30 years of experience. In that case, the estimated effects
of immigration on log wages and employment rates remain positive, although non significant
for wages.
A second issue is that the impact of immigration could differ across educational groups in
which case our estimates may reflect the simultaneous increase in immigration and wages for
the most educated groups. However, the estimates in Row 4 for low educational levels (primary
or secondary education only) still display a positive and significant correlation between immi-
gration and wages, and a positive (although of lower magnitude) correlation with employment
rates.25
Row 5 shows that the coefficients remain similar when we exclude from the analysis the
individuals with less than 10 years of experience, for which the prevalence of the minimum
wage is very important, especially after 1975.26 The minimum wage is thus unlikely to be the
24When the endogenous variable yijt represents the wage, the parameter θ can be interpreted as an elasticitygiving the percentage change in wages associated with a percentage change in labor supply. As in Borjas (2003),we define the "wage elasticity" as ∂ logw/∂m = θ/(1 +m)2 Over the period, the mean value of the relativenumber of immigrants (m) is about 9%. The wage elasticity evaluated at the mean value can therefore be obtainedby multiplying θ by 0.85.
25The estimated impact of immigration for the individuals with more than secondary education only (not re-ported) is negative but never significantly different from zero
26The proportion of natives paid at the minimum wage plus 5% peaks at 87.3% in 1999 for the individuals withprimary education and experience level 1-5, increases rapidly over time, and is generally non negligible among theleast educated for all experience levels and the least experienced for the all education levels. Instead, the share is
21

main factor behind the positive correlation between immigration and natives’ labor market out-
comes.
To account for the potential endogeneity of the immigrant share, the lower panel of the
table reports 2SLS estimates where the immigrant share is instrumented by the past immigrant
share at the cohort level. The last column presents the Cragg-Donald test statistics. For all
regressions, the instrument proves to be strong compared to the critical 10% value of 16.38
reported in Stock and Yogo (2005). This also suggests, as discussed before, that the immigrant
share is strongly correlated over time at the cohort level. Table 6 shows that the IV estimates
are not very different from the OLS estimates, implying that the potential endogeneity of the
immigrant share does not seem to affect the estimates to a large extent.
In case the distance between two consecutive censuses would not be sufficient to purge the
potential endogeneity of the immigrant share, which may be particularly the case if the error
terms are serially correlated at the cohort level, rows 10 and 11 use as instruments the immigrant
share in increasingly distant censuses, with the estimates remaining qualitatively unchanged.
Appendix 2 shows that the positive correlation between the immigration share and the em-
ployment outcomes of natives still holds when we define education/experience cells at the dé-
partement (county) level. As in Borjas (2003), however, the value of the estimated coefficients
is attenuated.
3.2 Log of Natives and log of Immigrants
Table 7 reports the estimates from regressions where the log of natives and the log of immi-
grants are included as regressors. Across specifications, the coefficient of the log of natives is
most of the times negative, while the coefficient of the log of immigrants is generally positive,
which could be interpreted as evidence of imperfect substitutability between immigrants and
natives within education/experience cells. Quantitatively, the results show that a 10% increase
in the number of immigrants increases wages by between 0.2 and 0.4 % which is much smaller
systematically below 5% for individuals with at least high school education and more than ten years of experience.A table presenting the share of workers paid at the minimum wage across education/experience cells is availableupon request.
22

Table 7: Impact of the Log of Immigrants and the Log of Natives per Education/ExperienceCells
Dependent variableAv. Log Log Employment Log Employment Cragg-Donald N
Specification Monthly wage Population Labor Force Wald F-StatA. WLS/OLS
1. Basic EstimatesLog natives -0.071* 0.014 -0.010 192
(0.042) (0.028) (0.016)Log immigrants 0.032 0.078*** 0.050***
(0.024) (0.021) (0.009)2. Unweighted Regression
Log natives -0.024 0.043 0.008 192(0.052) (0.031) (0.015)
Log immigrants 0.012 0.093*** 0.054***(0.035) (0.032) (0.015)
B. 2SLS4. Basic Estimates
Log natives -0.092*** 0.042 -0.021** 93.7 116(0.024) (0.034) (0.011) [16.4]
Log immigrants 0.031* 0.087*** 0.043***(0.017) (0.019) (0.006)
5. Unweighted RegressionLog natives -0.091*** 0.061* -0.016** 103.6 116
(0.032) (0.034) (0.007) [16.4]Log immigrants 0.035* 0.110*** 0.049***
(0.021) (0.022) (0.006)
Notes: The table reports the coefficients of the log of natives and immigrants from regressions with theindicated dependent variables using observations from the period 1962-1999. Controls (fixed effects)are added for education, experience, year, and for interactions between education and experience, yearand experience, education and year. Robust heteroscedastic standard errors reported in parenthesis areadjusted for clustering within education/experience cells. The fourth column reports the Cragg-DonaldStatistic for weak instrument. The critical value at 10% is 16.38 (Stock and Yogo, 2005). The lastcolumn indicates the number of observations. When the dependent variable is the log employment topopulation or the log employment to labor force rate, weights are the number of natives per cell dividedby the total number of natives in the census year. When the dependent variable is the average log wage,weights are the number of observations per cell used to compute the average wage with the LFS or FQPdivided by the total number of observations used to compute average wages per year. *, ** and ***denotes significant at respectively 10%, 5% and 1% level. Sources: Census of Population 1962-1999,FQP 1964, 1970, 1977 and LFS 1982, 1990, 1999.
23
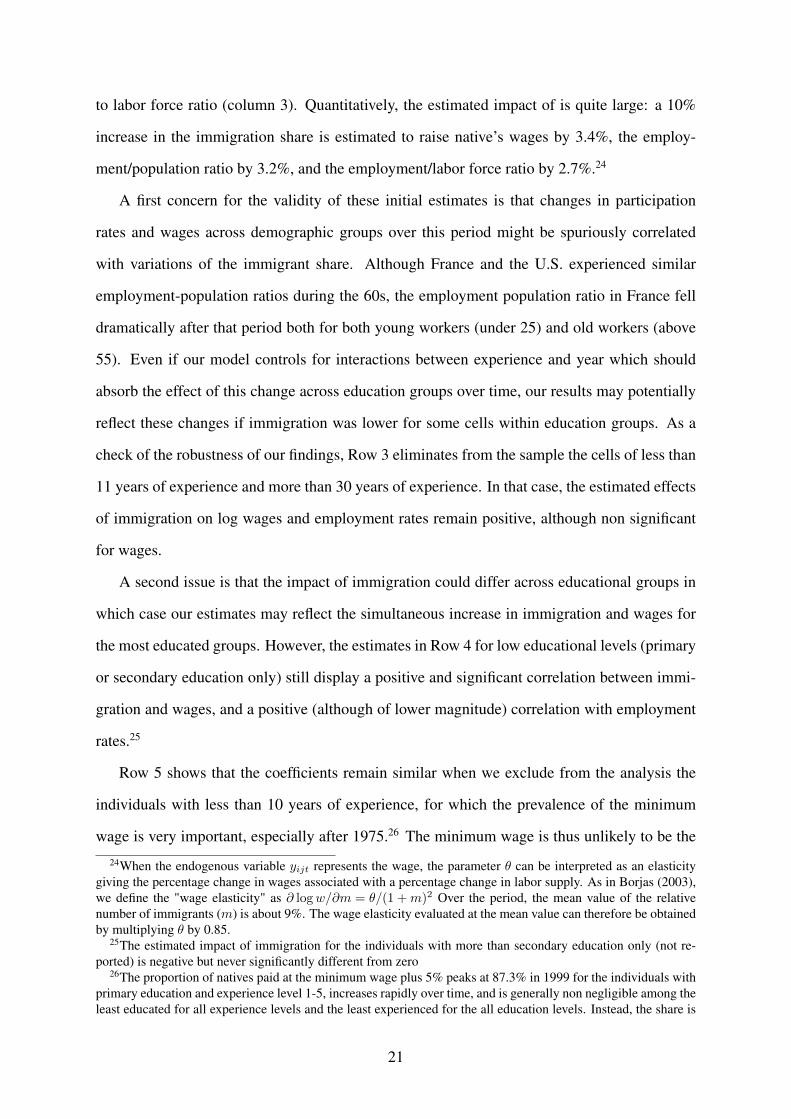
Table 8: Correlation among the number of natives, the number of immigrants, and the immi-grant share across education/experience/year cells
Correlation All workers College High-School Secondary Primary] Natives - ] Immigrants 0.77 0.886 0.83 0.93 0.645
] Immigrants -Immigrant Share 0.88 0.64 0.74 0.58 0.71] Natives -Immigrant Share 0.458 0.29 0.3 0.3 -0.03
Source: Census of Population, 1962-1999.
than the 3 % impact found in Table 6 when immigration is measured by the immigrant share.
This dramatic reduction in the size of the effect is likely to be related to the variation in the
immigrant share being smaller than the variation in the log of immigrants. Indeed, Table 8
shows that the number of immigrants and the number of natives are highly positively correlated
across education/experience/time cells. As a result, the immigrant share is actually positively
correlated to the number of natives (except for the individuals with primary education) despite
the fact that the number of natives enters the immigrant share in the denominator. The strong
positive correlation between the number of immigrants and the number of natives also explains
why the coefficient of variation of the immigrant share across education/experience/time cells
(0.66) is smaller than the coefficients of variation of the number of natives and the number of
immigrants (respectively 0.82 and 1.33).
To understand the positive impact of immigration on wages and the asymmetry in the ef-
fects of the number of natives and the number of immigrants, the next section studies whether
occupations play a role in explaining differences in outcomes across cells (3.3.1) and how the
occupational premia of natives and immigrants depend on the size of these two groups (3.3.2).
3.3 Occupations
3.3.1 Natives wages, immigration, and occupations
In principle, immigrants could have a positive effect on the wages of natives by displacing them
to better paid occupations. To test this, Table 9 reports the estimates of model (6), i.e.27
logwijt = θ1 logNijt + θ2 logMijt + γOccupijt + ψFE + ϕijt
27We show here only results for the case of 100 industries interacted with three professional status. Resultsusing 41, 21 and 10 industries are broadly similar and available upon request.
24

Table 9: Immigration and Occupation
Dependent Variable:Average log Monthly Wage
Method of Estimation WLS 2SLSLog natives -0.038 -0.023 -0.094** -0.062**
(0.036) (0.043) (0.045) (0.024)Log immigrants 0.028 0.029** 0.079** 0.026**
(0.020) (0.014) (0.023) (0.013)Occupational premium 0.742* 0.848** -0.939 0.335Natives (0.410) (0.334) (0.640) (0.294)Test of over-identifying NA 0.01 3.05 6.08restrictions (p-value) (0.91) (0.21) (0.02)Cragg-Donald 49.3 15.56 31.7Number of observations 128 132 88 116Excluded InstrumentsLagged Occup. Premium N Y NPredicted Occupation Premium Y Y YPredicted Industry Premium Y Y Y
Notes: The table reports the coefficients from regressions using observations from the period 1968-1999.Controls (fixed effects) are added for education, experience, year, and for interactions between educa-tion and experience, year and experience, education and year. Robust heteroscedastic standard errorsreported in parenthesis are adjusted for clustering within education/experience cells. The regressionsare weighted using the number of immigrants in the cell. The regressions in columns 2 to 4 use thepredicted occupational and industry premium as excluded instrument. The regression in column 3 alsouses the lagged and predicted occupational premium as excluded instrument. The regression in column4 uses the lagged log immigrant at the cohort level as an additional excluded instrument for the log ofimmigrants. *, ** and *** denotes significant at respectively 10%, 5% and 1% level. Sources: Censusof Population 1968-1999, FQP 1964, 1970, 1977 and LFS 1982, 1990, 1999.
The WLS estimates in column 1 report a positive correlation between the occupational pre-
mium of natives and their wages, as suggested by Figure 2, while the log of immigrants is still
positively (but not always significantly) correlated with wages. OLS regressions results suggest
that most of the correlation between average wages and outcomes are related with differences
in distribution across occupations. However, these estimates are inconsistent if immigrants in-
fluence the occupational choice of natives and the unobserved factors influencing occupational
premia and wages within education/experience cells are correlated. To deal with this issue, col-
umn 2 reports 2SLS estimates using two shift-share counterfactual premia, column 3 includes
the lagged occupational premium as an additional instrument, and column 4 instruments the
log of immigrants in the cell with the lags of this variable at the cohort level.
Interestingly, after instrumentation, the coefficient of the log of immigrants becomes sig-
25
nificant. Compared with OLS estimates, 2SLS results indicate a larger and significant effect of
both the log of immigrant and of the log of natives or the log of the total number of workers in
the cell. The point estimates of the occupational premium are much lower and not significant.
Quantitatively, 2SLS regressions predict that an increase of 10% in the number of immigrants
in the cell increases natives average wages by between 0.3 to 0.8%. As a further robustness
check for our result, column 4 reports estimates where the log of immigrants in the cell is in-
strumented using the lags of this variable at the cohort level, as in the previous section. The
results from column 4 lead to a point estimate that is similar to the corresponding estimates in
column 2.
Overall, these results suggest that naive estimates of the impact of immigration condition-
ing for occupations may be biased because immigrants influence the occupational distribution
of natives. Once this source of bias has been taken into account, we find a positive impact of the
log of immigrants on the wages of natives. In the next section, we explicitly study the relation
between immigration and the occupational premium of natives and immigrants.
3.3.2 Occupational Premia and Immigration
National Level Table 10 reports the estimates of the regressions explaining the occupational
premium of natives (Panel A), immigrants (Panel B) and the relative occupational premium of
natives (Panel C) as a function of the log of natives and the log of immigrants (i.e. respectively
models 10 ,7, and 8). Consistent with the idea that natives compete mainly with natives, the oc-
cupational premium of natives is found to be negatively correlated with the log of natives and
positively correlated with the log of immigrants. In addition, the estimated elasticities show
that the occupational premium of natives is much more sensitive to the number of natives than
to the number of immigrants.28
The positive correlation between the occupational premium of natives and the log of immi-
grants in Panel A could result from the immigrants self-selecting into the occupations where
natives are better paid. This could be clearly the case if the best paid occupations for im-
migrants are the same as the best paid occupations for natives. However, panel B reports a
28We estimated the main model in Table 10 using alternative definitions of occupations and obtained similarresults
26

Table 10: Occupational Premia
Dependent Variable:A. Occupational Premium of Natives
Log natives -0.057*** -0.053***(0.010) (0.007)
Log immigrants 0.012** 0.011**(0.004) (0.004)
B. Occupational Premium of ImmigrantsLog natives -0.015 -0.029***
(0.010) (0.007)Log immigrants -0.021*** -0.027***
(0.005) (0.003)C. Relative Occupational Premium
Log natives -0.050*** -0.024***(0.008) (0.007)
Log immigrants 0.026*** 0.037***(0.006) (0.003)
Immigrant Share No YesInstrumentedN 160 116
Notes: The three panels of the table report the coefficient of regressions relating the occupational pre-mium of natives (Panel A), immigrants (Panel B), and the relative occupational premium of natives(Panel C) with the log of immigrants and log of natives across education/experience cells. Each modelincludes fixed effects and two-ways interactions between year, experience, and education. Occupa-tional premia are calculated using the interaction between 3 professional status and 100 industries.All regressions are weighted using the number of immigrants in an education/experience cell. Ro-bust heteroscedastic standard errors reported in parenthesis are adjusted for clustering within educa-tion/experience cells. *, ** and *** denotes significant at respectively 10%, 5% and 1% level.
27

negative and significant correlation between the occupational premium of immigrants and the
log of immigrants, which is inconsistent with the self-selection hypothesis. Instead, these es-
timates indicate that immigrants within education/experience cells tend to compete with each
other but not with natives. In addition, panel C shows that the relative occupational premium of
natives is positively correlated with the log of immigrants within the cell. These results strongly
suggest that natives and immigrants in given education/experience cells have different patterns
of specialization across occupations.
As natives in cells with many immigrants tend to work in occupations yielding higher
wage premia than natives in cells with a smaller number of immigrants, these results indi-
cate that immigration may influence natives’ labor market outcomes by triggering their real-
location towards better paid occupations within education/experience cells. In particular, if
immigration helped natives climb the occupational ladder, the arrival of immigrants to a given
education/experience cell would enfranchise natives in the cell from working in low-paid oc-
cupations and enable them to move to better-paid occupations. As a result, there would be a
negative (respectively, positive) correlation between the proportion of immigrants in a given in
education/experience cell and the proportion of natives in the cell enrolled in the worst-paid
(respectively, best paid) occupations. Table 11 provides evidence pointing in this direction
by regressing the share of workers in each occupational category on the share of immigrants.
These regressions are performed separately across groups of education and include controls for
cohort effects to account for the fact the probability of accessing a specific group of occupa-
tions with a given diploma might change over time.29 Indeed, the first line shows that natives
with primary education that belong to an experience/time cell with a large proportion of immi-
grants are less likely to work in blue-collar occupations, which are almost systematically the
worst paid occupations.30 Instead, the correlation is reversed for the proportion of natives with
primary education who work as technicians. For individuals with secondary education, the cor-
relation also goes from negative to positive as we move away from blue-collar occupations, and
29The probability to be in a white collar occupation for a university graduate was much higher in 1962 than in1999 for example.
30The two only exceptions are the technicians in agriculture, which happen to be paid less than blue-collarsin certain industries, and blue-collars in "oil, electricity, and energy", which are better paid than technicians incertain industries.
28

Table 11: The impact of the proportion of immigrants within an education/experience/year cellon the occupational distribution of natives within the cell
Blue Collar Technicians White CollarOccupations Occupations
Primary EducationImmigrant Share -9.34*** .745*** 0.189
(0.228) (0.219) (0.172)Vocational Education
Immigrant Share -6.54*** 3.67** 2.87**(2.1) (1.64) (1.28)
High-SchoolImmigrant Share -1.45 -1.25 2.69**
(1.18) (0.743) (1.02)University Graduates
Immigrant Share -0.236 -4.66*** 4.89***(0.332) (0.656) (0.809)
Notes: This table regresses the proportion of natives in specific occupations within an edu-cation/experience/year cell against the proportion of immigrants in the cell. Each regressionincludes cohort fixed effects using the definition of cohorts in Table 5. Each regression is basedon 40 observations.*, ** and *** denotes significant at respectively 10%, 5% and 1% level.Sources: Census of Population 1968-1999, FQP 1970, 1977 and LFS 1982, 1990, and 1999.
the same pattern is observed for individuals with college education when going from technical
occupations to the better-paid white-collar occupations.31
Regional Level The most obvious source of concern with the previous results is that the lagged
immigrant share may not be a valid instrument. In the presence of persistence cohort effects,
the error term might be correlated at the cohort level, in which case the lagged immigrant share
would not be a valid instrument because it would also be related with unobserved persistent
over time cohort effects. As a robustness check, we turn to the area approach and exploit the
geographic variation in the occupational premium by adding a regional dimension to our ed-
ucation/experience cells. Importantly, the use of up to 25% census extracts guarantees that
sampling errors are relatively small even for cells within regions with few immigrants, and thus
reduces the extent of potential attenuation biases provoked by sampling error. Table 12 reports
the determinants of the occupational premium of natives across education/experience/region
cells, while Table 13 presents analogous regressions for the relative occupational premium of
natives (Panel A) and the occupational premium of immigrants (Panel B). Different sets of
31Wages in every white-collar occupation are systematically higher than wages in any technical occupation.
29

Table 12: Regional Regressions: Occupational Premium of Natives
Dependent variable:Occupational premium of natives
Log Natives -0.060*** -0.026***(0.006) (0.005)
Log Immigrants -0.003 0.000(0.003) (0.003)
Overid. (pvalue) 0.85 (0.35)FE included (region x education x experience),(region x t),
(education x t), (experience x t), (region x education)Log Natives -0.071*** -0.020***
(0.007) (0.010)Log Immigrants -0.006* -0.018**
(0.003) (0.008)Overid. (pvalue) 0.005 (0.81)FE included previous and (education x experience x t)N 2445 1756Estimation Method WLS 2SLS
Notes: This table reports regression results of models relating the native occupational premia acrosseducation/experience/region cells with the log of natives and the log of immigrants. Region, educa-tion, year and experience fixed effects are included in all regressions. Regions are defined using Frenchadministrative regions (régions). Occupational premia are calculated using the interaction between 3professional status and 100 industries. Estimations in column 2 use as excluded instruments the coun-terfactual log of immigrants using predicted settlement patterns of immigrants calculated using eitherthe previous census or 1968 as a reference year in equation (10). WLS regressions are weighted usingthe number of immigrants per cell. Robust heteroscedastic standard errors reported in parenthesis areadjusted for clustering within education/experience/regions cells. *, ** and *** denotes significant atrespectively 10%, 5% and 1% level.
30

Table 13: Regional Regressions: Relative Occupational Premium and Occupational Premiumof Immigrants
Dependent variable:A. Relative occupational premium
Log Natives -0.049*** -0.033(0.007) (0.032)
Log Immigrants 0.019*** 0.051***(0.004) (0.011)
Overid (p-value) 2.96 (0.08)FE included (region x t), (education x t),(experience x t),
(region x education), (region x education x experience)Log Natives -0.069*** -0.086
(0.011) (0.064)Log Immigrants 0.008 0.002
(0.005) (0.034)Overid (p-value) 2.61 (0.10)
FE included previous and (education x experience x t)B. Occupational premium of immigrants
Log Natives -0.010 0.009(0.008) (0.033)
Log Immigrants -0.023*** -0.051***(0.003) (0.011)
Overid (p-value) 1.71 (0.19)FE included (region x t), (education x t),(experience x t),
(region x education), (region x education x experience)Log Natives -0.001 0.071
(0.012) (0.069)Log Immigrants -0.014*** -0.021
(0.005) (0.034)Overid (p-value) 2.01 (0.15)
FE included previous and (education x experience x t)Estimation Method WLS 2SLS
N 2445 1756
Notes: See Table 12.
31

controls are included in each specification using several possible two ways and three ways
interactions between year, region, education, and experience. Column 2 in each table report
2SLS estimates in which the log of immigrants is instrumented using two counterfactual shift
variables based on different settlement patterns across cities described in section 2. In all these
regressions, the instruments for immigrant shocks prove to be strong with a Cragg-Donald F
statistic (not reported) systematically larger than 100, compared to the critical value from Stock
and Yogo (2005) of about 20. In most specifications, the instruments also pass conventional ex-
ogeneity tests except the in specification including interactions between education, experience
and year which use the log of natives as a dependant variable.
In the model of the upper panel of Table 12, results indicate that the occupational premium
of natives is negatively related with the number of natives in the cell, just as in national re-
gressions.32 However, in contrast with national regressions, the log of immigrants is generally
non-significantly correlated with the occupational premium of natives, and in the few cases in
which a significant correlation is found, this correlation turns out to be actually negative.
As for the determinants of the occupational premium of immigrants and the relative occu-
pational premium, regional level results are very similar to the national estimates. In particular,
Table 13 shows that the immigrant occupational premium is still negatively and significantly
correlated with the log of immigrants,33 and that the relative occupational premium is positively
correlated to the log of immigrants. Moreover, in regressions in which the log of immigrants is
instrumented, point estimates of the impact of the log of natives are much lower and measured
much less precisely while the estimated impact of the log of immigrants is higher than in OLS
estimates in some specifications. The results nonetheless strongly confirm there are different
specialization patterns across occupations between immigrants and natives across cells within
regions and that immigrants tend to compete with immigrants rather than with natives.
Overall, from these results, we find that the different specialization patterns across occupa-
tions observed at the national level also hold at the regional level with a different IV strategy
32Interestingly, in contrast with the national level results reported in Table 10, point estimates are now lower inthose specifications where the immigrant share is instrumented (columns 2 and 3). This result might come from adownward bias of area approach estimates due to natives’ outmigration from the regions where immigrants settlein.
33Interestingly, point estimates are now larger than similar estimates at the national level which may suggestthat internal mobility of immigrants is less of a problem in regional models compared with natives.
32

to deal with the potential endogeneity of the immigrant share. Immigrants belonging to edu-
cation experience regions cells with more immigrants tend to work on average in occupations
characterized by lower wage premia. In addition, the difference between the premia of natives
and immigrants is still positively correlated with the number of immigrants. Therefore, we
believe it is unlikely that aggregate regressions at the national level are significantly biased by
a positive selection of immigrants within cells.
4 Conclusion
Within the Borjas specification, immigration is shown to have a strong positive effect on the
wages and employment of French natives. This result is shown to be robust to controls for the
potential endogeneity of the immigrant share or to the introduction of a geographical dimension
to education/experience cells. However, the strong positive correlation between the number of
natives and the number of immigrants suggests that the immigrant share is not perhaps the
best measure of the immigration shock in the case of France. When the log of immigrants is
instead used as a measure of that shock, the effect of immigration on wages remains positive,
but becomes much smaller. Finally, we provide evidence that the positive effect of immigration
on natives’ wages and the differential impact of the number of immigrants and the number of
natives on natives’ wages is at least partly due to the fact that immigration helps natives climb
the occupational ladder.
4.1 Appendix 1: Definition of the variables
The number of natives and immigrants per education/experience cell are computed using 25%
extracts of the French census in 1968, 1982, 1990, and 1999, a 5% extract in 1962 and a 20%
extract in 1974. Sampling weights are used in all the calculations. The analysis is restricted
to men aged 18-64. A person is defined as an immigrant if he is a noncitizen or a naturalized
French citizen born abroad.
Education
The education variable reported in the Census indicates the diploma received by the in-
33

dividual. We use the variable fr62a-educ and fr62a-diploma in the 1962 Census, DIP in the
1968, 1975 and 1982 censuses, DIPL1 in the 1990 Census and DIPL in the 1999 Census. We
classify individuals in four educational groups depending on their diploma: Primary education,
Secondary education, High School and College. Primary education level includes individuals
which declare to have no diploma and people having the primary school certificates (DFEO
and CEP). Secondary education level includes individuals which report to have a diploma of a
level equivalent to the Diplôme National du Brevet (BEPC) and includes individuals holding a
CAP, a diploma of CAP level, a BEP, a BEPC, or a BEPS. High school education includes indi-
viduals who have a diploma equivalent to the Baccalaureate. This group also includes general,
professional or technical Baccalaureate graduates, Brevet Professionnel graduates, Brevets de
Technicien graduates, Brevets d’Enseignement Commercial, Industriel, Social, Hotelier, Agri-
cole graduates, Brevet d’Agent Technique, BT and BA graduates. College level includes all
individuals with a diploma of a level superior to the Baccalaureate which includes diplômes
paramédicaux et sociaux, BTS, DUT, DEST, Diplômes d’université de Premier, Second et
Troisième Cycle, Grandes Écoles, Écoles d’Ingénieurs, etc.
Monthly Wages
The data used to compute the average wage by experience level and educational level come
from the 1964, 1970 et 1977 survey FQP (Formation et Qualification Professionnelle) and from
the French labor force survey (LFS) of 1982, 1990 et 1999. The 1964 FQP survey took place
between November 1963 and February 1964 and provides information on net annual income
from work in 1962 (Degenne et al., 1998). The 1970 and 1977 FQP surveys provide informa-
tion on the net annual income from work in 1969 and 1976. The LFS provides the net monthly
income of the main reference profession of an individual at the time of the survey (April in
1982, January and February in 1990, and March in 1999).
To compute the average wage per cell of experience and education, we include native in-
dividuals which report to be employed during the survey, which are wage earners and are em-
ployed by the private sector. Because there is no information on the country of birth in the
1964 and 1977 FQPs, natives are defined as individuals who are natural born citizen. We ex-
clude independent workers and civil servants. In the 1982 LFS, there is no variable which
34

distinguishes naturalized citizens from natural born citizens, therefore naturalized citizen born
abroad which must be counted as immigrants are included in the sample (according to the 1982
Census, the number of naturalized citizen born abroad is equivalent to 2% of the total number
of male workers).
In the 1964 FQP and the 1982 LFS, wages are coded as a qualitative variable. In the 1964
FQP, we impute the annual income in the following way: 3000 for less than 4000 Nouveaux
Francs (NF), 4500 for 4000-4999, 5500 for 5000-5999, 7000 for 6000-7999, 9000 for 8000-
9999, 12500 for 10000-14999, 17500 for 15000-19999, 27500 for 20000-34999, 52500 for
35000-49999, 75000 for 50000 NF and more. In the 1982 LFS, for the average monthly wages,
we impute 1000 for less than 1000 Francs (F), 1250 for 1000-1499, 1750 for 1500-1999, 2250
for 2000-2499, 2750 for 2500-2999, 3250 for 3000-3499, 3750 for 3500-3999, 4250 for 4000-
4499, 4750 for 4500-4999, 5500 for 5000-5999, 6500 for 6000-6999, 7500 for 7000-7999,
8500 for 8000-8999, 9500 for for 9000-9999, 12500 for 10000-14999, 17500 for 15000-19999,
22500 for 20000-24999, 27500 for 25000-29999, 45000 for 30000 F and more.
There is no information on the precise number of hours worked in the FQP surveys. There-
fore, we only retain individuals which declare to have been full time employed during the last
twelve months in the year preceding the survey. In the LFS, we eliminate individuals which de-
clare not to work full time during the survey week. Average monthly income is obtained from
the FQP survey by dividing by 12 the net annual wage income from work. Monthly wages
are converted in 2007 euros using the CPI deflator computed by the INSEE. The average log
wage is obtained by computing the average of the log of the monthly wage over the relevant
population. The final sample size used to compute these averages is 5507 for 1964 FQP, 10993
for 1970 FQP, 10906 for 1977 FQP, 21738 for 1982 LFS, 17512 for 1990 LFS and 19556 for
1999 LFS.
Crosswalk tables for industry classifications
We use the industry classification which remained unchanged for the longest period of time
in the data. The NAP (Nomenclatures d’Activités et de Produits 1973) is used in the 1975,1982
and 1990 censuses and in contemporary surveys (LFS and FQP) from 1974 to 1994. We have
created crosswalk tables with other industry classifications to match them with the NAP at the
35

four digit level. The 1959 SIC (Nomenclature des Activités Économiques - édition 1959) is
used in the 1968 Census and in the 1970 FQP. The NAF (Nomenclature d’Activité Française)
is used in the 1999 Census and in labor force surveys from 1994 to 2002. For the correspon-
dence between the 1959 SIC and the NAP, we have used the correspondence tables created by
the INSEE (INSEE, 1976) in the 1970s. To deal with cases of multiple correspondence, we
have used the 1975 Labor Force Survey in which both codes are available to determined the
frequency of each correspondence. We then kept the correspondence with the most observa-
tions when available. For the match between NAP and NAF, we have used the 1994 LFS in
which both codes are also given to establish a match at the four digit levels. Similarly, when
several possibilities existed, we have kept the most frequent correspondence. In both cases, the
match has been completed manually to include exhaustively all codes in the correspondence
table at the four digit level.
Geographical Instrument Based on Settlement Patterns of Immigrants
We distinguish groups of immigrants by using 54 different countries of birth available
across censuses. We assign other individuals (less than 5% of immigrants on average) into
four regions of birth groups (Europe, Asia, Africa and Other). Because immigrants from some
nationalities were very rare during the 1960s in France, particularly immigrants from Asia or
subs-Saharan Africa, we compute two different instruments by using either 1968 or the year of
the previous census as a reference year. The first instrument captures immigrants flow related
to traditional ports of entry of immigrants in France while the second instrument predicts im-
migration using more recent settlement patterns and takes into account the location choice of
nationalities not in France during the 1960s.
4.2 Appendix 2: Education/experience analysis at the regional or county
level
We extend the analysis in section 3.1 to define education/experience cells at the level of the 22
regions or 95 départements (counties) constituting metropolitan France. Table 14 reports the
results of the regressions for the employment-population ratio and the employment-labor force
36

Table 14: Impact of Immigrant Share on Natives using Geographic Unit x Education x Experi-ence groups
dependent Variable: Employment-Population Ratio (1) (2) (3)1) Regional Level 0.089** 0.156*** 0.017
(0.045) (0.030) (0.022)2) County Level 0.080*** 0.148*** 0.011
(0.029) (0.015) (0.013)dependent Variable: Employment-Labor Force Ratio1) Regional Level 0.143*** 0.133*** 0.010
(0.023) (0.020) (0.013)2) County Level 0.139*** 0.114*** -0.005
(0.016) (0.012) (0.009)Controls for:(region x period), (education x period), Yes Yes Yes(experience x period), (region x education) fixed effects(region x education x experience) fixed effects No Yes Yes(education x experience x period) fixed effects No No Yes
Notes: The table reports the coefficient of the immigrant share. The dependent variable is the averagelabor market outcome of a group of workers with similar experience, education and living in the sameregion or county in a given year. Number of observations 3520 for regions and 12192 for counties. Eachobservation is weighted by the number of natives per cell divided by the total number of natives of theyear. Robust heteroscedastic standard errors clustered by education/experience/geographic unit are re-ported in parenthesis. Regressions using counties include observations from 1968 to 1990. Regressionsusing regions include observations from 1962 to 1990. *, ** and *** denotes significant at respectively10%, 5% and 1% level. Sources: Census of Population 1962-1990, FQP 1964, 1970, 1977 and LFS1982, 1990.
ratio only, given that the small sample size of the FQP and LFS does not allow for the same
exercise to be conducted for wages at the regional level and the more disaggregated county
level. Column 1 reports the baseline specification. The coefficient for the employment rates are
all positive and significant, but smaller than at the national level, as in Borjas (2003). We here
also find that the estimates at the more detailed county level are smaller than at the regional
level, which seems to confirm that the choice of a smaller geographical location attenuates the
effects of immigration. Moreover, given we use 25% extracts of the censuses, we can rule out
that this attenuation bias comes from higher sampling errors when estimating the immigrant
share across regions. Column 2 adds interactions between regions, education and experience
fixed effects, which makes the point estimate bigger and reduces standard errors. Finally, when
education/experience/period fixed effects, the point estimates become smaller and statistically
insignificant.
37

References
Altonji, Joseph and David Card, “The Effects of Immigration on the Labor Market Outcomes
of Less-Skilled Natives,” in John Abowd and Richard B. Freeman, eds., Immigration, Trade
and Labor, University of Chicago Press 1991.
Autor, David and David Dorn, “This Job Is "Getting Old": Measuring Changes in Job Oppor-
tunities Using Occupational Age Structure,” American Economic Review, May 2009, 99 (2),
45–51.
Aydemir, Abdurrahman and George J. Borjas, “Cross-Country Variation in the Impact of
International Migration: Canada, Mexico, and the United States,” Journal of the European
Economic Association, 2007, 5 (4), 663–708.
and , “Attenuation Bias in Measuring the Wage Impact of Immigration,” Journal of Labor
Economics, 2011, 29 (1), 69–112.
Bartik, Timothy J., Who Benefits from State and Local Economic Development Policies? num-
ber wbsle. In ‘Books from Upjohn Press.’, W.E. Upjohn Institute for Employment Research,
November 1991.
Beaudry, Paul and John DiNardo, “The Effect of Implicit Contracts on the Movement of
Wages Over the Business Cycle: Evidence from Micro Data,” The Journal of Political Econ-
omy, 1991, 99 (4), 665–688.
Bonin, Holger, “Wage and Employment Effects of Immigration to Germany: Evidence from a
Skill Group Approach,” Working Paper 1875, IZA, December 2005.
Borjas, George J., “The Economics of Immigration,” Journal of Economic Literature, 1994,
32 (4), 1667–1717.
, “The Labor Demand Curve is Downward Sloping: Reexamining the Impact of Immigration
on the Labor Market,” Quarterly Journal of Economics, 2003, 118 (4), 1335–1374.
, “Native Internal Migration and the Labor Market Impact of Immigration,” Journal of Hu-
man Resources, 2006, 41 (2), 221.
38

and Lawrence F. Katz, “The evolution of the Mexican-born workforce in the United
States,” in George J. Borjas, ed., Mexican immigration to the United States, 2007, pp. 13–56.
, J. Grogger, and G.H. Hanson, “Imperfect Substitution between Immigrants and Natives:
A Reappraisal,” Working Paper 13887, National Bureau of Economic Research, March 2008.
, Richard B. Freeman, and Lawrence F. Katz, “How Much Do Immigration and Trade
Affect Labor Market Outcomes?,” Brookings Papers on Economic Activity, 1997, 1997 (1),
1–90.
Card, David, “The Impact of the Mariel Boatlift on the Miami Labor Market,” Industrial and
Labor Relations Review, 1990, 43 (2), 245–257.
, “Immigrant Inflows, Native Outflows, and the Local Market Impacts of Higher Immigra-
tion,” Journal of Labor Economics, 2001, 19 (1), 22–64.
, “Immigration and Inequality,” American Economic Review (Papers and Proceedings), May
2009, 99 (2), 1–21.
and Ethan G. Lewis, “The Diffusion of Mexican Immigrants during the 1990s,” in George
Borjas, ed., Mexican immigration to the United States, University Of Chicago Press 2007,
pp. 193–228.
and John DiNardo, “Do Immigrant Inflows Lead to Native Outflows?,” The American
Economic Review, 2000, 90 (2), 360–367.
and Thomas Lemieux, “Can Falling Supply Explain the Rising Return to College for
Younger Men? A Cohort-Based Analysis,” The Quarterly Journal of Economics, 2001, 116
(2), 705–746.
Carrasco, Raquel, Juan F. Jimeno, and A. Carolina Ortega, “The effect of immigration on
the labor market performance of native-born workers: some evidence for Spain,” Journal of
Population Economics, 2008, 21 (3), 1–22.
Cortes, Patricia, “The Effect of Low-Skilled Immigration on U.S. Prices: Evidence from CPI
Data,” Journal of Political Economy, 06 2008, 116 (3), 381–422.
39

Deaton, Angus, “Panel data from time series of cross-sections,” Journal of Econometrics,
1985, 30 (1-2), 109–126.
Degenne, Annick, Marie-Odile Lebeaux, and Louis-André Vallet, “Les données de
l’enquête Formation - Qualification Professionnelle de 1964 sont de nouveau disponibles,”
Technical Report, Lasmas - Institut du Longitudinal UPR320 1998.
Dustmann, Christian, Francesca Fabbri, and Ian Preston, “The Impact of Immigration on
the British Labour Market,” The Economic Journal, 2005, 115 (507), 324–341.
Friedberg, Rachel M., “The Impact of Mass Migration on the Israeli Labor Market,” Quarterly
Journal of Economics, 2001, 116 (4), 1373–1408.
and Jennifer Hunt, “The Impact of Immigrants on Host Country Wages, Employment and
Growth,” The Journal of Economic Perspectives, 1995, 9 (2), 23–44.
Gibbons, Robert and Michael Waldman, “Task-Specific Human Capital,” The American
Economic Review, 2004, 94 (2), 203–207.
Goldin, Claudia D. and Lawrence F. Katz, The race between education and technology,
Harvard University Press, 2008.
Hunt, Jennifer, “The Impact of the 1962 Repatriates from Algeria on the French Labor Mar-
ket,” Industrial and Labor Relations Review, 1992, 45 (3), 556–572.
INSEE, Table de correspondance N.A.P.-N.A.E., INSEE, 1976.
Katz, Lawrence F. and Kevin M. Murphy, “Changes in Relative Wages, 1963-1987: Supply
and Demand Factors,” The Quarterly Journal of Economics, 1992, 107 (1), 35–78.
and Lawrence H. Summers, “Industry rents: Evidence and implications,” Brookings Pa-
pers on Economic Activity. Microeconomics, 1989, 1989, 209–290.
Krueger, Alan B. and Lawrence H. Summers, “Reflections on the Inter-Industry Wage Struc-
ture,” in Kevin Lang and Jonathan Leonhard, eds., Unemployment and the Structure of Labor
Markets, Basil Blackwell 1987.
40

and , “Efficiency Wages and the Inter-industry Wage Structure,” Econometrica, March
1988, 56 (2), 259–93.
Manacorda, Marco, Alan Manning, and Jonathan Wadsworth, “The Impact of Immigra-
tion on the Structure of Male Wages: Theory and Evidence from Britain,” Journal of the
European Economic Association, forthcoming 2010.
Neal, Derek, “Industry-Specific Human Capital: Evidence from Displaced Workers,” Journal
of Labor Economics, October 1995, 13 (4), 653–77.
Ortega, Javier, “Pareto-Improving Immigration in an Economy with Equilibrium Unemploy-
ment,” Economic Journal, January 2000, 110 (460), 92–112.
Ottaviano, Gianmarco I.P. and Giovanni Peri, “Rethinking the Effects of Immigration on
Wages,” Working Paper 14188, National Bureau of Economic Research, November 2007.
and , “Immigration and National Wages: Clarifying the Theory and the Empirics,” July
2008.
Peri, Giovanni and Chad Sparber, “Task Specialization, Comparative Advantages, and the
Effects of Immigration on Wages,” American Economic Journal: Applied Economics, July
2009, 1 (3), 135–169.
Pischke, Jorn-Steffen and Johannes Velling, “Employment Effects of Immigration to Ger-
many: An Analysis Based on Local Labor Markets,” The Review of Economics and Statistics,
1997, 79 (4), 594–604.
Schor, Ralph, Histoire de l’immigration en France de la fin du XIXe siècle a nos jours, Armand
Colin, 1996.
Stock, James H. and Motohiro Yogo, “Testing for Weak Instruments in Linear IV Regres-
sion,” in D.W.K. Andrews and J.H. Stock, eds., Identification and Inference in Econometrics
Models: Essays in Honor of Thomas Rothenberg, Cambridge University Press 2005.
41