Embed Size (px)
Citation preview
Immigrant Skill Utilization: Trends and Policy Issues
Jeffrey G. Reitz
Josh Curtis
Jennifer Elrick
University of Toronto
May 2012
Draft: Please do not quote without permission. Comments welcome.
Contact: Professor Jeffrey G. Reitz, Munk School of Global Affairs, University of Toronto, 1 Devonshire
Place, Toronto M5S 3K7 Canada, [email protected],
http://www.utoronto.ca/ethnicstudies/reitz.html
ii
Immigrant Skill Utilization: Trends and Policy Issues
Abstract
Since 1996, the problem of under-utilization of immigrant skills in Canada has grown significantly.
University-educated immigrants are more numerous, and census analysis shows their access to skilled
occupations in the professions and management decline between 1996 and 2006. The decline in access
since 2001 coincided with increased program efforts, including foreign credential assessment, bridge-
training, and others. Policy differences among provinces, or in occupational groups targeted, also have
had little impact on aggregate trends. The value (in today’s dollars) of work lost to the Canadian
economy grew from about $4.80 billion annually in 1996 to about $11.37 billion in 2006.
Keywords:
immigrants, employment, human capital analysis, Canada, credential assessment, policy assessment
Immigrant Skill Utilization: Trends and Policy Issues
Under-utilization of the skills of Canada’s immigrants – ‘brain waste’ – emerged as a policy
problem in the 1990s, costing the Canadian economy $2- to $3-billion annually (Reitz 2001a, Watt and
Bloom 2001), and representing one of the most significant disappointments for immigrants as they settle
in Canada. A number of policy initiatives have been directed at the problem particularly in the past
decade, including credential assessment services, regulations to ensure fair access for immigrants to
professional licensing, and bridge-training programs to fill gaps in immigrant skills that may arise from
foreign-acquired education or experience, among others. As well, settlement services including language
training programs also have been adapted t more effectively serve the needs of immigrant populations.
Has progress been made toward better immigrant skill utilization? What impact have various
policy initiatives had in addressing skill under-utilization? What are implications of these trends for
future policy? This study examines recent trends, and assesses policy impacts based on available data.
We proceed in four steps. First, we review trends in skilled immigration in Canada since the mid-1990s,
based on immigration statistics, as well as some of the major explanations put forward by researchers to
explain immigrant employment and earnings outcomes. Second, we summarize policies to address labour
market barriers, noting time of implementation and differences by province and by occupational fields.
Third, we assess trends in the success that immigrants with university degrees, including graduate and
professional degrees, have had in gaining access to highly-skilled professional and managerial
occupations, based on data from the 1996, 2001, and 2006 censuses. And fourth, using human capital
earnings analysis, we estimate the earnings deficits of immigrants due to immigrant skill-underutilization,
both at the individual level and in the aggregate across the population, using human capital earnings
analysis. Based on this analysis we identify implications for future policy development. Although many
policy initiatives have come on stream since 2006, and their impact cannot be assessed in the census

2
series ending in 2006, we believe that policy development and trends to that time help focus analysis of
policy requirements for the future.
Trends in Skilled immigration in Canada, 1994-2010
Skilled immigration received a very substantial boost in the mid-1990s, when selection criteria
were changed to place increased emphasis on formal education, particularly university education. As
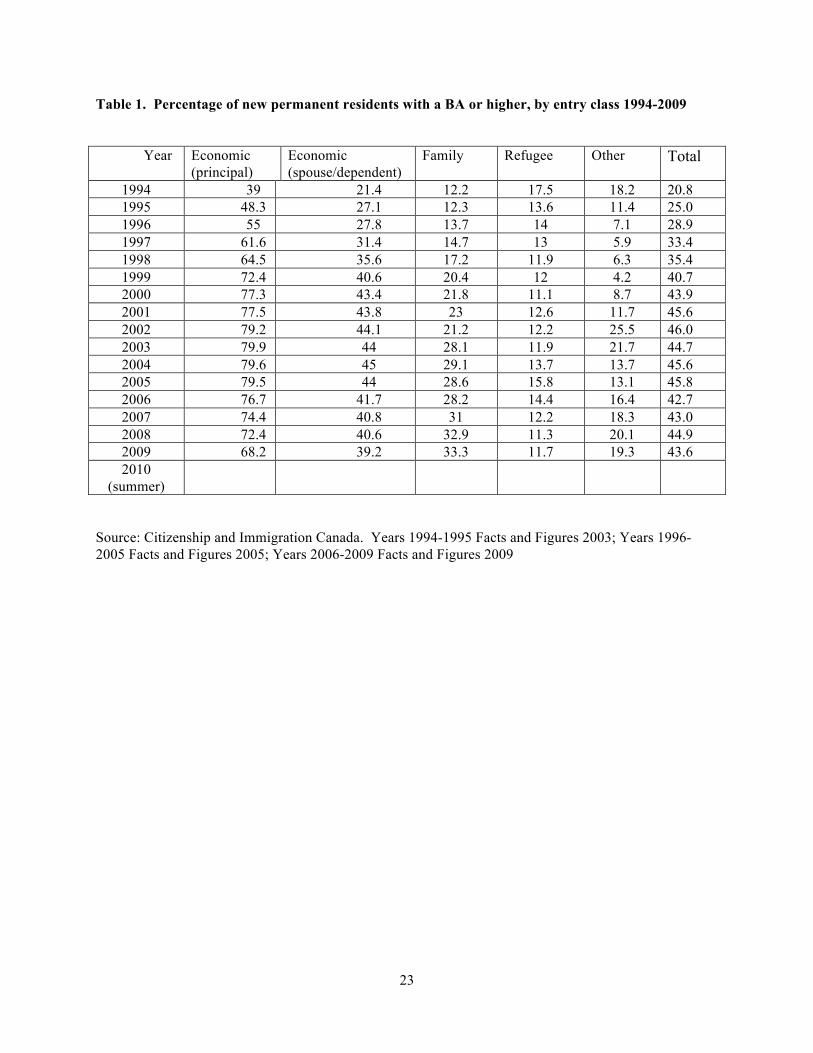
immigration data in Table 1 show, the proportion of immigrants with university degrees rose dramatically
from 20.8 percent in 1994 to 45.6 percent in 2001, and remained at roughly that level through 2009. This
increase was led by the principal applicants within the “economic class” of immigrants, whose
employment-related skills were a key to their selection as immigrants, and among whom the proportion
with university degrees increased from 39.0 percent in 1994 to 77.7 percent in 2001. Educational levels
for the spouses and dependents of principle applicants, and also for family-class (sponsored) immigrants,
are lower, but they also increased over time. They are related to principle applicants, and share
characteristics deriving from family economic resources. Refugees and ‘other’ immigrants (a small
category) were not affected by the changes to selection criteria, and so the trends do not apply to them.
Note a decline in educational levels of economic class immigrants can be observed after 2005, from
nearly 80 percent for principle applicants down to 68 percent, and from 45 percent for spouses and
dependants down to 39 percent. This may reflect changes in selection criteria away from education and
toward experience in occupations in demand in the labour market. However, the educational levels of the
family-class immigrants continued to rise after 2005. The result is that the overall proportions of
immigrants with bachelor’s degrees remained between 43 and 45 percent from 2005 to 2008.
These trends toward more skilled immigrants indicate that the issue of skilled immigrant employment
matters more now than it did in the 1990s, and most likely affects a larger proportion of the immigrant
population now than it did in the 1990s. Some skilled immigrants in the country in the 1990s will have
obtained suitable employment by now, but many others have arrived since that time. Since the numbers
of immigrants remains high and the proportions with university-based skills has grown, the skilled-
3
immigrant segment of the population is now growing more rapidly than in the past. The importance of
skilled immigrant employment and earnings is reflected in the growing body of literature that has
emerged on the topic (see, for example, (Aydemir and Skuterud 2005; Bonikowska, Hou, and Picot 2011;
Ferrer and Riddell 2008; Ferrer, Green, and Riddell 2006; Frenette and Morissette 2005; Nadeau and
Seckin 2010; Picot and Sweetman 2005; Wald and Fang 2008).
To some extent, the poorer performance of highly educated immigrants in the Canadian labour
market may result when immigrant education is not fully equivalent or relevant to employer needs.
Explanations put forward to explain immigrant earning differentials include the quality of educational
credential and foreign experience obtained abroad (Ferrer and Riddell 2008; Ferrer, Green, and Riddell
2006; Sweetman 2004; Wald and Fang 2008). A particular concern within this literature is with language
skills and literacy (Bonikowska, Green, and Riddell 2008; Ferrer, Green, and Riddell 2006; Wald and
Fang 2008). Using the International Adult Literacy Survey (IALS) to confirm previous results from an
analysis of the Ontario Immigrant Literary Survey, (Bonikowska, Green, and Riddell 2008, 65) argue that
the poorer results of immigrants on literacy tests reflect lower levels of cognitive skills that are “usable in
the Canadian Economy”, and suggest these are a major factor affecting earnings differentials between
immigrants (particularly ones with educational credentials obtained abroad) and the native-born
population. However, while useful, literacy test results may to some extent also reproduce cultural biases
affecting employer decisions. Further, because of substantial sample variances the estimated impact of
measured immigrant skill differences cannot be regarded as more than very rough approximations.
At the same time, there is quite convincing evidence of the significance of processes of discriminatory
disadvantage affecting skilled immigrants in Canada (Reitz and Banerjee 2007; pp. 500-3). Pendakur and
Pendakur (2002) argue that differential returns based on language can be interpreted as discrimination
against ethnic minorities, as opposed to actually lacking cognitive skills. Oreopolous (2009) shows that
job applicants with Asian names receive positive responses from employers less than half as often as the
normal rate, based on a field experiment with 6000 resumes. Skuterud (2010) concludes that “substantial”

4
racial discrimination occurs in Canada, based on poorer than expected labour market position of the
children of racial minority immigrants, who have entirely Canadian education and work experience.
Policy Context
A review of policies to address employment barriers experienced by these skilled immigrants, to
serve as context for a trend analysis of actual employment experiences, must take account of the
incremental development of policy over time, and also variation by provincial jurisdiction which is
mainly responsible for employment policy, and by occupational groups or sectors which may be regarded
as a priority or which may be more accessible to policy intervention. Over time, two somewhat distinct
phases of policy-making regarding barriers to immigrant skill utilization can be distinguished. In the first
period, the focus of policy development was primarily on credential assessment and recognition as the
basic issue. In a second period, the problem of skill underutilization was recognized as more complex
and requiring additional interventions. Programs such as licensing regulation, bridge training and
mentoring were introduced, and traditional settlement programs were modified to include assistance to
professionals. These two time periods coincide roughly with the data points provided by the census –
1996 to 2001, and 2001 to 2006. However, identifying expected effects with specific the time periods is
difficult, because the actual timing of policy implementation varies significantly across provinces.
Foreign credential recognition. From the mid-1990s to 2001, policies aiming to improve
immigrant skill utilisation focused mainly on creating provincial credential assessment services, as well as
on the establishment of best-practice models of doing so. Quebec lead the way in 1970, followed by
Alberta in 1994, British Columbia in 1995, and Manitoba in 1998, and World Education Services in
Ontario in 2000 (Alberta’s service also operates in Saskatchewan and the Northwest Territories).
Provincial mandates vary. The Ontario service is a private not-for-profit organization (World Education
Services), provided with start-up funding, ongoing project-based funding, and government endorsement.
In Québec, Manitoba and Alberta, credential assessment services were integrated directly into provincial
government ministries.
5
The impact of credential assessment services in helping immigrants get skilled jobs has not been
formally evaluated. Obviously, many immigrants see the assessments as worthwhile, since they do use
them, with largest numbers in Quebec, but with significant use also in Ontario and British Columbia.
One survey suggests that the propensity to use credential assessment services according to the level of
labour demand, with employers in high-demand sectors like information technology being willing to test
new employees on the job rather than spend time investigating paper credentials (Sangster, 2001).
Supplementing the provincial services, Human Resources and Skills Development Canada
(HRSDC 2005) launched its own the Foreign Credential Recognition Program in 2003, with $84.16
million funding over seven years. This initiative could eventually strengthen service provision, but the
explicit mandate is only to work with regulatory authorities as well as industry sectors and institutions
responsible for non-regulated occupations to “minimize barriers to full labour market integration”
(Citizenship and Immigration Canada, 2010a, p. 11). Further, although the existence of a national
program may help spur action across the country, there are as yet no national standards. After Canada
ratified the UNESCO Convention on the Recognition of Studies, Diplomas and Degrees in 2009, the
Councils of Education Ministers in Canada established the Canadian Information Centre for International
Credential to help Canada conform to the convention. The Alliance of Credential Evaluation Services of
Canada (2009, 15, 20) has documented discrepancies in the interpretation of international qualifications
across its members, so significant provincial differences remain, owing not only to different provincial
standards, but different procedures for submitting and assessing qualifications (see also Owen and Lowe
2008: 13).
In an effort to move beyond the evaluation of institutional certificates in foreign credential
recognition, HRSDC has also been making an effort to link its Foreign Credential Recognition Program
with its program on literacy and essential skills. In 2010, it sponsored and attended three nation-wide
consultations with immigrant service organizations, colleges responsible for administering language
training and bridging programs, employers, and other stakeholders in the credential recognition process,
in part to promote tools developed by its Office of Literacy and Essential Skills. These tools, such as 350

6
Essential Skills Profiles covering occupations contained in the National Occupational Classification
(NOC), are designed to help employers translate job descriptions into example tasks that can help
determine what a job candidate can actually do, regardless of what paper credentials attest to (Human
Resources and Skills Development Canada 2012).
A more aggressive move to promote credential recognition is Ontario’s legislation mandating
uniform practices for recognition of foreign-acquired qualifications by professional licensing agencies,
the Fair Access to Regulated Professions Act (2006). This Act creates a legal obligation for licensing
bodies outside the health sector to operate in a “transparent, objective, impartial” manner (Office of the
Fairness Commissioner, 2011; the 1991 Regulated Health Professions Act applies in that sector). This is a
strategic effort for two reasons. First, recognition of foreign qualifications is technically feasible when
educational requirements for specific jobs are delineated, and this is clearly more likely regulatory bodies
set required qualifications. And second, the existence of regulators facilitates access to the process.
However, the need for legislation reflects widespread perception that those regulators may be a source of
resistance to fair recognition of immigrant credentials.
Toward skill utilization. A number of policies have addressed the fact that many barriers to
immigrant skill utilization go well beyond simple lack of recognition of foreign-acquired qualifications.
Some immigrants are generally well-trained but lack some specific knowledge or skills required in
Canada. Some find that their lack of Canadian work experience concerns employers. Other problems
include lack of social networks useful in job seeking, and lack of knowledge of Canadian professional
‘lingo.’ Perceptions of these barriers among immigrants were probed by Statistics Canada’s Longitudinal
Survey of Immigrants to Canada (Statistics Canada 2003, 2005). Overall, 71 percent of immigrants
reported encountering at least one barrier to gaining access to a job at their level of skill. Although lack of
foreign credential recognition was a serious problem, lack of Canadian experience was identified by 26
percent of respondents as their primary barrier six months after arrival, and the same figure of 26 percent
was found seven to 24 months after arrival. Other perceived barriers to employment included a lack of
acceptance or recognition of foreign work experience or qualifications, and language barriers.
7
Community groups have played a significant role in developing more comprehensive policy
(Alboim 2010). The Toronto Immigrant Employment Council (TRIEC), established in 2003, includes
representatives from employers, labour, occupational regulatory bodies, post-secondary institutions,
assessment service providers, community organizations, and all three levels of government (federal,
provincial, municipal). TRIEC annual reports show the range of initiatives and provide some numerical
assessment of impact. In 2009, for example, it reported that its mentoring partnership program matched
5,000 skilled immigrants with Canadian professional mentors. Career Bridge internships, which TRIEC
helped initiate, provided 1,300 skilled immigrants with Canadian experience, and 600 skilled immigrants
made connections through multiple networking events. Buoyed by these successes, the TRIEC model has
diffused across Canada.
Actual programs to address the various problems may be quite complex. For example, where
immigrant credentials are assessed as deficient in certain specifics, bridge training programs may be a
useful alternative to simply starting over. However, they also frequently go beyond a simple top-up
filling in technical gaps. Educational institutions, employers, regulatory bodies and others work together
to address multiple barriers in one occupation-specific program (TRIEC, 2006; Birrell & McIsaac, 2006).
They may include academic and technical writing, workplace culture and communication (i.e. “soft
skills”), occupation-specific language training, licensure exam preparation, job interview preparation, and
internship, mentorship or clinical placement. Another example is the Enhanced Language Training (ELT)
program, launched by Citizenship and Immigration Canada (CIC) in 2003 to provide language skills
tailored to requirements in a particular occupational field, but also providing participants with job-seeking
assistance (Weiner, 2008).
There also have been programs aimed at immigrants at the pre-departure stage, such as the
Canadian Orientation Abroad (COA) program. Realistic expectations may help prospective immigrants
prepare for arrival in Canada, while possibly deterring those with limited prospects. In cooperation with
the International Organization for Migration, CIC delivered COA sessions to over 68,000 people between
1998 and 2006 (International Organization for Migration, 2011).
8
General Settlement Program Trends. Settlement programs are not aimed exclusively at labour
market integration, but may be expected to help. There are three main components: the Immigrant
Settlement and Adaptation Program (ISAP), the Language Instruction for Newcomers to Canada (LINC)
program, and the Host Program; there are also supplementary grants to provinces providing further
settlement support. There is also a Resettlement Assistance Program (RAP) for refugees. LINC supports
locally-based language training in English or French for adult immigrants, in a full-time or part-time
format. ISAP encompasses services such as reception, orientation, translation, interpretation, referral to
community resources, counselling, general information, and employment-related services. The Host
Program matches immigrants with volunteers trained by Service Providing Organizations who help
newcomers adapt to life in Canada.
Over the period 1996-2006, annual settlement program spending by CIC nearly doubled, from
$235.4 million to $445.0 million (CIC 1997 p. 10; 2006b, p. 31), and spending increased further to $965.7
million by 2010 (CIC 2010b, p. 28). LINC and ISAP account for the largest share of these funds.
Because of the local nature of service provision, systematic outcome evaluation is not available.
Provincial differences. Although policy development has proceeded unevenly across provinces,
the leading role of Ontario may lead to the expectation that immigrant skill utilization may be more
advanced in that province. Quebec and other provinces lead the way in credential assessment, since 2000
and in many other areas of policy, Ontario has been among the earliest adopters. The TRIEC initiative
beginning in 2003 has been influential not only in Toronto but across Ontario. By 2006, Ontario’s
Ministry of Citizenship and Immigration had funded the most extensive number of bridge training
programs for internationally-trained individuals in Canada (TRIEC, 2006). Beginning with pilot programs
in the areas of pharmacy and nursing in 2001, the range extends to midwifery, medical radiation
technology, medical laboratory science technology, respiratory therapy, nutrition, engineering, precision
machining and tooling, early childhood education, information technology for financial services and
health informatics, and biotechnology (TRIEC, 2006). Bridging programs for engineers include those
offered by the Ontario Association of Certified Engineering Technologists, Skills for Change’s
9
Engineering Your Future program, and the collaboration between Ryerson University and Professional
Engineers Ontario, the provincial licensing body (Owen & Lowe, 2008). Ontario’s pharmacy bridging
program in pharmacy was later adopted in British Columbia.
Focal occupations. Labour market initiatives to assist immigrants have been directed at many
occupations, but as can be seen in this review, health-related and engineering professions stand out as the
most consistent targets over time. The Internationally Educated Health Care Professionals Initiative
launched in 2005 was allocated a budget of $75 million over five years to improve labour market
integration in seven priority professions: medicine, nursing, pharmacy, physiotherapy, occupational
therapy, medical laboratory technology, and medical radiation technology (CIC, 2010a, p. 13). According
to HRSDC, it was estimated at the time that the funding would help integrate up to 1,000 physicians, 800
nurses, and 500 other health-care professionals (Health Canada, 2005). The Canadian Council of
Professional Engineers introduced its own credential assessment service for engineering credentials
obtained outside Canada in 2003 (Canadian Council of Professional Engineers, 2008). In that same year,
the Council embarked on a three-phase project funded by HRSDC ($2.9 million) designed to gain an
overview of immigrant experience and licensing procedures, and to recommend improvements (Canadian
Council of Professional Engineers, 2004; Weiner, 2008). One result was a provisional license that allows
immigrants to gain work experience needed to obtain the P. Eng. Degree (Owen & Lowe, 2008).
Adding up Expected Effects. Two conclusions may be drawn from this overview of policy. One
is that considerable attention has been given to immigrant skill under-utilization, and a number of
programs have been put in place. Credential assessment services have been in operation across Canada
by 2001, so their effects may be expected to be seen from that time. A number of other efforts have been
made since 2001. Their effects will only begin to be visible after a number of years. Given the leading
role of Ontario one might look for these effects to be greater in that jurisdiction, and perhaps more in the
health professions or engineering. Effects of some initiatives, such as Ontario’s legislation regulating
professional licensing agencies, may become visible only in the past few years. Nevertheless, it is of
10
interest whether any of these activities may have impacts observable in the census series from 1996 to
2001 and 2006.
Trend Analysis: Census Data for 1996, 2001, and 2006
Trend analysis of census data are useful for tracking the problem of immigrant skill under-
utilization, and may provide some clues to the impact of policies developed over time. Of course, each of
these policies deserves separate evaluation to determine the most effective and cost efficient approaches
to addressing immigrant skill utilization. However, it is also of interest to track the overall trend in the
employment of skilled immigrants, to assess the overall status of the problem and hopefully to learn how
the policies may be working or not working in the aggregate. For such a purpose, the periodic census is a
useful tool. The 1996 census was used previously to provide a description of immigrant skill
underutilization in terms of the total earnings lost when immigrants are employed at occupations below
the level at which similarly qualified native-born worker were employed. This estimate of about $2.4
billion acquired a degree of credibility as a ballpark number indicating the economic impact (Reitz2001).
Replicating this 1996 analysis to 2001 and 2006 would have a number of uses. First, it would
provide a trend line which would be useful in tracking change in the significance of the problem both in
terms of the numbers affected, and the extent of skill underutilization. Detailed examination of the trend
data would also be useful to know how the trends vary not only by gender, but also by recency of
immigration, and possibly other demographic characteristics. Second, it would also enable analysis of
differences in experiences in different regions or provinces where different strategies may have been
pursued, or in different occupational sectors. Such a trend analysis while useful is by no means to be
interpreted as an ‘evaluation’ of policy in general, or of any specific policy. As well, many of the policy
innovations have occurred since 2006, so their impact will not be seen until a later point in time.
To ensure comparability of the censuses analyses requires attention to changes in variable
definitions. Two key variables critical to our analysis, namely levels of education, and occupational skill
levels, were revised slightly in the censuses subsequent to 1996. In the case of education, the 2006
11
coding shifted attention toward specific employment credentials and away from the attempt to measure
numbers of years of education. This is fine for the present purpose, since the focus is mainly on
university degrees at the bachelor’s and post-graduate levels, and definitions of these categories are
identical across censuses. Regarding occupation, our analysis distinguishes only two categories:
professional occupations, and senior or middle management occupations. These two account for most of
the skill and earnings variations across occupations. The professional occupations were defined
identically across the three censuses. However, for managerial occupations the relevant occupational
categories were revised in 2006. In the 1996 and 2001 censuses, ‘Senior’ and ‘Middle’ managers, as well
as general ‘Supervisors’ versus ‘Craft and trade’ supervisors were differentiated. In the 2006 census these
categories were aggregated into two categories only: ‘Managers’ and ‘Supervisors’. To achieve
comparability of the 2006 data with the two earlier censuses, we recoded the earlier versions of the census
to match the 2006 coding.
The analysis is restricted to those persons the ages of 20 and 64. We first describe levels of
education, and for those with employment (positive earnings from employment or self-employment),
attainment of professional or managerial occupations by immigrants according to their reported level of
qualification, for Canada and by province and occupational sector. We then estimate overall earnings lost
due to the immigrant skill under-utilization, that is, to the employment of immigrants in occupations
below those at which comparably qualified native-born persons are working. The method follows Reitz
(2001), who based the analysis on human capital regression equations for immigrants and the native-born
men and women, using a substitution procedure explained below. The earnings equations include various
measures that tap economic and socio-demographic variables. The educational qualifications include a
measure of Bachelor’s degree, as well as a second variable that captures professional and graduate
degrees together (i.e., Master’s, PhD, and Professional degrees combined). Occupation is measured with a
series of 9 categorical variables that have been recoded in order to maintain continuity between census
periods. We also control for age, city of residence (Toronto, Montreal or Vancouver), visible minority
origins (black, Chinese, South Asian, Filipino, and Other visible minority), and knowledge of an official
12
language. Age in years is used as a proxy for work experience, and with 20 subtracted since 20 years is
the minimum age of the sampled population.1 A squared term is used also to capture the non-linear
component of the effect of work experience. Individual years of age were substituted with age categories
in the 2006 microdata, so for comparability the earlier censuses were recoded to match the 2006
categories. Regarding language, we include dummy variables for knowledge of French, knowledge of
French and English, and knowledge of neither official language. English knowledge only is the reference
category. For immigrants, the number of years since arrival in Canada is represented as a series of
dummy variables for arrival in five-year intervals. We isolate three five year periods (i.e., ‘last 1-5 years’,
‘last 6-10 years’, and ‘last 11-15 years) as well as a reference group of immigrants living in Canada 16
years and above.
Trends in Employment of University-Educated Immigrants: 1996 – 2006.
The rising level of the university-based education of immigrants in Canada, seen in the
immigration statistics in Table 1, is reflected in the 1996-2001-2006 census series in Table 2. Table 2
shows the proportions of immigrant men and women with 4-year bachelor’s degrees, and also the
proportions possessing also a graduate or professional degree beyond the bachelor’s level, by arrival
cohort for each census; a native-born comparison group is also included. Rising levels of education of
immigrants can be seen in the fact that the most recent cohorts in every comparison are better-educated
than earlier cohorts. This holds for both men and women, and at both the BA and post-graduate or
professional levels, and for all three census years. And because of the increasing selection standards for
economic immigrants from 1990 forward, this rising trend becomes more pronounced moving from 1996
to 2006. Education levels for the most recent arrivals (5 years previous to the census) increased rapidly
over time. These trends have a cumulative effect on the immigrant population, so that in 2006, the higher
levels of education are seen for all of the cohorts arriving in the previous 15 years. Over this period,
1 An often-used method for measuring potential work experience is age minus years of education minus 5. However, this measure cannot be used here because the variable years of education is not available for 2006. For 1996 and 2001, the two measures produce similar results.
13
educational levels also rose for the native-born, of course, but less rapidly than for immigrants. Among
immigrants arriving five years before 1996, the proportion with university degrees was nearly twice as
high for immigrants as for the native-born population (24.5 v. 12.8 percent for men, 19.2 v 11.6 percent
for women). For the most recent immigrants in 2006, the proportion with university degrees was nearly
three times as high as for native-born population for men (44.2 v. 15.0 percent), and nearly two and one-
half times as high for women (38.7 v. 15.2 percent).
Access to high-skilled occupations. The trend toward more highly-educated immigrants means
there has been a much larger population of immigrants seeking high-skilled occupations. How successful
have they been? Has their rate of success improved over time? These questions can be answered by
examining the occupational status of those immigrants who were working, according to levels of
qualification, in Table 3. The baseline situation in 1996 was a substantial disadvantage for immigrant
men and a greater disadvantage for immigrant women. Among immigrant men arriving in the 5 years
previous to the census, 50.4 percent of those with a university degree worked in a managerial or
professional occupation in Canada, compared to 70.7 percent of their native-born counterparts. For those
with graduate degrees, the figure was 67.8 percent, compared to 86.8 percent of their native-born
counterparts. The success rate is lower for women, with a larger gap between then and the native-born
counterparts. Among immigrant women in the recent arrival cohort with a university degree, only 34.8
percent had a managerial or professional occupation, compared to 64.5 percent for the native-born
counterparts, and of those with a post-graduate or professional degree, 54.2 percent had a managerial or
professional occupation, compared to 83.6 percent for the native-born. The immigrant/native-born
percentage differences are on the order of 20 percent for men, and about 30 percent for women.
Immigrants who have been in the country for longer have higher success rates, suggesting that
assimilation into the labour market raises the rate of success. In fact, in 1996, for immigrants who have
been in the country for 16 years or more, the proportions of those with university degrees who have
attained a professional or managerial occupation is about equal to what is observed for the native-born,
for both men and women. The earnings, as will be seen are not the same, however.
14
The trend over time is basically up, and then down. By 2001, success rates improve somewhat
for the most recent cohorts, but by 2006 the success rates are actually worse for the most recent
immigrants. For university graduates arriving the most 5 years preceding the census, the trend in the
percentage in high skill occupations was for men from 50.4 (in 1996 ) rising to 54.2 (in 2001) but then
falling to 43.5 (in 2006), and for women from 34.6, rising to 42.3, then falling to 34.4.
Those with more advanced degrees actually showed more negative trends. For both men and
women, recent immigrants with professional or graduate degrees experienced a smaller improvement than
bachelor’s degree holders comparing those arriving in the early 1990s to those arriving in the late 1990s,
and they experienced a stronger downturn in the first five years of the 2000s.
Although business-cycle effects explain the fluctuation to a degree, they do not explain the extent
of the downturn in the most recent period. Labour demand generally was weak in the early 1990s, with
well-known effects reducing opportunity for immigrants, so an improvement for immigrants arriving in
the late 1990s is expected. However, the drop in the early 2000’s is not expected. The unemployment
rate which in the early 1990s had been in double digits, fell to roughly 8 percent in the late 1990s, and
remained at that level or lower in the five years after 2000 (Statistics Canada, Labour Force Historical
Review 2009, Table 086. Ottawa: Statistics Canada 2010, Cat. NO. 71F0004XVB). Hence labour
demand was substantially stronger for in the period 2000 and 2005 than it was in the early 1990s
recession, and yet the occupational success of immigrants was significantly less for those arriving in the
latter period
Employment of the highly-skilled in low-skilled occupations. The stereotype most vivid in the
public mind symbolizing immigrant underemployment is that of immigrant professionals driving taxis.
Actually, only about 1 percent of immigrants with university degrees are employed as taxi drivers,
according to the census, but this is many times higher than for their counterparts in the mainstream
populations. Still, it is of interest to ask whether this pattern of employment of highly-skilled immigrants
in the lowest skilled occupations has changed in any way over time. We focus on the two lowest skill
categories common to all three microdata census files, the lowest-skilled sales and service occupations,
15
such as cashiers, ‘food couriers,’ kitchen helpers and cleaners, and manual labourers (Skill Level D in the
four-level classification in which D is the lowest; it does not include taxi drivers which is Level C). In the
1996 census, the proportion of university-educated immigrants across all cohorts working in such low
skill occupations was 3.9 percent, compared to 2.6 percent in the native-born population, larger by a
factor of 1.5. As of 2001, the percentages rose, but faster for immigrants. The proportion of university
educated immigrants rose to 6.8 percent, compared to 2.9 percent for the native-born, larger by a factor of
2.3. Finally, by 2006 the percentages of university-educated immigrants in low skill occupations declined
to 4.3 percent, but the proportion in the native-born population declined to 1.8 percent, so the immigrant
proportion is larger by a factor of 2.4. So over time, the proportion of university-educated persons in low-
skilled occupations rose and fell, but the relative proportions of immigrants in such occupations rose
steadily, from 1.5 to 2.3 and then 2.4. Generally, university-educated men are more often in low-skill
occupations than university-educated women, but among immigrants, the relative proportions are greater
among women, and grew steadily from census-to-census for both men and women.
Differences by province and skill sector. Based on more extensive policy development in certain
occupations such as health care and the sciences, and in certain provinces such as Ontario, we are
interested in variations in these trends by occupation and province. These analyses are presented in
Tables 4 and 5, respectively. The trends over time for Ontario, Quebec, and British Columbia, the three
most immigrant-intensive provinces, are similar. In Quebec, university-educated immigrants had higher
rates of success in gaining access to skilled occupations in than in British Columbia, and more in British
Columbia than in Ontario. However, comparing the most recent arrivals over time shows that recent
arrivals had more difficulty in 2006 than in 1996, common to all three provinces Probably the trend over
time is more negative in Quebec, since the new arrivals in 1996 had a much higher success rate than in
either of the other two provinces, but in 2006 it was similar across all three.
Immigrants generally are more likely to be employed in the health care or scientific occupations,
compared to the mainstream population. However for the most recently arrived immigrants, their success

16
in gaining entry into such occupations improved between 1996 and 2001, it was less in 2006 than it was
in 1996.
Trends in the Aggregate Cost of Immigrant Skill Under-utilization Due to Lost Earnings
The evidence presented above indicates that immigrant skill under-utilization has grown for two
reasons: an increase in the numbers of immigrants affected, particularly in the period 1996 to 2001, and a
decline in the success of immigrants in gaining skilled employment because of trends between 2001 and
2006. A more precise estimate of the overall magnitude of the problem can be gained by calculating the
total earnings lost to immigrants as a result of skill under-utilization in each of the three census years.
The estimate of earnings lost due to immigrant underutilization employs an Oaxaca-type
substitution procedure adapted from Reitz (2001, 369-72).2 For individuals, the immigrant-native born
earnings gap is decomposed into components based on skill quality, skill utilization, and equal pay. The
skill utilization component can then be summed across the immigrant population to determine the
aggregate financial impact. This procedure involves the use of human capital regression equations to
estimate the earnings impact of immigrants’ lower returns to education and other characteristics reflecting
human capital. The analysis is restricted to those with positive earnings.
The first step is to estimate the earnings impact of immigrants’ lower returns to human capital, by
substituting native born human capital values (regression coefficients) into the earnings prediction
equations for immigrants, separately for men and women. This estimate tells us what immigrants
2 The estimation method used here is in principle identical to one used in Reitz (2001), and is similar to or inspired by the Oaxaca decomposition method (Oaxaca, 1973) in that it uses substitute of inter-group differences in regression coefficients into regression equations to calculate their overall financial impact. However, the method used here differs from the specific procedures of the Oaxaca method. The purpose of the Oaxaca method is to decompose inter-group differences in earnings to factors related to inter-group differences in characteristics and inter-group differences in the impact of characteristics on earnings.. As the text explains, the objective here is to focus on inter-group differences in returns to characteristic, and to decompose this difference into the portion due to differences resulting from selection into particular occupations and those arising from other reasons. Because the procedure involves analysis of the role of occupational selection in a causal sequence, the procedure involves the use of a sequence of regressions involving the introduction of occupation in the equation.
17
earnings might have been, had immigrants’ education been valued as it is for the nature-born.3 This
number is then divided into two components: one due to lower access to highly skilled occupations (and
the higher earnings that go with such occupations), and the other due to lower earnings due to lower value
of immigrant education within occupational skill levels. The latter is calculated by estimating the
earnings impact of immigrant’s lower returns to education within occupations, which can be done using
an expanded set of regression equations which include occupation as a predictor. The earnings lost due to
lower access to skilled occupations is the difference between this figure and the total earnings lost due to
lower returns to education.
Focusing on education, regression results show that although the labour market value of
university credentials grew for most Canadians over the period from 1996 to 2006, it was less for
immigrants than for the native-born for both men and women throughout the period. The figures in Table
6 are based on metric regression coefficients for possession of a bachelor’s degree, and possession of a
graduate or professional degree beyond the bachelor’s degree on unlogged earnings. They are ratios of the
dollar value for immigrants to the dollar value for the native-born. For immigrant men, the dollar value of
a bachelor’s degree declined from 80 percent of native-born to 67 percent, and the dollar value of a
graduate or professional degree declined from 98 percent to 70 percent. For women, there was more
stability over time; all the ratios are in the range from 70 to 80 percent. For immigrant women, the
relative value of education is less than for men in 1996, but decline less rapidly so is actually somewhat
higher than for men in 2006. (Full regression results available from the authors on request.)
Most of the earnings disadvantages for immigrants remain after taking account of occupational
attainments, indicating that lower access to such occupations is only one component of their lost earnings.
Immigrants are paid considerably less than the native-born even when they have similar qualifications,
are at similar ages, live in the same cities, have similar language knowledge, have similar racial
3 Human capital here includes education, work experience, and language knowledge. As in the previous analysis (Reitz2001a), coefficients for urban area of residence are assumed also to reflect differences in returns to human capital. As well, the origins terms are eliminated for the native-born, to represent comparison to a group which experiences no disadvantages based on origins,
18
backgrounds and even work in the same occupational levels. However, our interest here is in the
disadvantages that arise because of lack of access to skilled occupations, and that estimate is gained by
subtracting the disadvantages for those working in skilled occupations from the overall disadvantage.
This calculation is presented in Table 7. All earnings figures are inflated to 2011 values. The overall
earnings deficits for immigrants are the amounts that immigrants would have received if their university
qualifications had the same labour market value as those of the native-born whites (row 2) over and above
the actual mean earnings (row 1). The deficit due to inequity within occupations is calculated the same
way, with occupational levels in the prediction equation (row 3). The difference is the deficit due to
lower access to skilled occupations (row 4). These deficits are then summed across the population (row
5) to yield the aggregate earnings lost due to employment in less-skilled occupations (row 6). The
aggregate earnings losses are $4.80 billion4 in 1996, rising to $6.02 billion in 2001 and as much as $11.37
billion in 2006.
The losses are greater for women than for men in each of the three calculations. This reflects the
fact noted earlier, that immigrant women with university and professional qualifications have less access
to high skilled occupations than immigrant men. However, trends for men were more negative, so the
earnings loss experience by immigrant women declined somewhat as a proportion of the total, though it
remained the largest share. Of the overall earnings lost due to lack of access to highly skilled
occupations, women absorbed 78 percent of the loss in 1996, 72 percent of the loss in 2001, and 65
percent of the loss in 2006.
Discussion and Conclusion
Our findings confirm that immigrant skill underutilization not only persists in Canada, its
magnitude has grown, and its economic significance in real terms I now more than twice what it was in
4 Note that this estimate of $4.8 differs from the figure of $2.4 billion based on the 1996 data as reported in Reitz (2001, p. 370) for two reasons. First, the measures of education were adjusted to provide exactly the same measures across the three censuses, resulting in an estimate for 1996 of $3.1 billion. Second, all figures were inflated to 2011 dollars, resulting in the increase for 1996 data from $3.1 billion to $4.8 billion.
19
the mid-1990s. Skilled immigrants are a larger proportion of the immigrant population now than they
were when the problem of ‘brain waste’ was first identified. And as they settle in Canada they are a
growing proportion of the Canadian workforce. Yet if anything, their success in gaining access to
professional and managerial occupations has declined over time; it is less in 2006 than it was in 2001.
Based on census data, the economic impact measured in total annual earnings lost due to immigrant skill
utilization has grown from about $4.80 billion in 1996 to over $11.37 billion in 2006 (all figures inflated
to May 2011 values).
Note that these census-based figures represent maximum estimates based on the assumption of
full equivalence of immigrant and native-born skill quality. Reitz (2001, pp. 363-372) suggested, based
on reviewed evidence on the equivalence of foreign education and experience, that a downward
adjustment of about one-third may be appropriate. More precise measurement of actual skill quality is
needed but remains elusive. In more limited data, lower literacy test scores for immigrants may confirm
the need for such downward adjustment (Ferrer, Green and Riddell (2006) and Bonikowska, Green and
Riddell (2008), but available estimates vary widely and represent only very rough approximations.
On balance, it seems clar that barriers to immigrant skill utilization represent a stubbornly
persistent problem. Whatever the impact of policies addressed to this problem and in place prior to 2006,
clearly they have had little aggregate effect in producing a meaningful change in direction. Given the
significance of immigration for Canadian economic development, the evaluation of current policies, and
consideration of future directions, would seem to be an urgent matter. Despite the turn in recent
immigration policy away from skilled immigration toward immigrants with arranged employment,
Canada will likely continue to have many traditional economic-class immigrants.
Many of the policy changes described above were introduced since 2006, and so any impacts are
not reflected in the analysis presented here. However, the fact that so little impact is seen in the various
initiatives up to 2006 is a cause for concern and reflection on policy directions. When the 2011 census
data become available, they will provide a more up-to-date assessment. However, the data used here come
mainly from the long-form census, and the shift to a voluntary survey means that the 2011 census may be

20
an unreliable tracking instrument for recent immigrants, particularly those who may be struggling in
employment.
There are, of course, many reasons why barriers persist. One is the sheer complexity of the
problem. Not only does each professional group have its own specific qualifications and evaluation
procedures, there are many more occupations outside the regulated professions where analytic and
problem-solving skills are sought, and where education plays an increasing role as a qualifying criterion –
jobs like sales supervision, human resource management or public relations - and in those occupations
addressing barriers to foreign-acquired skills poses even greater organizational challenges. Because of the
relative lack of systematic standards in many unregulated fields, it is more difficult for immigrants to
demonstrate the value of their specific skills.
Another source of resistance to change, undoubtedly, is the factor of racial and cultural
difference. It is known that assessment of qualifications or professional competence is affected by social
characteristics and this includes race and national origin as well as gender, age, and other individual
qualities such as height and physical attractiveness (Esses et al. 2006). When the discounting of
immigrant qualifications disproportionately affects visible minorities, as it clearly does in Canada, it is an
instance of racial discrimination. The discriminatory aspect of immigrant under-employment is clearly
illustrated in cases which have come before the Canadian Human Rights Commission. In a tribunal
finding at Health Canada in 1997, denigration of minority qualifications was one of the key pieces of
evidence. The view that ethnic minorities may possess technical qualification but often lack "soft skills"
such as communication and decision-making perspective was found to play a significant role in their low
rates of promotion to management.
One reason for the continuing lack of improvement in the skill utilization of immigrants may be
that labour market integration policies lack focus and have not been targeted based on a systematic
strategy. Immigrant service providers tend to targeted programs based on relationships to sectors and/or
employers that have evolved over time. For example, COSTI, one of the largest immigrant service
providers in Ontario, offered a program in the field of childcare mainly because its experience in that
21
area, unrelated to immigrant settlement needs. Similarly, when the Toronto Region Immigrant
Employment Council (TRIEC) initiated its Career Bridge program in 2003, it was the existing employer
networks based at Career Edge – the service provider responsible for running the program – that shaped
the range of occupations targeted by the program. The funding model in place at the federal and
provincial levels, distributing resources to local service providers who identify needs, encourages this
diffuse approach.
Recent changes in immigrant selection introduced by the government beginning in 2006 have the
objective to help get immigrants into employment more quickly, and could help reduce immigrant skill
under-utilization. In the selection of economic-class immigrants, there has been a shift in selection
criteria away from formal education toward greater emphasis on official language knowledge and
experience in particular occupational categories in current demand. These include professional fields like
medicine, dentistry and nursing, but also crane operators, drillers and blasters and heavy-duty equipment
mechanics. Second, use of temporary rather than permanent foreign workers has increased sharply, and
there are new opportunities in something called the Canadian Experience Class for successful temporary
workers to gain permanent status. Third, there is that increased role for provinces to nominate as
immigrants those they believe will contribute most to the needs of local communities.
However, notwithstanding the difficulties faced by skilled immigrants, evidence not only in
Canada but elsewhere confirms that the highly-skilled have more labour market success than less-skilled
immigrants. Although many highly-educated immigrants experience employment frustration over long
periods, the statistics consistently show they do better than less educated and unskilled immigrants.
Many of the well-educated actually do ultimately go on to achieve a significant degree of success in
Canada. As already noted, in 2006, over half of university-educated immigrants worked in professional
or semi-professional fields, and another 23 percent worked as managers, supervisors, or in other skilled
occupations. Highly-educated immigrants are the hallmark of the success of Canadian immigration, and
in the long run these immigrants will always become more successful than those without formal

22
education. Their skills mean they have greater ability to adapt to disappointment and create new
opportunities for themselves even when their skills are not recognized.
23
Table 1. Percentage of new permanent residents with a BA or higher, by entry class 1994-2009 Year Economic
(principal) Economic (spouse/dependent)
Family Refugee Other Total
1994 39 21.4 12.2 17.5 18.2 20.8 1995 48.3 27.1 12.3 13.6 11.4 25.0 1996 55 27.8 13.7 14 7.1 28.9 1997 61.6 31.4 14.7 13 5.9 33.4 1998 64.5 35.6 17.2 11.9 6.3 35.4 1999 72.4 40.6 20.4 12 4.2 40.7 2000 77.3 43.4 21.8 11.1 8.7 43.9 2001 77.5 43.8 23 12.6 11.7 45.6 2002 79.2 44.1 21.2 12.2 25.5 46.0 2003 79.9 44 28.1 11.9 21.7 44.7 2004 79.6 45 29.1 13.7 13.7 45.6 2005 79.5 44 28.6 15.8 13.1 45.8 2006 76.7 41.7 28.2 14.4 16.4 42.7 2007 74.4 40.8 31 12.2 18.3 43.0 2008 72.4 40.6 32.9 11.3 20.1 44.9 2009 68.2 39.2 33.3 11.7 19.3 43.6 2010
(summer)
Source: Citizenship and Immigration Canada. Years 1994-1995 Facts and Figures 2003; Years 1996-2005 Facts and Figures 2005; Years 2006-2009 Facts and Figures 2009