Embed Size (px)
Citation preview

© 2015 International Monetary Fund
IMF Country Report No. 15/195
GUINEA-BISSAU SELECTED ISSUES
This Selected Issues paper on Guinea-Bissau was prepared by a staff team of the International Monetary Fund. It is based on the information available at the time it was completed on June 24, 2015.
Copies of this report are available to the public from
International Monetary Fund Publication Services PO Box 92780 Washington, D.C. 20090
Telephone: (202) 623-7430 Fax: (202) 623-7201 E-mail: [email protected] Web: http://www.imf.org
Price: $18.00 per printed copy
International Monetary Fund Washington, D.C.
July 2015

GUINEA-BISSAU SELECTED ISSUES
Approved By African Department
Prepared by Tito Nicias Teixeira da Silva Filho, Felix Fischer,
Stefan Klos, and Monique Newiak, with assistance from
Fernando Morán Arce and Sandrine Ourigou (all AFR).
THE COSTS OF FRAGILITY IN GUINEA-BISSAU: CHRONIC POLITICAL INSTABILITY__ 4
A. Introduction ___________________________________________________________________________ 4
B. Fragility and Conflict ___________________________________________________________________ 5
C. Chronic Political Instability and Fragility________________________________________________ 7
D. Chronic Political Instability: Key Channels of Transmission _____________________________ 9
E. The Cost of Chronic Political Instability ________________________________________________ 11
F. Conclusion ____________________________________________________________________________ 12
FIGURES
1. A Graphical Profile of Systemic Political Instability _____________________________________ 5
2. Chronic Political Instability in Guinea-Bissau ___________________________________________ 6
3. Fragility Has Severely Hindered Social Development in Guinea-Bissau _________________ 8
4. Chronic Political Instability and Per Capita GDP Growth ________________________________ 9
5. Chronic Political Instability and Fragility: Channels of Transmission ___________________ 10
6. GDP Per Capita (Constant Prices; 1990 = 100): ________________________________________ 11
TABLE
1. Estimates of the Cost of Chronic Political Instability on GDP Per Capita during
2000–13 _______________________________________________________________________________ 12
REFERENCES ____________________________________________________________________________14
EXTERNAL STABILITY ASSESSMENT ___________________________________________________15
A. Recent Economic Developments and Outlook ________________________________________ 15
B. External Sustainability Assessment ____________________________________________________ 16
C. Non-Price Competitiveness ___________________________________________________________ 17
D. Conclusions ___________________________________________________________________________ 18
CONTENTS
June 24, 2015

GUINEA-BISSAU
2 INTERNATIONAL MONETARY FUND
FIGURES
1. Recent External Developments ________________________________________________________ 19
2. External Outlook ______________________________________________________________________ 20
3. External Stability Assessment __________________________________________________________ 21
4. Doing Business and Access to Communication Infrastructure _________________________ 22
5. Country Policy and Institutional Assessment __________________________________________ 23
FINANCIAL STABILITY, INCLUSION, AND DEEPENING _______________________________24
A. Financial Sector Stability ______________________________________________________________ 24
B. Private Sector Credit Depth ___________________________________________________________ 27
C. Access to Financial Services ___________________________________________________________ 30
D. Conclusions ___________________________________________________________________________ 37
BOXES
1. Kenya’s M-PESA Experience ___________________________________________________________ 34
2. Components of an Oversight Framework for Mobile Payments _______________________ 35
FIGURES
1. Indicators of Financial Soundness _____________________________________________________ 26
2. Compliance with Key Prudential Norms, June 2014 ___________________________________ 27
3. Private Sector Growth and Financial Intermediation ___________________________________ 28
4. Actual and Implied ____________________________________________________________________ 28
5. Factors which Close the Financial Gap_________________________________________________ 28
6. Access to Financial Services ___________________________________________________________ 31
7. Access of Firms’ Financial Services ____________________________________________________ 32
8. Cost of Credit in Guinea-Bissau _______________________________________________________ 33
9. Potential for Mobile Payments ________________________________________________________ 34
10. Doing Business ______________________________________________________________________ 36
TABLE
1. Determinant of Financial Inclusiveness Gaps, 2004–13 ________________________________29
REFERENCES ____________________________________________________________________________38
ECONOMIC DIVERSIFICATION _________________________________________________________39
A. Growth, Volatility, and Productivity ___________________________________________________ 39
B. Recent Trends in the Structure of Output and Exports ________________________________ 41
C. Fostering Economic Diversification in Guinea-Bissau __________________________________ 44
D. Conclusions ___________________________________________________________________________ 47
BOXES
1. Export Diversification and Quality _____________________________________________________ 42
2. Reforms which Foster Structural Transformation ______________________________________ 45

GUINEA-BISSAU
INTERNATIONAL MONETARY FUND 3
FIGURES
1. Real Growth ___________________________________________________________________________ 39
2. Drivers of Economic Growth __________________________________________________________ 40
3. Output Diversification _________________________________________________________________ 41
4. Export Product and Partner Diversification ____________________________________________ 43
5. Export Quality _________________________________________________________________________ 44
REFERENCES ____________________________________________________________________________ 48

GUINEA-BISSAU
4 INTERNATIONAL MONETARY FUND
THE COSTS OF FRAGILITY IN GUINEA-BISSAU:
CHRONIC POLITICAL INSTABILITY1
Guinea-Bissau is one of the most fragile countries in the world. Behind its fragility condition lays a
history of chronic political instability in its most extreme form: recurrent ruptures of the constitutional
order through coups d’état. This note aims at identifying some of the main channels of transmission
through which political instability feeds and foster fragility, and provide an estimate of the “fragility
gap” that haunts the Bissau-Guinean society.
A. Introduction
1. While experts agree that fragility hinders growth and development prospects, its
definition is not straightforward. Fragility is a difficult-to-define concept, mainly because it has a
multidimensional nature. For example, a country could be fragile due to its size (e.g. a small island),
unprivileged geographical position (e.g. prone to earthquakes or hurricanes), structure of its
economy (e.g. low diversification), low educational level of its inhabitants, poor infrastructure and
public services, weak institutions, internal conflicts, etc. According to Naudé and McGillivray (2011)
the major causes of state fragility are conflict, low development status, vulnerability, and the lack of
a developmental state. Moreover, the importance of each factor varies over time for a given country
and between countries, and many could be at work at the same time. More importantly, while some
factors require a long time to tackle or overcome others, in principle, could have a faster resolution.
Despite the multitude of fragility concepts, they all lead to the same conclusion: fragility hinders
growth and development prospects
2. To tackle fragility in Guinea-Bissau it is useful to analyze both, its causes and its costs.
Guinea-Bissau is one of the most fragile countries in the world. As a consequence, it has barely
progressed in the last decades, mainly when compared to its peers. In order for a fragile country to
overcome this condition, it is crucial not only to identify the main causes behind its fragility but also
to assess their costs. The latter can be seen as opportunity cost for a failed security sector reform.
3. This paper argued that, until today, due to chronic political instability, Guinea-Bissau
has been in a costly fragility trap. This analytical piece argues that the major factor behind
Guinea-Bissau’s fragility has been the chronic political instability. It also uncovers some of the main
transmission channels from political instability to fragility, and provides simple estimates about the
cost of instability.
1 This note was prepared by Tito Nicias Teixeira da Silva Filho.

GUINEA-BISSAU
INTERNATIONAL MONETARY FUND 5
B. Fragility and Conflict
4. The literature on the causes and costs of fragility has paid particular attention to
violent conflict as one of its major causes. The bulk of that literature focuses on the costs of
violent conflicts, typically civil wars. Undoubtedly, the harmful consequences of violent conflicts are
self-evident, be it in the destruction of physical capital or in the loss of numerous lives. In this
regard, Abadie and Gardeazabal (2003) estimated the costs of the terrorism in the Basque country,
and found that over 30 years the region’s GDP per capita could have been 10 percent higher. Lopez
and Wodon (2005) concluded that, had the 1994 genocide not existed, Rwanda’s GDP (back in 2001)
could have been 25 percent higher. Collier (1999) estimated that, on average, during civil conflicts
the economy’s annual growth rate reduces by about 2.2 percent. Moreover, Bigombe et al. (2000)
found that, in Africa, there is a 50 percent chance of civil conflict recurrence within the ten years
after reaching peace. In its turn, Akkaya et al. (2011) estimated the monetary costs for Palestine of
the long Israeli-Palestinian conflict and found them to be very significant.
Figure 1. Guinea Bissau: A Graphical Profile of Systemic Political Instability
Since independence no president has completed his term in Guinea-Bissau. From 1974 to 2014 the country has had five elected
presidents, five interim presidents, one transition president, four coups d’état.
5. Nonetheless, there is another type of conflict—many times not involving any loss of
lives—that also impinges large costs on an economy and on a country’s social fabric. This type
of conflict stems from political instability in its most extreme forms: a coup d’état. Its costs are not as
explicit as those stemming from longer violent conflicts are, even so it is a powerful growth
deterrent as well. It stands out for three main reasons. First, like civil wars, coups d’état are discrete
events that can produce important throwbacks on growth and development prospects. Second,
unlike civil wars, its true costs are not obvious to the general population, which makes it harder for a
society to build an effective social technology (or consensus) to curb it. Third, in spite of that, like
0.0
0.5
1.0
1.5
2.0
2.5
3.0
3.5
4.0
1974
1975
1976
1977
1978
1979
1980
1981
1982
1983
1984
1985
1986
1987
1988
1989
1990
1991
1992
1993
1994
1995
1996
1997
1998
1999
2000
2001
2002
2003
2004
2005
2006
2007
2008
2009
2010
2011
2012
2013
Alleged coup plots Thwarted coup plots Unsuccessful coups d’état Coups d’état
Civil War(6.17.1998 - 5.10.1999)
Independence

GUINEA-BISSAU
6 INTERNATIONAL MONETARY FUND
civil wars, chronic political stability is subject to sudden stops if a wide internal understanding about
its harmful effects emerges.
6. Chronic political instability has been a hallmark of the Guinea-Bissau’s society
(Figure 1). An important hurdle behind fragility, chronic political instability, could, in principle, be
overcome not within a generation but rather within a much shorter time span. Unfortunately,
despite this theoretical possibility, the assessment made by Bigombe et al. (2000) on the high
probability of recurrence of civil wars has also proven to be valid to coups d’état. Indeed, at least in
the Guinea-Bissau case, coups d’état and attempts to break the constitutional order have been
pervasive.
Figure 2. Chronic Political Instability in Guinea-Bissau
Before the 2012 coup, Guinea-Bissau had already been ranked among the countries whose Governments were most vulnerable to social and political instability.
In 2014 Guinea-Bissau was placed in the last positions on the perception of the likelihood of political instability.
Source: The Economist
Source: The Worldwide Governance Indicators (World Bank)
In 2014, Guinea-Bissau was considered to have one of the lowest degrees of peace (i.e. the level of harmony or discord within a nation).
Source: Institute for Economics & Peace
7. Guinea-Bissau is one of the most politically unstable countries in the world. As Figure 2
shows, back in 2010, that is, before the last coup, the country had already been ranked among the
20 most vulnerable countries to political instability (panel A). Moreover, other instability proxies
14
19
82%
83%
84%
85%
86%
87%
88%
89%
0
2
4
6
8
10
12
14
16
18
20
2007 2010
A. The Political Instability Index: Guinea Bissau
Rank (Left) Percentile (right)0%
5%
10%
15%
20%
25%
30%
35%0
20
40
60
80
100
120
140
160
180
200
1996
1997
1998
1999
2000
2001
2002
2003
2004
2005
2006
2007
2008
2009
2010
2011
2012
2013
Ranking (Left) Percentile (Right)
B. Political Stability and Absence of
Violence/Terrorism: Guinea Bissau
145 160
0%
2%
4%
6%
8%
10%
12%0
20
40
60
80
100
120
140
160
180
Overall Rank Political Instability Rank
C. Global Peace Index (2014): Guinea-Bissau
Overall Rank (Left) Percentile (Right)

GUINEA-BISSAU
INTERNATIONAL MONETARY FUND 7
show that the situation has deteriorated further in recent years. Since early 2000s, there has been an
increase in the probability assessment of political instability (panel B), and last year Guinea-Bissau
was considered to be among the 10 percent of countries with the lowest levels of peace.
C. Chronic Political Instability and Fragility
8. Recurrent coups d’état lead to a failing state. The reasons why political instability—in the
form of recurrent coups d’état—is so harmful lies in the very fact that the motivation behind
breaking the constitutional order is the worst possible. Recurrent coups d’état reflect a society in
which the relentless pursuit of power, and rent seeking at any cost, are pervasive, leading to the
dismantling of the state or, in other words, to a failing state. It reflects the de facto absence of any
meaningful and binding social contract.
9. The transition period after coups d’état is particularly harmful. From the moment a coup
d’état takes place to the resumption of democratic normalcy, corruption and rent seeking soar,
vested interests prevail, governance shatters, and weak institutions degrade further. During this
transition period, adverse selection works at its best (or, better, at its worst). Corruption becomes
epidemic and materializes in several ways, from plain stealing of public resources to loose
enforcement of the law (e.g. less fiscalization). In addition, laws and regulations change or are
overlooked to benefit groups and individuals (e.g. tax exemptions and fiscal amnesty).
10. The incentives facing transition governments do not align to those of the population.
Governance sharply worsens during transition periods, as regardless of whether the government
does a good job or not, it is not entitled to reelection. Indeed, a successful transition government is
precisely a short one, but the agenda behind the coup is about staying in power. Accountability is
also impaired, as the transition government was not elected through voting. Finally, chronic political
instability means that public policies are often discontinued hampering reforms and long term
planning.
11. Transition periods often last long. Adverse (self) selection and perverse incentives help to
explain why transition governments often stay so long in power. The most recent transition period in
Guinea-Bissau persisted for more than two years, while the country was slowly sinking. It also helps
in understanding the low effectiveness of some advocated responses to tackle fragility. For example,
one suggestion found in the literature is for the international community to invest in state capacity
building. The recent Bissau-Guinean experience, however, has shown that even intense technical
assistance is unable to get traction in helping building institutions2 in an environment where low
human capital melts with brittle institutions, widespread rent seeking behavior and corruption.
12. Guinea-Bissau has failed to provide basic public services to its citizens. Figure 3 shows
striking evidence on the failure of a fragile state to provide basic public services to its citizens.
2 See findings in technical assistance reports Kone et al. (2014); Pialarissi et al. (2014); Russell and Calvet (2014).

GUINEA-BISSAU
8 INTERNATIONAL MONETARY FUND
Guinea-Bissau not only remains as one of the most fragile countries in the world (panel A), but also
has not been able to keep up with its peers. Poverty has increased in the last decade, in sharp
contrast to the regional evidence (panel B). Consequently, human development has stalled, and the
country is increasingly lagging behind its peers (panel C). The above results are even more
meaningful when one realizes that these rankings also include countries involved in wars. It should
be clear by now that Guinea-Bissau will miss the Millennium Development Goals.
Figure 3. Fragility Has Severely Hindered Social Development in Guinea-Bissau
Guinea-Bissau is amongst the most fragile countries in the world, and fragility has increased in the last years.
As a consequence, poverty has increased in recent years, a fact that puts Guinea-Bissau at odds with the evidence from the region.
Source: The Fund for Peace
Source: World Bank
Guinea-Bissau's social gap to peers countries has been increasingly widening as social progress has stalled in the last decade.
Source: United Nations
13. Guinea-Bissau’s Per Capita GDP has stagnated since 2000. Given that social progress
depends on economic performance, one should expect very modest figures for Guinea-Bissau’s GDP
growth. Disregarding the sharp drop and recovery due to the 1998–99 civil war, real GDP per capita
growth has been hovering around zero since 2000 (Figure 4). More specifically, note that the
heightened instability in 2000 had a clear impact on growth, and the GDP loss associated with the
2012 coup was significant.
0%
2%
4%
6%
8%
10%
12%
14%
16%
18%
20%1
6
11
16
21
26
31
36
2008 2009 2010 2011 2012 2013 2014
A. Fragile States Index: Guinea-Bissau
Ranking (Left) Percentile (Right)
0
10
20
30
40
50
60
70
GNB WAEMU SSA
2001-2003 2009-2011
B. Poverty Headcount Ratio at National Poverty Lines
(% of population)
0.0
0.1
0.2
0.3
0.4
0.5
0.6
2005 2008 2010 2011 2012 2013
Guinea-Bissau Sub-Saharan Africa WAEMU (ex-GNB)
C. Human Development Index

GUINEA-BISSAU
INTERNATIONAL MONETARY FUND 9
Figure 4. Chronic Political Instability and Per Capita GDP Growth
Source: IMF
D. Chronic Political Instability: Key Channels of Transmission
14. Chronic political instability is detrimental to growth in several ways, but measurement
is challenging. Some channels, by their own nature, are hard to measure, such as wasted resources
due to corruption and rent seeking, or the inefficiency caused by non-optimal decisions due to bad
governance. Corruption, bad governance and policy discontinuity are also powerful deterrents to
reforms. In their report on structural reforms in customs, Russell and Calvet (2014) warn: “This
mission could not observe any progress in resolving identified recurrent problems since 2012 [the
year of the last coup]”.3 The growth effects of the non-implementation of reforms are difficult to
measure, despite their large importance to economic performance. On the other hand, other
channels are easier to capture.
15. Financing and investment are two key transmission channels from political instability
to fragility. During periods of acute political instability domestic revenues and grants decline,
particularly the latter (Figure 5, panels A and B). That further reduces the already limited
government’s capacity to spend and invest (panel C). The decline in public investment is particularly
steep in the three years following the 2003 coup. In addition, after a rebound, public investment
sharply declined again during the turbulent 2008–13 period. Although the dynamics of private
investment is not as timely as that of public investment, note that its level remains low throughout
the sample, reflecting the endemic uncertainty that entrepreneurs face in Guinea-Bissau. Moreover,
the microeconomics of both types of investment is different. Public investment dynamics basically
3 Author’s translation.
0
50
100
150
200
250
300
350
400
-25%
-20%
-15%
-10%
-5%
0%
5%
10%
15%
20%
19
97
19
98
19
99
20
00
20
01
20
02
20
03
20
04
20
05
20
06
20
07
20
08
20
09
20
10
20
11
20
12
20
13
20
14
Thwarted coup plots Alleged coup plots Unsuccessful coups d’état Coups d’état Real GDP (per capita)

GUINEA-BISSAU
10 INTERNATIONAL MONETARY FUND
mimic the availability of resources (i.e. grants); while on the other hand, one would expect the
funding of private investment to decline before it takes place.4
Figure 5. Chronic Political Instability and Fragility: Channels of Transmission
A. Political instability adversely affects fiscal pressure and external financing...
B. ... as both budget support and project grants are hardly hit during episodes of acute political instability.
Source: IMF
Source: IMF
C. Consequently, investment ratios remain low as uncertainty fails to dissipate during chronic political instability periods.
Source: IMF
4 There are serious data limitations as private investment is often a residual.
0
50
100
150
200
250
300
350
400
0%
2%
4%
6%
8%
10%
1997
1998
1999
2000
2001
2002
20
03
2004
2005
2006
2007
2008
2009
20
10
2011
2012
2013
Alleged coup plots Unsuccessful coups d’état
Coups d’état Real Public Investment (% GDP)
Real Private Investment (% GDP)
0
50
100
150
200
250
300
350
400
0%
2%
4%
6%
8%
10%
12%
14%
16%
18%
19
91
19
93
19
95
19
97
19
99
20
01
20
03
20
05
20
07
20
09
20
11
20
13
Alleged coup plots Unsuccessful coups d’étatCoups d’état Domestic RevenueGrants
0
50
100
150
200
250
300
350
400
0%
2%
4%
6%
8%
10%
12%
19
91
19
93
19
95
19
97
19
99
20
01
20
03
20
05
20
07
20
09
20
11
20
13
Alleged coup plots Unsuccessful coups d’étatCoups d’état Project grantsBudget Support

GUINEA-BISSAU
INTERNATIONAL MONETARY FUND 11
E. The Cost of Chronic Political Instability
16. Until today, Guinea-Bissau has been stuck in a fragility trap. Economic growth has
stalled since 2000. This outcome is per se appalling evidence. However, it does not say anything
about Guinea-Bissau’s relative performance, or to put it differently, about the true economic cost of
political instability. Figure 6 compares Guinea-Bissau’s economic performance with those of former
Portuguese colonies in Africa, and the evidence is jaw-dropping. Guinea-Bissau has not only been
stagnant, but is been increasingly left behind by the other former colonies.
Figure 6. GDP Per Capita (Constant Prices; 1990 = 100): Former African Portuguese Colonies
1
1. São Tomé’s data begin in 2000, and was set to equal Guinea-Bissau’s at that year.
Source: World Bank and IMF
17. Guinea-Bissau’s development path could have been similar to other former African
Portuguese colonies. Obviously, even though each country has its own history and characteristics,
those differences can sharpen this qualitative assessment, and some are worth mentioning. First,
Guinea-Bissau was the first Portuguese colony in Africa to become independent. One would expect
this to have a positive effect on growth. Second, even though São Tomé and Príncipe and Cabo
Verde did not have civil wars—which evidently helped their development—both Angola and
Mozambique went through very long and destructive civil wars, while Guinea-Bissau’s civil war
lasted only eleven months.5 Moreover, unlike Guinea-Bissau, after the war ended those two
5 On the other hand, São Tomé and Príncipe is a very small island, which certainly hinders its growth prospects.
50
75
100
125
150
175
200
225
250
275
300
325
350
375
400
1990 1992 1994 1996 1998 2000 2002 2004 2006 2008 2010 2012
Guinea-Bissau Cabo Verde Mozambique Angola São Tomé and Príncipe
Civil Wars
Angola: 11.11.1995 - 4.4.2002
Mozambique: 5.30.1977 - 10.4.1992
Guinea-Bissau: 6.7.1998 - 5.10.1999

GUINEA-BISSAU
12 INTERNATIONAL MONETARY FUND
countries began to grow faster, catching up with their peers.6 In Guinea-Bissau, after the end of the
civil war, growth, that had already been poor before the war, deteriorated further.
18. What could have been the economic performance in GNB in the absence of chronic
political instability? A reliable answer is very difficult, but two simple and feasible counterfactuals
could be very useful in providing an idea on the magnitude of the “instability gap”. The first one
assumes that Guinea-Bissau’s real GDP per capita could have grown, on average, at the same pace
as the average real GDP per capita growth in the other former Portuguese colonies, during 2000–13.
The second counterfactual assumes an average growth rate equal to the one achieved by the so-
called low-income countries (LIC). This is a sensible counterfactual, given that those countries have
faced several constraints and challenges relevant for Guinea-Bissau. They should provide a plausible
interval estimate of what could have feasibly been the average growth in Guinea Bissau in the
absence of chronic political instability during the 2000–13 period.
Table 1. Estimates of the Cost of Chronic Political Instability
on GDP Per Capita during 2000–13
(in percent)
GDP
Growth
Annual Growth
Cost
Total Growth
Cost
Actual -0.3% – –
Counterfactual 1 4.3% 4.7% 89.5%
Counterfactual 2 3.3% 3.6 % 65.2%
19. The estimated “instability gap” is substantial (Table 1). Without a history of chronic
political instability Guinea-Bissau’s GDP per capita at constant prices in 2013 could have been higher
between 65% and 90%. Note that this interval reflects a difference built since 2000 (i.e. after the end
of the civil war). The loss in GDP growth would be even more significant if we also included in the
estimate the effects of the civil war.
F. Conclusion
20. Until today, Guinea-Bissau has been stuck in a fragility trap. Although fragility is a
multidimensional condition, chronic political instability—in the form of recurrent coups d’état—has
been a major factor hampering growth and social progress in Guinea-Bissau. GDP per capita has
been stagnant for more than two decades. Not surprisingly, peer countries have increasingly left
Guinea-Bissau behind.
21. The incentives behind recurrent coups d’état are the worst possible. They reflect a
society in which the relentless pursuit of power and rent seeking at any cost is the norm. There is a
6 Angola’s economic performance has benefited from oil discoveries.

GUINEA-BISSAU
INTERNATIONAL MONETARY FUND 13
clear problem of (self and forceful) adverse selection. After a long transition period—which truthfully
reveals the main drivers behind coups d’état—Guinea-Bissau finds itself, once again, at a decisive
moment: can it this time break from its past of instability?
22. Estimates based on reasonable assumptions reveal that, considering only Guinea-
Bissau’s post-war period, without chronic political instability real GDP per capita could have
been at least two thirds higher than its 2013 level. This assessment shows the crucial importance
of the security sector reform (and other governance-increasing, rent-seeking inhibiting reforms). It
also shows that the current estimated cost of the security sector reform is modest in comparison,
since it puts into perspective its monetary costs—which are easy to calculate and mostly front-
loaded—vis-à-vis its wide and deep benefits, which are not as explicit and accrue over time.

GUINEA-BISSAU
14 INTERNATIONAL MONETARY FUND
References
Abadie, A. and J. Gardeazabal, (2003); “The Economic Costs of Conflict: A Case Study of the Basque
Country”, American Economic Review, Vol. 93(1).
Akkaya, S., N. Fiess, B. Kaminski, and G. Raballand, (2011); “Fragility and Conflict in Palestine: The
Costs of the Closures Regime on West Bank and Gaza”; in W. Naudé, A. U. Santos-Paulino, and
M. McGillivray (eds). Fragile States: Causes, Costs, and Responses, Oxford University Press,
Oxford.
Bigombe, B., P. Collier, and N. Sambanis (2000); “Policies for Building Post-Conflict Peace”; Journal of
African Economies Vol. 9, No. 3.
Collier, P., (1999); “On the Economic Consequences of Civil War”; Oxford Economic Papers, Vol. 51.
Kone, B., B. Wiest, A. Benbrik, and D. Mendes, (2014); “Guiné Bissau: Aperfeiçoar a Execução e o
Controlo do Orçamento do Estado”, Fiscal Affairs Department, International Monetary Fund,
January.
Lopez, H. and Q. Wodon, (2005). “The Economic Impact of Armed Conflict in Rwanda”, Journal of
African Economies 14(4).
Naudé, W. and M. GcGillivray, (2011). “Fragile States: An Overview”, in W. Naudé, A. U. Santos-
Paulino, and M. McGillivray (eds). Fragile States: Causes, Costs, and Responses, Oxford
University Press, Oxford.
Pialarissi, D. R., J. C. de la Fuente, and S. L. M. de Lima, (2014); “Guiné Bissau: Planeamento e
Recomendações Estratégicas”; Fiscal Affairs Department, International Monetary Fund,
September.
Russell, J. and B. Calvet, (2014); “Republique de Guinée-Bissau: Compte-Rendu de Mission
D’Assistance Technique en Administration Douaniere”, AFRITAC de l’Ouest, International
Monetary Fund, September.

GUINEA-BISSAU
INTERNATIONAL MONETARY FUND 15
EXTERNAL STABILITY ASSESSMENT1
After severe balance of payments pressures in 2012 and 2013, due to a decline in the international
price of cashew, Guinea-Bissau’s main export product, combined with political uncertainty after the
2012 coup, exports have recovered and support by international partners has returned. While imports
have also been strong, a significant increase in current transfers moderated the current account deficit
in 2014, and the balance of payments recorded an overall surplus. In the medium-term, financing
needs would increase significantly as terms-of-trade are projected to deteriorate and import demand
to remain strong due to continued robust growth and large—mainly officially funded—infrastructure
investment needs. The real effective exchange rate appears broadly in line with fundamentals in the
short-term. The economy remains vulnerable to shocks due to high export concentration and the
country’s fragile status. The business environment remains difficult. To safeguard external stability in
the medium term, policies targeting the diversification of the economy combined with improvement in
non-price competitiveness will be critical.
A. Recent Economic Developments and Outlook
1. Pressures on Guinea-Bissau’s balance of payments moderated significantly in 2014
(Figure 1). After severe external pressures due to the decline of cashew nut prices by more than
40 percent between 2011 and 2013, Guinea-Bissau’s terms of trade improved by more than
30 percent in 2014, and exports recovered. Imports also grew substantially (by almost 31 percent in
real terms), driven by a more favorable growth outcome and substantial demand for fuel. As a result,
the trade deficit widened from 7.7 percent of GDP in 2013 to 9.7 percent in 2014. Current transfers
more than doubled in nominal terms compared to their 2013 level and reached 7 percent of GDP
due to a strong increase in budget grants and continued robust private transfers. Consequently, the
current account deficit including grants is estimated to have declined to 1.2 percent of GDP in 2014,
down from 4.4 percent in 2013. The balance of payments recorded a significant surplus.
2. Financing needs are expected to increase in the medium term, driven by a scaling up
of public investment and a weakening in the terms of trade (Figure 2). Large public
investments, financed through project grants and concessional borrowing, and a further increase of
real growth to around 5 percent would boost imports in the medium-term. Exports values, while
projected to rise significantly due to a favorable outlook for cashew prices in 2015, would stay
relatively flat in the medium term. The current account deficit would expand to an average of more
than 5 percent of GDP per year during 2015–19. The current account deficit would be driven on
average mainly by a public savings-investments gap, while the private savings-investments gap
would decline as well.
1 Prepared by Monique Newiak.

GUINEA-BISSAU
16 INTERNATIONAL MONETARY FUND
3. Guinea-Bissau’s external position remains vulnerable to a range of risks. A stable
political and security situation is the necessary condition for a sustainable external position. From
the macroeconomic perspective, Guinea-Bissau’s very high export concentration in cashew nuts
(85 to 99 percent of exports) poses the main risk to external stability as it leaves the country
vulnerable to international price fluctuations. An increase in currently favorable oil prices could exert
pressure on the current account as the economy is highly dependent on the import of petroleum
products. In the medium term, continued flows of grants and access to concessional loans will be
necessary to finance huge infrastructure development needs which in turn constitute the
precondition for developing Guinea-Bissau’s export base.
B. External Sustainability Assessment
Based on the external balance assessment for developing and emerging markets (EBA-lite), Guinea-
Bissau’s real effective exchange rate (REER) appears to be broadly in line with the country’s
fundamentals.
4. To assess the stance of the current account for Guinea-Bissau, this note uses the “EBA-
lite” methodology (Figure 3). The fitted values resulting from this exercise capture the current
account deficit dynamics well, but there are substantial differences between the actual current
account in percent of GDP compared to the levels implied by the regression. In the more recent
years, the implied levels exceed the actual levels, implying that countries with similar characteristics,
such as demographics, institutions and size of private and public transfers and fiscal stance,
openness to trade and terms of trade movements, have, on average, experienced somewhat lower
current account deficits.
5. Based on the EBA-lite approach, Guinea-Bissau’s current account stance in 2015 can be
decomposed as follows:
in which is the current account misalignment, is the predicted value from the
regression above and relates a country’s actual policies not only to its optimal policies,
but also to the average policy misalignment in the rest of the world.
6. For most policies, staff expects no policy gap for Guinea-Bissau in 2015. On the national
level, this note assumes that the projected cyclically adjusted fiscal stance, the degree of capital
controls and the accumulation of official net foreign assets is in line with staff’s recommendations,
so that any policy gaps incorporated into the approach would stem from differences in policies
compared to the rest of the world. For the level of credit to the private sector to GDP, however, a
benchmark level of 22 percent is set as the optimal “policy” variable, in line with its benchmark level
obtained Section III on financial stability, depth and inclusion, and which is substantially above the
projected level of private sector credit to GDP of 11 percent of GDP in 2015.

GUINEA-BISSAU
INTERNATIONAL MONETARY FUND 17
7. The EBA-lite approach suggests that Guinea-Bissau’s REER would be broadly in line
with its fundamentals in 2015. The current account benchmark implied by the EBA-lite approach is
-2.7 percent of GDP, of which -1.5 percent of GDP are driven by the policy gap and another
-1.2 percent by Guinea-Bissau’s macroeconomic fundamentals. The actual current account deficit is
projected to rise to 3.6 percent of GDP in 2015. The implied misalignment of the current account is
therefore -0.9 percent of GDP, implying a statistically insignificant 6.5 percent over-valuation of the
REER.2 Such an over-valuation is considered to be within the margin of error, and the REER thus
appears to be broadly in line with the Guinea-Bissau’s fundamentals.
8. As Guinea-Bissau’s is part of a monetary union, its exchange rate should also be seen
in the context of the external stability of the WAEMU as whole (IMF, 2015b). As a member of a
currency union, and being the smallest player in it, Guinea-Bissau’s external position also depends
on the other WAEMU members’ performance. An assessment of the WAEMU as a whole suggests
that the external position remains sustainable but vulnerabilities have increased. The region’s
exchange rate appears broadly in line with fundamentals, but its external buffers have been
shrinking: the BCEAO’s gross international reserves (GIR) coverage decreased from 6.6 months of
imports in 2010 to 4.6 months of imports in 2014; commercial banks’ net foreign exchange position
has declined significantly in 2014 and turned negative. The level of GIR is below optimal based on
standard metrics (5 to 12 months of imports).3 However, GIR are still significantly higher than the
floor that acts as a warning signal under the zone’s monetary arrangement with France (84 percent
of narrow money compared with 20 percent).
C. Non-Price Competitiveness
9. The business climate in Guinea-Bissau remains difficult (Figure 4 and 5). Guinea-Bissau’s
relative rating in the Doing Business ranking has deteriorated compared to the last assessment; only
10 out of 189 countries evaluated are currently ranked worse.4 Getting access to electricity, starting a
business and enforcing contracts are particularly challenging areas compared to other WAEMU
countries and a benchmark group of fast growing African economies.5 Guinea-Bissau’s institutions
and policies are also consistently ranked weaker than in other WAEMU countries in the Country
Policy and Institutional Assessment. Considering that Guinea-Bissau cannot devalue its currency as it
is part of a monetary union, improvements in these areas will be even more critical for the private
2 -3.6 - (-2.7) = -0.9. The assumed elasticity of the current account to movements in the real exchange rate is -0.13.
3 Given the commitment of France to back the convertibility of the CFA franc this metric does not fully apply for the
WAEMU. For details on the metric, see Dabla-Norris, Kim and Shorono (2011): “Optimal Precautionary Reserves for
Low-Income Countries: A Cost-Benefit Analysis,” International Monetary Fund, Working Paper WP/11/249.
4 Doing Business indicators should be interpreted with caution because of the limited number of respondents, a
limited geographical coverage, and standardized assumptions on business constraints and information availability.
5 These benchmarks include Ghana, Kenya, Lesotho, Rwanda, Tanzania, Uganda, and Zambia.

GUINEA-BISSAU
18 INTERNATIONAL MONETARY FUND
sector’s development and economic diversification which are the necessary conditions to make
Guinea-Bissau an economy which is more resilient to shocks (Section IV).
D. Conclusions
10. The REER appears broadly in line with fundamentals, improvements in non-price
competitiveness will be necessary to safeguard stability in the medium term. Based on the
external balance assessment for developing and emerging markets (EBA-lite), Guinea-Bissau’s real
effective exchange rate (REER) appears to be broadly in line with the country’s fundamentals.
However, the economy remains exposed to shocks due to high export concentration and the
country’s fragile status, and the business environment remains difficult. To safeguard external
stability in the medium term, policies targeting the diversification of the economy combined with
improvement in non-price competitiveness will therefore be critical.

GUINEA-BISSAU
INTERNATIONAL MONETARY FUND 19
Figure 1. Guinea-Bissau: Recent External Developments
After a sharp decline the last two years, cashew nut exports recovered in 2014, ...
... but the trade balance deteriorated slightly due to higher imports driven by higher growth and external financing.
The current account balance is estimated to have improved substantially due to higher current transfers, ...
... driven mainly by a resumption in support by official international partners.
With an increase in official financing (other investment), the balance of payments recorded a substantial surplus, ...
... so that imputed net official assets increased significantly in Guinea-Bissau, as did commercial banks NFA.
-40
-30
-20
-10
0
10
20
30
40
0
20
40
60
80
100
120
140
160
2011 2012 2013 2014
Perc
en
tag
e C
han
ge
Billio
ns
of
FC
FA
Cashew Exports
Terms of Trade (RHS)
Terms of Trade and Cashew Exports, 2011-2014(Percentage Change and Billions of FCFA)
Sources: Guinea-Bissau authorities; and IMF staff estimates.
-80
-60
-40
-20
0
20
40
2011 2012 2013 2014
Export of Goods Import of Goods
Export of Services Import of Services
Goods and services balance
Trade Balance, 2011-2014(In Percent of GDP)
Sources: BCEAO, Guinea-Bissau authorities and staff estimates.
-15
-10
-5
0
5
10
15
2011 2012 2013 2014
Goods and services balance
Investment income (net)
Total Current Transfers
Current Account
Current Account Balance, 2011-2014(In Percent of GDP)
Sources: BCEAO, Guinea-Bissau authorities; and staff estimates.
0
1
2
3
4
5
6
7
8
2011 2012 2013 2014
Official Current Transfers, Net
Private Current Transfers, Net
Total Current Transfers
Current Transfers, 2011-2014(In Percent of GDP)
Sources: BCEAO, Guinea-Bissau authorities and staff estimates.
-15
-10
-5
0
5
10
15
20
2011 2012 2013 2014
Capital Account
Direct investment
Other investment
Errors and Omissions
BOP deficit ("-" surplus)
Current Account Deficit
Sources of Financing, 2011-2014(In Percent of GDP)
Sources: BCEAO, Guinea-Bissau authorities; and staff estimates.
0
20
40
60
80
100
120
140
160
180
2011 2012 2013 2014
NFA Commercial Banks
NFA BCEAO
NFA
Sources: BCEAO and Guinea-Bissau authorities .
Net Foreign Assets, 2011-2014(In Billions of FCFA)

GUINEA-BISSAU
20 INTERNATIONAL MONETARY FUND
Figure 2. Guinea-Bissau: External Outlook
Foreign financing and associated investment plans are expected to increase strongly in the medium-term ...
... boosting imports of capital goods into the country.
The value of cashew exports is projected to remain flat, given somewhat weaker terms of trade.
As a results, the current account deficit would widen substantially in the medium-term, ...
... with pressure arising mainly from the public sector but also from a declining private savings-investments balance.
The BOP surplus would decline.
0.0
0.5
1.0
1.5
2.0
2.5
3.0
3.5
0
1
2
3
4
5
6
7
8
9
2014 2015 2016 2017
Capital expenditure and net lending
Foreign Financing (RHS)
Public Capital Expenditure and Foreign Financing(In Percent of GDP)
Sources: Guinea-Bissau Authorities and IMF staff estimates and projections.
-35
-30
-25
-20
-15
-10
-5
0
2014 2015 2016 2017
Food imports Petroleum products
other, including capital Import of Goods
Goods Imports, 2014-2019(In Percent of GDP)
Sources: BCEAO, Guinea-Bissau authorities and staff estimates/projections.
-5
0
5
10
15
20
25
30
35
0
20
40
60
80
100
120
140
160
2014 2015 2016 2017 2018 2019
Perc
en
tag
e C
han
ge
Billio
ns
of
FC
FA
Cashew Exports
Terms of Trade (RHS)
Terms of Trade and Cashew Exports, 2014-2019(Percentage Change and Billions of FCFA)
Sources: Guinea-Bissau authorities; and IMF staff estimates/projections.
-15
-10
-5
0
5
10
15
20
2014 2015 2016 2017 2018 2019
Goods and services balance Investment income (net)
Total Current Transfers Current Account
Current Account Balance, 2014-2019(In Percent of GDP)
Sources: BCEAO, Guinea-Bissau authorities; and staff estimates/projections.
-15
-10
-5
0
5
10
15
2014 2015 2016 2017 2018 2019
S-I Private Sector S-I Government
Current Account
Sources: Guinea-Bissau authorities; and staff estimates/projections.
Drivers of the Current Account Deficit, 2014-2019(In Percent of GDP)
-15
-10
-5
0
5
10
15
2014 2015 2016 2017 2018 2019
Capital Account
Direct investment
Other investment
BOP deficit ("-" surplus)
Current Account Deficit
Sources of Financing, 2014-2019(In Percent of GDP)
Sources: BCEAO, Guinea-Bissau authorities; and staff estimates/projections.

GUINEA-BISSAU
INTERNATIONAL MONETARY FUND 21
Figure 3. Guinea-Bissau: External Stability Assessment
The EBA-lite regression fits the dynamics of the current account quite well.
Terms of trade, openness, private credit and aid flows are among the dominant determinants of the current account.
Guinea-Bissau’s current account appears is expected to be broadly in line with fundamentals in 2015.
The policy gap is driven by low credit by the private sector credit and the fiscal stance relative to the rest of the world.
-15
-10
-5
0
5
10
15
2000
2001
2002
2003
2004
2005
2006
2007
2008
2009
2010
2011
2012
2013
2014
2015
Fitted Actual
Current Account, 2009-2015(In Percent of GDP)
-1.5
-1
-0.5
0
0.5
1
1.5
Fisc
al
Ch
an
ge in
Rese
rves
Priv
ate
Cre
dit
NFA
Ou
tpu
t per w
orke
r
Oil+
Gas B
ala
nce
Dem
og
rap
hic
term
s
Gro
wth
Pro
jectio
n
ICR
G
Fin
Cen
ter
Aid
Rem
ittan
ce
Ou
tpu
t Gap
ToTg
ap
*Op
en
ness
Drivers of the Current Account, 2015(In Percent of GDP)
-2.7
-3.6-4
-3.5
-3
-2.5
-2
-1.5
-1
-0.5
0
Fitted
Policy Gap
Adjustment
Misalignment
Norm
Actual
Current Account Decomposition, 2015(In Percent of GDP)
-0.5 0 0.5 1 1.5
Fiscal policy
Change in reserves
Private Credit
Capital Control
Drivers of the Policy Gap(In Percent of GDP)

GUINEA-BISSAU
22 INTERNATIONAL MONETARY FUND
Figure 4. Guinea-Bissau: Doing Business and Access to Communication Infrastructure
Guinea-Bissau’s Doing Business rating has deteriorated, ... ... and its rating is worse than that of other WAEMU countries in almost all rated dimensions.
Contract enforcement is relatively cheaper than in other WAEMU countries but takes more time in Guinea-Bissau.
Obtaining access to electricity is even more difficult than in the rest of the WAEMU region.
The cost and time needed to register property is lower than in the WAEMU on average.
Access to communication infrastructure is low.
16
-6
11
-3 -3 -3
10
15
-10
-5
0
5
10
15
20
BEN BFA CIV GNB MLI NER SEN TGO
Improvement in Doing Business Ranking(In Number Ranks)
Sources: World Bank, Doing Business 2015.
50
75
100
125
150
175
200
Ease of Doing
Business Rank
Starting a Business
Dealing with
Construction Permits
Getting Electricity
Registering Property
Getting CreditProtecting Minority
Investors
Paying Taxes
Trading Across
Borders
Enforcing Contracts
Resolving Insolvency
WAEMU Guinea-Bissau Africa-Benchmark
Ease of Doing Business 2015
(Rank among 189 Economies)
Sources: World Bank, Doing Business 2015
0
10
20
30
40
50
60
0
200
400
600
800
1000
1200
1400
1600
1800
2000
Guinea-Bissau WAEMU Asia-Benchmark Africa-Benchmark
Time (days) Cost (% of claim, RHS)
Effort Needed to Enforce Contracts(In Days and Cost in Percent of Claim)
Source: World Bank, Doing Business 2015.
0
1
2
3
4
5
6
7
8
9
0
50
100
150
200
250
300
350
400
450
500
BEN BFA CIV GNB MLI NER SEN TGO
Days
Number of Procedures (RHS)
Effort Needed ot Get Electricity(In Days and Number of Procedures)
Sources: World Bank, Doing Business
0
2
4
6
8
10
12
14
16
18
20
0
50
100
150
200
250
300
350
BEN
BFA
CIV
Gu
inea-B
issau
MLI
NER
SEN
TG
O
WA
EM
U
Asia
-Ben
ch.
Africa
-Ben
ch.
Cost (RHS) Time
Registring Property(Time in Days, Cost in Percent of Property Value)
Sources: World Bank, Doing Business 20150 5 10 15 20 25
BEN
BFA
CIV
GNB
MLI
NER
SEN
TGO
Telephone
Lines
Internet
Users
Telephone Lines and Internet Users, 2013(Per 100 People)
Sources: World Bank, World Development Indicators.

GUINEA-BISSAU
INTERNATIONAL MONETARY FUND 23
Figure 5. Guinea-Bissau: Country Policy and Institutional Assessment
0
0.5
1
1.5
2
2.5
3
3.5
4
4.5
BEN BFA CIV GNB MLI NER SEN TGO
Business and Regulatory Environment, 2013(1= low to 6 = high)
Sources: World Bank Group, CPIA database.
0
0.5
1
1.5
2
2.5
3
3.5
4
BEN BFA CIV GNB MLI NER SEN TGO
Financial Sector Rating, 2013(1= low to 6 = high)
Sources: World Bank Group, CPIA database.
0
0.5
1
1.5
2
2.5
3
3.5
4
BEN BFA CIV GNB MLI NER SEN TGO
Gender Equality Rating, 2013(1= low to 6 = high)
Sources: World Bank Group, CPIA database.
0
0.5
1
1.5
2
2.5
3
3.5
4
BEN BFA CIV GNB MLI NER SEN TGO
Proterty Rights and Rules Based Governance, 2013(1= low to 6 = high)
Sources: World Bank Group, CPIA database.
0
0.5
1
1.5
2
2.5
3
3.5
4
BEN BFA CIV GNB MLI NER SEN TGO
Social Protection Rating, 2013(1= low to 6 = high)
Sources: World Bank Group, CPIA database.
0
0.5
1
1.5
2
2.5
3
3.5
4
BEN BFA CIV GNB MLI NER SEN TGO
Transparency, Accountabilty and Corruption, 2013(In the Public Sector, 1= low to 6 = high)
Sources: World Bank Group, CPIA database.

GUINEA-BISSAU
24 INTERNATIONAL MONETARY FUND
FINANCIAL STABILITY, INCLUSION, AND DEEPENING1
Guinea-Bissau’s financial sector remains shallow, faces major challenges, and access to financial
services is low. Most indicators of financial soundness point to vulnerabilities in Guinea-Bissau’s
financial system, financial depth appears to be below the level implied by the country’s characteristics,
and access to financial services is limited. Commercial banks are on average less profitable and less
liquid, face higher non-performing loans and are less compliant to key prudential ratios than banks in
other WAEMU countries. While financial intermediation has picked up recently, credit to the private
sector remains lower than implied by the country’s fundamentals. Access to financial services in
Guinea-Bissau is low and the banking sector only marginally contributes to firms’ investment
programs. This note reviews the state of financial stability and inclusiveness and argues that:
(i) financial stability issues need to be addressed at the national and regional levels, (ii) social spending
and infrastructure investments will be essential to deepen the financial market, and (iii) while the use
of mobile payment services could make financial services more accessible to a wider population in the
short-term, stronger financial inclusion in the medium term will require major improvements in the
business environment and financial literacy.
A. Financial Sector Stability
1. Financial stability indicators point to a vulnerable banking sector; concentration risk
poses the main problem (Figure 1). As in other WAEMU countries, the financial sector in Guinea-
Bissau is dominated by the banking sector. The banking sector encompasses currently four banks
whose assets represent almost 32 percent of Guinea-Bissau’s GDP. While the sector is well
capitalized on average, with average solvency ratios above average WAEMU levels, there is
considerable heterogeneity across banks, and most indicators of profitability and liquidity are
weaker than in other WAEMU countries. Lending is concentrated in a few sectors. In particular,
exposure to the cashew nut sector is very high and, as only a few companies are incorporated in
Guinea-Bissau, the risk from this sector is concentrated on approximately 20 bankable agents.
2. Since international cashew nut prices started declining in 2012, and fueled by political
uncertainty due to the 2012 coup, non-performing loans have increased significantly. As
Guinea-Bissau’s economy is highly concentrated in cashew activity (more than a third of GDP and
more than 90 percent of exports related to cashew activity), negative shocks to the sector can have
significant impacts on balance sheets of commercial banks. Concentration risks related to other
sectors are also high in some banks. When the price of cashew fell from almost 1400 USD/ton in
2011 to below 800 USD/ton in 2013, non-performing loans (NPLs) of the two banks with the largest
exposure to the cashew sector increased to 60 and 74 percent as of September 2014. On average,
the ratio of NPLs to total loans has increased from 6.5 percent at the end of December 2011 to
1 Prepared by Monique Newiak.

GUINEA-BISSAU
INTERNATIONAL MONETARY FUND 25
37.7 percent in June 2014.2 Consistently with existing regulation at the WAEMU level, provisioning
has been slow. At the end of December 2014, considerable heterogeneity remained in the level of
NPLs across banks (Figure 2).
3. An international best practice and market-based solution to curb NPLs and for
recapitalization is underway and the government has thus succeeded in avoiding the use of
scarce public funds for this purpose. Following technical assistance advice by the Fund, the
government has refrained from providing public funds to the banks plagued by high levels of NPLs.
Instead, the affected banks have started to seize collateral and one bank agreed with the Banking
Commission on a phased increase in capital from CFA 5 billion to 20 billion. Going forward, it will be
important for banks to also liquidate their seized collateral.
4. Compliance to other prudential indicators is also weak in Guinea-Bissau (Figure 2).
Compliance with prudential norms remained weak in June 2014, even when compared to the
modest compliance ratios in the WAEMU. Also due to the poor diversification of Guinea-Bissau’s
economy, only one of the four banks complied with the single exposure limit which is already high
by international standards (75 percent vs. 25 percent). Half of the banks did not comply with the
minimum capital requirement of FCFA 5 billion, the capital adequacy ratio of 8 percent, the related
party lending ceiling, the liquidity ratio and the transformation ratio.
5. Compliance with key prudential ratios needs to improve to safeguard financial
stability (IMF 2015a). To this end, action on both the regional and national level is required. Recent
capacity building efforts at the Banking Commission need to be reinforced by strengthening risk-
based supervisory tools and processes. Timely provision of data by the national BCEAO branches to
the supervisory authorities will be essential in this regard. A stronger corrective action framework
should be put in place in order to reduce regulatory forbearance and better enforce compliance
with prudential norms, including by taking timely and effective corrective measures against weak
and/or noncompliant banks. The move to Basel II/III standards will take time but will be an
opportunity to bring prudential rules closer to international norms. In the mean time, the regional
authorities should step up the enforcement of the current rules, as well as start tightening certain
rules where improvements are most pressing, for instance on concentration risk and provisioning of
non-performing loans.
2 For consistency of the comparison between Guinea-Bissau and the WAEMU, the source of all financial soundness
indicators (FSI) used in this note is BCEAO headquarter; these FSI may differ from the ones reported in the
accompanying staff report.

GUINEA-BISSAU
26 INTERNATIONAL MONETARY FUND
Figure 1. Indicators of Financial Soundness
Indicators of solvency remain high but mask large variations across the country’s four commercial banks.
Most liquidity ratios are below regional averages.
Commercial banks’ profitability is lower than in the WAEMU on average.
Loans are concentrated in a few sectors.
Ratios of non-performing loans are very high, ... ... in particular after the recent shock to the price of Guinea-Bissau’s main product.
0
2
4
6
8
10
12
14
16
18
20
Regulatory
capital/ risk
weighted assets
Tier I capital/ risk-
weighted assets
Provisions/ risk-
weighted assets
Capital/ total
assets
WAEMU Guinea-Bissau
Solvency Ratios, June 2014
Source: BCEAO
0
20
40
60
80
100
120
Liquid
assets/ total
assets
Liquid
assets/ total
deposits
Total loans/
total
deposits
Total
deposits/
total
liabilities
Sight
deposits/
total
liabilities
Term
deposits/
total
liabilities
WAEMU Guinea-Bissau
Indicators of Liquidity, June 2014
Source: BCEAO
-10
0
10
20
30
40
50
60
70
Avg. cost
of
borrowed
funds
Avg.
interest
rate on
loans
Avg.
interest
margin
ROA ROE Non-
interest
expenses/
net
banking
income
Salaries
and
wages/ net
banking
income
WAEMU Guinea-Bissau
Indicators of Earnings and Profitability,
Dec. 2013
Source: BCEAO
0%16%
5%
2%
52%
0%1%
24%Agriculture
Extractive industries
Manufacturing
Electricity, water and gas
Construction
Retail and wholesale trade, restaurants
and hotels
Transportation and communication
Insurance, real estate and services
Other services
GNB: Sectoral Distribution of Loans,
June 2014 (In Percent of Loans)
Source: BCEAO.
0
20
40
60
80
100
120
140
160
Gross NPLs/total
loans
Provisioning rate Net NPLs/ total
loans
Net NPLs/ capital
WAEMU Guinea-Bissau
Non-Performing Loans, June 2014
Source: BCEAO
0
200
400
600
800
1000
1200
1400
1600
0
5
10
15
20
25
30
35
40
Dec. Dec. Dec. Dec. Jun.
2010 2011 2012 2013 2014
Gross NPLs to total loans
Net NPLs to total loans
Cashew price (USD/ton)
Non-Peforming Loans and Cashew Prices,
2010-2014
Source: BCEAO

GUINEA-BISSAU
INTERNATIONAL MONETARY FUND 27
Figure 2. Compliance with Key Prudential Norms, June 2014 (In Percent of Banks)
B. Private Sector Credit Depth
6. Private sector credit growth has slowed down recently, despite a substantial increase
in intermediation (Figure 3). While growth of credit to the economy has been on an upward trend
since 2004, it declined sharply in 2012, as a consequence of political uncertainty after the coup
d’état and difficulties in the cashew sector due to the decline in the international cashew prices;
credit growth turned negative in 2013 with the additional shock to cashew prices. Commercial banks
perceive credit risk as very high, and consider investments into WAEMU government paper, or
holding their liquidity with the BCEAO, as a safer option.
7. The ratio of private sector credit to GDP remains below the level implied by Guinea-
Bissau’s fundamentals (Figure 4). Following the methodology in Al Hussainy (2011) and Barajas et
al. (2013), this note derives a benchmark ratio of private sector credit to GDP based on a number of
structural factors in a panel of over 120 emerging and developing countries for the period from
1986 to 2013.3 The fitted values from these regressions serve as the private sector-to-GDP
benchmark. For the case of Guinea-Bissau, this benchmark level is much higher than the actual level
3 It regresses the ratio of private sector credit-to-GDP on: (i) the log of GDP per capita and its square, (ii) the log of
the population to proxy for market size, (iii) the log of population density to proxy for the ease of service provision,
(iv) the log of the age dependency ratio to account for demographic trends and the related savings behavior, (v) an
oil exporters dummy, and time dummies to control for global factors.
0 20 40 60 80 100
Share Capital
Capital Adequacy Ratio
Single Exposure Limit
Total Exposure Limit
Related Party Lending
Transformation Ratio
Liquidity Ratio
GNB
WAEMU
Compliance with Key Prudential, June 2014 (In Percent of Banks)
Source: BCEAO.
Share Capital: minimum share capital of FCFA 5 billion. Capital Adequacy Ratio: minimum ratio of regulatory capital to
risk-weighted assets of 8 percent. Single Exposure Limit: exposure to a single borrower or a group of connected
borrowers not to exceed 75 percent of regulatory capital. Total Exposure Limit: sum of all risk-weighted exposures, each
of which exceeds 25 percent of regulatory capital, not to exceed 8 times regulatory capital. Related Party Lending: Total
lending to related parties not to exceed 20 percent of regulatory capital. Transformation ratio: Ratio of long-term funds
(capital and long-term deposits and liabilities) to long-term uses of funds (investments in real estate assets, equities,
and participations in addition to long-term loans and assets) at a minimum of 50 percent. Liquidity ratio: Ratio of short-
term assets to short-term liabilities of minimum 75 percent.

GUINEA-BISSAU
28 INTERNATIONAL MONETARY FUND
of private credit in percent of GDP, implying that financial depth is lagging behind the level implied
the country’s structural characteristics.
8. A number of policies could help Guinea-Bissau to increase private sector credit relative
to the benchmark (Figure 5, Table 1). A regression of the financial gap (actual private sector credit-
to-GDP minus its benchmark) on macroeconomic, institutional and policy variables helps identifying
the drivers of the deviations from the benchmark for 2004-2013. Table 1 highlights the factors which
help increasing private sector credit relative to the benchmark (see also IMF 2015b, inspired by
Barajas et al. 2013). To assess the impact of feasible changes in the underlying factors, Figure 5
provides the implied reduction in the financial gap if, all other things equal, underlying factors were
set to the level of the WAEMU country with the strongest record in each category. While causality is
hard to establish in this exercise and the effects represent mostly associations, increasing trade
openness, health (social) spending, FDI inflows and improved infrastructure to the top performing
WAEMU country in the category could narrow the financial gap by 4½, 3, 1¾, and 1¼ percentage
points, respectively.
Figure 4. Guinea-Bissau: Actual and Implied Credit to the Private Sector (In Percent of GDP)
Figure 5. Factors which Close the Financial Gap (Increase from Adjusting Each Factor to the Top Performer
in the WAEMU in 2013)
0
5
10
15
20
25
1986
1988
1990
1992
1994
1996
1998
2000
2002
2004
2006
2008
2010
2012
Benchmark Actual
0
1
2
3
4
5
FD
I
Trad
e O
pen
ess
Fisca
l Bala
nce
Infla
tion
Health
Sp
en
din
g
Institu
tion
s
Tele
lph
on
e Lin
es
Inte
rnet U
se
Figure 3. Private Sector Growth and Financial Intermediation
Private sector credit growth has declined recently and diverges from the average regional path, ...
... despite an increase in financial intermediation.
-5
0
5
10
15
20
2001 2003 2005 2007 2009 2011 2013
Guinea-Bissau WAEMU
Growth of Credit to the Private Sector(Year-on-Year Change, in Percent)
Sources: BCEAO, IMF estimates.
0
10
20
30
40
50
60
2000 2002 2004 2006 2008 2010 2012 2014
Guinea-Bissau WAEMU
Broad Money, 2000-2014(In Percent of GDP)
Sources: BCEAO, IMF estimates.

GUINEA-BISSAU
INTERNATIONAL MONETARY FUND 29
Table 1. Determinants of Financial Inclusiveness Gaps, 2004–13
(1) (2) (3) (4) (5)
Economic Environment
Growth -0.004 *** -0.004 ***
(-3.08) (-3.04)
US Federal Funds Rate1 0.003 0.008 **
(0.69) (2.17)
External Stance
FDI/GDP 0.002 *** 0.002 ***
(2.92) (3.17)
Trade Openess 0.209 *** 0.217 ***
(3.49) (3.40)
Capital Controls 0.076 *** 0.115 ***
(3.96) (5.73)
Policies
Fiscal Balance (cycl. adjusted)/GDP -0.185 ** -0.247 **
(-2.16) (-2.52)
Inflation -0.004 *** -0.003 ***
(-5.50) (-4.48)
FX Regime 0.007
(1.15)
Health Spending/GDP 1.575 *** 1.202 ***
(3.61) (2.57)
Institutions and Infrastructure
Institutions (ICRG) 0.295 *** 0.234 ***
(4.38) (3.14)
Telephone Lines 0.000 *** 0.000 ***
(11.44) -11.74
Internet Use 0.001 ** 0.001 *
(2.01) (1.75)
Credit Information Depth -0.002
(-0.69)
Constant 0.019 * -0.119 *** -0.033 -0.183 *** -0.308 ***
(1.76) (-5.03) (-1.17) (-5.74) (-7.38)
Number of observations 1055 1055 1055 1055 1055
R-squared 0.01 0.04 0.04 0.09 0.18
1Proxy for external environment.
Robust t-statistics in parentheses; significance levels at 10 percent (*), 5 percent (**), and 1 percent (***) levels,
respectively.

GUINEA-BISSAU
30 INTERNATIONAL MONETARY FUND
C. Access to Financial Services
9. Financial access in Guinea-Bissau is low by most measures. Figure 6 compares different
indicators of financial access in Guinea-Bissau against other WAEMU countries and groups of fast
growing regional and Asian benchmark countries.4 It shows that:
Provision of basic financial infrastructure, such as the density of ATMs and the number of bank
branches in Guinea-Bissau is lower than in WAEMU on average—which itself lags behind other
benchmark groups.
The number of people with deposits at commercial banks is low. Only around 6 percent of adult
Bissau-Guineans had deposits with a commercial bank in 2013, compared to around 13 percent
in the WAEMU, and about 30 percent in fast growing African benchmark countries. However, the
recent government initiative to make all public salary payments go through the banking system
increases the number of adults with a bank account substantially and can lead to an increase in
the number of depositors and also loans over time.
Deposits in percent of GDP are also lower than in the WAEMU on average, with lower levels of
deposits currently only observed in Niger. Amounting to 17 percent of GDP, outstanding loans
from commercial banks are the lowest in the region.
10. The banking sector’s contribution to firms’ investment programs also appears limited
(Figure 7). For the most recent year available (2006), enterprise surveys indicate that, while more
than half of the firms in Guinea-Bissau possess a bank account, less than 5 percent of firms hold a
loan or a line of credit, compared to less than 30 percent in most WAEMU countries. The majority of
loans require high levels of collateral, and the acceptance of local assets as collateral is often
problematic. Loans from banks constitute only a small fraction of firms’ investment financing, while
internal funds appear to be the dominant source of financing investments. The most recent
enterprise survey available confirms this picture, with the vast majority of respondents identifying
access to finance as a major constraint for their businesses, in particular if they are active in
manufacturing.
11. Lending rates by commercial banks remain high but in line with regional averages and
relatively little variation between banks; better contract enforcement would help lower the
rates (Figure 8). Average prime lending and maximum lending rates across banks in Guinea-Bissau
stood at 9.5 percent and 14 percent, respectively, in December 2014, in line with the WAEMU
average. However, the variation across banks in these rates has been, lower than in other WAEMU
countries, likely owing to the limited number of banks in the country. Better enforcement of
contracts, such as the possibility to faster recover collateral, could help lower these rates.
4 For most indicators, WAEMU averages or ranges are provided. More ambitious benchmarks include Ghana, Kenya,
Lesotho, Rwanda, Tanzania, Uganda, and Zambia for Africa, and Bangladesh, Cambodia, India, Laos, Nepal, and
Vietnam for Asia.

GUINEA-BISSAU
INTERNATIONAL MONETARY FUND 31
0
50
100
150
200
250
300
350
2004 2005 2006 2007 2008 2009 2010 2011 2012
WAEMU-Range
WAEMU
Africa-Benchmark
Guinea-Bissau
Depositors with Commercial Banks(Per 1000 Adults)
Sources: IMF, Financial Access Survey
Figure 6. Access to Financial Services
The degree of penetration of ATMs is in line with other WAEMU countries but low compared to more ambitious benchmarks.
Although increasing, the number of bank branches remains comparatively low.
The share of the population with deposits at commercial banks has increased, but remains among the lowest in the region.
Outstanding loans are lower than in any other WAEMU country.
Only about 6 percent of adults are depositors with commercial banks, the lowest amongst the comparators, ...
... and the ratio is even lower for household depositors.
0
1
2
3
4
5
6
7
8
9
10
Gu
inea-
Bissa
u
WA
EM
U
Asia
-
Ben
chm
ark
Africa
-
Ben
chm
ark
ATMs per 100,000 adults
ATMs per 1,000 km2
Number of ATMs, 2013(Per Thousand Square Kilometer and and 100 Thousand Adults)
Sources: IMF, Financial Access Survey
0
50
100
150
200
250
300
350
400
450
GN
B
WA
EM
U
Asia
-
Ben
ch
mark
2004
2013
Household Depositors with Commercial Banks(Per Thousands of Adults)
Sources: IMF, Financial Access Survey
0
2
4
6
8
10
12
2004 2005 2006 2007 2008 2009 2010 2011
WAEMU-Range
WAEMU-Average
Asia-Benchmark
Africa-Benchmark
Guinea-Bissau
Commercial Bank Branches(Per 100 Thousand Adults)
Sources: IMF, Financial Access Survey
0
10
20
30
40
50
60
70
80
2004 2005 2006 2007 2008 2009 2010 2011 2012 2013
WAEMU-Range
WAEMU-Average
Asia-Benchmark
Africa-Benchmark
Guinea-Bissau
Outstanding Deposits with Commercial Banks(In Percent of GDP)
Sources: IMF, Financial Access Survey
0
10
20
30
40
50
60
2004 2005 2006 2007 2008 2009 2010 2011 2012 2013
WAEMU-Range
WAEMU-Average
Asia-Benchmark
Africa-Benchmark
Guinea-Bissau
Outstanding Loans from Commercial Banks(In Percent of GDP)
Sources: IMF, Financial Access Survey

GUINEA-BISSAU
32 INTERNATIONAL MONETARY FUND
0102030405060708090
100
BEN BFA CIV GNB MLI NER SEN TGO
Checking/Savings Account
Loan/Line of Credit
Firms with Accounts or Credit*(In Percent of Firms)
Source: World Bank Enterprise Surveys.
*GNB: 2006, other countries: latest available.
Figure 7. Access of Firms to Financial Services
While the majority of firms have an account at a bank, access to credit is negligible and the lowest in the region.
Almost no firms rely on banks to finance investment or working capital.
Firms identify access to finance as a major constraint... ... especially in the manufacturing sector.
Comparable to other countries in the region, most investment financing is generated through internal
sources in Guinea-Bissau, …
…while the amount of working capital contributed through banks was less than 1 percent.
0102030405060708090
100
BEN BFA CIV GNB MLI NER SEN TGO
Percent of Firms Identifying Access to Finance as
Major Constraint*
(In Percent of Respondents)
Source: World Bank Enterprise Surveys.
*GNB: 2006, other countries: latest available.
0
10
20
30
40
50
60
70
80
90
100
Manufacturing Services Small enterprise
(5-19)
Medium
enterprise
(20-99)
Guinea-Bissau: Percent of Firms Identifying Access to
Finance as Major Constraint
(In Percent Respondents per Firm Type)
Source: World Bank Enterprise Surveys, 2006.
0
10
20
30
40
50
60
BEN BFA CIV GNB MLI NER SEN TGO
Investment Working Capital
Firms Using Banks to Finance Investment
and Working Capital*(In Percent of Firms)
Source: World Bank Enterprise Surveys.
*GNB: 2006, other countries: latest available.
0
20
40
60
80
100
BEN BFA CIV GNB MLI NER SEN TGO
Internal Sources BanksSupplier Credit Equity or Stock Sales
Sources to Finance Investment*(In Percent of Investment Amount)
Source: World Bank Enterprise Surveys.
*GNB: 2006, other countries: latest available.
0102030405060708090
100
BEN BFA CIV GNB MLI NER SEN TGO
Banks Supplier Credit Other
Sources to Working Capital*(In Percent of Working Capital)
Source: World Bank Enterprise Surveys.
*GNB: 2006, other countries: latest available.
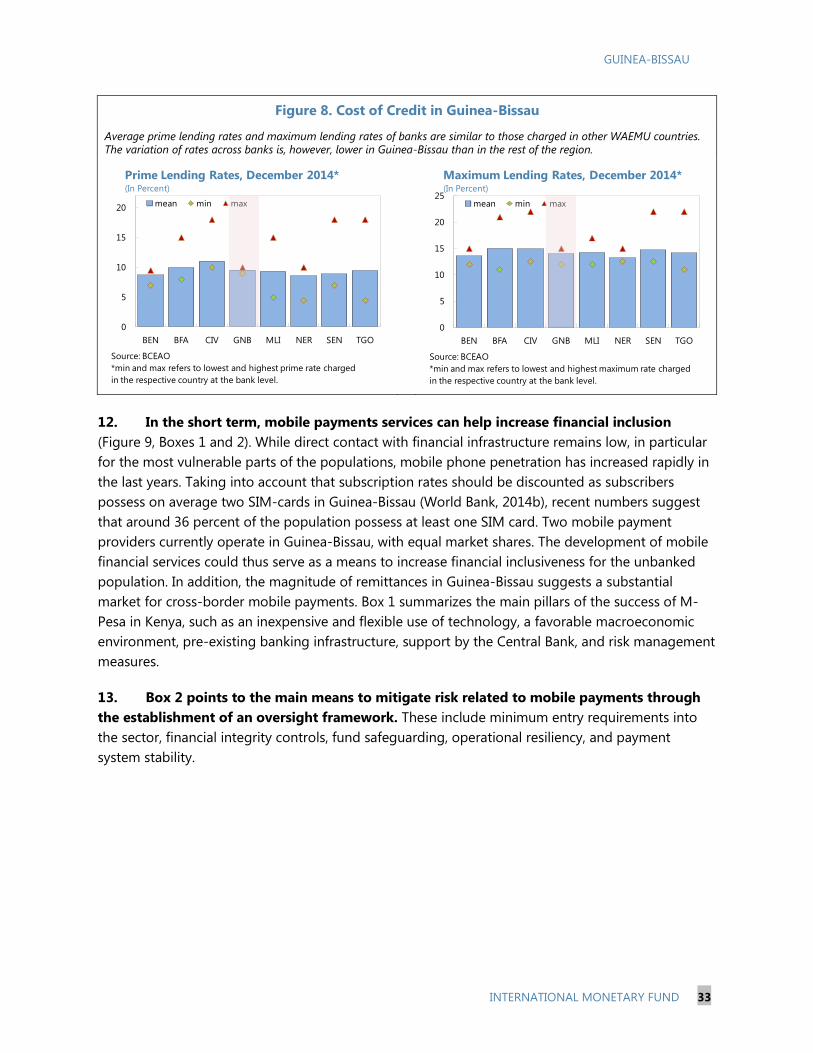
GUINEA-BISSAU
INTERNATIONAL MONETARY FUND 33
Figure 8. Cost of Credit in Guinea-Bissau
Average prime lending rates and maximum lending rates of banks are similar to those charged in other WAEMU countries. The variation of rates across banks is, however, lower in Guinea-Bissau than in the rest of the region.
12. In the short term, mobile payments services can help increase financial inclusion
(Figure 9, Boxes 1 and 2). While direct contact with financial infrastructure remains low, in particular
for the most vulnerable parts of the populations, mobile phone penetration has increased rapidly in
the last years. Taking into account that subscription rates should be discounted as subscribers
possess on average two SIM-cards in Guinea-Bissau (World Bank, 2014b), recent numbers suggest
that around 36 percent of the population possess at least one SIM card. Two mobile payment
providers currently operate in Guinea-Bissau, with equal market shares. The development of mobile
financial services could thus serve as a means to increase financial inclusiveness for the unbanked
population. In addition, the magnitude of remittances in Guinea-Bissau suggests a substantial
market for cross-border mobile payments. Box 1 summarizes the main pillars of the success of M-
Pesa in Kenya, such as an inexpensive and flexible use of technology, a favorable macroeconomic
environment, pre-existing banking infrastructure, support by the Central Bank, and risk management
measures.
13. Box 2 points to the main means to mitigate risk related to mobile payments through
the establishment of an oversight framework. These include minimum entry requirements into
the sector, financial integrity controls, fund safeguarding, operational resiliency, and payment
system stability.
0
5
10
15
20
BEN BFA CIV GNB MLI NER SEN TGO
mean min max
Source: BCEAO
*min and max refers to lowest and highest prime rate charged
in the respective country at the bank level.
Prime Lending Rates, December 2014*(In Percent)
0
5
10
15
20
25
BEN BFA CIV GNB MLI NER SEN TGO
mean min max
Source: BCEAO
*min and max refers to lowest and highest maximum rate charged
in the respective country at the bank level.
Maximum Lending Rates, December 2014*(In Percent)

GUINEA-BISSAU
34 INTERNATIONAL MONETARY FUND
Figure 9. Potential for Mobile Payments
Mobile phone penetration has increased sharply in the last years...
…and the market for cross-border payments is significant.
Box 1. Expanding Mobile Payments: Kenya’s M-PESA Experience (based on IMF, 2012)
The fast spread of M-Pesa after its introduction in Kenya in 2007 has helped reduce transaction cost,
facilitated personal transaction, and contributed to the use of services of financial intermediaries. Based on
IMF (2012), this box summarizes the main determinants of M-Pesa’s success as well as risk management
issues.
Determinants of M-Pesa’s success. While a rapid expansion in the use of mobile phones has contributed
to the success of the developments of the sector, the following structural factors have likely made it
possible:
Inexpensive and flexible use of technology. Safaricom’s widespread presence brought with it a large
network of airtime resellers which became M-Pesa agents. Based on physical locations, agents are
organized into groups with or without a centralized aggregator, such as a bank.
Macroeconomic environment. Unusually large excess reserves held by commercial banks at the
central bank led to the search for alternative lines of business.
Banking infrastructure. The increasing availability of bank branches favored mobile-based transfers.
Government policies. The Central Bank of Kenya (CBK) allowed Safaricom to operate M-Pesa as a
parallel payments system, requiring only that customers’ funds be deposited in a regulated financial
institution, while Safaricom deposits and earned interest are placed in a non-profit trust account.
The CBK also introduced limits on transaction sizes to mitigate money laundering risks.
Risk management issues. Advice for risk-prevention for M-Pesa by the Fund and actions taken included:
A formalization of M-Pesa operations in the National Payments Systems Bill to provide a legal basis
for M-Pesa operations and ensure customer protection, even if not linked to a deposit account.
Coverage of operational risks through regulations addressing in detail the technological capabilities
and control processes to ensure security.
Explicit incorporation of credit, liquidity and operational risks associated with M-Pesa transfers for
microfinance institutions as well as consumer protection.
Close monitoring of risks related to cross-border mobile payments.
0
20
40
60
80
100
120
140
2000
2001
2002
2003
2004
2005
2006
2007
2008
2009
2010
2011
2012
2013
WAEMU range
KEN
GNB
Mobile Cellular Subscriptions(Per 100 People)
Sources: World Dvelopment Indicators 2014
0
2
4
6
8
10
12
BEN BFA CIV GNB MLI NER SEN TGO KEN SSA
Personal Remittances, 2012 or Latest Available (In Percent of GDP)
Source: World Bank, World Development Indicators.

GUINEA-BISSAU
INTERNATIONAL MONETARY FUND 35
Box 2. Components of an Oversight Framework for Mobile Payments (from IMF 2015b)
Mobile payment services promote financial inclusion, but they carry a number of risks which could be
mitigated by an oversight framework with the following components:
Minimum entry requirement into the sector. Entry requirements, such as minimum capital
requirements for non-bank mobile service providers, can help reduce the risk of failure because
operators will have to demonstrate that they have the financial capacity to supply mobile payment
services. Such protection is particularly important given that mobile payment services are mostly
addressed to the most vulnerable parts of the population.
Financial integrity controls. Mobile payments may increase the complexity of payments and give rise
to money laundering and financing of terrorism risks. Therefore, these services should be subject to
adequate anti-money laundering/combating terrorism financing (AML/CFT) risk-based supervision
by the WAEMU Banking Commission. Their providers should effectively implement AML/CFT
preventive measures and report suspicious transactions to financial intelligence units.
Fund safeguarding. As mobile payment services address mostly people at the lower end of the
income distribution, they should include some form of guarantee or insurance to cover funds in
case of failure of the mobile financial service provider. Such guarantee can be in the form of
coverage by insurance companies or the inclusion of these services within the scope of deposit
insurance schemes applicable in some countries. For Guinea-Bissau, this implies the need to
develop insurance and to develop a deposit insurance scheme.
Operational resiliency. Mobile payment services may run substantial operational risk, particularly
when functioning under poor or limited infrastructure. Therefore, mobile payment providers’
business continuity plans should be regularly tested for viability and effectiveness.
Payment system stability. The high number of transactions connected with mobile payments may
create settlement risk which might translate into both liquidity and credit risks potentially affecting
financial stability. Therefore, mobile payment services, particularly those performed by non-banks,
should be subject to a very robust clearance and settlement system leveraging on the system used
for bank transactions.

GUINEA-BISSAU
36 INTERNATIONAL MONETARY FUND
14. In the medium term, improvements in the business and legal environment would be
necessary to improve access to financial services (Figure 10). The authorities need to address
weak transparency, underdeveloped judicial and business environments, limited financial skills, and
distortive taxation (such as the tax exemption of interest revenue on government paper, while other
interest revenue is not tax exempt), suboptimal prudential regimes and regulatory forbearance,
which remain the main obstacles to financial sector development. Lower collateral requirements
stemming from a better legal environment and higher accounting standards could increase firms’
access to financing and boost investment and GDP.
Figure 10. Doing Business
Guinea-Bissau’s Doing Business rating has deteriorated between 2013 and 2014, ...
… ranking worst within WAEMU and with only 10 countries ranked as having a less favorable business environment.
Contract enforcement, access to electricity, and starting a business seem to pose particular problems ...
... and the coverage of credit registries is low.
16
-6
11
-3 -3 -3
10
15
-10
-5
0
5
10
15
20
BEN BFA CIV GNB MLI NER SEN TGO
Improvement in Doing Business Ranking(In Number Ranks)
Sources: World Bank, Doing Business 2015.
110
131
146
147
149
151
158.5
161
167
168
179
0 50 100 150 200
Africa-Benchmark
Asia-Benchmark
Mali
Côte d'Ivoire
Togo
Benin
WAEMU
Senegal
Burkina Faso
Niger
Guinea-Bissau
Ease of Doing Business 2015(Rank among 189 Economies)
Sources: World Bank, Doing Business 2015
50
75
100
125
150
175
200
Ease of Doing
Business Rank
Starting a Business
Dealing with
Construction Permits
Getting Electricity
Registering Property
Getting CreditProtecting Minority
Investors
Paying Taxes
Trading Across
Borders
Enforcing Contracts
Resolving Insolvency
WAEMU Asia-Benchmark
Africa-Benchmark Guinea-Bissau
Ease of Doing Business 2015
(Rank among 189 Economies)
Source: World Bank, Doing Business 2015
0 2 4 6 8 10
GNB
WAEMU
Asia-Benchmark
Africa-Benchmark
Credit Registry Coverage(In Percent of Adults)
Sources: World Bank, Doing Business 2015.

GUINEA-BISSAU
INTERNATIONAL MONETARY FUND 37
D. Conclusions
15. Major challenges in Guinea-Bissau’s financial sector require short- and medium
attention. Guinea-Bissau’s financial sector remains shallow, access to financial services in is low and
the banking sector only marginally contributes to firms’ investment programs. To address these
challenges in the short-to medium term, action on several fronts will be required, in particular:
Stability. Financial stability issues need to be addressed at the national and regional levels. For
instance, compliance with and enforcement of key prudential ratios needs to improve on the
regional level, and timely provision of data by the national BCEAO branches to the supervisory
authorities will be essential in this regard.
Deepening. Social spending and infrastructure investments will be essential to deepen the
financial market.
Inclusion. Stronger financial inclusion in the medium term will require major improvements in
the business environment and financial literacy, while the use of mobile payment services could
make financial services more accessible to a wider population in the short-term.

GUINEA-BISSAU
38 INTERNATIONAL MONETARY FUND
References
African Development Bank Group, 2013: “Financial Inclusion and Integration through Mobile
Payments and Transfer”.
Arvanitis, Y. (2014); “Providing Banking Services in a Fragile Environment. Structure, Performance and
Perspectives of the Banking Sector in Guinea-Bissau,” West Africa Policy Note, African
Development Bank Group.
Barajas, A., T. Beck, E. Dabla-Norris, and S. R. Yousefi, (2013); “Too Cold, Too Hot, or Just Right?
Assessing Financial Sector Development across the Globe,” IMF Working Paper WP/13/81
E. Al-Hussainy, A. Coppola, E. Feyen, A. Ize, K. Kibbuka, and H. Ren, (2011); “A Ready-to-Use Tool to
Benchmark Financial Sectors Across Countries and Over Time,” FinStats 2011 (Washington,
D.C., World Bank).
Musuku, T. B., M. C. Malaguti, A. McEwan Mason, and C. Pereira, (2011); “Lowering the Cost of
Payments and Money Transfers in UEMOA”; Africa trade policy notes (23), Washington, D. C.,
World Bank.
Groupe Speciale Mobile Association, 2014; “State of the Industry 2013: Mobile Financial Services for
the Unbanked,” GSM Association.
IMF, 2012, “Enhancing Financial Sector Surveillance in Low Income Countries (LICs)—Case Studies,”
Supplement to IMF Policy Paper, Washington, D. C.
IMF, 2015a, “West African Economic and Monetary Union. Staff Report on Common Policies of
Member Countries,” forthcoming.
IMF, 2015b, “West African Economic and Monetary Union. Staff Report on Common Policies of
Member Countries—Selected Issues Paper.”
Khiaonarong, Tanai, 2014, “Oversight Issues in Mobile Payments,” IMF Working Paper WP/14/123.
World Bank, 2014a, “Terra Ranca! A Fresh Start,” Country Economic Memorandum, Report
No. 58296-GW.
World Bank, 2014b, “Utilisation des Services de Téléphonie Mobile pour la Mise en Oeuvre du Projet
« Cash for Work » de la Banque Mondiale en Guinée-Bissau,” Presentation, December, 2014.

GUINEA-BISSAU
INTERNATIONAL MONETARY FUND 39
ECONOMIC DIVERSIFICATION1
Growth in Guinea-Bissau has been disappointing and highly volatile. With exports and commercial
bank lending being dominated by the cashew nut sector, Guinea-Bissau is highly vulnerable to
exogenous shocks such as fluctuations in international cashew prices. The majority of the country’s
population is employed in low-productivity agriculture focused on cashew production which has
superseded the production of rice. To reduce the economy’s exposure to shocks, policies should focus
on exploring “quick-wins” to economic diversification, such as reform or closure of the FUNPI, in the
short term. To further diversify the economy in the medium to long term, policies could focus on easing
main constraints in key areas such as infrastructure, education and the business climate. Given the
importance of the primary sector for Guinea-Bissau and the country’s biodiversity, economic policies
could also target specific activities such as rice cultivation and mining, as envisaged under the
government’s Strategic Plan.
A. Growth, Volatility, and Productivity
1. Growth in Guinea-Bissau has been weak and highly volatile over the last decades
(Figure 1). From 1995 to 2014, real GDP has grown by an average of 2.3 percent per year, leaving
the country’s real GDP per capita at a lower level
in 2014 than two decades ago. In addition,
Guinea-Bissau’s growth performance has been
characterized by large volatility: Figure 1 highlights
most notably the catastrophic effect of the civil
war (1998-1999) but also other episodes of
instability, such as through attempted or actual
military coups (see Section 1 on the cost of
fragility). The country remains vulnerable to
exogenous shocks, such as fluctuations of
international cashew prices, which added to the
negative effect on growth from the 2012 coup.
2. Low physical and human capital accumulation and total factor productivity have posed
major impediments to growth (Figure 2). In Figure 2, Guinea-Bissau’s real growth rate is
decomposed into the contributions capital, labor, education and total factor productivity. The factor
‘gaps’ from this simple exercise suggest that while improvements to education and labor force
growth have on average contributed positively to growth, slow capital growth and total factor
productivity have posed significant impediment to economic activity, as investment in percent of
GDP has been less than half of that observed in other WAEMU countries. Guinea-Bissau performs
1 Prepared by Monique Newiak. Part C of this section C heavily draws on recommendations in World Bank (2014) and
IMF (2014a).
Figure 1. Guinea-Bissau: Real Growth (In Percent)
-25
-20
-15
-10
-5
0
5
10
15
20
1995 1997 1999 2001 2003 2005 2007 2009 2011 2013
real GDP Real GDP per Capita
Real GDP Growth and GDP per capita Growth(In Percent)
Sources: National authorities and staff estimates.

GUINEA-BISSAU
40 INTERNATIONAL MONETARY FUND
poorly in assessments of its business environment, with access to electricity, starting a business, and
contract enforcement posing particular challenges. While measures of basic education, such the
literacy rate, are comparable to those of other countries in the region, they are still low in absolute
terms, and gender gap in literacy rates are much larger compared to Sub-Saharan and Asian
countries which have achieved high growth rates in the past decades.
Figure 2. Guinea-Bissau: Drivers of Economic Growth
Low investment and low productivity have strongly impeded growth in Guinea-Bissau.
Investment levels have been low.
Literacy rates are higher than in the WAEMU on average but lower compared to other benchmarks.
The business environment remains challenging.
3. Policies to stimulate economic growth are required on multiple fronts. Significant
investments to close the country’s capital and infrastructure gap will be needed to increase
economic growth in the medium-term. Policies that target access and quality and inclusiveness of
education could increase the contribution of human capital to growth. Reforms in public financial
management (PFM) and governance would improve the efficiency of public and private investment,
and improvements to the business environment, such as through stronger contract enforcement
and more efficient and reliable electricity provision will be essential to raise productivity. The
government’s emergency program to restore electricity through hiring a private company to install
diesel-run generators has already shown a positive impact, but significant investments, as outlined
0
5
10
15
20
25
2000 2002 2004 2006 2008 2010 2012
Guinea-Bissau WAEMU
Total Investment, 2000-2013(In Percent of GDP)
Sources: African Department Database, staff estimates.
♀ ♀♀
♀
♀
♀
♀♀
♀
♀ ♀
♂ ♂
♂
♂
♂
♂
♂♂
♂
♂ ♂
0
10
20
30
40
50
60
70
80
90
BEN
BFA
CIV
GN
B
MLI
NER
SEN
TG
O
WA
EM
U
Asia
-
Ben
chm
ark
Africa
-
Ben
chm
ark
Total
Female
Male
Adult Literacy Rates, 2012 or Latest Available(In Percent of Population)
Sources: UNESCO Institute for Statistics
50
75
100
125
150
175
200
Ease of Doing
Business Rank
Starting a Business
Dealing with
Construction Permits
Getting Electricity
Registering Property
Getting CreditProtecting Minority
Investors
Paying Taxes
Trading Across
Borders
Enforcing Contracts
Resolving Insolvency
WAEMU Guinea-Bissau Africa-Benchmark
Ease of Doing Business 2015
(Rank among 189 Economies)
Sources: World Bank, Doing Business 2015
-3
-2
-1
0
1
2
3
4
5
6
Guinea-Bissau WAEMU
Education Adjusted labor Capital stock
Adjusted TFP Real GDP
Average Contribution to Annual Growth Rate (In Percentage Points, 1995-2012)
Source: IMF (2014).

GUINEA-BISSAU
INTERNATIONAL MONETARY FUND 41
in the government’s Strategic Plan, and a restructuring of EAGB, the electricity and water company,
will be key to improve the energy situation in the medium term.
B. Recent Trends in the Structure of Output and Exports
4. There has been relatively little evidence of structural change in Guinea-Bissau over
time, in sharp contrast to fast growing Sub-Saharan African economies. Figure 3 highlights that
structural transformation of Guinea-Bissau’s economy has been limited, if not backward oriented,
with the agricultural sector growing more dominant, and the contribution of manufacturing,
construction as well as wholesale and retail sectors having even declined slightly in the past two
decades. The share of the tertiary sector, however, has increased somewhat since the mid-1990s.
The rise of the share of the agricultural sector is in contrast to the trend observed for the WAEMU,
where the share has remained stable, and even more so compared to the benchmark group of fast
growing Sub-Saharan African countries in which the agricultural sector has on average become less
dominant since 2000.
Figure 3. Guinea-Bissau: Output Diversification
The structure of output has changed little over the last two decades...
... and concentration in agriculture has even increased.
5. Export diversification has also declined, and Guinea-Bissau has grown more dependent
on its dominant export partners (Figure 4). Export diversification, as defined in Box 1, has been
constant over the last two decades in the WAEMU, and has increased strongly in fast growing Sub-
Saharan African countries. In contrast, exports have also become more concentrated in Guinea-
Bissau, with cashew exports accounting for 85 to 99 percent of exports each year. Most recent
numbers on export diversification suggest that Guinea-Bissau has the least diversified export base in
the WAEMU. Moreover, exports have been increasingly concentrated to India where the processing
of cashew nuts takes place. This has been limiting the number of export partners for Guinea-Bissau,
while diversification across export partners has increased in benchmark countries.
6. Relative export quality has generally declined and exports are highly concentrated on
exports of relatively low quality (Figure 5). While the quality of Bissau-Guinean cashew nuts is
high, the majority of nuts are exported unprocessed, with no relative improvements in export quality
0%
10%
20%
30%
40%
50%
60%
70%
80%
90%
100%
1990 1992 1994 1996 1998 2000 2002 2004 2006 2008 2010 2012
Agriculture Mining and utilities
Manufacturing Construction
Wholesale and retail Transport and telecommunications
Other services
Guinea-Bissau: Output structure(In Percent of total output)
Sources: UN National Accounts
0
5
10
15
20
25
30
35
40
45
50
1990 1992 1994 1996 1998 2000 2002 2004 2006 2008 2010 2012
WAEMU
SSA Benchmark
Guinea-Bissau
Agricultural output shares(In Percent of GDP)
Sources: UN National Accounts

GUINEA-BISSAU
42 INTERNATIONAL MONETARY FUND
over the last decade. The last chart in Figure 5 plots the export quality, as measured by the export’s
unit value adjusted for differences in production cost, distance to the trading partner, and the
countries development (Box 1), for the largest sectors (2-digit SITC) in each WAEMU country. It
suggest that, while some countries have succeeded in achieving a high product quality in at least
one of their top export sectors, export concentration in many countries remains high in sectors of
relatively low quality. This is particular the case in Guinea-Bissau, where exports are concentrated in
products of relatively low quality.
7. Increasing diversification and quality upgrading could yield significant growth and
stability gains. Based on estimated obtained in IMF (2014a) for low-income countries, increasing
export diversification in Guinea-Bissau to levels observed in the WAEMU over the period 2001 to
2010 could have resulted in an increase in the average real growth rate for Guinea-Bissau by about
1 percentage points. In a thought-experiment which raises diversification in Guinea-Bissau to that of
fast growing Sub-Saharan African or Asian countries, these gains are estimated at about
1½ percentage points.
Box 1. Export Diversification and Quality
(IMF 2014a and Henn et al., 2013)
Export product diversification is captured by the Theil index which can be decomposed into a “between”
and a “within” sub-index:
+ ,
in which i is the product index and N the total number of products. The “between” Theil index captures the
extensive margin of diversification, i.e. the number of products, while the “within” Theil index captures the
intensive margin (product shares).
Export partner diversification. The Theil index is also available across export partners. In this case, i and
N in the above relationship represent the export partner index and number of export partners,
respectively.
Export quality is measured by the export’s unit value adjusted for differences in production costs, relative
distance to the trade partner, and the development of a country through the following relationship:
,
in which the sub-scripts m, x, and t denote importer, exporter and time period respectively.

GUINEA-BISSAU
INTERNATIONAL MONETARY FUND 43
Figure 4. Guinea-Bissau: Export Product and Partner Diversification
Exports have become more concentrated in the last decade. … in contrast to fast growing African countries where exports became more diversified and relatively little action in the WAEMU on average.
The share of the major export products in total exports has increased in Guinea-Bissau over the last two decades...
... and Guinea-Bissau is the least diversified economy in the WAEMU region.
Concentration across exports partners has also increased. … in contrast to the WAEMU and strongly growing African countries.
0.4
0.5
0.6
0.7
0.8
0.9
1
BEN BFA CIV GNB MLI NER SEN TGO
1991-1995 1996-2000 2001-2005 2006-2010
Share of Three Major Exports in Total Exports, 1991-2010(Export Product Measured at 2-Digit SITC Level)
2
2.5
3
3.5
4
4.5
5
5.5
1972
1974
1976
1978
1980
1982
1984
1986
1988
1990
1992
1994
1996
1998
2000
2002
2004
2006
2008
2010
WAEMU GNB
Africa-Benchmark Linear (WAEMU)
Linear (GNB) Linear (Africa-Benchmark)
Export Partner Concentration(Theil Index Decomposition, Lower Values=More Diversication)
0
1
2
3
4
5
6
1972
1974
1976
1978
1980
1982
1984
1986
1988
1990
1992
1994
1996
1998
2000
2002
2004
2006
2008
2010
Intensive Extensive Total
Guinea-Bissau: Export Product Concentration(Theil Index Decomposition, Lower Values=More Diversication)
2.5
3
3.5
4
4.5
5
5.5
6
6.5
1972
1974
1976
1978
1980
1982
1984
1986
1988
1990
1992
1994
1996
1998
2000
2002
2004
2006
2008
2010
WAEMU GNBAfrica-Benchmark Linear (WAEMU)Linear (GNB) Linear (Africa-Benchmark)
Export Product Concentration(Theil Index Decomposition, Lower Values=More Diversication)
0
1
2
3
4
5
6
1972
1974
1976
1978
1980
1982
1984
1986
1988
1990
1992
1994
1996
1998
2000
2002
2004
2006
2008
2010
Intensive Extensive Total
Guinea-Bissau: Export Partner Concentration(Theil Index Decomposition, Lower Values=More Diversication)
0
1
2
3
4
5
6
7
BEN BFA CIV GNB MLI NER SEN TGO WAEMU
Intensive Extensive Total
Export Product Diversification, 2006-2010
(Theil Index Decomposition, Lower Values=More Diversication)

GUINEA-BISSAU
44 INTERNATIONAL MONETARY FUND
C. Fostering Economic Diversification in Guinea-Bissau
8. To support diversification, policies should focus on addressing weaknesses that hinder
entry into new lines of economic activity (Box 2; IMF 2014a). Weaknesses abound in Guinea-
Bissau in particular in terms of the provision of infrastructure, the regulatory and institutional
environment, the accumulation of human capital, and the provision of finance. Evidence from cross-
country comparisons and individual case studies suggests that policies targeting these areas can be
successful in fostering structural transformation and diversification, while the evidence is more
mixed concerning the success of industry-focused and narrowly targeted measures (Box 2).
However, given its dominance in terms of contributions to GDP and to employment and the
potential for productivity and quality improvements, the agricultural sector, and in particular the
cashew nut sector, warrants special attention in Guinea-Bissau. The following paragraphs therefore
focus on the cashew sector.
Figure 5. Guinea-Bissau: Export Quality
Relative agricultural quality has been lower than in the WAEMU and fast growing African countries...
... as has the quality of commodity exports for the periods observed.
The quality of manufactured goods is generally not significantly worse than in the WAEMU on average.
However, exports are dominated by products of relatively lower quality.
Source: Data from IMF (2014a).
0
0.2
0.4
0.6
0.8
1
1.2
1980
1982
1984
1986
1988
1990
1992
1994
1996
1998
2000
2002
2004
2006
2008
2010
WAEMU Asia-Benchmark
Africa-Benchmark
Manufacturing Quality(1 = 90 Percentile of All Countries)
00.10.20.30.40.50.60.70.80.9
1
1980
1982
1984
1986
1988
1990
1992
1994
1996
1998
2000
2002
2004
2006
2008
2010
WAEMU Guinea-Bissau
Africa-Benchmark
Agricultural Quality(1 = 90 Percentile of All Countries)
Source: IMF (2014a).
0
0.2
0.4
0.6
0.8
1
1.2
1980
1982
1984
1986
1988
1990
1992
1994
1996
1998
2000
2002
2004
2006
2008
2010
WAEMU Guinea-Bissau
Africa-Benchmark
Commodity Quality(1 = 90 Percentile of All Countries)
0
0.2
0.4
0.6
0.8
1
1.2
1.4
Benin
Burkina Faso
Côte d'Ivoire
GuineaBissau
Mali
Niger
Senegal
Togo
Export Quality for Five Largest Export Sectors(1=90 Quality Percentile of All Countries;
Size of Bubbles Proportional to Product Share)

GUINEA-BISSAU
INTERNATIONAL MONETARY FUND 45
Box 2. Reforms which Foster Structural Transformation
(based on IMF 2014a)
While there is no silver bullet of reform to foster structural transformation, the following general policies
have emerged from successful country case studies and cross-country evidence (IMF 2014a, IMF 2013).
Several of these policies may be addressed at both the national and regional levels:
Macroeconomic stability. In Vietnam, Rwanda, Malaysia and Tanzania successful diversification has
coincided with stronger macroeconomic policies and a greater degree of stability.
Market entry. Reduced entry barriers can motivate entrepreneurs to expand their activities. In
Vietnam collectivization was reversed which led to the emergence of a more diverse agricultural
sector. In Rwanda a large divestment of state enterprises stimulated private sector activity, and in
Tanzania, the dismantling of the state distribution system has positively affected the private sectors
as well. The liberalization of the electricity market has been associated with higher degrees of
structural transformation as well.
Education. Education has been associated with higher levels diversification and export quality. In
Vietnam, years of education increased by about 50 percent in just two decades. In Rwanda,
education has been expanded through ninth grade for all students.
Institutions and the business environment. Henn et al. (2013) report that a one standard deviation
increase in institutional quality is associated with a 0.3 increase in quality upgrading. In Bangladesh,
the removal of red tape has been associated with large investments in export processing zones.
Industrial policies. The support of specific industries has shown mixed results. In Malaysia and
Bangladesh, the targeting of specific industries has been successful, but the targeted sectors have
become dominant, decreasing export diversification. In natural resource dominated economies,
however, such targeting may help the economy to diversify.
“Quick–Wins” in the agricultural sector: Reforming the FUNPI
9. Background: The agribusiness development fund has failed to achieve its objectives
(IMF, 2014c). The FUNPI (Fundo para a Promoção da Industrialização dos Produtos Agrícolas) was
created in 2011 to promote agribusiness by easing financing constraints in a time when cashew
exports from Guinea-Bissau were selling at historically high levels. It has been financed by
surcharges of about US$100 per ton of exports of raw cashew nuts that were additional to export
taxes. However, the FUNPI faced major implementation problems:
The uncertainty over level of surcharge every year resulted in inefficiencies, due to impeded
possibility to plan the season, and speculative behavior in financial decisions, stockpiling and the
timing of sales.
Divergence from use of funds for intended purpose. FUNPI revenues have been partly used by the
transitional government to ease a tight budget situation.
Increase in poverty. Farmers, the majority of whom are poor, have been burdened most by the
regressive FUNPI rate, as the tax was passed on directly to the farmers.
Smuggling. The creation of the surcharge also increased smuggling and therefore losses in
revenues, with the World Bank estimating losses in tax revenues and port/freight charges of
US$6.6 million (World Bank, 2014).

GUINEA-BISSAU
46 INTERNATIONAL MONETARY FUND
10. The authorities committed to an international audit of the FUNPI, the result from
which would help restructure or close the Fund. The results from this audit, to be completed by
September 2015 with the help of the World Bank, will lay the foundation for a new strategy to
promote the cashew nut sector and to reduce poverty in rural areas. In particular, the elimination of
the FUNPI tax would increase incomes for poor farmers and reduce poverty and extreme poverty by
2 and 3 percentage points, respectively. In combination with improved customs controls, it would
reduce smuggling, thus boosting the government’s revenue base. Development partners, such as
the World Bank, are also willing to support the cashew sector through lending, guarantee funds and
technical assistance.
Medium-term strategies2
11. While the expansion of other sectors, such as rice, mining, and tourism will be
essential, developing a cashew processing industry can foster employment and structural
transformation. According to recent World Bank estimates, approximately one job would be
created for every three tons of processed cashew nuts, mainly in rural areas (World Bank, 2014).
Expanding the cashew sector into processing would also result in less dependence on India as an
export partner, and thus reduce the economy’s vulnerability to shocks by diversifying export
destinations. Given the current infrastructure gap, cashew processing could minimize pressure on
roads by lowering transport volumes when exporting cashew kernel. It would imply higher value-
added, thus stimulating growth and supporting the balance of payments.
10. Developing a cashew sector will require overcoming several challenges in financing,
the business environment and infrastructure. The banking sector currently prefers to finance
exports of raw cashew nuts rather than processed ones. It also sees lending to the private sector in
general as risky as obtaining information on credit worthiness is very difficult and contract
enforcement relatively weak (see Section 2). Stronger contract enforcement, for example via the
opportunity to faster recovery of collateral, could go a long way in stimulating lending and lowering
borrowing costs. Political stability risks and challenging business environment pose obstacles to
foreign investment, making the security sector reform not only essential from an overall stability
perspective but also for the financing of economic activity. Entrepreneurial capacity will need to be
strengthened with a view of implementing best practices in the processing of cashew in the medium
to long term (e.g. importing cashew nuts to employ cashew processing facilities in off-seasons as
well). Large investments in roads will be necessary to ease transportation as there is currently hardly
road access during the rainy season. Particular focus on attracting foreign investment to medium-
size processing plants and establishing community-level processing facilities would help promote
inclusiveness of the growth outcomes from these activities.
2 This section has heavily benefited from the analysis in World Bank (2014).

GUINEA-BISSAU
INTERNATIONAL MONETARY FUND 47
D. Conclusions
11. Short and medium-term policies to diversify Guinea-Bissau’s economy could help the
country break with a history of low and volatile growth. With exports and commercial bank
lending being dominated by the cashew nut sector, Guinea-Bissau is highly exposed to exogenous
shocks such as fluctuations in international cashew prices. In the short term, to reduce the
economies exposure to shocks, policies should focus on exploring “quick-wins” to economic
diversification, such as reform or closure of the FUNPI. To further diversify the economy in the
medium to long term, policies could focus on easing main constraints in key areas such as
infrastructure, education and the business climate. Given the importance of the primary sector for
Guinea-Bissau and the country’s biodiversity, economic policies could also target specific activities
such as rice cultivation and mining, as envisaged under the government’s Strategic Plan.

GUINEA-BISSAU
48 INTERNATIONAL MONETARY FUND
References
Dabla-Norris, E., G. Ho, K. Kochhar, A. Kyobe, and R. Tchaidze (2013): “Anchoring Growth: The
Importance of Productivity-Enhancing Reforms in Emerging Market and Developing
Economies”; IMF SDN/13/08
Drummond, P., V. Thakoor and S. Yu (2014): “Africa Rising: Harnessing the Demographic Dividend“;
IMF WP/14/143.
Guengant, J. P. and May, J. F. (2013): “African Demography. Global Journal of Emerging Market”;
Economies 5 (3); 215-267.
Louise F., C. Haines, J. Huerta Munoz, and A. H. Thomas, (2013); “Africa’s Got Work to Do:
Employment Prospects in the New Century”; IMF WP/13/201
Henn, C., C. Papageorgiou, and N. Spatafora (2013): “Export Quality in Developing Countries”; IMF
WP/13/108.
IMF (2014a): Sustaining Long-Run Growth and Macroeconomic Stability in Low-Income Countries—
The Role of Structural Transformation and Diversification—Background Notes.
IMF (2014b): West African Economic and Monetary Union; Staff Report on Common Policies for
Member Countries.
IMF (2014c): Guinea-Bissau. Request for Disbursement under the Rapid Credit Facility. IMF Country
Report No. 14/318.
IMF (2015a): West African Economic and Monetary Union; Staff Report on Common Policies for
Member Countries.
IMF (2015b): West African Economic and Monetary Union; Selected Issues Paper. IMF Country
Report No. 15/101.
World Bank (2014): “Terra Ranca! A Fresh Start”; Country Economic Memorandum. Washington, DC.