Embed Size (px)
Citation preview

© 2015 International Monetary Fund
IMF Country Report No. 15/16
REPUBLIC OF POLAND ARRANGEMENT UNDER THE FLEXIBLE CREDIT LINE AND CANCELLATION OF THE CURRENT ARRANGEMENT—STAFF REPORT; PRESS RELEASE; AND STATEMENT BY THE EXECUTIVE DIRECTOR FOR THE REPUBLIC OF POLAND
In the context of the arrangement under the Flexible Credit Line and cancellation of the current arrangement, the following documents have been released and are included in this package: The Staff Report prepared by a staff team of the IMF for the Executive Board’s
consideration on January 14, 2015. Based on information available at the time, the staff report was completed on December 30, 2014.
A Staff Supplement of January 5, 2015 on the assessment of the impact of the proposed Flexible Credit Line arrangement on the Fund’s finances and liquidity position.
A Press Release including a statement by the Acting Chair of the Executive Board.
A Statement by the Alternate Executive Director for the Republic of Poland.
The policy of publication of staff reports and other documents allows for the deletion of market-sensitive information.
Copies of this report are available to the public from
International Monetary Fund Publication Services PO Box 92780 Washington, D.C. 20090
Telephone: (202) 623-7430 Fax: (202) 623-7201 E-mail: [email protected] Web: http://www.imf.org
Price: $18.00 per printed copy
International Monetary Fund Washington, D.C.
January 2015

REPUBLIC OF POLAND
ARRANGEMENT UNDER THE FLEXIBLE CREDIT LINE AND
CANCELLATION OF THE CURRENT ARRANGEMENT
KEY ISSUES
Background: Poland’s strong fundamentals and sound policies helped it to successfully
withstand several bouts of market turbulence and paved the way for economic
recovery. While Poland has benefited from its continued transformation into a more
open and dynamic economy, its substantial trade and financial linkages with global
markets, combined with still-large financing needs, also make it vulnerable to external
shocks.
Outlook and risks: With only modest growth in its trading partners, economic activity
in Poland is expected to remain moderate in the near term. Risks remain tilted to the
downside amid concerns about a protracted slowdown in the euro area, continued
geopolitical tensions in the region, and uncertainty surrounding normalization of
monetary policy in the United States. Domestically, the risk of continued disinflation
remains high.
Flexible Credit Line (FCL): Against this background, the authorities are requesting a
new two-year precautionary FCL arrangement with proposed lower access in the
amount of SDR 15.5 billion (918 percent of quota) and cancellation of the current
arrangement, approved on January 18, 2013. Poland’s improved economic
fundamentals and increased policy buffers have reduced financing needs. However,
external risks remain elevated. In this context, the authorities consider that a new FCL in
the requested amount would provide an important insurance against external risks, help
sustain market confidence, and support their economic strategy. At the same time, the
authorities consider that the substantial reduction in access sends a clear signal of their
intention to fully exit from the FCL once external risks recede. In staff’s view, Poland
continues to meet the qualification criteria for access under the FCL arrangement.
Fund liquidity: The impact of the proposed commitment of SDR 15.5 billion on Fund
liquidity would be manageable.
Process: An informal meeting to consult with the Executive Board on a possible FCL
arrangement for Poland was held on December 19, 2014.
December 30, 2014

REPUBLIC OF POLAND
2 INTERNATIONAL MONETARY FUND
Approved By Mahmood Pradhan and Sanjaya Panth
The report was prepared by a staff team led by Daria Zakharova and comprising Lone Christiansen, Christian Ebeke, Francisco Vazquez (all EUR), and Annette Kyobe (SPR). Excellent assistance was provided by Fernando Morán Arce and Bartek Augustyniak (both EUR).
CONTENTS
CONTEXT _________________________________________________________________________________________ 4
RECENT DEVELOPMENTS ________________________________________________________________________ 6
OUTLOOK, RISKS, AND POLICIES _______________________________________________________________ 7
THE ROLE OF THE FLEXIBLE CREDIT LINE _____________________________________________________ 11
A. Access Considerations _______________________________________________________________________ 12
B. Exit Considerations __________________________________________________________________________ 12
C. FCL Qualification Criteria ____________________________________________________________________ 14
IMPACT ON FUND FINANCES, RISKS, AND SAFEGUARDS ___________________________________ 16
STAFF APPRAISAL ______________________________________________________________________________ 17
BOXES 1. External Economic Stress Index ________________________________________________________________ 10 2. Adverse Scenario ______________________________________________________________________________ 13 FIGURES 1. Trade and Financial Integration, 1995–2014 ___________________________________________________ 19 2. Reserve Coverage in International Perspective, 2013 __________________________________________ 20 3. Recent Economic Developments, 2009–14 ____________________________________________________ 22 4. Balance of Payments, 2009–14 _________________________________________________________________ 23 5. Banking Sector Capital and Asset Quality, 2009–14 ___________________________________________ 24 6. Bank Credit Growth and Funding, 2009–14 ____________________________________________________ 25 7. Financial Markets, 2009–14 ____________________________________________________________________ 26 8. Comparing Adverse Scenarios _________________________________________________________________ 27 9. Qualification Criteria ___________________________________________________________________________ 28 10. Indicators of Institutional Quality _____________________________________________________________ 29 TABLES 1. Selected Economic Indicators, 2011–19 _______________________________________________________ 30 2. Balance of Payments on Transaction Basis, 2011–19 __________________________________________ 31

REPUBLIC OF POLAND
INTERNATIONAL MONETARY FUND 3
4. General Government Statement of Operations, 2011–19 ______________________________________ 33 5. General Government Financial Balance Sheet, 2012–19 _______________________________________ 34 6. Monetary Accounts, 2008–14 __________________________________________________________________ 35 7. External Financing Requirements and Sources, 2012–16 ______________________________________ 36 8. Indicators of Fund Credit, 2015–20 ____________________________________________________________ 37 9. Proposed Access Relative to Other High-Access Cases ________________________________________ 38 APPENDIX Letter from the Authorities Requesting Flexible Credit Line ______________________________________ 39 ANNEXES I. Public Sector Debt Sustainability Analysis ______________________________________________________ 41
A. Baseline and Realism of Projections _________________________________________________________ 41
B. Shocks and Stress Tests _____________________________________________________________________ 43 II. External Debt Sustainability Analysis ___________________________________________________________ 49

REPUBLIC OF POLAND
4 INTERNATIONAL MONETARY FUND
CONTEXT
1. The Polish economy successfully withstood several spells of market turbulence, helped
by very strong fundamentals and policies and the insurance provided by the FCL. Alongside
limited macroeconomic imbalances, able economic management helped reinvigorate growth in
2013 and first half of 2014. Amidst bouts of global financial volatility, including associated with the
recent sharp depreciation of the Russian ruble, Polish financial markets have remained relatively
stable and the flexible exchange rate has continued to play its stabilizing role. The well-capitalized
banking system has remained resilient to external shocks. At the conclusion of the 2014 Article IV
Consultation, Executive Directors noted that Poland’s very strong fundamentals and economic
policies had helped it weather the turmoil in financial markets and that the precautionary FCL
arrangement provided important insurance against external risks.
2. Poland continues to be exposed to external shocks through significant trade and
financial integration. Reflecting its continued transformation into a more open and dynamic
economy, Poland has benefitted from increasing integration with global trade and financial markets
(Figure 1). Goods exports to the European Union represent more than ¾ of total goods exports, and
the industrial sector is tightly integrated into the German supply chain. Close to 90 percent of the
stock of foreign direct investment (FDI) originated from the European Union as of the third quarter
of 2013. The banking sector is closely interconnected with the global financial system with more
than 60 percent of assets owned by foreigners, though reliance on parent bank funding has
declined. In bond markets, nonresidents hold just above 40 percent of domestic treasury securities.
Poland’s sizable gross external liabilities and open capital account make it susceptible to spillovers
arising from shifts in investor sentiment.
3. The authorities have continued to rebuild policy space, while strengthening the
already very strong economic fundamentals and the policy framework to reduce
vulnerabilities.
The authorities have continued to increase fiscal policy space. During the 2013 slowdown,
fiscal policy allowed automatic stabilizers to operate around gradual structural consolidation.
With weak growth in 2013, the headline deficit widened from 3.7 percent of GDP in 2012 to
4 percent of GDP in 2013 but the cyclically adjusted deficit narrowed. Poland’s strong public
finances and its sound fiscal framework, which constrained public debt below 60 percent of GDP
in 2013, have contributed to sustain favorable financing conditions. The permanent expenditure
rule, implemented in 2013, should help preserve long-term fiscal sustainability, while allowing
for countercyclical fiscal policy.
Monetary policy action helped support economic stability. To counteract low inflation, policy
interest rates were cut by a cumulative 225 basis points in the course of late-2012 and 2013.
While this helped support domestic demand, inflationary pressures remain weak, primarily
reflecting low energy and food prices and subdued imported inflation.

REPUBLIC OF POLAND
INTERNATIONAL MONETARY FUND 5
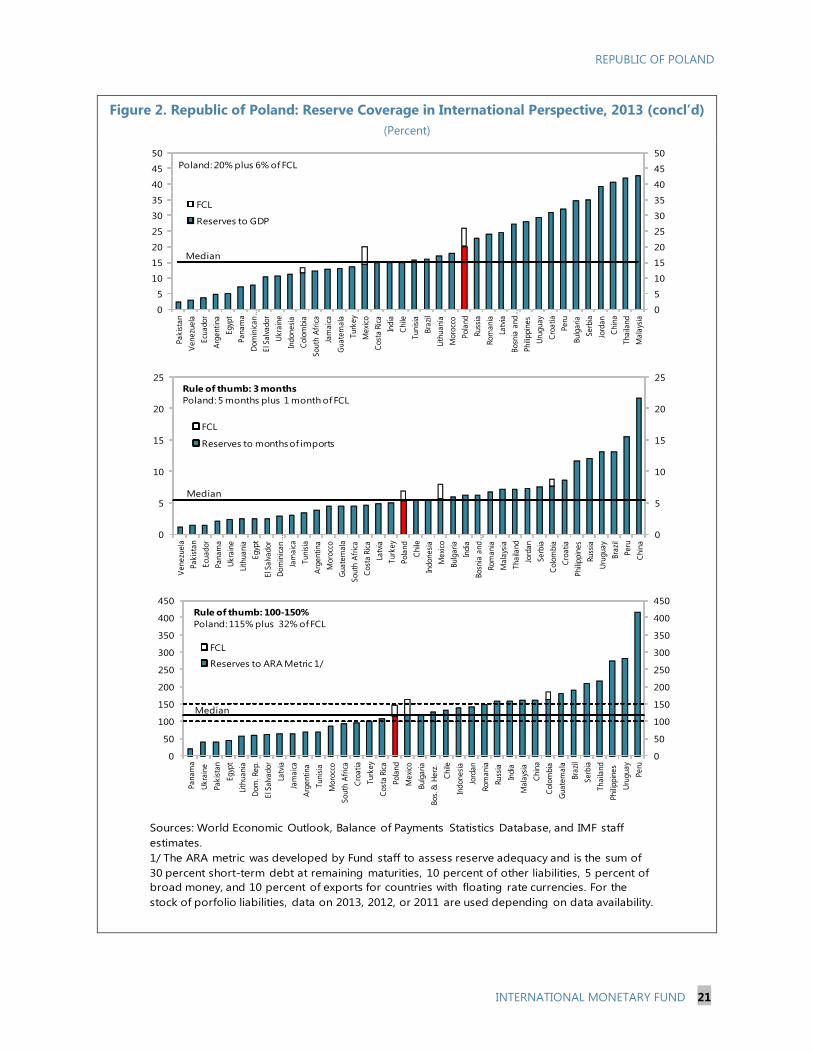
The authorities continued to build reserve buffers. International reserves increased to USD
100 billion at end-October 2014 from USD 80 billion at end-2009 and are broadly adequate
against standard benchmarks. Reserves are also relatively high compared to the median
emerging market (EM) (Figure 2) and the flexible exchange rate has continued to provide a
cushion against external shocks. The swap line with the Swiss National Bank continues to
provide added insurance in the event of severe Swiss franc funding pressures.
The financial supervisory authority (KNF) continued to strengthen financial sector
oversight. While the legacy share of foreign currency mortgages accounts for close to half of
mortgages, exposing them to exchange-rate risk, tightened rules on foreign currency lending
have halted new foreign currency mortgage origination. The gradual lowering of maximum
loan-to-value (LTV) ratios on new mortgages to 80 percent by 2017 will further reduce risks.
Republic of Poland: Trade and Financial Linkages
A large share of trade is with Europe… …and the banking system is largely foreign owned.
Nonresidents hold a large part of domestic treasuries… …and external liabilities are large.
Italy
13.1
Germany
10.3Netherlands
8.9
Spain
8.5
USA
5.7
France
4.7
Portugal
4.1
Other
8
Domestic
36.8
Bank Ownership Structure
(Percent of assets, 2013)
Sources: KNF and IMFstaff calculations.
0
20
40
60
80
100
120
140
160
2009 2010 2011 2012 2013 2014
International Investment Position, Liabilities
(Percent of GDP)
Other sectors
General government
Banks
Sources: National Bank of Poland and IMF staff calculations.
10
15
20
25
30
35
40
45
2009 2010 2011 2012 2013 2014
Owned by domestic banks (incl. MoF)
Owned by foreign investors
Ownership of Local Government Bonds
(Percent of treasury securities outstanding)
Sources: Haver Analytics, Polish Ministry of Finance,
and IMF staff calculations.
DEU
26%
GBR
7%
CZE
6%FRA
6%RUS
5%
ITA
5%
NLD
4%SWE
3%
UKR
3%
SVK
3%
HUN
3%
ESP
2%
BEL
2%
Other EU
11%
Others
14%
Export Shares (2013)
Sources: Direction of Trade Statistics and IMF staff calculations.

REPUBLIC OF POLAND
6 INTERNATIONAL MONETARY FUND
RECENT DEVELOPMENTS
4. After a domestic demand-led recovery
in the beginning of 2014, growth has
moderated. On the back of monetary easing,
economic activity gathered strength in 2013 and
into the first quarter of 2014. However, growth
moderated in the second quarter of 2014 amid the
slowdown in the euro area and adverse
confidence effects from geopolitical tensions
surrounding Russia and Ukraine. While the
purchasing managers’ index (PMI) recently picked
up and growth in the third quarter held up better
than expected, recent downward revisions of
growth forecasts in key European trading partners
point to downside risks to the baseline forecast
(Figure 3, Table 1).
5. The labor market continued to strengthen. The seasonally adjusted unemployment rate
(LFS definition) continued to decline, reaching 8½ percent in September on the back of positive job
creation in the manufacturing sector. Nominal wage growth has also held up well, supporting
private consumption.
6. Inflation remains well below the target.
Despite improvements in the labor market,
headline inflation continued to decline, reaching a
historic low of -0.6 percent in October. This
reflected both weak imported inflation from main
trading partners as well as low food and energy
price inflation. In turn, repeated external supply
shocks fed into core inflation through second-
round effects, resulting in a downward revision of
inflation projections since the 2014 Article IV
consultation.
7. The current account has continued to
improve (Figure 4, Table 2). The current account
deficit narrowed from around 5 percent of GDP during 2010–11 to 1.4 percent of GDP in 2013. The
improvement largely reflects a healthy trade surplus on the back of strong exports, in part as a result
of increased trade with Central and Eastern Europe (CEE) and the Commonwealth of Independent
States (CIS). The current account was largely financed by EU structural funds. Foreign direct
investment has traditionally served as a relatively stable source of financing. However, partly owing
-2
-1
0
1
2
3
4
5
6
2007 2008 2009 2010 2011 2012 2013 2014
CPI
Core CPI (excl. food and energy)
Euro area HICP
Inflation
(Year-on-year inflation in percent)
Sources: Haver Analytics, NBP, Statistics Poland, and IMF
staff calculations.
30
35
40
45
50
55
60
2009 2010 2011 2012 2013 2014
Poland
Euro area
Sources: Haver Analytics, HSBC/Markit, and IMF staff
calculations.
Purchasing Managers' Index
(Diffusion index: 50+ = expansion, seasonally adjusted)

REPUBLIC OF POLAND
INTERNATIONAL MONETARY FUND 7
to one-off factors, net FDI inflows have recently
declined. The exchange rate is broadly consistent
with fundamentals and desirable policy settings.
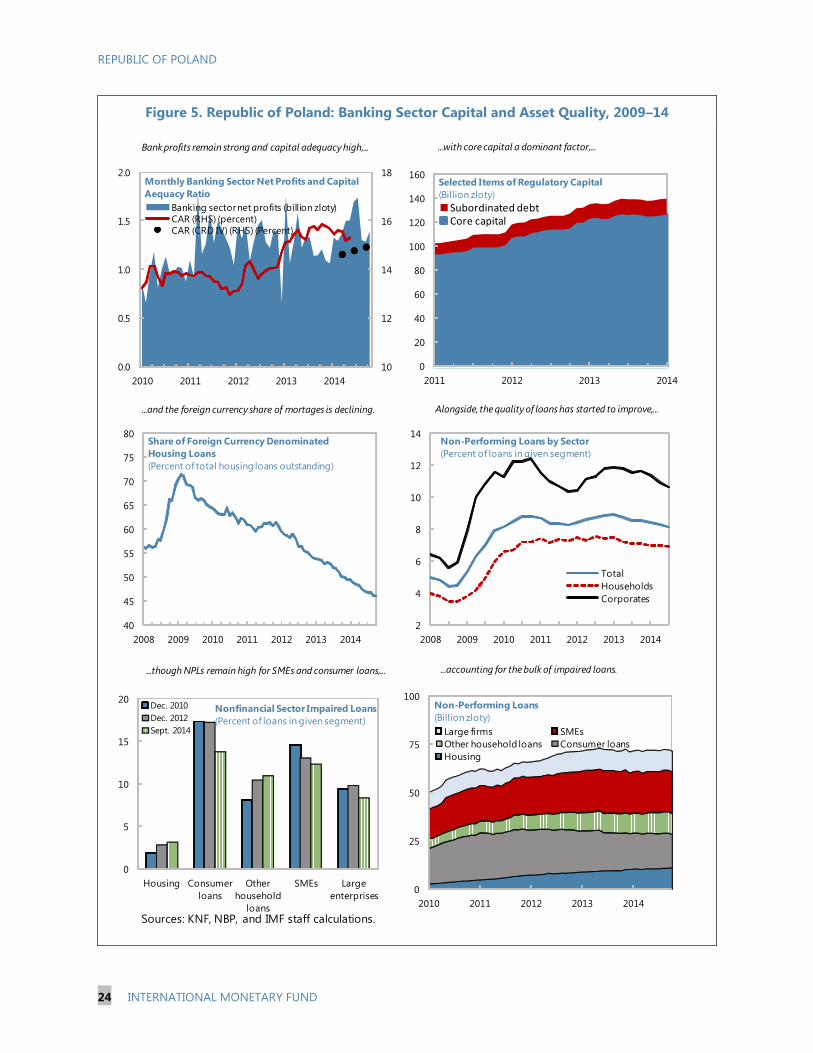
8. The financial sector has remained well
capitalized, liquid, and profitable (Figures
5 and 6, Table 3). The total capital ratio under
CRDIV stood at 14.9 percent in the third quarter
with the Tier 1 capital ratio at 13.7 percent.
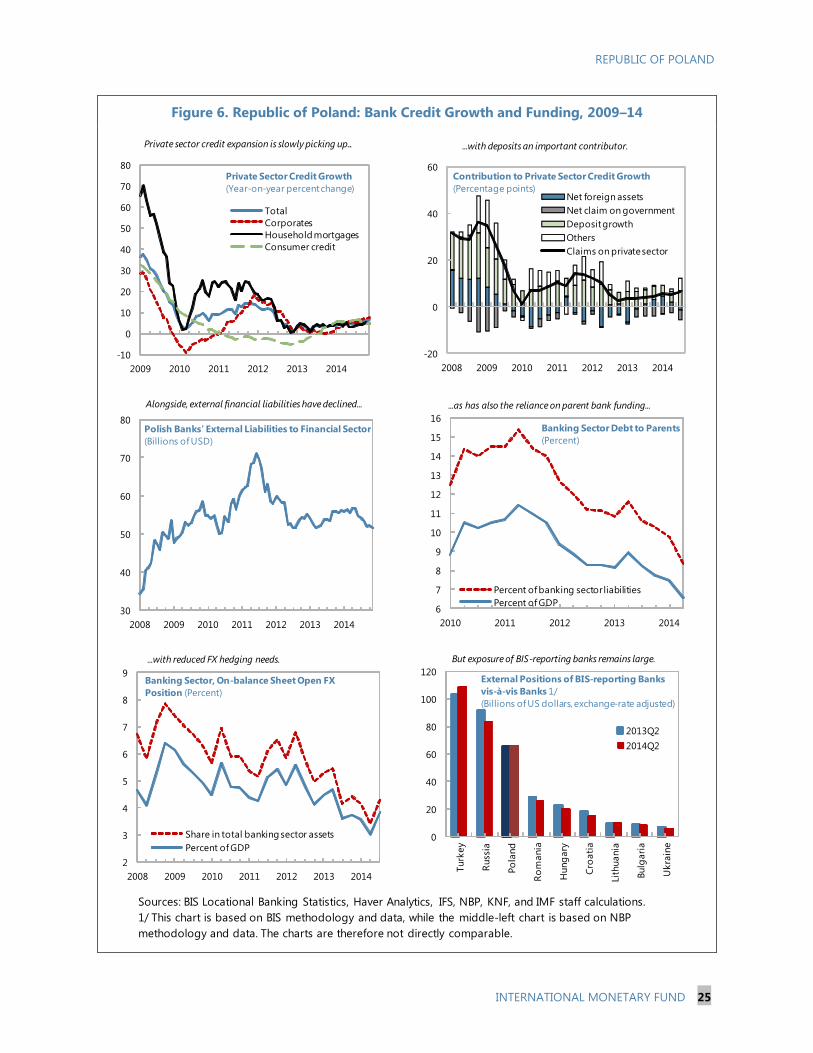
Profitability has remained healthy. The banking
sector is liquid with deposit growth at 8.3 percent
in September 2014 and a declining funding gap.
The KNF’s Asset Quality Review and stress tests,
which were undertaken alongside the ECB’s Comprehensive Assessment of banks in the euro area,
confirmed the banking sector’s resilience to shocks. The NPL ratio has continued to gradually
decline, falling to 8.2 percent in September 2014 from a peak of 9 percent about one and a half
years earlier. Credit growth has strengthened moderately, staying above 5 percent year-on-year in
September. Liabilities to foreign financial institutions have diminished in an orderly fashion.
9. Fiscal consolidation has continued. Overall, the headline deficit is expected to decline by
close to 1 percentage point of GDP to 3.1 percent of GDP in 2014 (Tables 4 and 5). Public debt is
projected to drop by about 7 percentage points to 48.8 percent of GDP in 2014 owing to the one-
off transfer of pension fund holdings of public debt to the social security administration.
Correspondingly, the thresholds in the correction mechanism of the fiscal rule have been lowered by
7 percentage points of GDP with the aim of permanently stabilizing public debt at a lower level.
Public debt is deemed sustainable under a variety of shocks. Reflecting supportive external financing
conditions and very strong fundamentals, spreads on 10-year bond yields vis-à-vis Germany reached
a six-year low in late-October 2014, dropping to around 170 basis points.
OUTLOOK, RISKS, AND POLICIES
10. Near-term economic activity is expected to moderate. Staff projects real GDP growth to
moderate from 3.2 percent in 2014 to 3 percent in 2015. While the recent decline in oil prices may
help lift growth and the current account, the direct impact will likely be limited by the relatively small
share of oil in Poland’s energy consumption and imports. Moreover, the worsening growth outlook
in Poland’s trading partners, including in the CIS, would more than offset this effect. Inflation is
expected to gradually increase and enter the lower end of the tolerance band (1.5 to 3.5 percent) by
early 2016, though continued decline in oil prices presents additional downside risk to this
projection.
11. Over the medium term, growth is projected to gradually strengthen. Growth is expected
to reach 3.5 percent in the medium term on the back of robust domestic demand, supported by
higher EU structural funds under the 2014–20 EU budget and improving labor market conditions.
90
95
100
105
110
115
2009 2010 2011 2012 2013 2014
Real
Nominal
Poland: Effective Exchange Rates
(Index: 2009 = 100)
Sources: INS and IMF staff calculations.

REPUBLIC OF POLAND
8 INTERNATIONAL MONETARY FUND
The current account deficit is projected to widen moderately along with declining net income. The
output gap should close by 2017.
12. External risks have abated somewhat but remain elevated. Risks to the outlook are tilted
to the downside, primarily owing to external risks, though protracted domestic low inflation could
also dampen activity. The nature of risks has shifted since the time of approval of the current FCL
arrangement as crisis-related risks in the euro area have subsided while other risks have arisen. ECB
actions since 2012, including the successful completion of the Comprehensive Assessment, have
lessened uncertainty about the health of the European banks’ balance sheets, thereby reducing the
risk of disorderly deleveraging stemming from bank exposures. However, the risk of a protracted
period of slower growth in the euro area remains and concerns also arise from the uncertain market
reaction to monetary policy tightening in the US. Further, the October 2014 WEO noted that
geopolitical risks, including related to Russia and Ukraine, have added to downside risks. The
October 2014 GFSR adds that while credit risks in the global financial system have declined along
with improved asset quality, market and liquidity risks have increased following an increase in risk
appetite. Accordingly, the external economic stress index for Poland indicates that, while external
conditions have improved moderately, substantial downside risks remain (Box 1).
Global Outlook
The probability of recession has increased… …as have market and liquidity risks.
Protracted period of slower growth in the euro area. Prolonged slower growth among
trading partners would have large effects on Poland. Poland’s successful integration into the
German supply-chain has shaped its trade linkages with Europe and with the rest of the world.
The recent downward growth revisions in the euro area and worsening high-frequency
indicators, combined with high synchronization of Poland’s growth rates with those in Germany
and the euro area, increase the likelihood of a further loss of growth momentum in Poland.
Furthermore, a sharper-than-expected slowdown in the euro area could result in a sudden shift
in market sentiment, accompanied by capital outflows.
0
10
20
30
40
United
States
Euro area Japan Emerging
Asia
Latin
America
Rest of
the world
Oct. 2014 WEO: 2014:Q3–2015:Q2
April 2014 WEO: 2013:Q4–2014:Q3
Probability of Recession, 2014:Q3–2015:Q2
(Percent)
Source: IMF World Economic Outlook, October 2014.
Emerging market
risks
Credit risks
Market and
liquidity risks
Risk appetite
Monetary and
financial
conditions
Macroeconomic
risks
October 2014 GFSR
April 2014 GFSR
Global Financial Stability Map
(Away from center signifies higher risks, easier monetary and
financial conditions, or higher risk appetite)
Source: IMF Global Financial Stability Report, October 2014.

REPUBLIC OF POLAND
INTERNATIONAL MONETARY FUND 9
Republic of Poland: Growth Spillovers
Growth has been revised down substantially… …with expected spillovers to Poland.
An abrupt surge in global financial market volatility. Poland’s open capital account makes it
susceptible to spillovers arising from shifts in investor sentiment. While Poland’s deep and liquid
financial markets have benefitted its economy, they also present risks. Poland’s sizeable portfolio
inflows make it vulnerable to an abrupt surge in global financial market volatility, including from
a potential worsening of the situation in Russia and a stronger-than-expected market reaction
from the normalization of U.S. monetary policy—though asset purchases by the European
Central Bank are a risk-mitigating factor. Poland’s role as a proxy for the CEE region also involves
a large zloty turnover in global markets. High short-term debt amortization needs in both
financial and nonfinancial sectors make the private sector vulnerable to shocks, including a
decline in rollover rates associated with tighter financial market conditions. While nonfinancial
corporate (NFC) sector vulnerabilities are mitigated by the high share of intercompany loans,
total external NFC debt at around 30 percent of GDP is high relative to non-European peers.
Hence, large interest-rate shocks could pose a risk.
0.0
0.5
1.0
1.5
2.0
Euro area Germany
f2014; April f2014; October
f2015; April f2015; October
Real GDP Growth Forecasts (Percent; forecasts done in
April and October 2014 for the years 2014 and 2015)
Source: IMF staff calculations.
0
20
40
60
80
100
Hung
ary
Bulg
ari
a
Ro
mania
Slo
vak R
ep.
Po
land
Cze
ch R
ep
.
Russ
ia
Turk
ey
Chile
Thailand
Bra
zil
So
uth
Afr
ica
Ind
ia
Philip
pin
es
Mexi
co 1
/
Ind
onesi
a
Arg
enti
na
Co
lom
bia
Intercompany
Nonintercompany
Nonfinancial Sector External Debt, 2013
(Percent of GDP)
Sources: IFS, World Economic Outlook database, IMF staff
calculations. 1/ FDI debt instruments not available.
0.58 0.600.570.54
0.0
0.2
0.4
0.6
0.8
1.0
with Euro area with Germany
2000–2007
2008–2014
Poland: Synchronization of growth rates
(Correlation coefficients of GDP growth)
Sources: Haver Analytics; and IMF staff calculations.
Computed from quarterly
year-on-year growth rates
-1000
-800
-600
-400
-200
0
200
400
600
800
2009 2010 2011 2012 2013 2014
Poland Hungary
Czech Rep. Romania
Bulgaria Ukraine
Monthly Bond Funds Flows: ETFs and Mututal
Funds (Millions of US dollars)
Sources: EPFR Global, Haver Analytics, and IMF staff
calculations.

REPUBLIC OF POLAND
10 INTERNATIONAL MONETARY FUND
Sustained geopolitical tensions surrounding Russia and Ukraine. Continued tensions could
dampen confidence and growth and increase financial market volatility. Though direct trade and
financial links to Russia are limited, Poland remains vulnerable to energy supply disruptions from
Russia. Hence, gas-intensive industries could be particularly affected. In addition, confidence
effects could discourage investment in Europe with direct trade and financial spillovers to
Poland.
Box 1. Republic of Poland: External Economic Stress Index
The external economic stress index for Poland is calculated following the methodology in The Review of the
Flexible Credit Line, the Precautionary and Liquidity Line, and the Rapid Financing Instrument, IMF Policy
Paper, April 2014.
The external stress index shows that while external economic conditions for Poland have improved,
risks remain elevated. The index is an indicator of the evolution of the external environment as it pertains
to Poland. Risks are divided into real shocks (growth in the euro area) and financial shocks (change in the
US 10-year bond yield, the VXEEM, and European banks’ equity price). The index is a weighted sum of
standardized deviations of external risk variables from their means. The weights are estimated using balance
of payments and international investment position data, all expressed as shares of GDP:
the weight on euro area growth (0.21) corresponds to the sum of exports and FDI from the euro area;
the weights on the change in the US long-term yield (-0.31) and the emerging market implied volatility
VXEEM (-0.09) correspond to the stocks of foreign portfolio debt and foreign-held equity; and
the weight on the European banks’ equity price (0.38) is represented by the stock of cross-country bank
exposure.
The index shows that external risks remain elevated. After a sharp deterioration of external conditions
following Fed-tapering talks in May 2013, conditions
have improved as global financial volatility has
subsided and economic activity in the euro area has
picked up. However, under staff’s baseline, external
risks would remain elevated, reflecting the recent
downward revision of the euro area growth forecast
and the expected increase in US interest rates.
Adverse scenarios assume a negative shock to
euro area growth and a sudden shift in market
sentiment, triggered by a stronger-than-expected
market reaction to the normalization of monetary
policy in the US. Two downside scenarios are
simulated to assess external stress under these
shocks. The first scenario is based on a 100 basis point
increase in long-term US interest rates above the
baseline, combined with a two-standard-deviation increase in the VXEEM, as investors reassess underlying
risks. This scenario is in line with that in the 2014 Spillover Report. The second scenario assumes a reduction
in euro area growth by 0.5 percentage points relative to the 2015 baseline—in line with the October 2014
World Economic Outlook downside scenario of 0.5 percentage point reduction in growth in advanced
economies as a result of secular stagnation—combined with a reduction in euro area bank equity valuation.
As expected, the euro area shock triggers a steeper decline in the index, consistent with Poland’s strong
trade and financial linkages with Europe.
-2.0
-1.5
-1.0
-0.5
0.0
0.5
1.0
1.5
2008 2009 2010 2011 2012 2013 2014 2015
Baseline
U.S. interest rate and VXEEM shocks
Euro area growth and bank equity price shocks
Poland: External Economic Stress Index
(Negative values indicate above average stress)
Source: IMF staff calculations.

REPUBLIC OF POLAND
INTERNATIONAL MONETARY FUND 11
13. Domestically, the risk of continued disinflation remains high. Disinflation could persist
owing to external factors, including declining energy and food prices and low imported inflation,
although recent exchange rate depreciation is a mitigating factor. Inflation could also fail to pick up
if domestic demand slows or if low inflation expectations become entrenched in the absence of
further policy action.
14. Against this background, policies appropriately focus on supporting the economy
while continuing to gradually build buffers.
The 2015 budget is broadly neutral. The fiscal deficit is projected to reach 2.6 percent of GDP
in 2015, which should allow Poland to exit the excessive deficit procedure by 2016 as planned.
Public debt is projected to continue gradually declining and is deemed sustainable with a robust
risk profile in terms of interest, rollover, and foreign currency risks (Annex I). The authorities’
medium-term objective (MTO) of a 1 percent of GDP deficit in structural terms is adequate to
put public debt on a firm downward path. This would require additional consolidation measures
of about 1 percent of GDP over the medium term. Poland maintains a sound fiscal framework,
anchored in a constitutional public debt limit, an expenditure rule, and three preventive debt
thresholds enshrined in the Public Finance Law. The authorities are planning to conduct an
expenditure review in selected spending areas to support the implementation of the rule.
The authorities have eased monetary policy to help support inflation. In the context of low
inflation and moderate economic activity, the Monetary Policy Committee (MPC) reaffirmed its
2.5 percent inflation target (Table 6). After halting the easing cycle in mid-2013 as the recovery
started to gain strength, the main policy interest rate was lowered by 50 basis points in October
2014 to 2 percent (a historic low) to help steer inflation back to target. Nonetheless, additional
policy action may be needed if inflation fails to pick up.
Work is continuing to strengthen financial sector supervision. The authorities have
intensified efforts to resolve the small but vulnerable credit union segment with a number of
institutions developing rehabilitation plans and with merger and takeover also being carried out.
Work is ongoing to establish a systemic risk board (SRB), essential for macroprudential
supervision, and strengthen the bank resolution framework in accordance with the European
Directive, though final legislation has been delayed owing to constitutional legal hurdles.
THE ROLE OF THE FLEXIBLE CREDIT LINE
15. The authorities have highlighted the benefits from the precautionary FCL
arrangement. The FCL has complemented international reserves and Poland’s very strong
fundamentals and policies. It allowed space to rebuild policy buffers and further strengthen Poland’s
institutional framework. In turn, the economy has successfully weathered several periods of market
turbulence. Despite the 2008–09 global financial crisis, the subsequent euro area crisis, the onset of
US Fed tapering, and geopolitical tensions in Russia/Ukraine, Polish financial markets have remained
attractive to foreign investors (Figure 7). Alongside, the authorities have continued to underscore
the FCL’s important stabilizing role.

REPUBLIC OF POLAND
12 INTERNATIONAL MONETARY FUND
16. The authorities have requested a new two-year FCL arrangement with proposed lower
access of SDR 15.5 billion (about USD 23 billion). Sustained efforts to build buffers and further
strengthen the policy framework have improved economic fundamentals and reduced financing
needs. At the same time, the authorities note that while some risks have waned, others have arisen,
with overall external risks remaining elevated. Against this backdrop, the authorities have requested
an FCL arrangement with lower access. The proposed nominal access of SDR 15.5 billion is lower
than the current level of SDR 22 billion and constitutes an about 30 percent reduction as a share of
quota to 918 percent.
A. Access Considerations
17. The adverse scenario is used to gauge Poland’s financing needs in the event external
risks materialize. The scenario assumes concurrent shocks to main components of Poland’s
financial account. Poland’s gross external financing needs are large at around 20 percent of GDP in
2015 and 2016. Potential drains on reserves could arise from a sudden reduction of portfolio inflows
to government bonds or outflows from the banking system, for example precipitated by sooner-
than-expected US interest-rate hikes. Short-term debt amortization needs are high in both financial
and nonfinancial sectors. Hence, while the relatively stable intercompany debt mitigates risk, a
decline in inflows associated with tighter financial market conditions could result in severe stress
(Box 2).
18. Estimated financing needs in the adverse scenario are moderately below the current
level of access. External shocks have been adjusted to reflect the changing nature of risks. In
particular, in the adverse scenario, bank roll-over rates have been increased to reflect diminished
crisis-related risks (Figure 8). The current account is assumed not to contribute to the financing gap,
in line with Poland’s past crisis experience—at the height of the 2008–09 crisis, Poland’s current
account improved from -6.6 to -3.9 percent of GDP, reflecting strong import compression following
exchange rate depreciation . Alongside, improved fundamentals (including lower current account
and fiscal deficits and lower reliance on foreign parent bank funding) reduce external financing
needs. Strengthened buffers allow for reserve drawdown in a downside scenario, while leaving these
broadly adequate. The financing gap is estimated at about USD 23 billion, below the USD 33 billion
at the time of the last FCL request (Tables 7–9).
B. Exit Considerations
19. The proposed reduction in access sends a clear signal of the authorities’ intention to
exit from the FCL as external risks recede. The authorities’ firm commitment to maintain very
strong policies and fundamentals should facilitate eventual full exit from the FCL arrangement once
uncertainty surrounding the effects of US monetary policy tightening, euro area growth prospects,
and the situation in Russia/Ukraine diminishes.
20. The authorities have started public outreach regarding their intentions to gradually
reduce FCL access, including through press interviews and direct contact with investors. To

REPUBLIC OF POLAND
INTERNATIONAL MONETARY FUND 13
prepare financial markets for a gradual exit from the FCL, the authorities have publicly recognized
the benefits of the FCL while at the same time stressing that Poland is now better prepared to deal
with adverse external shocks than at the height of the crisis, including because of higher
international reserve buffers. Accordingly, they have signaled that Poland is well positioned to
reduce FCL access. Market reaction has been muted. To support a continued smooth exit from the
arrangement, the authorities will continue communicating their plans to financial markets and the
broader public going forward.
Box 2. Republic of Poland: Adverse Scenario
The adverse scenario takes as a starting point staff’s baseline forecast. In the baseline, the fiscal and current
account deficits have narrowed. However, gross external financing needs remain large, with the gap comfortably
financed by FDI inflows, substantial external short-term (ST) and medium and long-term (MLT) private sector
financing (of which 60 percent is intercompany debt), EU structural funds, and public sector external financing.
Baseline rollover rates are projected at around 130 percent of the average annual amortization need during
2015–16 for the public sector and 100 percent for the private sector. In the absence of external shocks, reserve
accumulation is projected at around USD 2 billion in 2015 to maintain reserves at around 120 percent of the
IMF’s Assessing Reserves Adequacy (ARA) metric.
Assumptions underlying the adverse scenario have been adjusted to reflect the changing nature and
intensity of risks. Relative to assumptions at the time of the January 2013 FCL, two changes have been made.
First, a smaller shock was applied to bank outflows (with a rollover rate of 65 percent compared to 60 percent in
the 2013 FCL request) on the back of the successful completion of the ECB’s Comprehensive Assessment of
banks in the euro area. In turn, the shocks assumed in the adverse scenario are smaller than in Poland’s previous
FCL requests. Second, the adverse scenario assumes a partial drawdown of reserves. Nonetheless, reserves would
remain adequate under the ARA metric.
The shocks underlying the adverse scenario reflect the potential impact on the financial account of a
sudden shift in market sentiment. This could for example arise from a sharper-than-expected economic
slowdown in the euro area or stronger-than-expected market reaction to the normalization of monetary policy
in the US.
Assumptions underlying the adverse scenario are as follows:
FDI flows fall 25 percent. The reduction is in line with the decline in FDI in 2009.
Equity portfolio outflows of 90 percent of non-resident equity holdings. This decline is in line with equity outflows
observed during the most recent EM sell-off (the second and third quarters of 2013) and half the amount of
outflows seen during the most intense period of the global financial crisis.
A decline in private non-financial corporate flows of 15 percent and public sector MLT borrowing of 25 percent. ST
public sector debt is fully rolled over. Rollover rates on MLT borrowing are in line with mean historical rollover
rates for emerging markets.
A decline in bank flows of 35 percent. A smaller shock was applied (compared to a 40 percent decline in the 2013
FCL) to reflect reduced uncertainty about the health of the European banks’ balance sheets following the recent
Comprehensive Assessment.
Other investment outflows of USD 3.5 billion from non-resident deposits. This amount is USD 1.5 billion lower than
outflows assumed under the adverse scenario in the 2013 FCL request, reflecting reduced reliance on foreign
funding in the banking sector and is in line with the outflow observed during EM turbulence in the fourth
quarter of 2013.
A drawdown of reserves of around USD 5 billion in 2015 and 2016. The drawdown represents around 20 percent
of total financing needs but reserves would still allow for a small margin relative to the ARA metric. Under the
adverse scenario, reserves would stand at 114 percent of the ARA metric, compared to 122 percent under the
baseline forecast. This assumption differs from the 2013 FCL request, which had assumed half the baseline
reserve buildup in the adverse scenario.

REPUBLIC OF POLAND
14 INTERNATIONAL MONETARY FUND
C. FCL Qualification Criteria
21. In staff’s view, Poland fully meets the qualification criteria identified in ¶2 of the FCL
decision (Figure 9). Poland has very strong economic fundamentals and institutional policy
frameworks. The authorities are implementing—and have a sustained track record of
implementing—very strong policies and remain committed to maintaining such policies in the
future.
A sustainable external position. Poland’s external position is broadly consistent with medium-
term fundamentals and appropriate policies. Model-based estimates assess that the current
account and the real effective exchange rate are broadly aligned with fundamentals. While net
IIP liabilities are large, sustainability concerns are mitigated by the well-diversified FDI liabilities
and intercompany lending (over 40 percent of foreign liabilities are FDI investments) (Annex II).
Foreign investments in the local government bond market are characterized by a favorable
institutional investor base.
A capital account position dominated by private flows. Capital flows are mostly from the private
sector, with official creditors accounting for only 7 percent of the external debt stock as of the
end of the first quarter of 2014.
A track record of steady sovereign access to international capital markets at favorable terms.
Poland has remained one of the highest-rated emerging market countries, with sustained access
to global capital markets—even during periods of financial distress. Bond yields have declined
throughout 2014 to below 3 percent in October. Sovereign spreads over 10-year German bonds
have declined to levels last seen in mid-2008 and EMBI spreads stand at around 100 basis
points—well below the emerging market composite. The authorities have continued to take
advantage of favorable market conditions to substantially pre-finance and extend the average
maturity and duration of public debt, improving its risk profile.
Republic of Poland: Sovereign Access to International Capital Markets
Bond yields are at historic lows… …with EMBI spreads below emerging market peers.
100
200
300
400
500
0
2
4
6
8
10
2009 2010 2011 2012 2013 2014
Spread over 10Y German bonds (RHS)
Poland 10Y yield
Germany 10Y yield
10-Year Bond Yields
(Yields in percent; spread in basis points)
Sources: Bloomberg and IMF staff calculations.
0
100
200
300
400
500
2009 2010 2011 2012 2013 2014
Poland
Composite
EMBIG Spreads
(Basis points)
Sources: Bloomberg and IMF staff calculations.

REPUBLIC OF POLAND
INTERNATIONAL MONETARY FUND 15
A reserve position that remains relatively comfortable. International reserves remain broadly
adequate. Reserves exceed the rule of thumb across most indicators of reserve adequacy and
are projected at around 120 percent of the ARA metric in 2014.
Sound public finances, including a sustainable public debt position. Fiscal policy is underpinned by
Poland’s very strong policy framework, which includes a constitutional limit on the level of public
debt and fiscal adjustments when the debt-to-GDP ratio exceeds preventive limits enshrined in
the Public Finance Law. Debt sustainability analysis indicates that the baseline fiscal path is
consistent with sustainable debt under a variety of macroeconomic scenarios (Annex I). Further,
risks stemming from the currency composition and duration profile of public debt are limited,
reflecting the strong debt management strategy.
Low and stable inflation, in the context of a sound monetary and exchange rate policy framework.
While external shocks have been a drag on inflation, it is expected to begin converging toward
the target band supported by frontloaded monetary policy easing. Following the 50 basis point
cut in October, the policy interest rates have been kept unchanged on the back of better-than-
expected growth in the third quarter. However, the MPC has noted that further monetary easing
would be justified in the event of an extended period of deflation. The authorities remain
committed to preserving their credible and transparent inflation-targeting framework.
Sound financial system and the absence of solvency problems that may threaten systemic stability.
Poland’s well-capitalized (capital adequacy at around 15 percent), liquid (liquid assets to total
assets of 21 percent), and profitable (return on assets at just above 1 percent) banking sector
serves as the core of Poland’s sound financial system. While the credit union segment is weak, its
size is equivalent to only about 1½ percent of banking sector assets, and the authorities are
taking steps to resolve it. In addition, the outcome of the European Comprehensive Assessment
increased confidence in the health of parent bank balance sheets. The National Bank of Poland
(NBP) assesses that other non-bank financial institutions have only weak linkages with the
banking sector and are characterized by their stable financial situation and activities. As such,
there are no solvency problems to threaten systemic stability.
Effective financial sector supervision. The authorities routinely undertake stress tests. Recently,
KNF undertook a Comprehensive Assessment of banks in Poland, conducted in accordance with
the ECB’s methodology, together with stress tests of 15 major banks in Poland, allowing to
assess the Polish banking sector alongside euro area banks. KNF has continued to take steps to
strengthen financial sector oversight, including through completion of a thematic supervisory
review of impaired assets and issuance of a letter to banks, summarizing regulatory
recommendations.
Data transparency and integrity. Poland has subscribed to the Fund’s Special Data Dissemination
Standard (SDDS) since 1996. Overall data provision is adequate for surveillance.
22. Furthermore, Poland’s institutions and policy frameworks rank highly among peers.
Reflecting the authorities’ continuing efforts to further strengthen the already very strong
institutions and policy frameworks, Poland compares favorably with other emerging markets on a

REPUBLIC OF POLAND
16 INTERNATIONAL MONETARY FUND
number of institutional quality indicators, including on control of corruption and government
effectiveness (Figure 10).
23. The authorities’ letter (Appendix) highlights their determination to maintain very
strong institutional policy frameworks and policies. The authorities stress their balanced
approach to macroeconomic management. Mindful of economic growth considerations, they have
been pursuing a conservative fiscal policy aimed at putting public debt on a robust downward path,
and a new permanent expenditure rule has been introduced to guide policy implementation.
Monetary policy continues to be guided by the inflation targeting framework, underpinned by the
flexible exchange rate regime. Effective financial sector supervision will continue to support financial
stability. The authorities reaffirm their intention to treat the FCL arrangement as precautionary.
IMPACT ON FUND FINANCES, RISKS, AND
SAFEGUARDS
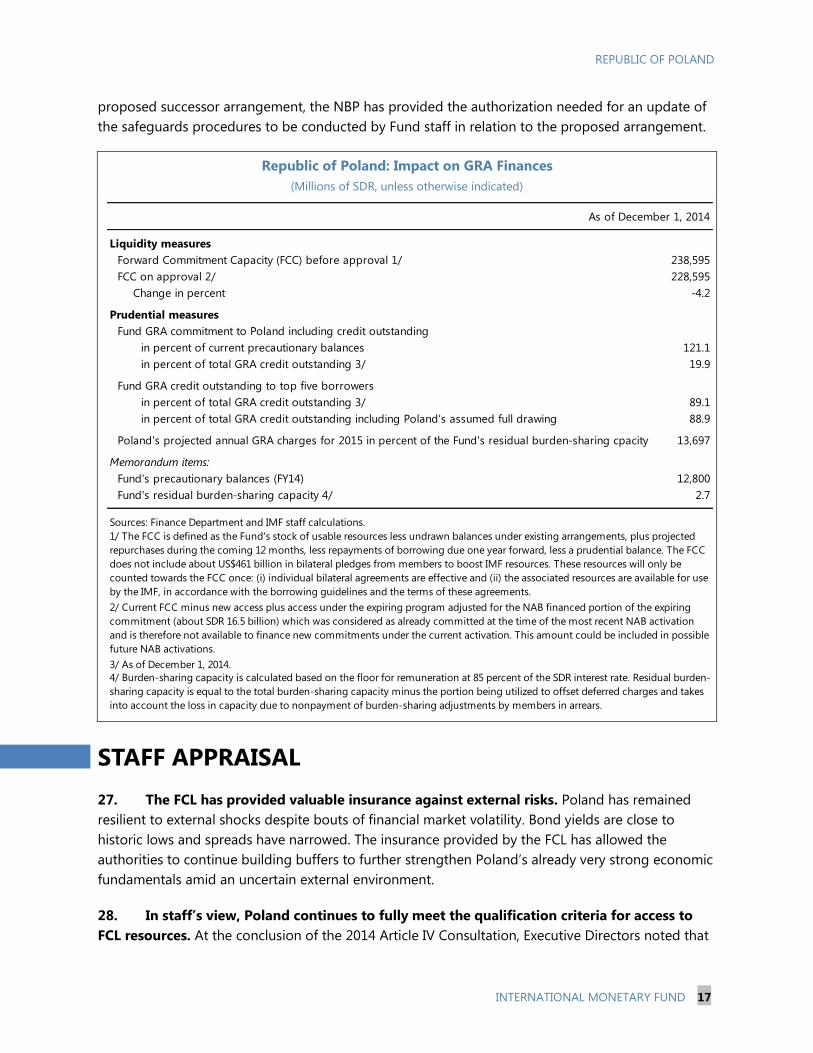
24. The impact of the proposed arrangement on Fund liquidity is assessed to be
manageable. At around SDR 239 billion, the Forward Commitment Capacity (FCC) of the Fund
appears sufficiently strong to accommodate the proposed arrangement. In particular, the
cancellation of Poland’ existing FCL arrangement would partially offset the liquidity effect from the
proposed new FCL arrangement. Furthermore, the need to set aside New Arrangement to Borrow
(NAB) resources to allow for the folding in of bilateral claims would be reduced. The net effect on
Fund liquidity compares favorably with a scenario of unchanged access. Under the proposed
30 percent reduction in access, the immediate net impact of the proposed arrangement would be to
lower the Fund’s FCC by about SDR 10 billion (4.2 percent)—well below a reduction of 6.9 percent
under unchanged access.
25. Poland’s capacity to repay the Fund is strong. The authorities intend to continue to treat
the arrangement as precautionary. Nonetheless, even if the full amount available under the
requested FCL arrangement were to be disbursed, Poland’s capacity to fulfill its financial obligations
to the Fund should be manageable. In case of full disbursement in 2015, total external debt would
rise to 74 percent of GDP initially, and public external debt to about 33 percent of GDP, with Fund
credit representing 4 percent of GDP. Poland’s total external debt service is projected to decline in
the medium term both under the baseline and in the event the authorities draw on the FCL. The
projected debt service to the Fund would peak in 2019 at about SDR 7.9 billion, or about 1.8 percent
of GDP.
26. Staff has completed the safeguard procedures for Poland’s 2013 FCL arrangement. The
authorities provided the necessary authorization for Fund staff to communicate directly with the
NBP’s external auditor, PricewaterhouseCoopers (PwC) Warsaw, for the current FCL arrangement. As
such, staff has reviewed the 2012 audit results and discussed these with PwC. Staff concluded that
no significant safeguards issues emerged for the conduct of these procedures. In preparation for the
REPUBLIC OF POLAND
INTERNATIONAL MONETARY FUND 17
proposed successor arrangement, the NBP has provided the authorization needed for an update of
the safeguards procedures to be conducted by Fund staff in relation to the proposed arrangement.
Republic of Poland: Impact on GRA Finances
(Millions of SDR, unless otherwise indicated)
STAFF APPRAISAL
27. The FCL has provided valuable insurance against external risks. Poland has remained
resilient to external shocks despite bouts of financial market volatility. Bond yields are close to
historic lows and spreads have narrowed. The insurance provided by the FCL has allowed the
authorities to continue building buffers to further strengthen Poland’s already very strong economic
fundamentals amid an uncertain external environment.
28. In staff’s view, Poland continues to fully meet the qualification criteria for access to
FCL resources. At the conclusion of the 2014 Article IV Consultation, Executive Directors noted that
As of December 1, 2014
Liquidity measures
Forward Commitment Capacity (FCC) before approval 1/ 238,595
FCC on approval 2/ 228,595
Change in percent -4.2
Prudential measures
Fund GRA commitment to Poland including credit outstanding
in percent of current precautionary balances 121.1
in percent of total GRA credit outstanding 3/ 19.9
Fund GRA credit outstanding to top five borrowers
in percent of total GRA credit outstanding 3/ 89.1
in percent of total GRA credit outstanding including Poland's assumed full drawing 88.9
Poland's projected annual GRA charges for 2015 in percent of the Fund's residual burden-sharing cpacity 13,697
Memorandum items:
Fund's precautionary balances (FY14) 12,800
Fund's residual burden-sharing capacity 4/ 2.7
Sources: Finance Department and IMF staff calculations.
3/ As of December 1, 2014.
1/ The FCC is defined as the Fund's stock of usable resources less undrawn balances under existing arrangements, plus projected
repurchases during the coming 12 months, less repayments of borrowing due one year forward, less a prudential balance. The FCC
does not include about US$461 billion in bilateral pledges from members to boost IMF resources. These resources will only be
counted towards the FCC once: (i) individual bilateral agreements are effective and (ii) the associated resources are available for use
by the IMF, in accordance with the borrowing guidelines and the terms of these agreements.
2/ Current FCC minus new access plus access under the expiring program adjusted for the NAB financed portion of the expiring
commitment (about SDR 16.5 billion) which was considered as already committed at the time of the most recent NAB activation
and is therefore not available to finance new commitments under the current activation. This amount could be included in possible
future NAB activations.
4/ Burden-sharing capacity is calculated based on the floor for remuneration at 85 percent of the SDR interest rate. Residual burden-
sharing capacity is equal to the total burden-sharing capacity minus the portion being utilized to offset deferred charges and takes
into account the loss in capacity due to nonpayment of burden-sharing adjustments by members in arrears.

REPUBLIC OF POLAND
18 INTERNATIONAL MONETARY FUND
Poland’s very strong fundamentals and economic policies had helped it weather the turmoil in
financial markets and that the precautionary FCL arrangement provides important insurance against
external risks. Poland continues to benefit from very strong economic fundamentals and policies, as
well as sustainable public and external debt positions. The authorities have a proven track record in
sound macroeconomic management, and effective supervision has kept the financial sector well
capitalized and profitable. The authorities have reiterated their firm commitment to maintaining
prudent policies going forward.
29. Staff considers the proposed access under a two-year FCL arrangement for SDR
15.5 billion (918 percent of quota) to be appropriate. The authorities’ efforts to build buffers and
further strengthen the policy framework have improved economic fundamentals and reduced
financing needs. However, while external risks have abated somewhat, they remain elevated. Hence,
it is premature for Poland to fully exit from the FCL arrangement. On balance, staff assesses that a
gradual exit from the arrangement would be appropriate. The requested amount would continue to
provide adequate insurance against adverse market conditions. At the same time, a 30 percent
reduction in access sends a clear signal of the authorities’ intention to fully exit from the FCL
arrangement when external risks allow and is being accompanied by a clear communication
strategy.
30. Risks to the Fund arising from a successor FCL arrangement for Poland are judged as
manageable. Risks to Fund finances are contained by the authorities’ very strong policies,
combined with their sustained track record of policy implementation. Risks are further mitigated by
the authorities’ intention to continue to treat the FCL arrangement as precautionary, their very
strong debt-servicing record, and the sustainable external debt path.

REPUBLIC OF POLAND
INTERNATIONAL MONETARY FUND 19
Figure 1. Republic of Poland: Trade and Financial Integration, 1995–2014
Sources: Polish authorities, IMF World Economic Outlook, BIS Triennial Central Bank Survey, and IMF staff
calculations.
30
40
50
60
70
80
90
100
1995 1997 1999 2001 2003 2005 2007 2009 2011 2013
Trade Openness
(Percent of GDP)
Sum of exports and imports of
goods and services
0
20
40
60
80
100
120
140
160
180
1995 1997 1999 2001 2003 2005 2007 2009 2011 2013
Financial Integration
(Percent of GDP)
Sum of foreign assets and liabilities
0.0 0.2 0.4 0.6 0.8 1.0
1998
2001
2004
2007
2010
2013
Share of Polish Zloty in Global Currency Market
(Percent of average daily turnover)
Poland has become highly integrated through trade,... ...financial markets,...
...and FDI. The zloty has become important.
40.6
16.8
10.0 9.26.3 6.1 5.5 5.0
0.4 0.0 0.00
10
20
30
40
50
Inve
stm
ent
fund
s
Om
nib
us
acc
ounts
Oth
ers
Centr
al b
anks
Pensi
on fu
nd
s
No
n-f
inanci
al s
ect
or
Banks
Insu
rance
co
mp
.
Pub
lic
Inst
ituti
ons
Hed
ge fu
nd
s
Ind
ivid
uals
Institutional Distribution of non-residents
holdings (Percent of total domestic government
bonds; end-July 2014)
33.7
21.6
12.5
5.6 4.9 4.62.4 1.9 1.2 1.1 1.0
9.4
0
5
10
15
20
25
30
35
40
Unit
ed
Sta
tes
Luxe
mb
ourg
Jap
an
Unit
ed
Kin
gd
om
Irela
nd
Germ
any
Neth
erl
and
s
Aust
ria
Unit
ed
Ara
b E
mirate
s
Aust
ralia
Sw
itze
rland
Oth
ers
Breakdown of Foreign Investors in
the Local Government Bond Market
Percent; data as of end-July 2014)
0
10
20
30
40
50
60
70
1995 1997 1999 2001 2003 2005 2007 2009 2011 2013
FDI Developments
(Percent of GDP)
Sum of inward and outward FDI
...a favorable institutional investor base profile reduces risks.While government bond market exposure to the U.S. is large,...

REPUBLIC OF POLAND
20 INTERNATIONAL MONETARY FUND
Figure 2. Republic of Poland: Reserve Coverage in International Perspective, 2013 (cont’d)
(Percent)
Sources: World Economic Outlook, and IMF staff estimates.
1/ Reserves at the end in percent of short-term debt at remaining maturity and estimated current
account deficit in 2013. The current account is set to zero if it is in surplus.
0
10
20
30
40
50
60
70
80
90
100
0
10
20
30
40
50
60
70
80
90
100
Ve
ne
zue
la
Pa
kis
tan
Eg
ypt
Pa
na
ma
Ecu
ad
or
Mo
rocc
o
Uk
rain
e
Arg
en
tin
a
Ind
ia
Do
m.
Re
p.
So
uth
Afr
ica
Me
xico
Ch
ina
Bra
zil
Tu
nis
ia
El S
alv
ad
or
Co
lom
bia
Tu
rke
y
Ch
ile
Co
sta
Ric
a
Gu
ate
ma
la
Ma
lays
ia
Ind
on
esi
a
Po
lan
d
Th
aila
nd
Jord
an
Lith
ua
nia
Cro
ati
a
Bu
lga
ria
Latv
ia
Ru
ssia
Ph
ilip
pin
es
Bo
s. &
He
rz.
Jam
aic
a
Ro
ma
nia
Uru
gu
ay
Se
rbia
Pe
ru
FCL
Reserves to Broad Money
Rule of thumb: 20%
Poland: 33% plus 9% of FCL
Median
0
100
200
300
400
500
600
0
100
200
300
400
500
600
Pa
na
ma
Uk
rain
e
Arg
en
tin
a
Lith
ua
nia
Latv
ia
Tu
rke
y
El S
alv
ad
or
Tu
nis
ia
Pa
kis
tan
Po
lan
d
Ro
ma
nia
So
uth
Afr
ica
Eg
ypt
Jam
aic
a
Do
min
ica
n …
Cro
ati
a
Ch
ile
Ma
lays
ia
Bu
lga
ria
Me
xico
Ind
on
esi
a
Co
sta
Ric
a
Co
lom
bia
Bo
snia
…
Se
rbia
Gu
ate
ma
la
Uru
gu
ay
Mo
rocc
o
Ind
ia
Th
aila
nd
Bra
zil
Ru
ssia
Jord
an
Ph
ilip
pin
es
Pe
ru
Ch
ina
FCL
Reserves to STD at remaining maturity plus current account 1/
Rule of thumb: 100%
Poland: 75% plus 21% of FCL
Median
0
20
40
60
80
100
120
140
0
20
40
60
80
100
120
140
Ve
ne
zue
la
Pa
na
ma
So
uth
Afr
ica
Me
xico
Ind
on
esi
a
Jam
aic
a
Po
lan
d
Bra
zil
Ch
ile
Lith
ua
nia
El S
alv
ad
or
Tu
rke
y
Do
m.
Re
p.
Arg
en
tin
a
Pa
kis
tan
Co
lom
bia
Cro
ati
a
Th
aila
nd
FCL
Reserves to Portfolio Investment
Poland 61% plus 17% of FCL
0
200
400
600
800
1000
1200
0
200
400
600
800
1000
1200
Co
sta
Ric
a
Ind
ia
Uru
gu
ay
Pe
ru
Latv
ia
Eg
ypt
Ro
ma
nia
Jord
an
Se
rbia
Ecu
ad
or
Gu
ate
ma
la
Tu
nis
ia
Bu
lga
ria
Mo
rocc
o
Ch
ina
FCL
Reserves to Portfolio Investment
REPUBLIC OF POLAND
INTERNATIONAL MONETARY FUND 21
Figure 2. Republic of Poland: Reserve Coverage in International Perspective, 2013 (concl’d)
(Percent)
Sources: World Economic Outlook, Balance of Payments Statistics Database, and IMF staff
estimates.
1/ The ARA metric was developed by Fund staff to assess reserve adequacy and is the sum of
30 percent short-term debt at remaining maturities, 10 percent of other liabilities, 5 percent of
broad money, and 10 percent of exports for countries with floating rate currencies. For the
stock of porfolio liabilities, data on 2013, 2012, or 2011 are used depending on data availability.
0
5
10
15
20
25
0
5
10
15
20
25
Ve
ne
zue
la
Pa
kis
tan
Ecu
ad
or
Pa
na
ma
Uk
rain
e
Lith
ua
nia
Eg
ypt
El S
alv
ad
or
Do
min
ica
n …
Jam
aic
a
Tu
nis
ia
Arg
en
tin
a
Mo
rocc
o
Gu
ate
ma
la
So
uth
Afr
ica
Co
sta
Ric
a
Latv
ia
Tu
rke
y
Po
lan
d
Ch
ile
Ind
on
esi
a
Me
xico
Bu
lga
ria
Ind
ia
Bo
snia
an
d …
Ro
ma
nia
Ma
lays
ia
Th
aila
nd
Jord
an
Se
rbia
Co
lom
bia
Cro
ati
a
Ph
ilip
pin
es
Ru
ssia
Uru
gu
ay
Bra
zil
Pe
ru
Ch
ina
FCL
Reserves to months of imports
Rule of thumb: 3 months
Poland: 5 months plus 1 month of FCL
Median
0
50
100
150
200
250
300
350
400
450
0
50
100
150
200
250
300
350
400
450
Pa
na
ma
Uk
rain
e
Pa
kis
tan
Eg
ypt
Lith
ua
nia
Do
m.
Re
p.
El S
alv
ad
or
Latv
ia
Jam
aic
a
Arg
en
tin
a
Tu
nis
ia
Mo
rocc
o
So
uth
Afr
ica
Cro
ati
a
Tu
rke
y
Co
sta
Ric
a
Po
lan
d
Me
xico
Bu
lga
ria
Bo
s. &
He
rz.
Ch
ile
Ind
on
esi
a
Jord
an
Ro
ma
nia
Ru
ssia
Ind
ia
Ma
lays
ia
Ch
ina
Co
lom
bia
Gu
ate
ma
la
Bra
zil
Se
rbia
Th
aila
nd
Ph
ilip
pin
es
Uru
gu
ay
Pe
ru
FCL
Reserves to ARA Metric 1/
Rule of thumb: 100-150%
Poland: 115% plus 32% of FCL
Median
0
5
10
15
20
25
30
35
40
45
50
0
5
10
15
20
25
30
35
40
45
50
Pa
kis
tan
Ve
ne
zue
la
Ecu
ad
or
Arg
en
tin
a
Eg
ypt
Pa
na
ma
Do
min
ica
n …
El S
alv
ad
or
Uk
rain
e
Ind
on
esi
a
Co
lom
bia
So
uth
Afr
ica
Jam
aic
a
Gu
ate
ma
la
Tu
rke
y
Me
xico
Co
sta
Ric
a
Ind
ia
Ch
ile
Tu
nis
ia
Bra
zil
Lith
ua
nia
Mo
rocc
o
Po
lan
d
Ru
ssia
Ro
ma
nia
Latv
ia
Bo
snia
an
d …
Ph
ilip
pin
es
Uru
gu
ay
Cro
ati
a
Pe
ru
Bu
lga
ria
Se
rbia
Jord
an
Ch
ina
Th
aila
nd
Ma
lays
ia
FCL
Reserves to GDP
Poland: 20% plus 6% of FCL
Median

REPUBLIC OF POLAND
22 INTERNATIONAL MONETARY FUND
Figure 3. Republic of Poland: Recent Economic Developments, 2009–14
Sources: Haver Analytics, Poland Central Statistical Office, and IMF staff calculations.
90
95
100
105
110
115
-20
-10
0
10
20
30
2009 2010 2011 2012 2013 2014
Trade Volume (Year-on-year percent change)
Exchange Rate (2000 = 100)
Exports
Imports
Nominal effective rate (RHS)
-40
-35
-30
-25
-20
-15
-10
-5
-5
0
5
10
15
20
2009 2010 2011 2012 2013 2014
Retail Sales (Year-on-year percent change)
Consumer Confidence (Percent balance)
Retail sales
Confidence (RHS)
-20
-15
-10
-5
0
5
10
15
2009 2010 2011 2012 2013 2014
Industrial Production (Yoy percent change)
Business Sentiment Indicator (Percent balance)
IP
Manufacturing sentiment
Domestic demand supported growth in the third quarter... ...amid slower export growth and rising imports.
Consumer confidence is strengthening along with retail sales... ...but uncertainty is deterring industrial production.
Meanwhile, the jobless rate has continued to improve,... ...as employment growth is holding up well.
-5
-4
-3
-2
-1
0
1
2
3
4
5
2009 2010 2011 2012 2013 2014
Contributions to Real GDP Growth
(Percentage points, quarter-on-quarter, sa)
Private consumption Public consumption
Fixed investment Inventory
Net exports GDP growth (Percent)
0
2
4
6
8
10
-3
-2
-1
0
1
2
3
4
5
6
2009 2010 2011 2012 2013 2014
Enterprise Sector Employment and Wages
(Year-on-year percent change)
Employment
Nominal wages (rhs)
6
7
8
9
10
11
12
13
14
2009 2010 2011 2012 2013 2014
Unemployment Rate
(Percent, seasonally adjusted)
Registered
Harmonized (labor force survey)

REPUBLIC OF POLAND
INTERNATIONAL MONETARY FUND 23
Figure 4. Republic of Poland: Balance of Payments, 2009–14
Sources: National Bank of Poland and IMF staff calculations.
1/ Excludes NBP.
-12
-10
-8
-6
-4
-2
0
2
4
6
2009 2010 2011 2012 2013 2014
Current Account Balance
(Percent of GDP, four-quarter rolling sum)
Transfers Income
Services Goods
Current account-1
0
1
2
3
4
5
6
7
8
2009 2010 2011 2012 2013 2014
Capital transfers, net
FDI, net
Current account deficit
Current Account Deficit, Capital Transfers, and FDI
(Percent of GDP, four-quarter rolling sum)
-2
-1
0
1
2
3
4
2009 2010 2011 2012 2013 2014
Portfolio Flows, Net
(Billions of US dollars, 3-month moving average)
-100
-75
-50
-25
0
25
50
75
100
125
150
2009 2010 2011 2012 2013 2014
International Investment Position 1/
(Percent of GDP)
Net
Assets
Liabilities
0
100
200
300
400
500
600
700
2009 2010 2011 2012 2013 2014
International Investment Position, Liabilities
(Billions of US dollars)
Other sectors
General government
Banks
The current account deficit continues to narrow... ...and is mostly financed by EU transfers.
However, financial inflows have weakened... ...though net portfolio flows appear to have turned around.
The IIP is stable,... ...with a moderate increase in liabilities.
-6
-4
-2
0
2
4
6
8
10
12
2009 2010 2011 2012 2013 2014
Financial Account Balance (net inflows)
(Percent of GDP, four quarter rolling sum)
Other investments Portfolio
FDI Financial account
CA deficit
REPUBLIC OF POLAND
24 INTERNATIONAL MONETARY FUND
Figure 5. Republic of Poland: Banking Sector Capital and Asset Quality, 2009–14
Sources: KNF, NBP, and IMF staff calculations.
2
4
6
8
10
12
14
2008 2009 2010 2011 2012 2013 2014
Non-Performing Loans by Sector
(Percent of loans in given segment)
Total
Households
Corporates
0
25
50
75
100
2010 2011 2012 2013 2014
Non-Performing Loans
(Billion zloty)
Large firms SMEs
Other household loans Consumer loans
Housing
0
5
10
15
20
Housing Consumer
loans
Other
household
loans
SMEs Large
enterprises
Nonfinancial Sector Impaired Loans
(Percent of loans in given segment)
Dec. 2010
Dec. 2012
Sept. 2014
Bank profits remain strong and capital adequacy high,... ...with core capital a dominant factor,...
Alongside, the quality of loans has started to improve,...
...though NPLs remain high for SMEs and consumer loans,... ...accounting for the bulk of impaired loans.
...and the foreign currency share of mortages is declining.
10
12
14
16
18
0.0
0.5
1.0
1.5
2.0
2010 2011 2012 2013 2014
Banking sector net profits (billion zloty)
CAR (RHS) (percent)
CAR (CRD IV) (RHS) (Percent)
Monthly Banking Sector Net Profits and Capital
Aequacy Ratio
40
45
50
55
60
65
70
75
80
2008 2009 2010 2011 2012 2013 2014
Share of Foreign Currency Denominated
Housing Loans
(Percent of total housing loans outstanding)
0
20
40
60
80
100
120
140
160
2011 2012 2013 2014
Selected Items of Regulatory Capital
(Billion zloty)
Subordinated debtCore capital
REPUBLIC OF POLAND
INTERNATIONAL MONETARY FUND 25
Figure 6. Republic of Poland: Bank Credit Growth and Funding, 2009–14
Sources: BIS Locational Banking Statistics, Haver Analytics, IFS, NBP, KNF, and IMF staff calculations.
1/ This chart is based on BIS methodology and data, while the middle-left chart is based on NBP
methodology and data. The charts are therefore not directly comparable.
-10
0
10
20
30
40
50
60
70
80
2009 2010 2011 2012 2013 2014
Total
Corporates
Household mortgages
Consumer credit
Private Sector Credit Growth
(Year-on-year percent change)
6
7
8
9
10
11
12
13
14
15
16
2010 2011 2012 2013 2014
Percent of banking sector liabilities
Percent of GDP
Banking Sector Debt to Parents
(Percent)
Private sector credit expansion is slowly picking up... ...with deposits an important contributor.
Alongside, external financial liabilities have declined... ...as has also the reliance on parent bank funding...
...with reduced FX hedging needs. But exposure of BIS-reporting banks remains large.
2
3
4
5
6
7
8
9
2008 2009 2010 2011 2012 2013 2014
Share in total banking sector assets
Percent of GDP
Banking Sector, On-balance Sheet Open FX
Position (Percent)
-20
0
20
40
60
2008 2009 2010 2011 2012 2013 2014
Net foreign assets
Net claim on government
Deposit growth
Others
Claims on private sector
Contribution to Private Sector Credit Growth
(Percentage points)
30
40
50
60
70
80
2008 2009 2010 2011 2012 2013 2014
Polish Banks' External Liabilities to Financial Sector
(Billions of USD)
0
20
40
60
80
100
120
Turk
ey
Russ
ia
Po
land
Ro
mania
Hung
ary
Cro
ati
a
Lith
uania
Bulg
ari
a
Ukra
ine
2013Q2
2014Q2
External Positions of BIS-reporting Banks
vis-à-vis Banks 1/
(Billions of US dollars, exchange-rate adjusted)

REPUBLIC OF POLAND
26 INTERNATIONAL MONETARY FUND
Figure 7. Republic of Poland: Financial Markets, 2009–14
Sources: Bloomberg, Haver Analytics, Polish Ministry of Finance, and IMF staff calculations.
80
85
90
95
100
105
110
115
2009 2010 2011 2012 2013 2014
Exchange Rate: Euro per National Currency
(Jan. 1, 2009 = 100)
Hungary
Poland
Czech Rep.
0
5
10
15
20
25
30
35
2009 2010 2011 2012 2013 2014
Hungary
Poland
Czech Rep.
Implied Volatility of Exchange Rate vs. Euro
(1-month options contract, percent)
The zloty has remained relatively stable...
0
200
400
600
800
2009 2010 2011 2012 2013 2014
Credit Default Swaps Spreads
(Basis points)
Hungary
Poland
Czech Rep.
Nonetheless, CDS spreads remain narrow,... ...and bond yields are at historic lows...
...in a liquid market. Alongside, EMBIG spreads have narrowed further.
...despite reoccuring spikes of volatility.
0
2
4
6
8
10
12
14
16
2009 2010 2011 2012 2013 2014
5-Year Government Bond Yield
(Percent) Hungary
Poland
Czech Rep.
0
200
400
600
800
1000
2009 2010 2011 2012 2013 2014
Hungary (euro EMBIG)
Poland (euro EMBIG)
Poland (EMBIG)
J.P. Morgan EMBIG Spreads
(Basis points)
0.00
0.05
0.10
0.15
0.20
0.25
0.30
2009 2010 2011 2012 2013 2014
HungaryPolandCzech Rep.
5-Year Government Bond Liquidity
(Basis points, 30-day rolling bid-ask spread)
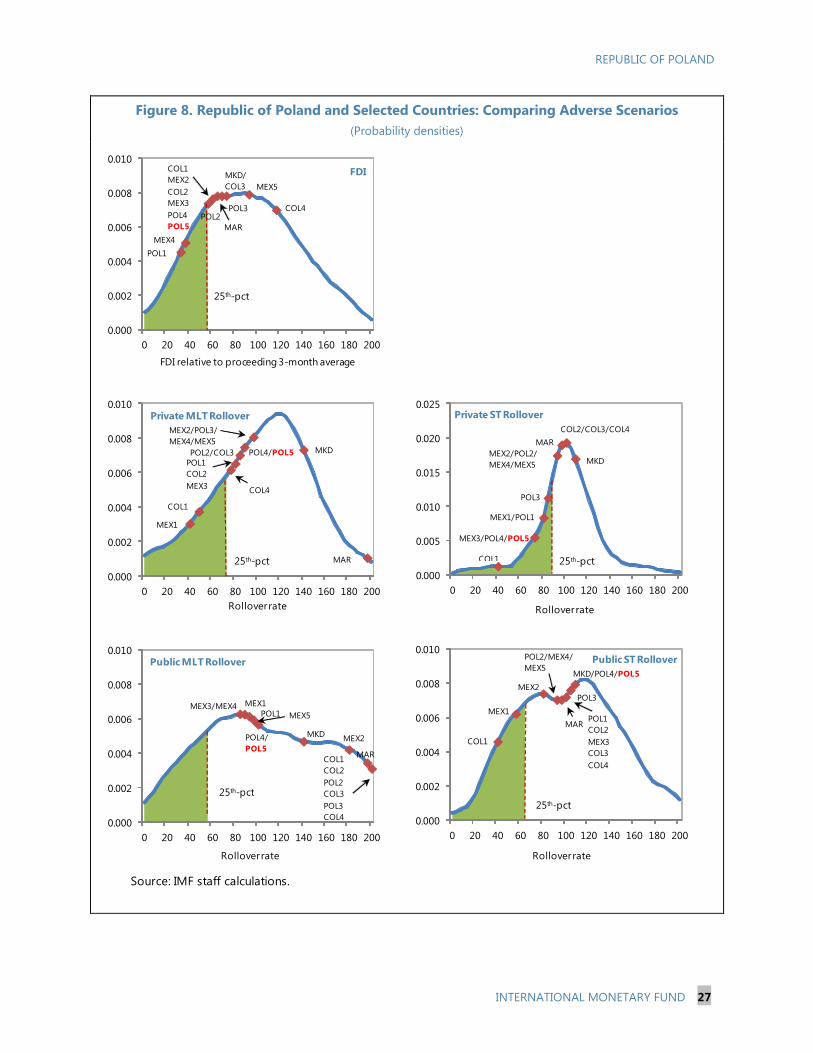
REPUBLIC OF POLAND
INTERNATIONAL MONETARY FUND 27
Figure 8. Republic of Poland and Selected Countries: Comparing Adverse Scenarios
(Probability densities)
Source: IMF staff calculations.
0.000
0.002
0.004
0.006
0.008
0.010
0 20 40 60 80 100 120 140 160 180 200
FDI relative to proceeding 3-month average
FDI
POL1
POL2
COL1
MEX2
COL2
MEX3
POL4
POL5 MAR
POL3
MKD/
COL3
25th-pct
COL4
MEX4
MEX5
0.000
0.002
0.004
0.006
0.008
0.010
0 20 40 60 80 100 120 140 160 180 200
Rollover rate
Private MLT Rollover
MEX2/POL3/
MEX4/MEX5
POL2/COL3
MEX1
COL1
POL1
COL2
MEX3
25th-pct
COL4
POL4/POL5
MAR
MKD
0.000
0.005
0.010
0.015
0.020
0.025
0 20 40 60 80 100 120 140 160 180 200
Rollover rate
Private ST Rollover
COL2/COL3/COL4
MEX2/POL2/
MEX4/MEX5
COL1
MEX3/POL4/POL5
POL3
MEX1/POL1
MAR
MKD
25th-pct
0.000
0.002
0.004
0.006
0.008
0.010
0 20 40 60 80 100 120 140 160 180 200
Rollover rate
Public MLT Rollover
COL1
COL2
POL2
COL3
POL3
COL4
MEX3/MEX4
MEX2
POL1
MEX1
25th-pct
POL4/
POL5MAR
MKD
MEX5
0.000
0.002
0.004
0.006
0.008
0.010
0 20 40 60 80 100 120 140 160 180 200
Rollover rate
Public ST RolloverPOL2/MEX4/
MEX5
MEX2
COL1
MEX1POL1
COL2
MEX3
COL3
COL4
POL3
25th-pct
MKD/POL4/POL5
MAR

REPUBLIC OF POLAND
28 INTERNATIONAL MONETARY FUND
Figure 9. Republic of Poland: Qualification Criteria
-1
0
1
2
3
4
5
6
2010 2011 2012 2013 2014 2015
Inflation with Target and Tolerance Bands
(Year-on-year percent change)
0
100
200
300
400
500
600
700
800
900
1000
2010 2011 2012 2013 2014
J.P. Morgan Euro EMBI Spread
(Basis points)
Poland
Hungary
Romania
Bulgaria
Low and stable inflation.
Relatively comfortable reserve position.Steady sovereign access to capital markets.
Sustainable public debt position.
Sustainable external position.
40
50
60
70
80
90
2013 2015 2017 2019
Baseline
30 % depreciation
Combined 1/
Sustainability of External Debt Position
(Percent of GDP)
0
20
40
60
80
100
120
140
160
180
200
0
5
10
15
20
25
30
35
40
GDP Broad money S-T debt
(right scale)
Net International Reserves, 2013
(Percent)
Sources: Bloomberg, Poland authorities, and IMF staff calculations.
1/ Permanent 1/4 standard deviation shocks applied to real interest rate, growth rate, and current account balance.
Public: 7%
Private: 93%
Almost all external debt is held by private creditors.
Holders of Gross External Debt
(Percent of total external debt, 2013)
44
46
48
50
52
54
56
2014 2015 2016 2017 2018 2019
Baseline
Primary Balance Shock
Real GDP Growth Shock
Real Interest Rate Shock
Real Exchange Rate Shock
Sustainability of Public Debt Position
(Percent of GDP)

REPUBLIC OF POLAND
INTERNATIONAL MONETARY FUND 29
Figure 10. Republic of Poland and Selected Countries: Indicators of Institutional Quality
Source: IFS, World Bank Governance Indicators and IMF staff calculations.
Note: For all indicators, a higher value indicates stronger institutional quality.
-1.5 -1.0 -0.5 0.0 0.5 1.0 1.5
VENRUSPAKUKRKAZLBNECU
DOMPHLIDNBLR
VNMARMEGYALB
GTMCHNDZAINDARGJAMBIH
THAMEXMARCOLPANSRBPERLKASLVBGR
ROMTUNMKDGEOBRAHRVTURZAFMYSLVALTUJOR
HUNPOLCRI
URYCHL
Control of
Corruption
In addition, Poland ranks well on corruption control ....
-1.5 -1.0 -0.5 0.0 0.5 1.0 1.5
BLRVENUKRECUPAKBIH
GTMDOMDZAEGYKAZRUSLBN
ROMPERALBIDN
VNMARGLKA
ARMMARSRBBRA
MKDSLVCOLINDPHLBGRCHNJORPANJAMMEXTUNTHATURCRI
GEOZAFURYPOLHRVLVA
HUNLTU
MYSCHL
Government
Effectiveness
...and on government effectiveness.
-1.0 -0.5 0.0 0.5 1.0
ALBEGYPAKUKRBIH
GEOHUNVENJOR
ROMKAZLKA
GTMIDNBRAPERSRBJAMBLRCOL
VNMECUPANURY
ARMLVA
DOMZAFMEXLBN
MARBGRPOLCHNTHAINDARGLTURUS
MKDDZAMYSCHLHRVSLV
TUNPHLTURCRI
Index of Fiscal
Cyclicality 1/
(Average 2007–14)
1/ Measured by the 10-year average correlation
between the output gap and the cyclical component of
gov. expenditures to GDP.
Higher value indicates
a more countercyclical
fiscal policy
-1.0 -0.5 0.0 0.5 1.0
BGRLVAGEOUKRCRI
KAZMKDURYBIHBLRLTU
ARMDZAHRVMARINDMYS
VNMTURTUNCHNLKAPANPHLIDNARGPAK
HUNJORTHASRB
ROMEGYBRAALBZAFPOLRUSECUVEN
DOMSLVCHLMEXLBNPERCOL
Index of Monetary
Policy Cyclicality 1/
(Average 2007–14)
1/ Measured by the 10-year average correlation between the
cyclical component of real GDP and the cyclical component
of the real short-term interest rate.
Higher value indicates
a more countercyclical
monetary policy
Monetary and fiscal policies have been countercyclical.

REPUBLIC OF POLAND
30 INTERNATIONAL MONETARY FUND
Table 1. Republic of Poland: Selected Economic Indicators, 2011–19
2011 2012 2013 2014 2015 2016 2017 2018 2019
Activity and prices
GDP (change in percent) 1/ 4.8 1.8 1.7 3.2 3.0 3.3 3.4 3.5 3.5
Domestic demand 3.8 -0.4 0.2 4.7 3.8 3.8 3.9 3.7 3.7
Private consumption growth 2.9 0.9 1.0 3.1 3.7 3.1 3.3 3.5 3.6
Public consumption growth -2.3 0.2 2.1 2.6 3.8 3.2 3.5 3.5 3.5
Domestic fixed investment growth 9.3 -1.5 0.9 10.2 5.2 5.9 5.6 4.2 3.9
Inventories (contribution to growth) 0.7 -0.6 -1.0 0.2 -0.2 0.1 0.0 0.0 0.0
Net external demand (contribution to growth) 0.9 2.1 1.5 -1.3 -0.8 -0.5 -0.5 -0.1 -0.2
Output gap 1.3 0.2 -0.9 -0.5 -0.5 -0.2 0.0 0.0 0.0
CPI inflation (percent)
Average 4.3 3.7 0.9 0.1 0.5 2.1 2.5 2.5 2.5
End of period 4.6 2.4 0.7 -0.3 1.4 2.5 2.5 2.5 2.5
Unemployment rate (average, according to LFS) 9.6 10.1 10.3 9.3 9.1 9.0 8.9 8.7 8.5
Public finances (percent of GDP) 2/
General government revenues 39.0 39.1 38.2 39.0 39.3 39.5 39.1 39.2 39.1
General government expenditures 43.9 42.9 42.2 42.1 41.9 41.6 41.4 41.3 41.1
General government balance -4.9 -3.7 -4.0 -3.1 -2.6 -2.1 -2.3 -2.1 -2.0
Public debt 54.8 54.4 55.7 48.8 48.6 48.2 47.7 46.9 46.0
National definition 3/ 52.5 52.0 53.0 … … … … … …
Money and credit
Private credit (change in percent, end-period) 13.9 2.4 4.5 5.9 8.0 … … … …
Broad money (change in percent, end-period) 12.5 4.5 6.2 6.6 7.6 … … … …
Policy Rate (percent) 4/ 4.2 4.6 2.9 2.0 … … … … …
Balance of payments
Current account balance (transactions, billion U.S. dollars) -25.8 -18.3 -7.1 -10.4 -15.0 -17.1 -19.8 -22.1 -24.0
Percent of GDP -4.9 -3.7 -1.4 -1.9 -2.7 -3.0 -3.3 -3.4 -3.5
Exports of Goods (billion U.S. dollars) 195.2 190.8 207.2 216.6 215.9 230.8 249.4 268.5 288.3
Export volume growth 7.9 4.3 5.0 4.7 3.5 6.0 6.5 6.7 6.6
Imports of Goods (billion U.S. dollars) 209.2 197.5 204.2 214.8 218.6 234.2 250.4 268.9 288.8
Import volume growth 5.5 -0.6 1.8 8.1 5.0 7.2 7.5 7.0 7.0
Net oil imports (billion U.S. dollars) 22.9 23.5 23.7 22.8 17.7 19.2 20.5 22.0 23.0
Terms of trade (index 1995=100) 98.1 96.8 96.9 99.4 98.8 99.6 101.6 102.2 102.6
FDI, net (in percent of GDP) 2.4 1.1 -0.1 1.2 1.3 1.4 1.4 1.4 1.4
Official reserves (billion U.S. dollars) 97.9 108.9 106.2 102.7 104.7 105.2 105.4 104.9 105.4
In percent of short-term debt plus CA deficit 68.3 81.1 73.1 80.3 84.1 85.4 87.4 90.6 94.5
Total external debt (billion U.S. dollars) 320.6 364.2 379.3 376.8 380.3 384.5 388.9 394.2 402.8
In percent of GDP 61.2 73.3 72.1 68.8 69.3 66.9 63.7 60.6 58.1
Exchange rate
Exchange rate regime
Zloty per USD, period average 5/ 3.0 3.3 3.2 3.4 … … … … …
Zloty per Euro, period average 5/ 4.1 4.2 4.2 4.2 … … … … …
Real effective exchange rate (INS, CPI based) 6/ 110.4 107.5 108.3 … … … … … …
Appreciation (percent change) -1.4 -2.6 0.7 … … … … … …
Real effective exchange rate (ULC, based)
Memorandum item:
Nominal GDP (billion zloty) 1553.6 1615.9 1662.1 1714.2 1798.2 1886.7 1992.4 2109.7 2236.4
Sources: Polish authorities and IMF staff calculations.
1/ Real GDP is calculated at constant 2010 prices.
2/ According to ESA2010.
3/ Excluding debts of the National Road Fund.
4/ NBP Reference Rate (avg). For 2014, as of December 4.
5/ For 2014, exchange rate as of December 4.
6/ Annual average (2000=100).
Floating
Projections
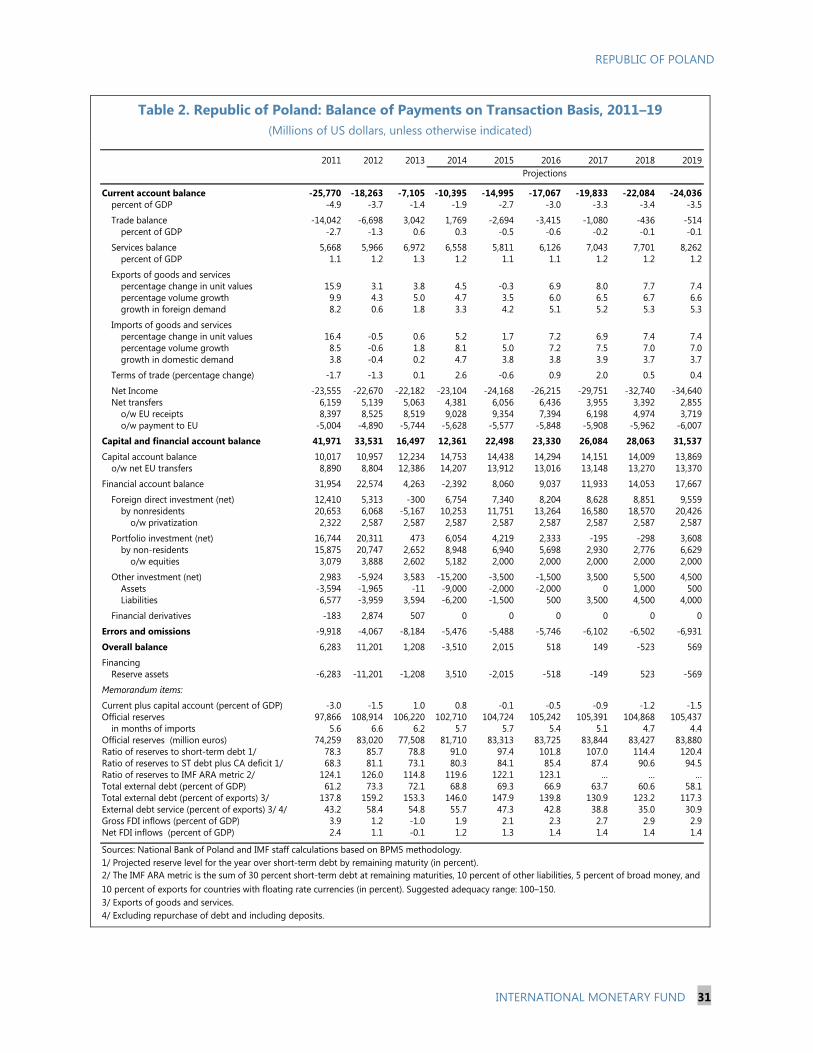
REPUBLIC OF POLAND
INTERNATIONAL MONETARY FUND 31
Table 2. Republic of Poland: Balance of Payments on Transaction Basis, 2011–19
(Millions of US dollars, unless otherwise indicated)
2011 2012 2013 2014 2015 2016 2017 2018 2019
Current account balance -25,770 -18,263 -7,105 -10,395 -14,995 -17,067 -19,833 -22,084 -24,036
percent of GDP -4.9 -3.7 -1.4 -1.9 -2.7 -3.0 -3.3 -3.4 -3.5
Trade balance -14,042 -6,698 3,042 1,769 -2,694 -3,415 -1,080 -436 -514
percent of GDP -2.7 -1.3 0.6 0.3 -0.5 -0.6 -0.2 -0.1 -0.1
Services balance 5,668 5,966 6,972 6,558 5,811 6,126 7,043 7,701 8,262
percent of GDP 1.1 1.2 1.3 1.2 1.1 1.1 1.2 1.2 1.2
Exports of goods and services
percentage change in unit values 15.9 3.1 3.8 4.5 -0.3 6.9 8.0 7.7 7.4
percentage volume growth 9.9 4.3 5.0 4.7 3.5 6.0 6.5 6.7 6.6
growth in foreign demand 8.2 0.6 1.8 3.3 4.2 5.1 5.2 5.3 5.3
Imports of goods and services
percentage change in unit values 16.4 -0.5 0.6 5.2 1.7 7.2 6.9 7.4 7.4
percentage volume growth 8.5 -0.6 1.8 8.1 5.0 7.2 7.5 7.0 7.0
growth in domestic demand 3.8 -0.4 0.2 4.7 3.8 3.8 3.9 3.7 3.7
Terms of trade (percentage change) -1.7 -1.3 0.1 2.6 -0.6 0.9 2.0 0.5 0.4
Net Income -23,555 -22,670 -22,182 -23,104 -24,168 -26,215 -29,751 -32,740 -34,640
Net transfers 6,159 5,139 5,063 4,381 6,056 6,436 3,955 3,392 2,855
o/w EU receipts 8,397 8,525 8,519 9,028 9,354 7,394 6,198 4,974 3,719
o/w payment to EU -5,004 -4,890 -5,744 -5,628 -5,577 -5,848 -5,908 -5,962 -6,007
Capital and financial account balance 41,971 33,531 16,497 12,361 22,498 23,330 26,084 28,063 31,537
Capital account balance 10,017 10,957 12,234 14,753 14,438 14,294 14,151 14,009 13,869
o/w net EU transfers 8,890 8,804 12,386 14,207 13,912 13,016 13,148 13,270 13,370
Financial account balance 31,954 22,574 4,263 -2,392 8,060 9,037 11,933 14,053 17,667
Foreign direct investment (net) 12,410 5,313 -300 6,754 7,340 8,204 8,628 8,851 9,559
by nonresidents 20,653 6,068 -5,167 10,253 11,751 13,264 16,580 18,570 20,426
o/w privatization 2,322 2,587 2,587 2,587 2,587 2,587 2,587 2,587 2,587
Portfolio investment (net) 16,744 20,311 473 6,054 4,219 2,333 -195 -298 3,608
by non-residents 15,875 20,747 2,652 8,948 6,940 5,698 2,930 2,776 6,629
o/w equities 3,079 3,888 2,602 5,182 2,000 2,000 2,000 2,000 2,000
Other investment (net) 2,983 -5,924 3,583 -15,200 -3,500 -1,500 3,500 5,500 4,500
Assets -3,594 -1,965 -11 -9,000 -2,000 -2,000 0 1,000 500
Liabilities 6,577 -3,959 3,594 -6,200 -1,500 500 3,500 4,500 4,000
Financial derivatives -183 2,874 507 0 0 0 0 0 0
Errors and omissions -9,918 -4,067 -8,184 -5,476 -5,488 -5,746 -6,102 -6,502 -6,931
Overall balance 6,283 11,201 1,208 -3,510 2,015 518 149 -523 569
Financing
Reserve assets -6,283 -11,201 -1,208 3,510 -2,015 -518 -149 523 -569
Memorandum items:
Current plus capital account (percent of GDP) -3.0 -1.5 1.0 0.8 -0.1 -0.5 -0.9 -1.2 -1.5
Official reserves 97,866 108,914 106,220 102,710 104,724 105,242 105,391 104,868 105,437
in months of imports 5.6 6.6 6.2 5.7 5.7 5.4 5.1 4.7 4.4
Official reserves (million euros) 74,259 83,020 77,508 81,710 83,313 83,725 83,844 83,427 83,880
Ratio of reserves to short-term debt 1/ 78.3 85.7 78.8 91.0 97.4 101.8 107.0 114.4 120.4
Ratio of reserves to ST debt plus CA deficit 1/ 68.3 81.1 73.1 80.3 84.1 85.4 87.4 90.6 94.5
Ratio of reserves to IMF ARA metric 2/ 124.1 126.0 114.8 119.6 122.1 123.1 … … …
Total external debt (percent of GDP) 61.2 73.3 72.1 68.8 69.3 66.9 63.7 60.6 58.1
Total external debt (percent of exports) 3/ 137.8 159.2 153.3 146.0 147.9 139.8 130.9 123.2 117.3
External debt service (percent of exports) 3/ 4/ 43.2 58.4 54.8 55.7 47.3 42.8 38.8 35.0 30.9
Gross FDI inflows (percent of GDP) 3.9 1.2 -1.0 1.9 2.1 2.3 2.7 2.9 2.9
Net FDI inflows (percent of GDP) 2.4 1.1 -0.1 1.2 1.3 1.4 1.4 1.4 1.4
Sources: National Bank of Poland and IMF staff calculations based on BPM5 methodology.
1/ Projected reserve level for the year over short-term debt by remaining maturity (in percent).
3/ Exports of goods and services.
4/ Excluding repurchase of debt and including deposits.
Projections
2/ The IMF ARA metric is the sum of 30 percent short-term debt at remaining maturities, 10 percent of other liabilities, 5 percent of broad money, and
10 percent of exports for countries with floating rate currencies (in percent). Suggested adequacy range: 100–150.

REPUBLIC OF POLAND
32 INTERNATIONAL MONETARY FUND
Table 3. Republic of Poland: Financial Soundness Indicators, 2007–14 (Percent)
2007 2008 2009 2010 2011 2012 2013 2014Q3
Capital adequacy 1/
Regulatory capital to risk-weighted assets 12.0 11.1 13.3 13.9 13.1 14.8 15.7 14.9
Regulatory Tier I capital to risk-weighted assets 11.8 10.0 12.0 12.5 11.7 13.1 14.1 13.7
NPLs net of provisions to capital 11.4 8.3 13.8 11.5 11.6 12.9 12.1 12.4
Bank capital to assets 8.0 7.5 8.1 8.2 7.8 8.7 9.1 8.5
Asset composition and quality
NPLs to gross loans (non-financial sector) 5.2 4.4 7.9 8.8 8.2 8.8 8.5 8.2
Sectoral distribution of loans to non-financial setor
Loans to households 59.3 62.0 65.3 68.0 66.4 65.7 66.1 65.3
Loans to non-financial corporations 40.3 37.6 34.3 31.5 33.1 33.7 33.3 34.1
Earnings and profitability
Return on average assets (after tax) 1.7 1.5 0.8 1.0 1.3 1.2 1.1 1.1
Return on average equity (after tax) 1/ 22.4 20.7 11.2 13.3 16.1 14.0 12.1 12.6
Interest margin to gross income 59.4 55.7 51.9 53.0 55.8 55.0 56.1 59.2
Noninterest expenses to gross income 68.7 58.4 58.5 56.0 54.5 54.5 57.2 55.1
Liquidity
Liquid assets to total assets (liquid assets ratio) 17.1 17.0 20.3 20.8 19.5 20.9 21.4 21.5
Liquid assets to total short-term liabilities 24.2 25.3 29.8 31.2 28.8 31.1 31.7 32.7
Loans to deposits 98.0 112.6 109.2 114.5 119.8 117.7 115.7 114.1
Sensitivity to market risk
Net open positions in FX to capital 1/ 0.6 0.0 2.7 0.3 -0.3 0.2 -0.1 -0.1
Sources: Narodowy Bank Polski and KNF.
Note: Data according to FSI definitions, except for asset composition and quality (indicators not part of FSI reporting template).1/ Data for domestic banking sector (since 2014: Bank Gospodarstwa Krajowego excluded). Since 2014: data on capital in accordance with
CRDIV/CRR.

REPUBLIC OF POLAND
INTERNATIONAL MONETARY FUND 33
Table 4. Republic of Poland: General Government Statement of Operations, 2011–19
(Percent of GDP, unless otherwise indicated)
2011 2012 2013 2014 2015 2016 2017 2018 2019
Revenue 39.0 39.1 38.2 39.0 39.3 39.5 39.1 39.2 39.1
Taxes 20.6 20.0 19.5 20.0 20.1 20.2 19.8 19.9 19.9
Personal income tax 4.4 4.5 4.5 4.6 4.6 4.6 4.6 4.6 4.6
Corporate income tax 2.0 2.1 1.8 1.8 1.9 1.9 1.9 1.9 1.9
VAT 7.8 7.1 6.9 7.0 7.1 7.1 6.8 6.9 6.9
Excises 3.8 3.7 3.7 3.7 3.8 3.8 3.8 3.8 3.8
Other taxes 2.5 2.6 2.7 2.8 2.8 2.8 2.7 2.7 2.7
Social contributions 12.2 13.0 13.2 13.5 13.7 13.7 13.6 13.5 13.4
Other revenue 1/ 6.3 6.1 5.5 5.5 5.5 5.6 5.7 5.8 5.8
Capital revenue 1.7 1.3 1.0 0.9 0.8 0.9 1.0 1.1 1.1
Sales of goods and services 2.4 2.4 2.3 2.3 2.3 2.3 2.3 2.3 2.3
Other current revenue 2.2 2.4 2.2 2.3 2.4 2.4 2.4 2.4 2.4
Expenditure 43.9 42.9 42.2 42.1 41.9 41.6 41.4 41.3 41.1
Expense 38.0 38.1 38.1 38.2 37.9 37.7 37.5 37.4 37.2
Compensation of employees 10.6 10.4 10.3 10.2 10.1 10.1 10.1 10.1 10.1
Use of goods and services 5.8 5.9 5.9 5.9 5.9 5.9 5.9 5.9 5.9
Interest 2.5 2.7 2.5 2.2 2.1 2.1 2.0 2.0 2.0
Subsidies 0.8 0.7 0.7 0.7 0.7 0.7 0.7 0.7 0.7
Social benefits 15.7 15.9 16.3 16.5 16.5 16.3 16.2 16.1 16.0
Other expense 1/ 2.6 2.6 2.5 2.7 2.7 2.7 2.7 2.7 2.7
Other current expenditure 2.3 2.3 2.3 2.3 2.3 2.3 2.3 2.3 2.3
Capital transfers 0.6 0.6 0.5 0.5 0.5 0.5 0.5 0.5 0.5
Net acquisition of nonfinancial assets 6.0 4.8 4.1 3.9 4.0 3.9 3.9 3.9 3.9
Gross operating balance 1.1 1.0 0.1 0.8 1.4 1.8 1.6 1.8 1.9
Net lending/borrowing (overall balance) -4.9 -3.7 -4.0 -3.1 -2.6 -2.1 -2.3 -2.1 -2.0
Net financial transactions -4.9 -3.4 -4.0 -3.1 -2.6 -2.1 -2.3 -2.1 -2.0
Net acquisition of financial assets -1.3 -0.9 -1.5 0.5 0.1 0.1 0.1 0.0 0.0
Currency and deposits -0.7 0.7 -1.1 0.4 -0.1 0.0 0.0 0.0 0.0
Debt securities 0.0 0.0 0.1 0.0 0.0 0.0 0.0 0.0 0.0
Loans 0.1 0.0 0.0 0.0 0.0 0.0 0.0 0.0 0.0
Equity and investment fund shares -1.3 -1.0 -0.6 -0.1 -0.1 -0.1 -0.1 -0.1 -0.1
Other financial assets 0.6 0.2 0.1 0.2 0.1 0.1 0.1 0.1 0.1
Net incurrence of liabilities 3.5 2.5 2.5 3.6 2.6 2.2 2.3 2.1 2.1
Currency and deposits 0.0 0.0 0.0 0.0 0.0 0.0 0.0 0.0 0.0
Debt securities 2.1 2.6 2.1 -6.8 1.1 1.0 1.2 1.0 1.0
Loans 1.3 0.8 0.6 1.0 0.9 0.8 0.7 0.7 0.7
Other liabilities 0.1 0.3 0.0 9.3 0.6 0.4 0.4 0.4 0.4
Adjustment and statistical discrepancies -0.1 0.0 0.0 0.0 0.0 0.0 0.0 0.0 0.0
Memorandum items:
Cyclically-adjusted balance -5.4 -3.8 -3.4 -2.9 -2.4 -2.0 -2.3 -2.1 -2.0
Primary balance -2.4 -1.1 -1.5 -0.9 -0.5 0.0 -0.2 0.0 0.0
Cyclically-adjusted primary balance -2.9 -1.1 -0.9 -0.7 -0.3 0.1 -0.2 0.0 0.0
General government debt 54.8 54.4 55.7 48.8 48.6 48.2 47.7 46.9 46.0
General government liabilities 62.0 61.6 62.5 56.0 55.8 55.4 54.9 54.1 53.1
General government financial assets -31.9 -33.1 -36.4 -29.6 -30.5 -31.1 -31.6 -31.8 -31.8
Nominal GDP in billions of Zlotys 1,554 1,616 1,662 1,714 1,798 1,887 1,992 2,110 2,236
Sources: Eurostat and IMF staff calculations.
1/ Includes grants.
Projections

Table 5. Republic of Poland: General Government Financial Balance Sheet, 2012–19
(Millions of zloty, unless otherwise indicated)
34
IN
TER
NA
TIO
NA
L MO
NETA
RY F
UN
D
REP
UB
LIC O
F P
OLA
ND
2014 2015 2016 2017 2018 2019
Trans-
actions OEF
Closing
Opening
balance
Trans-
actions OEF
Closing
Opening
balance
Net worth and its changes .... .... .... .... .... .... .... .... .... .... .... ....
Nonfinancial assets .... .... .... .... .... .... .... .... .... .... .... ....
Net Financial Worth: -61,725 22,444 -534,945 -71,258 1,356 -604,847 -508,210 -547,560 -586,152 -629,054 -670,286 -710,976
Financial Assets -2,255 -5,524 459,652 -25,583 -208 433,861 451,668 455,814 459,377 465,177 471,472 477,430
Currency and deposits 11,756 -6,162 71,637 -18,148 27 53,516 75,997 79,720 83,643 88,326 93,527 99,146
Debt securities -153 -1,094 5,212 838 51 6,101 5,529 5,800 6,085 6,426 6,805 7,213
Loans -326 -1,434 14,122 -46 556 14,632 13,563 14,228 14,928 15,764 16,692 17,695
Equity and inv. fund shares -16,791 199 270,603 -10,262 -101 260,240 251,268 245,596 238,815 232,264 224,844 215,986
Other financial assets 3,259 2,967 98,078 2,035 -741 99,372 105,311 110,470 115,907 122,397 129,604 137,390
Liabilities 59,470 -27,968 994,597 45,675 -1,564 1,038,708 959,878 1,003,374 1,045,529 1,094,230 1,141,757 1,188,406
Currency and deposits 0 0 0 0 0 0 0 0 0 0 0 0
Debt securities 41,868 -18,525 742,617 34,903 -2,390 775,130 720,041 751,787 781,562 815,482 846,595 875,513
Loans 12,189 -6,462 149,051 10,184 329 159,564 116,760 122,480 128,507 135,703 143,693 152,326
Other liabilities 5,413 -2,981 102,929 588 497 104,014 123,077 129,107 135,460 143,045 151,468 160,568
Memorandum items:
Net financial worth (in % of GDP) -33.1 -36.4 -29.6 -30.5 -31.1 -31.6 -31.8 -31.8
Financial assets (in % of GDP) 28.4 26.1 26.3 25.3 24.3 23.3 22.3 21.3
Liabilities (in % of GDP) 61.6 62.5 56.0 55.8 55.4 54.9 54.1 53.1
GDP nominal prices (in Billion PLN) 1615.9 1662.1 1714.2 1798.2 1886.7 1992.4 2109.7 2236.4
Sources: National Authorities and IMF Staff calculations.
Projections
2012 2013

REPUBLIC OF POLAND
INTERNATIONAL MONETARY FUND 35
Table 6. Republic of Poland: Monetary Accounts, 2008–14
(Percent of GDP, unless otherwise indicated, eop)
2008 2009 2010 2011 2012 2013 2014
Proj.
Central bank
Net foreign assets 177 212 257 317 321 297 320
Official reserve assets 184 228 277 337 337 321 344
Net domestic assets -51 -74 -117 -179 -153 -133 -149
Net claims on government -21 -23 -12 -19 -16 -7 -7
Claims on banks 1/ 9 -25 -74 -93 -100 -117 -114
Other items, net -38 -26 -31 -67 -37 -9 -28
Base money 126 138 140 138 167 164 172
Currency issued 102 100 103 112 113 126 131
Bank reserves 25 38 37 26 54 38 41
Deposit money banks
Net foreign assets -113 -135 -156 -169 -143 -147 -142
Net domestic assets 679 762 842 939 953 1,004 1,059
Net claims on the central bank 1/ 37 75 121 130 167 167 166
Net claims on government 153 171 177 191 177 204 216
Claims on private sector 633 677 735 838 858 896 949
Claims on corporates 224 217 215 253 257 259 279
Claims on households 376 421 480 537 538 562 591
Claims on other 33 40 41 47 63 75 79
Other items, net -143 -161 -191 -219 -248 -263 -272
Deposits 566 627 687 771 810 857 917
Consolidated banking system
Net foreign assets 64 76 101 149 177 150 178
Net domestic assets 602 644 683 733 744 829 866
Claims on government 131 148 164 172 161 197 209
Claims on private sector 633 677 735 838 858 896 950
Other items, net -162 -182 -217 -276 -274 -264 -292
Broad money (M3) 666 720 784 882 921 979 1,044
Memorandum items:
Base money 23.1 8.8 1.6 -1.1 21.0 -1.9 4.6
Broad money (M3) 18.6 8.1 8.8 12.5 4.5 6.2 6.6
Net domestic assets 36.6 7.0 6.0 7.4 1.5 11.4 4.5
Net foreign assets -46.9 18.8 32.6 46.9 19.4 -15.3 18.6
Net claim on government 63.4 12.8 11.0 4.5 -6.6 22.5 6.0
Claims on private sector 36.4 7.0 8.5 13.9 2.4 4.5 5.9
Deposit growth 18.9 10.6 9.6 12.2 5.1 5.8 7.0
Broad money (M3) 52.2 52.9 54.5 56.7 57.0 58.9 60.9
Private sector credit 49.6 49.7 51.2 53.9 53.1 53.9 55.4
Broad money Velocity (GDP/M3) 1.9 1.9 1.8 1.8 1.8 1.7 1.6
Money multiplier (M3/base money) 5.3 5.2 5.6 6.4 5.5 6.0 6.1
Sources: Haver, IFS, National Bank of Poland, and IMF staff calculations.
1/ The difference between deposit money bank claims on the central bank and central bank claims on banks relates
to banks' reserves and currency in vault.
(Billions of zlotys)
(Percentage change from end of previous year)
(Percent of GDP, unless otherwise noted)

Table 7. Republic of Poland: External Financing Requirements and Sources, 2012–16
(Millions of US dollars, unless otherwise indicated)
36
INTER
NA
TIO
NA
L MO
NETA
RY
FU
ND
ST
RIC
TLY
CO
NFID
EN
TIA
L
ST
RIC
TLY
CO
NFID
EN
TIA
L
REP
UB
LIC O
F P
OLA
ND
ST
RIC
TLY
CO
NFID
EN
TIA
L
REP
UB
LIC O
F P
OLA
ND
ST
RIC
TLY
CO
NFID
EN
TIA
L
REP
UB
LIC O
F P
OLA
ND
ST
RIC
TLY
CO
NFID
EN
TIA
L
REP
UB
LIC O
F P
OLA
ND
ST
RIC
TLY
CO
NFID
EN
TIA
L
REP
UB
LIC O
F P
OLA
ND
ST
RIC
TLY
CO
NFID
EN
TIA
L
REP
UB
LIC O
F P
OLA
ND
REP
UB
LIC O
F P
OLA
ND
2012 2013 2014 2015 2015 2016 2016 2013 2015
2015 vs 2013
shock
Est. Proj.
Adverse
scenario Proj.
Adverse
scenario
GROSS FINANCING REQUIREMENTS (A) 137,687 134,277 132,694 127,869 127,869 124,560 124,560
Current account deficit 18,263 7,105 10,395 14,995 14,995 17,067 17,067
Medium and long-term debt amortization 53,139 57,306 59,419 60,683 60,683 57,725 57,725
Public sector 11,318 14,201 12,980 14,255 14,255 13,340 13,340
Banks 12,396 6,027 7,433 5,823 5,823 5,964 5,964
Non-bank Corporates 29,425 37,078 39,006 40,605 40,605 38,422 38,422
Short-term debt amortization 66,285 69,866 62,880 52,191 52,191 49,768 49,768
Public sector 190 2 2 2 2 3 3
Banks (inc. s.t. deposits) 18,031 19,934 17,941 14,891 14,891 14,146 14,146
Non-bank Corporates 48,064 49,930 44,937 37,298 37,298 35,619 35,619
o/w trade credit 30,102 31,271 28,144 23,359 23,359 22,308 22,308
SOURCES OF FINANCING (B) 148,888 135,485 129,184 129,884 100,060 125,078 96,339
Foreign direct investment (net) 5,313 -300 6,754 7,340 5,359 8,204 5,989 61 61 same
o/w inward (net) 6,068 -5,167 10,253 11,751 8,813 13,264 9,948
Equities (net) 3,321 1,390 4,299 1,091 109 1,108 111
by nonresidents 3,888 2,602 5,182 2,000 100 2,000 100
New borrowing and debt rollover 136,721 128,932 108,930 114,034 90,675 108,908 86,881
Medium and long-term borrowing 69,682 66,052 56,739 64,266 53,338 62,340 51,974
Public sector 24,629 16,799 16,745 19,194 14,012 17,038 12,438 98 98 same
Banks 12,589 7,010 6,838 6,496 4,223 6,496 4,223 59 73 lower
Non-bank Corporates 32,464 42,243 33,155 38,575 35,103 38,806 35,313 74 86 lower
Short-term borrowing 67,039 62,880 52,191 49,768 37,337 46,567 34,907
Public sector 2 2 2 3 3 3 3 110 110 same
Banks 19,934 17,941 14,891 14,146 9,195 13,439 8,735 59 62 lower
Non-bank Corporates 47,103 44,937 37,298 35,619 28,139 33,126 26,170 75 75 same
EU capital transfers 8,804 12,386 14,207 13,912 13,912 13,016 13,016
Other -5,271 -6,923 -5,006 -6,494 -9,994 -6,158 -9,658 USD 5 bln outflow USD 3.5 bln outflow
GROSS RESERVES ACCUMULATION (C) 11,201 1,208 -3,510 2,015 -4,819 518 -5,232
half reserve
accumulation in
baseline reserve drawdown
FINANCING GAP (B - A - C) 0 0 0 0 -22,989 0 -22,989
Financing Gap (in bln USD) 23.0 23.0
(in bln SDR) 15.5 15.5
(% of quota) 918% 918%
Kernel Rollover

REPUBLIC OF POLAND
INTERNATIONAL MONETARY FUND 37
Table 8. Republic of Poland: Indicators of Fund Credit, 2015–20
2015 2016 2017 2018 2019 2020
Stocks from prospective drawings 1/
Fund credit (millions SDR) 15,500 15,500 15,500 9,688 1,938 0
in percent of quota 918 918 918 574 115 0
in percent of GDP 4 4 4 2 0 0
in percent of exports of goods and services 9 9 8 5 1 0
in percent of gross reserves 2/ 23 23 23 14 3 0
Flows from prospective drawings 3/
GRA Charges 130 163 163 144 67 4
Level Based Surcharge 166 209 209 240 54 0
Service Charges 78 0 0 0 0 0
Principal 0 0 0 5,813 7,750 1,938
Debt Service due on GRA credit (millions SDR) 374 372 371 6,196 7,871 1,942
in percent of quota 22 22 22 367 466 115
in percent of GDP 0 0 0 1 2 0
in percent of exports of goods and services 0 0 0 3 4 1
in percent of gross reserves 2/ 1 1 1 9 12 3
Memorandum item:
Total external debt, assuming full drawing (percent of GDP) 74 71 68 63 59 56
Sources: IMF Finance Department, Polish authorities, and IMF staff calculations.
2/ Excludes IMF purchases.
Projections
1/ End of Period. Assumes full drawing upon FCL approval in early 2015. The Polish authorities have expressed
their intention to treat the arrangement as precautionary.
3/ Based on the rate of charge as of December 15, 2014. Includes surcharges under the system currently in force
and service charges.

REPUBLIC OF POLAND
38 INTERNATIONAL MONETARY FUND
Table 9. Republic of Poland: Proposed Access Relative to Other High-Access Cases
Proposed Proposed 20th 65th 80th Median
Arrangement Arrangement
FCL (Percentile) (Ratio)
Access
In millions of SDRs 15,500 81 1,386 10,981 15,418 6,662
Average annual access (percent of quota) 459 70 171 394 647 271
Access during the first year (percent of quota) 918
Average annual access (percent of total) 2/ 459 69 300 778 1,009 575
Total access in percent of: 3/
Actual quota 918 72 341 800 1,053 600
Gross domestic product 4.6 27 3.0 7.3 9.6 6.2
Gross international reserves 22.2 15 25.8 54.6 85.3 48.3
Exports of goods and nonfactor services 4/ 9.5 15 11.2 27.9 39.0 19.9
Imports of goods and nonfactor services 9.9 22 9.7 22.9 32.9 17.8
Total debt stock 5/
Of which: Public 8 19 8 16 29 12
External 6 16 7 15 22 12
Short-term 6/ 29 39 21 51 112 36
M2 8 25 6 15 24 12
Source: Executive Board documents, MONA database, and Fund staff estimates.
1/
2/ Correspond to quotas prior to 2008 Reform.
3/
4/ Includes net private transfers.
5/ Refers to net debt.
6/ Refers to residual maturity.
The data used to calculate ratios is the actual value for the year prior to approval for public, external, and short-term debt, and the
projection at the time of program approval for the year in which the program was approved for all other variables (projections for
2014 were used).
High-Access Cases 1/
High access cases include available data at approval and on augmentation for all the requests to the Board since 1997, which involved
the use of the exceptional circumstances clause or SRF resources. Exceptional access augmentations are counted as separate
observations. For the purpose of measuring access as a ratio of different metrics, access includes augmentations and previously
approved and drawn amounts.
Percentile

REPUBLIC OF POLAND
INTERNATIONAL MONETARY FUND 39
Appendix. Letter from the Authorities Requesting
Flexible Credit Line
Warsaw, December 22, 2014
Ms. Christine Lagarde
Managing Director
International Monetary Fund
Dear Ms. Lagarde,
Since 2009, the consecutive arrangements under the IMF’s Flexible Credit Line (FCL) have served
Poland’s economy well. During a prolonged period of heightened external risks, the FCL provided
valuable additional insurance against adverse external shocks, fostering Poland’s macroeconomic
performance and financial stability, and supporting market confidence. As noted at the conclusion
of the last Article IV consultation, alongside the additional line of defence provided by the FCL,
Poland’s very strong fundamentals and policies have helped it weather the turmoil in financial
markets.
Meanwhile, Poland has continued to build its policy buffers. Fiscal deficit and public debt have been
substantially reduced in recent years. The current account balance has improved. Supported by
a strong regulatory and supervisory framework, the banking sector has remained well-capitalized,
liquid, and profitable, and reliance on parent bank funding has declined.
Looking forward, we are determined to maintain very strong institutional policy frameworks and
policies. The government favours a balanced approach to macroeconomic management. Mindful of
economic growth considerations, the government has been pursuing conservative fiscal policy
aimed at putting public debt on a robust downward path. A new permanent expenditure rule has
been introduced, thereby further strengthening the already very strong fiscal framework. Monetary
policy continues to be guided by the inflation targeting framework, underpinned by the flexible
exchange rate regime. Alongside, effective financial sector supervision has continued to support
financial stability.
Poland’s open economy has benefited from integration with global markets, including the German
supply chain. At the same time and despite Poland’s improved economic fundamentals and strong
policies, its open capital account, combined with relatively high financing needs, makes it
susceptible to shifts in investor sentiment.

REPUBLIC OF POLAND
40 INTERNATIONAL MONETARY FUND
While in the government’s assessment some of the external risks have receded since the last FCL
request, new concerns have emerged. First, a potential surge in financial market volatility owing to
uncertainties related to the eventual normalization of U.S. monetary policy poses a risk of a sudden
shift in market sentiment toward emerging market assets. Second, protracted slow growth in
Poland’s main trading partners would affect its economy through trade linkages and the confidence
channel. Third, we recognize the growing risks stemming from geopolitical tensions, surrounding
Russia and Ukraine.
In light of these concerns, we believe that the FCL would continue to be instrumental in mitigating
external risks in case of a tail event. At the same time, these risks have to be considered in the
context of Poland’s improved economic fundamentals and its increased policy buffers. On balance,
we believe that a new two-year FCL arrangement at lower access would provide sufficient insurance
against adverse external shocks, while sending a strong signal of Poland’s commitment to exit the
facility as soon as external conditions allow.
We have initiated extensive communication efforts regarding Poland’s exit strategy. Through direct
outreach to investors and the general public, including by top Ministry of Finance officials, we have
signalled our intention to begin a smooth gradual exit from the FCL. The outreach has been
favourably received by investors and other stakeholders with only muted market reaction,
reinforcing our belief that Poland is well prepared to begin gradual exit from the arrangement.
In sum, given the strengthened fundamentals and buffers and considering the balance of risks, we
request the approval of a successor 24-month FCL arrangement for Poland in a reduced amount
equivalent to SDR 15.50 billion (918 percent of quota) and wish to cancel the current arrangement
approved on January 18, 2013 effective upon approval of the new FCL arrangement. We reaffirm our
intention to treat the instrument as precautionary.
Sincerely Yours,
/ s / / s /
Minister of Finance President of Narodowy Bank Polski
MATEUSZ SZCZUREK MAREK BELKA

REPUBLIC OF POLAND
INTERNATIONAL MONETARY FUND 41
Annex I. Public Sector Debt Sustainability Analysis
Public debt is moderately high but sustainable. Its structure and risk profile in terms of interest,
rollover, and foreign currency risks is robust, and contingent liabilities are not deemed material. The
main risk to the debt outlook stems from a negative shock to GDP growth. In addition, a large share of
foreign investors in the domestic debt market entails a risk, albeit the composition of the investor base
and the low share of debt at floating rates provide some mitigating factors.
A. Baseline and Realism of Projections
Debt levels. The adoption of ESA2010 accounting standards resulted in a 1½ percentage point
decline in the recorded ratio of public debt to GDP to 55.7 percent at end-2013. A further one-
off drop to 48.8 percent of GDP in 2014 is expected as a result of changes to the pension
system. Poland’s favorable public debt dynamics are underpinned by a decline in the primary
deficit, a favorable differential between projected GDP growth and the real interest rate (as the
economy recovers), and the effects of ongoing changes to the pension system. The latter would
reduce the ratio of public debt-to-GDP by some 9 percentage points in 2014.
GDP Growth. The projections assume a gradual acceleration of GDP growth, from around
3 percent during 2014‒15 to 3.5 percent in 2019. The output gap is expected to close gradually
over the medium term. In recent years, staff projections of growth have displayed small forecast
errors, with some indication of a pessimistic bias relative to other countries.
Fiscal Adjustment. Under the baseline, the primary deficit is expected to decline from
1.5 percent of GDP in 2013 to about balance during 2018‒19, reflecting modest fiscal measures
already in the pipeline, the changes to the pension system, and the gradual recovery in tax
revenue (closer to recent historical levels). In the recent past, staff forecast errors of the primary
deficit in Poland have not displayed an apparent bias and have been more conservative than for
other countries. Overall, the projected fiscal adjustment seems feasible, as indicated by cross
country benchmarks.
Sovereign yields. The effective interest rate on public debt declined from 6.6 percent in 2005 to
5.9 percent in 2009 and further to about 5 percent in 2013. It is projected to decline to
4.6 percent by 2015. In recent years, Poland has maintained access to capital markets on
favorable terms, even during periods of global financial distress. Yields on 10‒year bonds
declined by almost 200 basis points year-to-date to 2½ percent in November 2014—a new
record low. In turn, spreads over 10‒year German bonds dropped below 180 basis points in
November, while EMBI and CDS spreads dropped to around 95 basis points and 65 basis points,
respectively. While there is uncertainty about the impact of Fed tapering on market conditions,
the pass-through from interest increases to the budget would be very gradual, as about
80 percent of debt carries a fixed interest rate and the average duration stands at about 3 years.
A 100 basis points parallel shift in the yield curve will lead to an increase in the interest bill of
about 0.1 percent of GDP in the first year.

REPUBLIC OF POLAND
42 INTERNATIONAL MONETARY FUND
Changes to the pension system. Public debt projections under the baseline are strongly
influenced by changes to the pension system.1 From the fiscal perspective, these changes
generated a large one-off drop in (explicit) public debt in the first quarter of 2014 (with a
matching increase in implicit public pension liabilities), and a reduction in public financing needs
over the medium term. The latter reflects the combined effect of lower public debt service, a
partial redirection of pension contributions from the second pillar to the social security
administration, and a gradual transfer of assets to the social security administration ten years
before retirement. By contrast, the associated increase in public pension payments will gather
pace in the long run. Staff calculations using baseline projections for 2014‒60 indicate the
pension changes would lead to net positive cash flows to the fiscal sector of 30 percent of GDP
in net present value terms.
Maturity and rollover risks. Rollover risks are well managed. The average maturity of
outstanding debt is estimated at 4.2 years, and the share of short-term debt in total government
debt is negligible (there have been no t-bills outstanding since August 2013). In recent years, the
authorities have taken advantage of favorable market conditions to actively pre-finance debt.
The 2014 financing needs were covered by September 2014, and pre-financing for 2015 took
place in the third quarter of 2014. The pension changes caused a mechanical increase in the
share of foreign investors in the domestic market as well as in the share of foreign debt
(according to the nationality of the holders): the share of foreign investors in the domestic
market increased from about 34 percent in 2013 to about 41 percent in 2014 and the overall
share of external debt in total public debt increased from 51 percent in 2013 to about
58 percent in 2014. In addition, the share of foreign currency debt in total debt also increased
from 30 percent in 2013 to about 37 percent in 2014. In line with the debt management
strategy, the baseline assumes gradual convergence toward the current structure of public debt
in terms of the share of foreign currency debt in total debt (30 percent) and external debt in
total debt (about 50 percent).
DSA risk assessment. The heat map highlights risks associated with the relatively large external
financing requirements (26 percent of GDP in 2013), plus the share of public debt held by non-
residents (51 percent at end-2013). The latter is influenced by the large participation of foreign
investors in the domestic bond market. Risks associated with a sudden pullout by foreign
investors are ameliorated by the composition of the investor base, which is dominated by “real
money” institutional investors. In turn, external financing requirement are heavily influenced by
the financing needs of the private sector, which include a substantial share of cross-border,
intercompany financing, which tends to ameliorate the risk of a sudden stop.
Fan charts. The symmetric fan charts, which assume symmetric upside and downside risks, show
that public debt is more likely to enter a downward trajectory during the projection period. The
1 In February 2014, the pension funds’ holdings of public debt were transferred to the social security administration
(together with the corresponding pension liabilities), causing a one-off drop in public debt of about 9 percent of
GDP. In addition, the pension changes entailed the gradual transfer of contributor’s assets from the second to the
first pillar, starting 10 years prior to their retirement.

REPUBLIC OF POLAND
INTERNATIONAL MONETARY FUND 43
lower bands indicate that the debt-to-GDP ratio could drop to around 40 percent by 2019 with a
25 percent probability. On the other hand, the upper bands indicate that debt-to-GDP ratios
could surpass 55 percent by 2019 with a 10 percent probability. A more stringent exercise,
however, combining restrictions to the upside shocks to interest rates and GDP growth (200 bps
and 1 percent, respectively), increases the probability of debt-to-GDP surpassing 55 percent in
2019 to 25 percent. This result is still commensurate with a sustainable debt path, but it
illustrates the degree of uncertainty around the baseline.
B. Shocks and Stress Tests
Primary balance shock. An assumed deterioration in the primary balance by 0.8 percentage
points during 2014–15 pushes up slightly the public debt-to–revenue ratio to about 127 percent
during 2016–17 and opens up a gap of about 4 percentage points relative to the baseline. Gross
financing needs peak to about 11.5 percent of GDP in 2015 and converge to the baseline by
2019.
Growth Shock. The stress scenario assumes a drop in GDP growth by 1.8 percentage points in
two consecutive years (2014‒15) relative to the baseline, combined with a 0.5 percent drop in
inflation and deterioration in the primary balance by 0.9 percent in 2014 and further by
1.8 percent in 2015. Under these assumptions, public debt increases to about 53 percent of GDP
in 2016 before trending downward to about 51 percent of GDP by 2019. Gross financing needs
increase to about 12 percent of GDP during 2015‒16, but then converge quickly toward the
baseline in the outer years.
Interest rate shock. A permanent 200 bps increase in the nominal interest rate starting in 2015
(equivalent to the difference between the maximum real interest rate during 2003‒13 and the
average real interest rate over the projection), leads to an increase in the effective interest rate
on debt by 42 bps in 2016 and further gradual increases to 137 bps by 2019. Under this
scenario, public debt dynamics deteriorate marginally relative to the baseline and remains below
49 percent of GDP throughout the projection. Gross financing needs peak at about 11 percent
of GDP in 2015 and drop to about 8 percent at the end of the projection horizon.
Exchange rate shock: The combined shock also assumes an exchange rate depreciation of
about 27 percent in 2015 (from 3.1 PLN/USD to 3.9 PLN/USD), calibrated to emulate the
maximum historic movement of the FX rate over the last 10 years. Under this scenario, gross
public debt increases to about 50 percent of GDP in 2015 before trending down to about
47 percent by 2019. The resilience reflects the predominance of public debt in local currency.
Combined shock. Under the combined shock, the public-debt-to-GDP ratio jumps to about
58 percent in 2017 and declines gradually afterward. In turn, gross financing needs increase to
about 13 percent of GDP in 16, and remain around 10 percent of GDP in the outer years.

REPUBLIC OF POLAND
44 INTERNATIONAL MONETARY FUND
Republic of Poland: Public Sector Debt Sustainability Analysis (DSA)—Risk Assessment
Poland
Source: IMF staff.
1/ The cell is highlighted in green if debt burden benchmark of 70% is not exceeded under the specific shock or baseline, yellow if exceeded under specific shock but not baseline,
red if benchmark is exceeded under baseline, white if stress test is not relevant.
Real Interest
Rate Shock
External
Financing
Requirements
Real GDP
Growth Shock
Heat Map
Upper early warning
Evolution of Predictive Densities of Gross Nominal Public Debt
(in percent of GDP)
Debt profile 3/
Lower early warning
(Indicators vis-à-vis risk assessment benchmarks, in 2013)
Debt Profile Vulnerabilities
Gross financing needs 2/
Debt level 1/ Real GDP
Growth Shock
Primary Balance
Shock
3/ The cell is highlighted in green if country value is less than the lower risk-assessment benchmark, red if country value exceeds the upper risk-assessment benchmark, yellow if
country value is between the lower and upper risk-assessment benchmarks. If data are unavailable or indicator is not relevant, cell is white.
Lower and upper risk-assessment benchmarks are:
Change in the
Share of Short-
Term Debt
Foreign
Currency
Debt
Public Debt
Held by Non-
Residents
Primary Balance
Shock
Real Interest
Rate Shock
Exchange Rate
Shock
Contingent
Liability Shock
Exchange Rate
Shock
Contingent
Liability shock
5/ External financing requirement is defined as the sum of current account deficit, amortization of medium and long-term total external debt, and short-term total external debt at
the end of previous period.
4/ Long-term bond spread over German bonds, an average over the last 3 months, 5-Aug-14 through 5-Nov-14.
2/ The cell is highlighted in green if gross financing needs benchmark of 15% is not exceeded under the specific shock or baseline, yellow if exceeded under specific shock but not
baseline, red if benchmark is exceeded under baseline, white if stress test is not relevant.
200 and 600 basis points for bond spreads; 5 and 15 percent of GDP for external financing requirement; 0.5 and 1 percent for change in the share of short-term debt; 15 and 45
percent for the public debt held by non-residents; and 20 and 60 percent for the share of foreign-currency denominated debt.
Market
Perception
20
60
30%
1 2
200
600
202
bp
1 2
5
15
26%
1 2
0.5
1
0%
1 2
Bond spreadExternal Financing
Requirement
Annual Change in
Short-Term Public
Debt
Public Debt in
Foreign Currency
(in basis points) 4/ (in percent of GDP) 5/ (in percent of total) (in percent of total)
0
10
20
30
40
50
60
2012 2013 2014 2015 2016 2017 2018 2019
10th-25th 25th-75th 75th-90thPercentiles:Baseline
Symmetric Distribution
0
10
20
30
40
50
60
70
2012 2013 2014 2015 2016 2017 2018 2019
Restricted (Asymmetric) Distribution
1 is the max positive growth rate shock (percent)
2 is the max negative interest rate shock (percent)
no restriction on the primary balance shock
no restriction on the exchange rate shock
Restrictions on upside shocks:
15
45
51%
1 2
Public Debt Held by
Non-Residents
(in percent of total)

Republic of Poland: Public DSA—Realism of Baseline Assumptions
REP
UB
LIC O
F P
OLA
ND
INTTER
NA
TIO
NA
L MO
NETA
RY
FU
ND
45

REPUBLIC OF POLAND
46 INTERNATIONAL MONETARY FUND
Republic of Poland: Public DSA—Baseline Scenario
(Percent of GDP, unless otherwise indicated)
As of November 05, 20142/
2012 2013 2014 2015 2016 2017 2018 2019 Sovereign Spreads
Nominal gross public debt 48.6 54.4 55.7 48.8 48.6 48.2 47.7 46.9 46.0 EMBIG (bp) 3/ 178
Public gross financing needs 16.0 13.5 10.9 7.2 10.6 9.7 8.6 8.5 7.4 5Y CDS (bp) 65
Real GDP growth (in percent) 4.5 1.8 1.7 3.2 3.0 3.3 3.4 3.5 3.5 Ratings Foreign Local
Inflation (GDP deflator, in percent) 2.9 2.2 1.2 -0.1 1.9 1.6 2.1 2.3 2.5 Moody's A2 A2
Nominal GDP growth (in percent) 7.5 4.0 2.9 3.1 4.9 4.9 5.6 5.9 6.0 S&Ps A- A
Effective interest rate (in percent) 4/ 5.9 5.1 4.7 4.1 4.5 4.6 4.5 4.5 4.5 Fitch A- A
2012 2013 2014 2015 2016 2017 2018 2019 cumulative
Change in gross public sector debt 1.4 -0.4 1.4 -6.9 -0.2 -0.4 -0.5 -0.8 -1.0 -9.8
Identified debt-creating flows 0.8 -1.5 1.4 -8.0 -0.4 -0.6 -0.8 -1.1 -1.1 -12.0
Primary deficit 2.4 1.1 1.5 0.9 0.5 0.0 0.2 0.0 0.0 1.7
Primary (noninterest) revenue and grants 39.4 39.1 38.2 39.0 39.3 39.5 39.1 39.2 39.1 235.3
Primary (noninterest) expenditure 41.8 40.2 39.7 39.9 39.8 39.5 39.4 39.3 39.1 237.0
Automatic debt dynamics 5/
-0.8 -1.2 0.6 0.5 -0.2 -0.2 -0.5 -0.6 -0.7 -1.7
Interest rate/growth differential 6/
-0.7 0.6 1.0 0.5 -0.2 -0.2 -0.5 -0.6 -0.7 -1.7
Of which: real interest rate 1.2 1.5 1.9 2.3 1.2 1.4 1.0 1.0 0.8 7.7
Of which: real GDP growth -2.0 -0.9 -0.9 -1.8 -1.4 -1.5 -1.6 -1.6 -1.5 -9.3
Exchange rate depreciation 7/
-0.1 -1.8 -0.4 … … … … … … …
Other identified debt-creating flows -0.8 -1.4 -0.8 -9.4 -0.7 -0.5 -0.5 -0.5 -0.5 -12.0
Privatization (+ reduces financing needs) (negative) -0.6 -1.0 -0.6 -0.1 -0.1 -0.1 -0.1 -0.1 -0.1 -0.6
Contingent liabilities 0.0 0.0 0.0 0.0 0.0 0.0 0.0 0.0 0.0 0.0
Liabilities not included in debt 8/
-0.2 -0.3 -0.1 -9.3 -0.6 -0.4 -0.4 -0.4 -0.4 -11.5
Residual, including asset changes 9/
0.6 1.1 0.0 1.1 0.3 0.3 0.3 0.3 0.1 2.2
Source: IMF staff.
1/ Public sector is defined as general government.
2/ Based on available data.
3/ Long-term bond spread over German bonds.
4/ Defined as interest payments divided by debt stock (excluding guarantees) at the end of previous year.
5/ Derived as [(r - π(1+g) - g + ae(1+r)]/(1+g+π+gπ)) times previous period debt ratio, with r = interest rate; π = growth rate of GDP deflator; g = real GDP growth rate;
a = share of foreign-currency denominated debt; and e = nominal exchange rate depreciation (measured by increase in local currency value of U.S. dollar).
6/ The real interest rate contribution is derived from the numerator in footnote 5 as r - π (1+g) and the real growth contribution as -g.
7/ The exchange rate contribution is derived from the numerator in footnote 5 as ae(1+r).
8/ From 2014 onwards, reflects the transfer of pension fund assets and liabilities to the social security administration.
9/ Includes asset changes and interest revenues (if any). For projections, includes exchange rate changes during the projection period.
10/ Assumes that key variables (real GDP growth, real interest rate, and other identified debt-creating flows) remain at the level of the last projection year.
-1.1
balance 10/
primary
Debt, Economic and Market Indicators 1/
2003-2011
Actual
Projections
Contribution to Changes in Public Debt
Projections
2003-2011
Actual
debt-stabilizing
-15
-10
-5
0
5
10
2003 2004 2005 2006 2007 2008 2009 2010 2011 2012 2013 2014 2015 2016 2017 2018 2019
Debt-Creating Flows
Primary deficit Real GDP growth Real interest rate Exchange rate depreciation Other debt-creating flows Residual Change in gross public sector debt
projection
(in percent of GDP)
-25
-20
-15
-10
-5
0
5
10
15
cumulative
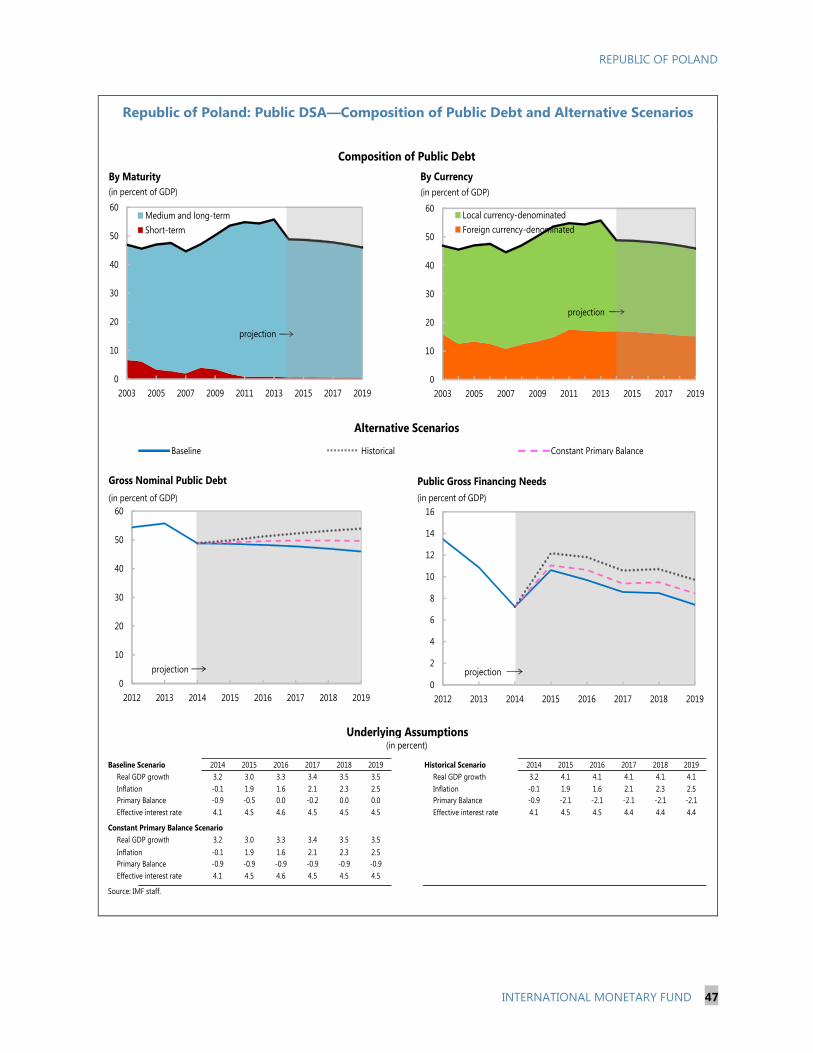
REPUBLIC OF POLAND
INTERNATIONAL MONETARY FUND 47
Republic of Poland: Public DSA—Composition of Public Debt and Alternative Scenarios
Baseline Scenario 2014 2015 2016 2017 2018 2019 Historical Scenario 2014 2015 2016 2017 2018 2019
Real GDP growth 3.2 3.0 3.3 3.4 3.5 3.5 Real GDP growth 3.2 4.1 4.1 4.1 4.1 4.1
Inflation -0.1 1.9 1.6 2.1 2.3 2.5 Inflation -0.1 1.9 1.6 2.1 2.3 2.5
Primary Balance -0.9 -0.5 0.0 -0.2 0.0 0.0 Primary Balance -0.9 -2.1 -2.1 -2.1 -2.1 -2.1
Effective interest rate 4.1 4.5 4.6 4.5 4.5 4.5 Effective interest rate 4.1 4.5 4.5 4.4 4.4 4.4
Constant Primary Balance Scenario
Real GDP growth 3.2 3.0 3.3 3.4 3.5 3.5
Inflation -0.1 1.9 1.6 2.1 2.3 2.5
Primary Balance -0.9 -0.9 -0.9 -0.9 -0.9 -0.9
Effective interest rate 4.1 4.5 4.6 4.5 4.5 4.5
Source: IMF staff.
Underlying Assumptions(in percent)
Alternative Scenarios
Composition of Public Debt
Baseline Historical Constant Primary Balance
0
10
20
30
40
50
60
2012 2013 2014 2015 2016 2017 2018 2019
Gross Nominal Public Debt
(in percent of GDP)
projection
0
2
4
6
8
10
12
14
16
2012 2013 2014 2015 2016 2017 2018 2019
Public Gross Financing Needs
(in percent of GDP)
projection
0
10
20
30
40
50
60
2003 2005 2007 2009 2011 2013 2015 2017 2019
By Maturity
Medium and long-term
Short-term
(in percent of GDP)
projection
0
10
20
30
40
50
60
2003 2005 2007 2009 2011 2013 2015 2017 2019
By Currency
Local currency-denominated
Foreign currency-denominated
(in percent of GDP)
projection

REPUBLIC OF POLAND
48 INTERNATIONAL MONETARY FUND
Republic of Poland: Public DSA—Stress Tests
Primary Balance Shock 2014 2015 2016 2017 2018 2019 Real GDP Growth Shock 2014 2015 2016 2017 2018 2019
Real GDP growth 3.2 3.0 3.3 3.4 3.5 3.5 Real GDP growth 3.2 1.2 1.5 3.4 3.5 3.5
Inflation -0.1 1.9 1.6 2.1 2.3 2.5 Inflation -0.1 1.4 1.1 2.1 2.3 2.5
Primary balance -0.9 -1.3 -0.8 -0.2 0.0 0.0 Primary balance -0.9 -1.4 -1.8 -0.2 0.0 0.0
Effective interest rate 4.1 4.5 4.6 4.6 4.5 4.5 Effective interest rate 4.1 4.5 4.6 4.6 4.6 4.6
Real Interest Rate Shock Real Exchange Rate Shock
Real GDP growth 3.2 3.0 3.3 3.4 3.5 3.5 Real GDP growth 3.2 3.0 3.3 3.4 3.5 3.5
Inflation -0.1 1.9 1.6 2.1 2.3 2.5 Inflation -0.1 8.6 1.6 2.1 2.3 2.5
Primary balance -0.9 -0.5 0.0 -0.2 0.0 0.0 Primary balance -0.9 -0.5 0.0 -0.2 0.0 0.0
Effective interest rate 4.1 4.5 5.0 5.2 5.5 5.8 Effective interest rate 4.1 4.9 4.5 4.4 4.4 4.4
Combined Shock
Real GDP growth 3.2 1.2 1.5 3.4 3.5 3.5
Inflation -0.1 1.4 1.1 2.1 2.3 2.5
Primary balance -0.9 -1.4 -1.8 -0.2 0.0 0.0
Effective interest rate 4.1 4.9 4.9 5.2 5.5 5.8
Source: IMF staff.
Macro-Fiscal Stress Tests
Baseline Primary Balance Shock
Real GDP Growth Shock
Real Interest Rate Shock
(in percent)
Real Exchange Rate Shock
Combined Macro-Fiscal Shock
Additional Stress Tests
Baseline
Underlying Assumptions
40
42
44
46
48
50
52
54
2014 2015 2016 2017 2018 2019
Gross Nominal Public Debt(in percent of GDP)
100
105
110
115
120
125
130
135
140
2014 2015 2016 2017 2018 2019
Gross Nominal Public Debt
(in percent of Revenue)
4
5
6
7
8
9
10
11
12
13
2014 2015 2016 2017 2018 2019
Public Gross Financing Needs
(in percent of GDP)
0
10
20
30
40
50
60
70
2014 2015 2016 2017 2018 2019
Gross Nominal Public Debt(in percent of GDP)
0
20
40
60
80
100
120
140
160
2014 2015 2016 2017 2018 2019
Gross Nominal Public Debt
(in percent of Revenue)
0
2
4
6
8
10
12
14
2014 2015 2016 2017 2018 2019
Public Gross Financing Needs
(in percent of GDP)

REPUBLIC OF POLAND
INTERNATIONAL MONETARY FUND 49
Annex II. External Debt Sustainability Analysis
Republic of Poland: External Debt Sustainability: Bound Tests, 2009–19 1/ 2/
(External debt, percent of GDP)
i-rate
shock
59Baseline
58
20
30
40
50
60
70
80
90
100
2009 2011 2013 2015 2017 2019
Interest rate shock (Percent)
Sources: International Monetary Fund, Country desk data, and staff estimates.
1/ Shaded areas represent actual data. Individual shocks are permanent one-half standard deviation
shocks. Figures in the boxes represent average projections for the respective variables in the baseline
and scenario being presented. Ten-year historical average for the variable is also shown.
2/ For historical scenarios, the historical averages are calculated over the ten-year period, and the
information is used to project debt dynamics five years ahead.
3/ Permanent 1/4 standard deviation shocks applied to real interest rate, growth rate, and current
account balance.
4/ One-time real depreciation of 30 percent occurs in 2015.
Historical
48
Baseline
58
0
5
10
15
20
25
30
35
20
30
40
50
60
70
80
90
100
2009 2011 2013 2015 2017 2019
Baseline and historical scenarios
CA shock
62
Baseline
58
20
30
40
50
60
70
80
90
100
2009 2011 2013 2015 2017 2019
62
Baseline
58
20
30
40
50
60
70
80
90
100
2009 2011 2013 2015 2017 2019
Combined shock 3/
Combined
shock
67
Baseline
58
20
30
40
50
60
70
80
90
100
2009 2011 2013 2015 2017 2019
Real depreciation shock 4/
30% depreciation
Gross financing need
under baseline
(right scale)
Non-interest current account shock
(Percent of GDP)
Growth
shock
61Baseline
58
20
30
40
50
60
70
80
90
100
2009 2011 2013 2015 2017 2019
Baseline:
Scenario:
Historical:
3.0
3.4
2.4
Baseline:
Scenario:
Historical:
3.3
2.4
4.1
Baseline:
Scenario:
Historical:
-1.3
-2.1
-3.1
Growth shock
(Percent per year)

Republic of Poland: External Debt Sustainability Framework, 2009–19 (Percent of GDP, unless otherwise indicated)
50 IN
TERNATIO
NAL M
ON
ETARY FUN
D
REPUBLIC O
F POLAN
D
Projections2009 2010 2011 2012 2013 2014 2015 2016 2017 2018 2019 Debt-stabilizing
non-interest current account 6/
1 Baseline: External debt 64.1 66.2 61.2 73.3 72.1 68.8 69.3 66.9 63.7 60.6 58.1 -3.1
2 Change in external debt 18.0 2.0 -5.0 12.1 -1.2 -3.3 0.5 -2.4 -3.2 -3.1 -2.53 Identified external debt-creating flows (4+8+9) 8.6 -2.8 -3.6 2.4 -2.1 -2.5 -1.0 -1.0 -0.6 -0.4 -0.24 Current account deficit, excluding interest payments 3.3 3.9 3.9 1.9 -0.3 0.3 1.1 1.2 1.3 1.3 1.45 Deficit in balance of goods and services -79.0 -85.1 -90.4 -92.2 -92.2 -92.7 -93.2 -95.2 -96.4 -97.3 -98.06 Exports 39.2 41.6 44.4 46.0 47.0 47.1 46.9 47.9 48.7 49.2 49.67 Imports -39.8 -43.5 -46.0 -46.2 -45.1 -45.6 -46.3 -47.4 -47.7 -48.1 -48.48 Net non-debt creating capital inflows (negative) -2.3 -3.1 -3.0 -1.9 -0.4 -2.2 -1.7 -1.8 -1.7 -1.7 -1.79 Automatic debt dynamics 1/ 7.5 -3.6 -4.5 2.3 -1.4 -0.6 -0.5 -0.4 -0.2 -0.1 0.1
10 Contribution from nominal interest rate 0.6 1.1 1.1 1.7 1.6 1.6 1.6 1.8 2.0 2.1 2.111 Contribution from real GDP growth -1.5 -2.2 -2.9 -1.1 -1.2 -2.2 -2.0 -2.2 -2.1 -2.1 -2.012 Contribution from price and exchange rate changes 2/ 8.4 -2.6 -2.7 1.7 -1.8 ... ... ... ... ... ...13 Residual, incl. change in gross foreign assets (2-3) 3/ 9.4 4.8 -1.4 9.8 0.9 -0.8 1.5 -1.4 -2.6 -2.7 -2.3
External debt-to-exports ratio (in percent) 163.8 158.9 137.8 159.2 153.3 146.0 147.9 139.8 130.9 123.2 117.3
Gross external financing need (in billions of US dollars) 4/ 96.5 122.6 113.0 137.7 134.3 132.7 127.9 124.6 123.2 120.6 115.7in percent of GDP 22.1 25.7 21.6 27.7 25.5 10-Year 10-Year 24.2 23.3 21.7 20.2 18.5 16.7
Scenario with key variables at their historical averages 5/ 68.8 64.1 59.7 55.4 51.2 47.7 -5.8Historical Standard
Key Macroeconomic Assumptions Underlying Baseline Average Deviation
Real GDP growth (in percent) 2.6 3.7 4.8 1.8 1.7 4.1 1.8 3.2 3.0 3.3 3.4 3.5 3.5GDP deflator in US dollars (change in percent) -19.7 5.2 5.0 -6.9 4.2 5.6 11.7 0.8 -2.7 1.4 2.7 2.9 3.1Nominal external interest rate (in percent) 1.0 1.9 1.7 2.7 2.3 2.4 0.7 2.3 2.3 2.7 3.1 3.4 3.6Growth of exports (US dollar terms, in percent) -20.1 16.0 17.3 -1.7 8.2 14.1 15.3 4.3 -0.3 6.9 8.0 7.7 7.4Growth of imports (US dollar terms, in percent) -27.4 19.1 16.4 -4.8 3.5 13.4 18.4 5.2 1.7 7.2 6.9 7.4 7.4Current account balance, excluding interest payments -3.3 -3.9 -3.9 -1.9 0.3 -3.1 1.7 -0.3 -1.1 -1.2 -1.3 -1.3 -1.4Net non-debt creating capital inflows 2.3 3.1 3.0 1.9 0.4 2.7 1.3 2.2 1.7 1.8 1.7 1.7 1.7
1/ Derived as [r - g - r(1+g) + ea(1+r)]/(1+g+r+gr) times previous period debt stock, with r = nominal effective interest rate on external debt; r = change in domestic GDP deflator in US dollar terms, g = real GDP growth rate, e = nominal appreciation (increase in dollar value of domestic currency), and a = share of domestic-currency denominated debt in total external debt.2/ The contribution from price and exchange rate changes is defined as [-r(1+g) + ea(1+r)]/(1+g+r+gr) times previous period debt stock. r increases with an appreciating domestic currency (e > 0) and rising inflation (based on GDP deflator). 3/ For projection, line includes the impact of price and exchange rate changes.4/ Defined as current account deficit, plus amortization on medium- and long-term debt, plus short-term debt at end of previous period. 5/ The key variables include real GDP growth; nominal interest rate; dollar deflator growth; and both non-interest current account and non-debt inflows in percent of GDP.6/ Long-run, constant balance that stabilizes the debt ratio assuming that key variables (real GDP growth, nominal interest rate, dollar deflator growth, and non-debt inflows in percent of GDP) remain at their levels of the last projection year.
Actual

REPUBLIC OF POLAND
ASSESSMENT OF THE IMPACT OF THE PROPOSED FLEXIBLE
CREDIT LINE ARRANGEMENT ON THE FUND’S FINANCES
AND LIQUIDITY POSITION
Approved By Andrew Tweedie and
Sanjaya Panth
Prepared by the Finance and Strategy, Policy, and Review
Departments (in consultation with other departments)
CONTENTS
INTRODUCTION __________________________________________________________________________ 2
BACKGROUND ____________________________________________________________________________ 2
ASSESSMENT _____________________________________________________________________________ 7
TABLES
1. External Debt and Debt Service, 2010–14 _______________________________________________ 3
2. Capacity to Repay Indicators, 2013–19 __________________________________________________ 5
3. Impact on GRA Finances ________________________________________________________________ 7
ANNEX
I. History of IMF Arrangements ____________________________________________________________ 9
January 5, 2015

REPUBLIC OF POLAND
2 INTERNATIONAL MONETARY FUND
INTRODUCTION
1. This note assesses the impact of the proposed Flexible Credit Line (FCL)
arrangement for Poland on the Fund’s finances and liquidity position, in accordance with
the policy on FCL arrangements.1 The proposed arrangement would cover a 24-month period
and access would be in an amount of SDR 15.5 billion (918 percent of quota). It would succeed
the existing FCL arrangement, which would be cancelled prior to approval of the proposed
arrangement. The full amount of access proposed would be available throughout the
arrangement period, in one or multiple purchases.2 The authorities intend to treat the
arrangement as precautionary.
BACKGROUND
2. Since the onset of the global economic and financial crisis, Poland has entered into
successive FCL arrangements with the Fund under which no drawings have been made. A
one-year FCL arrangement equivalent to SDR 13.69 billion (1,000 percent of quota) was approved
on May 6, 2009 which the authorities treated as precautionary. This arrangement was succeeded
by another FCL arrangement on identical terms which was approved on July 2, 2010 and a two-
year FCL arrangement in the amount of SDR 19.166 billion (1,400 percent of quota) approved on
January 21, 2011.3 On Jan 18, 2013 a successor FCL in the amount of SDR 22.0 billion
(1,303 percent of quota) was approved. Poland’s economy recovered well in 2010–11, reflecting
very strong economic fundamentals and decisive counter-cyclical policies. Limited
macroeconomic imbalances prior to the crisis and counter-cyclical policies during the crisis aided
the strong recovery. More recently, sustained efforts to build buffers and further strengthen the
policy framework further improved the already very strong economic fundamentals and reduced
financing needs. As a consequence, no drawings have been made under any of the previous or
the existing FCL arrangement. Poland has a history of strong performance under Fund
arrangements and an exemplary record of meeting its obligations to the Fund.
1 See GRA Lending Toolkit and Conditionality – Reform Proposals (3/13/09) and Flexible Credit Line (FCL)
Arrangements, Decision No.14283-(09/29), adopted March 24, 2009, as amended by Decision No. 14714-(10/83),
adopted August 30, 2010; the Fund’s Mandate – the Future Financing Role: Reform Proposals
(http://www.imf.org/external/np/pp/eng/2010/062910.pdf, 6/29/2010), and the IMF’s Mandate – the Future
Financing Role: Revised Reform Proposals and Revised Proposed Decisions
(http://www.imf.org/external/np/pp/eng/2010/082510.pdf, 8/25/2010); Review of the Flexible Credit Line, the
Precautionary and Liquidity Line, and the Rapid Financing Instrument – Specific Proposals.
(http://www.imf.org/external/np/pp/eng/2014/043014.pdf, 5/1/2014 and Decision No. 15593 – (14/46)).
2 If the full amount is not drawn in the first year of the arrangement, a review of Poland’s continued qualification
under the FCL arrangement must be completed before purchases can be made after the first year.
3 Soon after the approval of the FCL arrangement, the 2008 Quota and Voice Reform became effective and
increased Poland’s quota from SDR 1,369.0 million to SDR 1,688.4 million. This implied that the access under the
FCL was reduced to 1,135 percent of quota.

REPUBLIC OF POLAND
INTERNATIONAL MONETARY FUND 3
Table 1. Republic of Poland: External Debt and Debt Service, 2010–14 1/
3. Total external and public debt levels are projected to decline broadly and remain
sustainable. External debt, which was in the 44-55 percent of GDP range in the years preceding
the recent crisis, peaked at almost 73 percent of GDP in 2012-13, and is projected to decline
gradually over the medium term. Short term debt on a residual maturity basis is estimated at
about 30 percent of total external debt in 2014, and this share is projected to decline to below
one-quarter over the medium term. Public external debt, in turn, is estimated at 28 percent of
GDP in 2014, and is projected to decline below 25 percent of GDP by 2018. Gross public debt
(ESA95 definition), which rose to around 55 percent of GDP in 2013, is projected to fall below
50 percent in 2014 (pre-2008 levels). Net external debt is projected to fall below 45 percent of
2010 2011 2012 2013 2014
(In billions of US dollars)
Total External Debt 315.3 320.6 364.2 379.3 376.8
of which : Public 109.6 116.0 150.3 153.5 154.1
Private 205.7 204.6 213.9 225.8 222.8
Net External Debt 242.0 243.6 283.3 294.4 287.7 -
of which : Public 109.6 116.0 150.3 153.5 154.1
Private 132.3 127.6 133.0 140.9 133.6
Total External Debt Service 101.6 100.5 133.5 135.7 143.7
of which : Public 6.8 4.9 11.3 14.2 13.0
Private 94.7 95.6 122.2 121.5 130.7
Net External Debt Service 77.9 76.4 103.9 105.3 109.7 - - - - -
of which : Public 6.8 4.9 11.3 14.2 13.0
Private 71.1 71.5 92.6 91.1 96.7 - - - - -
(In percent of GDP)- - - - -
Total External Debt 66.2 61.2 73.3 72.1 68.8
of which : Public 23.0 22.1 30.3 29.2 28.1
Private 43.2 39.0 43.1 42.9 40.7
Net External Debt 50.8 46.5 57.0 56.0 52.5
of which : Public 23.0 22.1 30.3 29.2 28.1
Private 27.8 24.3 26.8 26.8 24.4
Total External Debt Service 21.3 19.2 26.9 25.8 26.2
of which : Public 1.4 0.9 2.3 2.7 2.4
Private 19.9 18.2 24.6 23.1 23.9
Net External Debt Service 16.4 14.6 20.9 20.0 20.0
of which : Public 1.4 0.9 2.3 2.7 2.4
Private 14.9 13.6 18.6 17.3 17.7
Source: Polish authorities and IMF staff estimates.
1/ End of period, unless otherwise indicated.

REPUBLIC OF POLAND
4 INTERNATIONAL MONETARY FUND
GDP in 2018. Sustainability analyses suggest that both external and public debt are generally
robust to, and remain manageable under, a range of scenarios.4
4. The proposed FCL arrangement —despite its reduced access—would continue to be
a substantial Fund commitment. The proposed reduction in access sends a clear signal of the
authorities’ intention to exit from the FCL as external risks recede. However if the full amount
available under the FCL arrangement were drawn, Poland would be one of the highest Fund
exposure to date.
5. If the full amount available under the proposed FCL arrangement were disbursed in
2015, Fund exposure to Poland would be manageable.
Fund credit would represent a modest part of Poland’s external debt (Table 2). Total
external debt would rise to 74 percent of GDP initially, and public external debt to about
33 percent of GDP, with Fund credit representing about 4 percent of GDP. At its peak,
Poland’s outstanding use of GRA resources would account for about 6 percent of total
external debt, 13 percent of public external debt and 19 percent of gross international
reserves.
External debt service would increase in the medium-term, but remain manageable under
staff’s medium-term macro projections. Poland’s projected debt service to the Fund
would peak in 2019 at about SDR 7.9 billion, or about 1.8 percent of GDP. In terms of
exports of goods and services, debt service to the Fund would peak at 3.6 percent in
2019. This would account for 54 percent of total public external debt service, which
would increase to about 7 percent of exports of goods and services.
4 Note that the debt sustainability analysis does not assume any drawings under the FCL arrangement.

REPUBLIC OF POLAND
INTERNATIONAL MONETARY FUND 5
Table 2. Republic of Poland—Capacity to Repay Indicators, 2013–19 1/
2013 2014 2015 2016 2017 2018 2019
Exposure and Repayments (In SDR millions)
GRA credit to Poland -- -- 15,500.0 15,500.0 15,500.0 9,687.5 1,937.5
(In percent of quota) -- -- 918.0 918.0 918.0 573.8 114.8
Charges due on GRA credit 2/ -- -- 373.8 371.8 371.4 384.1 120.9
Debt service due on GRA credit 2/ -- -- 373.8 371.8 371.4 6,196.6 7,870.9
Debt and Debt Service Ratios 3/
In percent of GDP
Total external debt 72.1 68.8 73.6 71.1 67.7 62.9 58.6
Public external debt 29.2 28.1 32.7 31.3 29.1 25.6 22.4
GRA credit to Poland -- -- 4.3 4.2 3.9 2.3 0.4
Total external debt service 25.8 26.2 22.3 20.6 19.0 18.7 17.1
Public external debt service 2.7 2.4 2.7 2.4 2.1 3.5 3.3
Debt service due on GRA credit -- -- 0.1 0.1 0.1 1.5 1.8
In percent of Gross International Reserves
Total external debt 357.1 366.9 314.4 316.2 319.1 341.2 374.2
Public external debt 144.5 150.0 139.7 139.5 137.4 138.7 143.4
GRA credit to Poland -- -- 18.5 18.5 18.6 12.6 2.8
In percent of Exports of Goods and Services
Total external debt service 54.8 55.7 47.5 43.0 39.0 38.0 34.4
Public external debt service 5.7 5.0 5.8 5.1 4.4 7.0 6.7
Debt service due on GRA credit -- -- 0.2 0.2 0.2 3.0 3.6
In percent of Total External Debt
GRA credit to Poland -- -- 5.9 5.9 5.8 3.7 0.7
In percent of Public External Debt
GRA credit to Poland -- -- 13.3 13.3 13.5 9.1 1.9
In percent of total external debt serviceDebt service due on GRA credit -- -- 0.5 0.5 0.5 7.9 10.4
U. S. dollars per SDR (period average) 1.52 1.54 1.53 1.54 1.55 1.55 1.56
U. S. dollars per SDR (end of period) 1.54 1.53 1.54 1.54 1.55 1.56 1.56
Sources: Polish authorities, Finance Department, World Economic Outlook, and IMF staff estimates.
1/ Assumes full drawings under the FCL upon approval. The Polish authorities have expressed their intention
to treat the arrangement as precautionary, as balance of payments pressures have not materialized.
2/ Based on the rate of charge as of December 15, 2014. Includes surcharges and service charges.
3/ Staff projections for external debt, GDP, gross international reserves, and exports of goods and services,
as used in the staff report that requests the proposed FCL, adjusted for the impact of the assumed FCL drawing.

REPUBLIC OF POLAND
6 INTERNATIONAL MONETARY FUND
6. The immediate net impact of the proposed arrangement would be to lower the Fund’s
forward commitment capacity (FCC) by about SDR 10 billion (4.2 percent). As the existing FCL
arrangement was approved after the 2011 first activation of the expanded and amended New
Arrangements to Borrow (NAB), the ratio of 3:1 of NAB-to-quota resources would apply for
financing of purchases under the arrangement based on prevailing guidelines. In the absence of a
new arrangement, the cancellation of the existing arrangement would free up the quota resources
(and thereby raise the FCC by SDR 5.5 billion). Approval of the proposed new FCL arrangement will
reduce the FCC by the full amount of the arrangement (SDR 15.5 billion).5 Thus, the net liquidity
impact would be to reduce the FCC by about SDR 10 billion to about SDR 228.6 billion (Table 3).6
7. If the resources available under the proposed FCL arrangement were fully drawn, the
Fund’s exposure to Poland would represent almost one fifth of total GRA credit outstanding.
The level of access relative to quota would fall from 1,303 percent of quota to 918 percent
with the new FCL, or from SDR 22 billion to 15.5 billion. It would still be sizable and exceed
the median of the peak levels of exceptional access cases while still remaining significantly
below the levels of several recent exceptional access cases with drawing such as Greece (EFF,
2012), Ireland (EFF, 2010), Portugal (EFF, 2011) and precautionary arrangement of Mexico
(FCL, 2014).
Poland’s outstanding use of GRA resources, at SDR 15.5 billion, would be one of the highest
of individual country exposures to date.
The concentration of Fund credit among the top five users of Fund resources would
decrease slightly to 88.9 percent from 89.1 percent currently.
Potential credit exposure to Poland would be about 1.2 times the Fund’s current
precautionary balances.
5 The freed up NAB resources cannot be used to finance new commitments unless NAB participants and the
Executive Board were to approve an increase in the maximum resources available during the current activation
period. Such an increase is not being proposed at this time. However, the resources would be available to finance
new commitments if the NAB is activated in the future NAB activation period.
6 If Poland were to draw upon the proposed arrangement, there would be an additional impact on the FCC as Poland
would no longer participate in the Financial Transactions Plan and the NAB Resource Mobilization Plan.

REPUBLIC OF POLAND
INTERNATIONAL MONETARY FUND 7
Table 3. Republic of Poland—Impact on GRA Finances
(millions of SDR unless otherwise noted)
ASSESSMENT
8. The proposed FCL arrangement would have a significant but manageable impact on
the Fund’s liquidity position. At close to SDR 239 billion, the FCC appears sufficiently strong to
accommodate the proposed arrangement, especially since the cancellation of Poland’ existing FCL
arrangement would partially offset the liquidity effect from the proposed new FCL arrangement with
Liquidity measures
Forward Commitment Capacity (FCC) before approval 1/ 238,595
FCC on approval 2/ 228,595
Change in percent -4.2
Prudential measures
Fund GRA commitment to Poland including credit outstanding
in percent of current precautionary balances 121.1
in percent of total GRA credit outstanding 3/ 19.9
Fund GRA credit outstanding to top five borrowers
in percent of total GRA credit outstanding 3/ 89.1
in percent of total GRA credit outstanding including Poland's assumed full drawing 88.9
Poland's projected annual GRA charges for 2015 in percent of the Fund's residual burden sharing capacity 13,697
Memorandum items
Fund's precautionary balances (FY14) 12,800
Fund's Residual Burden Sharing Capacity 4/ 2.7
Sources: Finance Department and IMF staff estimates.
3/ As of December 01, 2014
4/ Burden-sharing capacity is calculated based on the floor for remuneration at 85 percent of the SDR interest rate. Residual
burden-sharing capacity is equal to the total burden-sharing capacity minus the portion being utilized to offset deferred charges
and takes into account the loss in capacity due to nonpayment of burden sharing adjustments by members in arrears.
as of 12/01/2014
1/ The FCC is defined as the Fund's stock of usable resources less undrawn balances under existing arrangements, plus
projected repurchases during the coming 12 months, less repayments of borrowing due one year forward, less a prudential
balance. The FCC does not include about US$461 billion in bilateral pledges from members to boost IMF resources. These
resources will only be counted towards the FCC once: (i) individual bilateral agreements are effective and (ii) the associated
resources are available for use by the IMF, in accordance with the borrowing guidelines and the terms of these agreements.
2/ Current FCC minus new access plus access under the expiring program adjusted for the NAB financed portion of the expiring
commitment (about SDR 16.5 billion) which was considered as already committed at the time of the most recent NAB activation
and is therefore not available to finance new commitments under the current activation. This amount could be included in possible
future NAB activations.

REPUBLIC OF POLAND
8 INTERNATIONAL MONETARY FUND
a lower access. In addition, the 2012 Borrowing Agreements (which are not included in the FCC) will
provide a second line of defense to the Fund’s lending capacity as they become effective.7
9. Poland intends to treat the FCL arrangement as precautionary, but if drawn, this would
feature prominently among the Fund’s largest single credit exposures. Poland’s overall external
debt and debt service ratios are expected to remain manageable even with a drawing under the
arrangement. In addition, Poland’s capacity to repay is expected to remain strong given its sustained
track record of implementing strong policies, including during the global financial crisis, and sound
institutional policy framework, which provide assurances about the future course of policies.
7 As of [December 4, 2014], 35 agreements have been approved by the Board for a total of SDR [287] billion, of which
33 agreements have become effective for a total of SDR [276] billion.

REPUBLIC OF POLAND
INTERNATIONAL MONETARY FUND 9
Annex I. Poland: History of IMF Arrangements
Prior to the FCL arrangements approved in May 2009, July 2010, January 2011, and in January 2013,
Poland has several Fund arrangements in the 1980s and the 1990s. It fully repaid its remaining
outstanding credit in 1995 (Table I.1). Poland has an exemplary track record of meeting its
obligations to the Fund.
From 1990 to 1995, Poland had three Stand-By Arrangements (SBAs) and one arrangement under
the Extended Fund Facility (EFF).
Annex Table I.1. Poland: IMF Financial Arrangements, 1990–2015
(In SDR millions)
Since the global financial crisis, Poland has had several FCL arrangements under which no drawings
have been made. A one-year FCL arrangement equivalent to SDR 13.69 billion (1,000 percent of
quota) was approved on May 6, 2009 which the authorities treated as precautionary. This
arrangement was succeeded by another FCL arrangement on identical terms which was approved on
July 2, 2010 and a two-year FCL arrangement in the amount of SDR 19.166 billion (1,400 percent of
quota) approved on January 21, 2011. On Jan 18, 2013 a successor FCL in the amount of SDR 22.0
billion (1,303 percent of quota) was approved.
Year
1990 SBA 5-Feb-90 4-Mar-91 545.0 357.5 357.5 0.0 357.5
1991 EFF/CFF 18-Apr-91 8-Mar-93 1,224.0 76.5 239.1 2/ 0.0 596.6
1992 0.0 0.0 596.6
1993 SBA 8-Mar-93 8-Apr-94 476.0 357.0 0.0 98.9 497.7
1994 SBA 5-Aug-94 4-Mar-96 333.3 283.3 640.3 219.4 918.6
1995 0.0 918.6 0.0
…
2009 FCL 6-May-2009 05-May-2010 13,690.0 0.0 0.0 0.0 0.0
2010 FCL 2-Jul-2010 20-Jan-2011 13,690.0 0.0 0.0 0.0 0.0
2011 FCL 21-Jan-2011 17-Jan-2013 19,166.0 0.0 0.0 0.0 0.0
2013 FCL 18-Jan-2013 17-Jan-2015 22,000.0 0.0 0.0 0.0 0.0
Source: Finance Department.
1/ As of November 11th, 2014
2/ Includes a purchase of SDR 162.6 million under the Compensatory Financing Facility.
Purchases
Fund Exposure
1/
Amount
Drawn
Type of
Arrangement
Date of
Arrangement
Date of
Expiration or
Canellation
Amount of New
Arrangement Repurchases
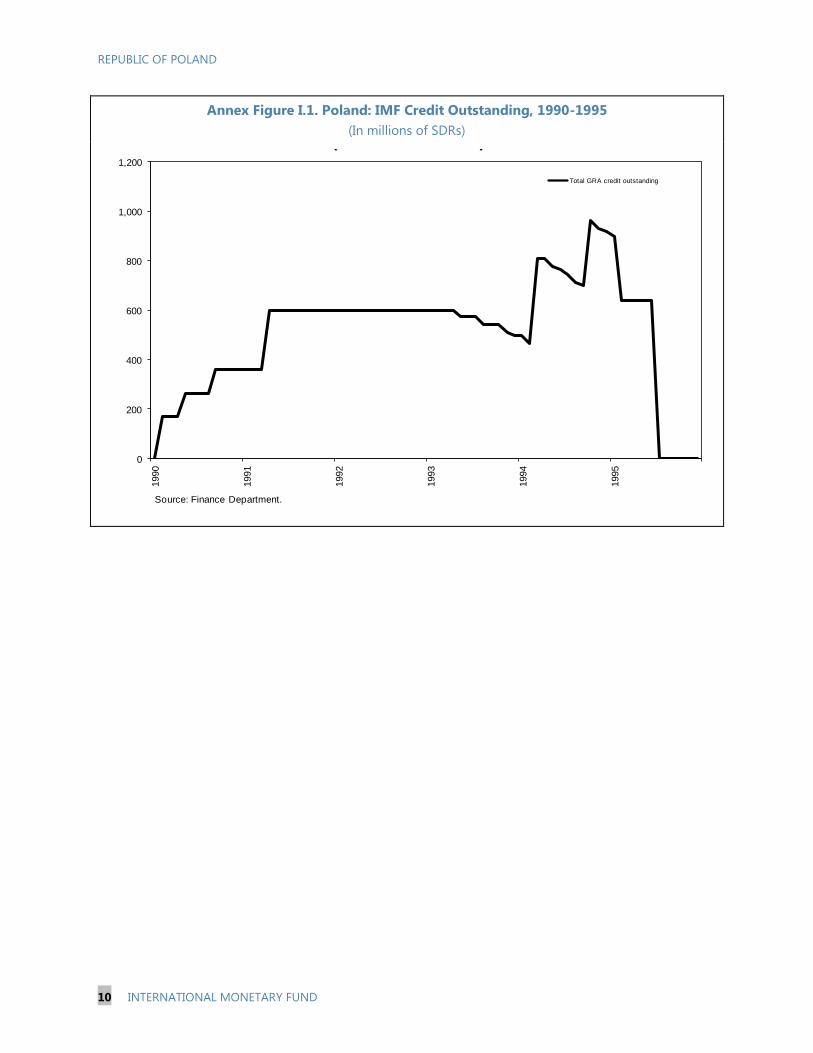
REPUBLIC OF POLAND
10 INTERNATIONAL MONETARY FUND
Annex Figure I.1. Poland: IMF Credit Outstanding, 1990-1995
(In millions of SDRs)
0
200
400
600
800
1,000
1,2001990
1991
1992
1993
1994
1995
Total GRA credit outstanding
Source: Finance Department.
Annex Figure I.1. Poland: IMF Credit Outstanding, 1990-1995
(In millions of SDRs)

Press Release No. 15/05
FOR IMMEDIATE RELEASE
January 14, 2015
IMF Executive Board Approves New Two-Year US$23 Billion Flexible Credit Line
Arrangement for the Republic of Poland
The Executive Board of the International Monetary Fund (IMF) today approved a successor
two-year arrangement for the Republic of Poland under the Flexible Credit Line (FCL) with
reduced access in an amount equivalent to SDR 15.5 billion (about US$23 billion, or
918 percent of quota). The Polish authorities intend to treat the arrangement as precautionary
and do not intend to draw on the FCL.
The Republic of Poland’s first FCL arrangement was approved on May 6, 2009 (see Press
Release No. 09/153). Successor arrangements were approved on July 2, 2010 (see Press
Release No. 10/276); January 21, 2011 (see Press Release No. 11/15); and January 18, 2013
(see Press Release No. 13/17).
Following the Executive Board discussion of the Republic of Poland, Mr. Min Zhu, Deputy
Managing Director and Acting Chairman of the Board, made the following statement:
“Poland has very strong economic fundamentals and policy frameworks. The fiscal position
is sound and public debt is sustainable. Its credible inflation targeting regime is an effective
tool for macroeconomic management. The flexible exchange rate has played a stabilizing
role, acting as a shock-absorber during periods of volatility in global financial markets. The
banking system is liquid, well capitalized, and profitable, bolstered by an effective financial
supervision.
The authorities have continued to rebuild policy space and further strengthen policy
frameworks. Gradual fiscal consolidation has continued and a permanent expenditure rule,
implemented in 2013, is expected to help safeguard long-term fiscal soundness. International
reserves have increased and are broadly adequate against standard benchmarks. In the
banking system, reliance on cross-border parent bank funding has declined and foreign
currency mortgage origination was halted with the tightening of prudential rules.
International Monetary Fund
Washington, D.C. 20431 USA

2
External risks have abated somewhat but remain elevated. A protracted period of slower
growth in the euro area could have large effects on Poland via trade and confidence channels.
An abrupt surge in volatility in global financial markets, or a severe deterioration in external
financing conditions could affect Poland’s economy given its relatively high external
financing needs. Persistent geopolitical tensions in the region add to downside risks.
Against this background, a successor two-year FCL arrangement with lower access, which
the authorities intend to continue to treat as precautionary, reinforces Poland’s buffers against
external risks, helps sustain market confidence, and supports the authorities’ sound economic
strategy. In addition, the lower access sends a clear signal of the authorities’ intention to exit
from the FCL arrangement once external risks recede.”
The FCL was established on March 24, 2009 and further enhanced on August 30, 2010 (see
Press Release No. 10/321). The FCL is available to countries with very strong fundamentals,
policies, and track records of policy implementation and is particularly useful for crisis
prevention purposes. FCL arrangements are approved for countries meeting pre-set
qualification criteria (see Press Release No. 09/85). The FCL is a renewable credit line,
which could be approved for either one or two years. Two-year arrangements involve a
review of eligibility after the first year. If the country draws on the credit line, the repayment
period is between three and five years. There is no cap on access to Fund resources under the
FCL, and access is determined on a case-by-case basis. Qualified countries have the full
amount available up-front, with no ongoing conditions. There is flexibility to either draw on
the credit line at the time it is approved, or treat it as precautionary.
The Republic of Poland is a member of the IMF since 1986 and has a quota of SDR 1,688.40
million (about US$2,485.51 million).

Statement by Dominik Radziwill, Alternate Executive Director for
the Republic of Poland, and Joanna Osinska, Advisor for the Executive Director
January 14, 2015
During a prolonged period of heightened external risks dating back to the global financial
crisis, the consecutive arrangements under the IMF’s Flexible Credit Line (FCL) have
served the Polish economy very well. Alongside solid fundamentals and prudent policies,
the FCL provided additional insurance against adverse external shocks. It helped foster
Poland’s macroeconomic performance and financial stability, and supported market
confidence. The Polish economy successfully withstood several bouts of global financial
volatility.
Meanwhile, Poland has been further building up its buffers. This has been accompanied
by an evolution of risks in the external environment of the Polish economy. These risks
continue to remain elevated. Our Polish authorities believe that continued additional
insurance provided by the FCL remains important to support their economic policies and
help sustain market confidence. The authorities wish to request a renewal of the FCL
arrangement for another two years, with a reduced level of access. They continue to
believe that exit from a precautionary arrangement should be state- rather than time-
dependent. Thus, decisions regarding exit should be based on the assessment of the
probability of tail risks, given the existing buffers. These considerations are reflected in
their current request.
Buffers
Poland has made important progress in rebuilding its policy space. Macroeconomic
imbalances have been substantially reduced and fundamentals further strengthened.
Access to the FCL provided a temporary “breathing space” and helped support policy
adjustment.
Economic growth has picked up pace. After a significant slowdown in 2012–13, the
Polish economy returned to higher growth pace last year. Strong investments and
rebound in private consumption led to an acceleration in domestic demand. The
authorities expect the official forecast of 3.3 percent GDP growth in 2014 to
materialize.
Fiscal policy space has been gradually regained. Both, fiscal deficit and public debt
have been substantially reduced. The fiscal deficit was reduced from 7.6 percent of
GDP in 2010 to 4.0 percent in 2013 (ESA2010) and is currently well on track to allow
for the exit from the EU’s Excessive Deficit Procedure as scheduled. Public debt at
the end of 2014 is expected to have fallen to roughly 50 percent of GDP. A permanent
expenditure rule has been introduced to enhance long-term fiscal sustainability.
External imbalances have narrowed. The current account (CA) balance
substantially improved, from -6.5 in 2008 to around -1.3 percent of GDP in 2013
(BMP6), reaching its lowest level in over a decade. While exports to non-EU partners
had generally been steadily increasing in recent years, a significant decline in trade
has been registered in the context of the recent Russia-Ukraine tensions. Nevertheless,

for 2014, the authorities expect the CA to narrow further. In addition, the capital
account continues to register a surplus, primarily due to the strong inflow of the EU
structural funds.
International reserves have increased. Reserves continue to be broadly adequate
according to standard metrics. They increased from around USD 80 billion at end-
2009 to around USD 100 billion at end-2014.
Monetary policy has continued to support economic stability. In late-2012 and
2013 the Monetary Policy Council (MPC) cut main policy interest rate by a
cumulative 225 basis points (bps) and further by 50 bps in October 2014 to a new
historic low of 2 percent. In the opinion of the MPC, this adjustment and stable
economic growth limit the risk of inflation remaining below the target in the medium
term. However, given the uncertainty regarding the economic conditions in the
external environment of the Polish economy, the MPC does not rule out further
adjustments.
Efforts have continued to maintain a strong financial sector. The banking sector
remains well-capitalized, liquid, and profitable. It continues to be supported by a
strong regulatory and supervisory framework. The reliance on parent bank funding
has declined alongside the reduction in FX loans outstanding.
Steady progress on the structural front has continued. Various measures have
been implemented over the last years. In the latest World Bank’s Doing Business
2015 report, Poland was ranked 32nd
—the highest in history.
Looking forward, the Polish authorities are determined to maintain very strong
institutional policy frameworks and prudent policies. The government favours a balanced
approach to macroeconomic management, effectively combining conservative fiscal
policies with economic growth considerations.
Risks
As an open economy, Poland has benefited from integration with global markets, but at
the same time remains highly exposed to potential external shocks. Its open capital
account and relatively high financing needs make it susceptible to potential sudden shifts
in investor sentiment.
In the authorities’ view, while some of the external risks have receded since the last FCL
request, new concerns have emerged. On balance, risks continue to remain elevated.
The authorities recognize the growing risks stemming from geopolitical tensions
surrounding Russia and Ukraine.
They are also of the view that a potential surge in financial market volatility, linked to
uncertainties related to the eventual normalization of U.S. monetary policy, may pose
a risk of a general abrupt shift in market sentiment toward emerging market assets.
This would affect Poland, especially given the Polish zloty’s role as a proxy for the
Central and Eastern European region.

Finally, protracted slow growth in Poland’s main trading partners could affect its
economy through trade linkages and the confidence channel.
In light of these concerns, the authorities believe that a successor precautionary FCL
would continue to be instrumental in mitigating external risks in case of a tail event. They
are of the view that additional insurance provided by the FCL remains important to help
sustain market confidence and support their economic policies aimed at further
strengthening the buffers.
With all these aspects considered, a successor two-year FCL arrangement at a lower level
of access would provide sufficient insurance against adverse external shocks, while
sending a strong signal of Poland’s commitment to exit the facility as soon as external
conditions allow. At the same time, while the strengthened buffers allow for a reduction
in the level of access, a full exit from the facility would be premature at this stage.
Exit
Poland’s intention to gradually reduce its reliance on the facility has been signaled on
previous occasions. To ensure a smooth and orderly process, the authorities have
proactively initiated extensive communication undertakings on their exit strategy, through
direct outreach to investors and the general public, including press interviews by top
Ministry of Finance officials. The outreach has been favorably received by investors and
other stakeholders, as a proof of strength of the economy reinforcing the trust that Poland
is well prepared to begin gradual exit from the arrangement.
Conclusion
Given the strengthened buffers and considering the balance of risks, our Polish authorities
are requesting the approval of a successor 24-month FCL arrangement in a reduced
amount equivalent to SDR 15.5 billion (918 percent of quota). Simultaneously, they wish
to cancel the current arrangement approved on January 18, 2013, effective upon the
approval of the new FCL.
The authorities are committed to continue strengthening policy buffers and make further
progress towards exit from the facility, taking into account the evolution of the external
conditions. They reiterate their intention to treat the arrangement as precautionary.