Embed Size (px)
Citation preview
©2013 International Monetary Fund
IMF Country Report No. 13/251
FRANCE 2013 ARTICLE IV CONSULTATION
Under Article IV of the IMF’s Articles of Agreement, the IMF holds bilateral discussions with members, usually every year. In the context of the 2013 Article IV consultation with France the following documents have been released and are included in this package: Staff Report for the 2013 Article IV consultation, prepared by a staff team of the IMF, following discussions that ended on June 3, 2013, with the officials of France on economic developments and policies. Based on information available at the time of these discussions, the staff report was completed on July 12, 2013. The views expressed in the staff report are those of the staff team and do not necessarily reflect the views of the Executive Board of the IMF.
Informational Annex prepared by the IMF.
Public Information Notice (PIN) summarizing the views of the Executive Board as expressed during its July 25, 2012 discussion of the staff report that concluded the Article IV consultation.
Statement by the Executive Director for France (English and French versions are included).
The document listed below has been or will be separately released. Selected Issues Paper
The policy of publication of staff reports and other documents allows for the deletion of market-sensitive information.
Copies of this report are available to the public from
International Monetary Fund Publication Services 700 19th Street, N.W. Washington, D.C. 20431
Telephone: (202) 623-7430 Telefax: (202) 623-7201 E-mail: [email protected] Internet: http://www.imf.org
International Monetary Fund Washington, D.C.
August 2013

FRANCE STAFF REPORT FOR THE 2013 ARTICLE IV CONSULTATION
KEY ISSUES Context and Outlook: On the back of sizeable fiscal consolidation and low confidence, the recovery stalled in 2012. Fiscal consolidation remains very substantial in 2013, and output is projected to contract slightly this year and to grow moderately in 2014. Structural rigidities in labor and product markets, and comparatively low profit shares, have undermined the economy’s growth potential and contributed to loss of export performance. On the positive side, credit conditions remain supportive, and private demand is unencumbered by balance sheet repair issues and so is more apt to respond favorably to an improvement in confidence. Risks: The main risks lie in precarious growth prospects in Europe, a possible resurgence of financial market stress, domestic policy uncertainty, notably in regard to future fiscal policy choices, and a stalling of domestic structural reforms. A failure of growth to recover would make it more difficult to reverse debt dynamics in the short run. Financial stability risks have abated considerably since the last report, as banks have completed their deleveraging objectives and strengthened their capital and liquidity buffers. Low bank profitability remains a risk factor. Policy Recommendations: With much of the required fiscal consolidation expected to be completed by 2013, the pace of adjustment should be eased in 2014 relative to current plans in order to support the recovery. Adjustment should also be rebalanced toward expenditure containment, with a view to improving the quality of adjustment and removing policy uncertainty that weighs on private spending decisions. Credible expenditure containment should be backed by structural fiscal measures: some savings have been identified and the upcoming pension reform will be a key element of the strategy, but there is scope to rationalize public spending on a larger scale. The authorities have given structural reforms an important forward momentum with measures to improve competitiveness (notably a reduction of the labor tax wedge), a broad reform to move the labor market toward greater “flexicurity”, planned improvements in worker training mechanisms and regulatory simplification. The reform momentum will need to be powered up, by deepening labor market reforms and opening product markets to greater competition (notably in services) as an important lever of productivity growth and employment creation. Financial sector policies should aim at consolidating the significant progress achieved in strengthening financial stability and preserving the capacity of banks to provide credit as they adapt to new prudential requirements, notably by better aligning tax incentives on financial products to regulatory objectives.
July 12, 2013
FRANCE
2 INTERNATIONAL MONETARY FUND
Approved By Mahmood Pradhan and Vikram Haksar
Discussions took place in Paris from May 21 to June 3, 2013. The staff team comprised Messrs. Gardner (head), Hallaert, Ms. Pérez-Ruiz, and Ms. Poirson (all EUR). The team was supported from headquarters by Ms. Susan Becker and Ms. Kelly MacKinnon (both EUR). France Executive Director Mr. de Villeroché and Mr. Cumenge (OED) participated in the discussions. Staff met with Ministers Moscovici (Finance and Economy), Cazeneuve (Budget), Bank of France Governor Noyer, other senior officials, and financial sector, academic, parliament, employers and trade union representatives. The mission held a press conference at the conclusion of the mission.
CONTENTS
RECENT ECONOMIC DEVELOPMENTS AND OUTLOOK ________________________________________ 4
A. A Hesitant Recovery _____________________________________________________________________________4
B. Outlook, Risks and Spillovers __________________________________________________________________ 14
POLICY DISCUSSIONS __________________________________________________________________________ 21
A. Scope for Easing Fiscal Adjustment, but Refocused on Expenditure Containment ____________ 21
B. A Multi-Pronged Structural Reform Strategy to Revive Growth _______________________________ 27
C. Reduced Risks to Financial Stability but a Financial System Under Transformation ___________ 34
STAFF APPRAISAL ______________________________________________________________________________ 38 BOXES 1. Moving to Structural Fiscal Targets: Framework and Challenges ______________________________ 23 2. Labor Market Reform on a Forward Momentum ______________________________________________ 29 FIGURES 1. Demand Components: Crisis and Rebound ______________________________________________________6 2. Inflation Developments __________________________________________________________________________7 3. External Developments in Euro Area Comparison _______________________________________________9 4. Financial Sector Developments ________________________________________________________________ 12 5. Bank Lending to the Non-Financial Private Sector _____________________________________________ 13 6. Short-Term Frequency Indicators, and Savings’ Countercyclical Role __________________________ 15 7. Housing Market Developments ________________________________________________________________ 19 8. Medium-Term Fiscal Adjustment, 2012–17 ____________________________________________________ 24 9. Labor Cost Reducing Measures ________________________________________________________________ 32 10. Household Financial Savings _________________________________________________________________ 35

FRANCE
INTERNATIONAL MONETARY FUND 3
TABLES 1. Selected Economic and Social Indicators, 2010–18 ____________________________________________ 41 2. Balance of Payments, 2011–18 _________________________________________________________________ 42 3a. General Government Statement of Operations, 2008–18 _____________________________________ 43 3b. General Government Integrated Balance Sheet, 2003–11 ____________________________________ 44 4. Vulnerability Indicators, 2006–12 ______________________________________________________________ 45 5. Daily Movements of Selected Financial Indicators _____________________________________________ 46 6. The Core Set of Financial Soundness Indicators, 2005–12 _____________________________________ 46 7. Encouraged Financial Soundness Indicators, 2005–12 _________________________________________ 47 APPENDICES I. Main Recommendations of the 2012 Article IV Consultation and Authorities’ Response ______ 48 II. Overview of Main Structural Reforms __________________________________________________________ 49 III. FSAP Update: Status of Main Recommendations _____________________________________________ 56 IV. Debt Sustainability Analysis ___________________________________________________________________ 59 APPENDIX TABLE 1. Public Sector Debt Sustainability, 2008–18 ____________________________________________________ 63

FRANCE
4 INTERNATIONAL MONETARY FUND
RECENT ECONOMIC DEVELOPMENTS AND OUTLOOK
A. A Hesitant Recovery
1. Following an initial recovery in 2010–11, the economy flat lined in 2012, and registered two quarters of negative growth in 2012Q4 and 2013Q1. While the French economy weathered the crisis relatively well compared to peers, its subsequent performance has proven fairly muted, reflecting the sizeable fiscal consolidation undertaken since 2010 and a failure of confidence to recover. Output remains below pre-crisis levels, with an estimated output gap of -1.8 percent in 2012.
2. Private consumption, the main driver of growth in the pre-crisis period, recovered strongly in 2010 but has since lost steam owing to faltering income growth. In the face of weak employment growth and rising taxes, household real disposable income contracted by nearly 1 percent in 2012. Its impact on consumption was offset only in part by a decline in the household saving rate. In 2012 investment also stalled because of low business confidence related to domestic policy uncertainty and the weak outlook. Since mid 2012, policy uncertainty has been on the rise in France, in contrast to the European trend. Only exports and government consumption contributed positively to growth (Figure 1).
Policy Uncertainty and Economic Outcomes
0
50
100
150
200
250
2008
2009
2010
2011
2012
2013
France Europe
Economic Policy Uncertainty(Index; historical average = 100)
Sources: Policy Uncertainty Index: Baker, Bloom and Davis: Policy Uncertainty.com
Economic policy uncertainty has remained elevated recently...
-0.8
-0.7
-0.6
-0.5
-0.4
-0.3
-0.2
-0.1
0
Private consumption
Residential construction
Business investment
1997-2006 2007-2012
France - Correlations between Uncertainty and Sources of Growth (In percent)
Sources: WEO; Policy Uncertainty Index: Baker, Bloom and Davis: Policy Uncertainty.com; and Staff estimates.
90
92
94
96
98
100
102
104
Mar-08 Sep-08 Mar-09 Sep-09 Mar-10 Sep-10 Mar-11 Sep-11 Mar-12 Sep-12 Mar-13
FranceEuro areaGermanyItaly Spain
Real GDP(2008Q1=100)
Sources: Haver; Staff calculations.

FRANCE
INTERNATIONAL MONETARY FUND 5
3. After considerable stickiness, inflation has declined at a rapid pace since August 2012 in response to the slack in the economy (Figure 2). Downward pressure on core inflation reflected in part lower telecommunication prices linked to the entry of a fourth mobile telecommunication operator. Despite disinflation pressures and the steady rise in unemployment, wage growth has remained remarkably stable, at around 2 percent year-on-year in 2012. The low sensitivity of wages to labor market conditions, captured by a relatively flat Phillips Curve, results in part from the indexation of the minimum wage, which acts as a reference for wage agreements.
4. Strong fiscal adjustment in 2012 resulted in a structural budget improvement of 1.1 percent of GDP, which came on top of a similar effort in 2011. However, because of a widening cyclical component, the 2012 deficit declined by only ½ a percent of GDP relative to 2011. At 4.8 percent of GDP, the 2012 fiscal deficit exceeded the level projected in the last staff report by 0.3 percent of GDP owing to lower-than-projected growth and exceptional factors (including recapitalization of Dexia).
5. With a view to closing the gap relative to the EC’s Excessive Deficit Procedure (EDP), the pace of adjustment was accelerated further under the 2013 budget, with a targeted structural adjustment of 1.8 percent of GDP. Tax measures are expected to contribute 1.4 percentage points of this adjustment, with the rest coming from a reduction of structural spending in relation to GDP. In all, the rapid fiscal consolidation of 2011–13 has relied heavily on revenue measures, with a projected increase in the tax-to-GDP ratio of 3.7 percentage points over 3 years. Over the same period, expenditure growth was also reduced considerably (to an annual real growth averaging 0.6 against trend growth estimated at 1.5 percent), but the ratio of structural spending to potential GDP has declined by only 0.3 percentage points.
40
50
60
70
80
90
100
2000 2001 2002 2003 2004 2005 2006 2007 2008 2009 2010 2011 2012 2013 proj.
Revenue
Tax revenue
Expenditures
Gross debt
France: Main Fiscal Indicators(2000-2013, in percent of GDP)
Sources: INSEE and IMF Staff projections.

FRANCE
6 INTERNATIONAL MONETARY FUND
Figure 1. Demand Components: Crisis and Rebound(Contributions to GDP growth)
Source: WEO; and Staff Calculations.
-1
-0.5
0
0.5
1
1.5
Average 2000-2008
2009 2010 2011 2012
Germany
France
Euro Area
Private Consumption(Percentage points)
-1
-0.5
0
0.5
1
1.5
Average 2000-2008
2009 2010 2011 2012
Germany
France
Euro Area
Government Consumption(Percentage points)
-3
-2.5
-2
-1.5
-1
-0.5
0
0.5
1
1.5
Average 2000-2008
2009 2010 2011 2012
Germany
France
Euro Area
Gross Fixed Capital Formation(Percentage points)
-8
-6
-4
-2
0
2
4
6
8
Average 2000-2008
2009 2010 2011 2012
Germany
France
Euro Area
Exports(Percentage points)

FRANCE
INTERNATIONAL MONETARY FUND 7
Figure 2. France: Inflation Developments
Source: INSEE, Haver Analytics, and Staff calculations,
70
72
74
76
78
80
82
84
86
88
90
-1
-0.5
0
0.5
1
1.5
2
2.5
3
3.5
4
Jan:
07Ju
n:07
Nov
:07
A pr:0
8Se
p:08
Feb:
09Ju
l:09
Dec
:09
Ma y
:10
Oct
:10
Mar
:11
Aug:
11Ja
n:12
Jun:
12N
ov:1
2A p
r:13
CPI headline
CPI core
Capacity utilization (Y-axis) 1/
France - CPI Inflation and Capacity Utilization(2007Q1-2013Q1, yoy percentage change, SA data)
1/ In percent
95
100
105
110
115
120
Mar
:200
6
Sep:
2006
Mar
:200
7
Sep:
2007
Mar
:200
8
Sep:
2008
Mar
:200
9
Sep:
2009
Mar
:201
0
Sep:
2010
Mar
:201
1
Sep:
2011
Mar
:201
2
Sep:
2012
Mar
:201
3
Core CPI
Average Wage 1/
Minimum Wage
Unit Labor Costs
Core CPI, Nominal Wages, and Unit Labor Costs (2006Q1=100)
1/ Compensation p.er employee, whole economy
-4
-3
-2
-1
0
1
2
3
1981 1984 1987 1990 1993 1996 1999 2002 2005 2008 2011
Output gap
Real compensation per employee 1/
Wage Stickiness - Wages and the Output Gap
1/ Nominal compensation per employee over GDP deflator, y-o-y percentage change.
1
1.5
2
2.5
3
3.5
4
7 8 9 10 11
Com
pens
atio
n pe
r em
ploy
ee, y
-o-y
per
cent
age c
hang
e
Unemployment rate, percent, lagged two quarters
Wage stickeness - The flattening of the Phillips Curve(1999Q1-2013Q1)
Trend line on 1999Q1-2013Q1 data
Trend line on2008Q1-2013Q1 data

FRANCE
8 INTERNATIONAL MONETARY FUND
6. The external position appears to be moderately weak compared to medium-term fundamentals. Following a trend deterioration, the current account deficit widened further in 2012 (to 2.2 percent of GDP). This was driven by a drop in net investment income, while the trade deficit improved slightly, owing to strong sales in aeronautics and a relatively weak cyclical position.1 From a medium-term perspective, the steady worsening of the current account since the late 1990s reflects a broad-based erosion of the net trade in goods, only partly offset, recently, by a rising surplus in services. The IMF External Balance Assessment suggests medium-sized gaps relative to the current account and real exchange rate “norms,” in the order of 1-3 and 0-5 percent, respectively.2 While external imbalances do not represent an immediate cause of concern, France’s competitiveness gap constrains its export and growth potential. The large deterioration of France’s Net International Investment Position (NIIP) since 2007 (from near balance to around -22.5 percent of GDP) could also affect external sustainability over the medium term. About 55 percent of this deterioration is due to valuation losses, which could be reversed in a stronger global recovery.
7. The declining exports performance is reflected in a steady loss of market shares, both globally and relative to peers. This trend deterioration is confirmed by a number of related indicators: (i) sizeable declines in the share of manufacturing production and employment; (ii) a deterioration of cost competitiveness, with wages outpacing productivity growth since the early 2000s, and unit labor cost levels standing above Germany since the mid-2000s, and more recently losing ground to the euro area periphery countries; (iii) a low and narrowing of profit shares in value added.
1 See accompanying Selected Issues Paper, “External Sector Developments and Competitiveness”. 2 The gap relative to the NFA stabilizing current account is found to be negligible. The CGER approach yields somewhat different current account and real exchange rate gaps compared with EBA: the current account gap is estimated at +1.4 percent of GDP (rather than -2.5 percent under EBA); and real exchange rate overvaluation is estimated at 4 percent (rather than 1 percent under EBA).
Source: IMF Balance of Payments; and Staff calculations.
-6
-4
-2
0
2
4
6
2000 2002 2004 2006 2008 2010 2012Net exports of services Current transfers balance
Net exports of goods Income balance
Current account balance
France - Current Account by Components(In percent of GDP)
-60
-40
-20
0
20
40
60
2000 2002 2004 2006 2008 2010 2012Portfolio investment (net) Reserve assets
Other investment (net) Direct investment abroad (net)
Financial derivatives (net) Net international investment position
France - NIIP by Components(In percent of GDP)

FRANCE
INTERNATIONAL MONETARY FUND 9
Figure 3. France: External Developments in Euro Area Comparison
Source: Haver Analytics, IMF (DOTS), AMECO, ECB statistical warehouse, BACH database; and Staff calculations
60
70
80
90
100
110
120
2000 2001 2002 2003 2004 2005 2006 2007 2008 2009 2010 2011 2012
France, Euro area MSGermany, Euro area MSFrance, world MSGermany, world MS
France and Germany - Market Shares (MS)(2000=100)
80
85
90
95
100
105
110
115
120
Jan-02 May-03 Sep-04 Jan-06 May-07 Sep-08 Jan-10 May-11 Sep-12
FranceGermany
France and Germany - Industrial Production (2010=100)
0.4
0.45
0.5
0.55
0.6
0.65
0.7
2000 2001 2002 2003 2004 2005 2006 2007 2008 2009 2010 2011 2012
Germany Spain France Italy
Selected Euro Area Countries - Unit Labor Costs(Compensation per employee over apparent labor productivity)
-1
-0.5
0
0.5
1
1.5
2
2.5
3
Germany France Germany France
Capital per employed person TFP
Apparent labor productivity Nominal wages
France and Germany - Nominal Wages and Productivity(Annual average growth rates)
Annual av. 2000-07 Annual av. 2008-12
0.2
0.25
0.3
0.35
0.4
0.45
2001 2002 2003 2004 2005 2006 2007 2008 2009 2010 2011
Germany Spain
Italy France
Selected Euro Area Countries - Profit Share in Value Added (In percent)
80
85
90
95
100
105
110
2000 2001 2002 2003 2004 2005 2006 2007 2008 2009 2010 2011 2012
France, ULC-based REER
France, exports deflator-based REER
Germany, ULC-based REER
Germany, exports deflator-based REER
France and Germany - Real Effective Exchange Rates(Index numbers, 2005=100; comparator group is euro area)

FRANCE
10 INTERNATIONAL MONETARY FUND
8. Financial stability risks have abated considerably, but banks’ profitability is relatively low and they remain exposed to wholesale funding. Banks achieved their deleveraging objectives in 2012, and are well positioned to meet Basel III capital requirements (Figure 4). In the twelve months ending in 2012Q3, the four largest banks reduced assets by 2.4 percent and risk-weighted assets (RWA) by 7.2 percent through disposal of legacy assets, non-core assets (such as trade and project finance), and subsidiaries in periphery countries. Combined with capital increases (through retained earnings), these actions led to a 1.5 percentage points average improvement in their core Tier 1 ratios.3 Liquidity risk has diminished by lessening reliance on US dollar and short-term wholesale funding and building up liquidity reserves, including borrowing from the European Central Bank (ECB).4 Liquidity buffers of French banks covered 137 percent of short-term wholesale funding at end-March 2013 and asset encumbrance remains low (ranging from 20 to 60 percent).
However, while two of the largest banks already meet the target of 100 percent coverage, the Basel III liquidity coverage ratio (LCR) for the system as a whole still falls short of regulatory requirements and funding profiles are more vulnerable than those of peers. Continued access to stable sources—even under difficult market conditions—including private placements, retail sales, and covered bonds is a mitigating factor. Banks completed between 50 and 67 percent of their planned issuance programs by April 2013.
3 The leverage ratio decreased by 3 points from 2011Q3 to 2012Q3. About two-thirds of the decrease in leverage is ratio reflected in a capital increase and one third in a decrease in assets. 4 Liquidity reserves comprise central bank deposits and central-bank eligible unencumbered assets. Use of the ECB’s Long Term Refinancing Operations (LTRO) has decreased by 42 percent since its end-2012 peak to around €101 billion as banks have started repaying loans. Deposits at the ECB peaked at €139 billion in mid-2012 and have since decreased to €39 billion.
0
20
40
60
80
100
120
DLR
Kre
dit
Dex
iaBR
Fkre
dit A
/SN
ykre
dit R
lkre
dit
Port
igon
Hel
aba
Dan
ske
Bank
SocG
enN
ORD
LBD
euts
che
Bank
BNP
Parib
asH
ande
lsba
nken
UBS
Nor
dea
Läns
förs
äkrin
gar
Créd
it Ag
ricol
eSw
edba
nkCr
edit
Suis
se SEB
DN
BG
roup
e BP
CEIn
tesa
Banc
o Po
pola
reBM
PS RBS
Com
mer
zban
kU
BISy
dban
kJy
ske
BkLl
oyds
Ban
king
Grp
Uni
cred
itBB
VASp
areB
anke
n Ve
stSa
ntan
der
Raiff
eise
nKB
CSp
areB
ank
1 SM
NBa
nco
Popu
lar
Saba
dell
VTB
Bank
ABN
AM
RO G
roup
NV
Akba
nkSR
-Ban
kN
omos
-Ban
kG
aran
tiIs
bank
HSB
CIN
GYa
pi K
redi
Erst
e Ba
nkCG
DVa
kifb
ank
Gaz
prom
bank
Prom
svya
zban
kBk
Sai
nt-P
eter
sbur
Hal
kban
kSb
erba
nkZi
raat
PKO
Ban
k Po
lski
SA
Wholesale funds Peer EU 1/ France
Wholesale Funding Ratios, 2012(Percent of total liabilities)
Sources: SNL Financial; and IMF staff calculations.1/ Average of a group of peers in Europe sharing the same business profile.
French banks
FRANCE
INTERNATIONAL MONETARY FUND 11
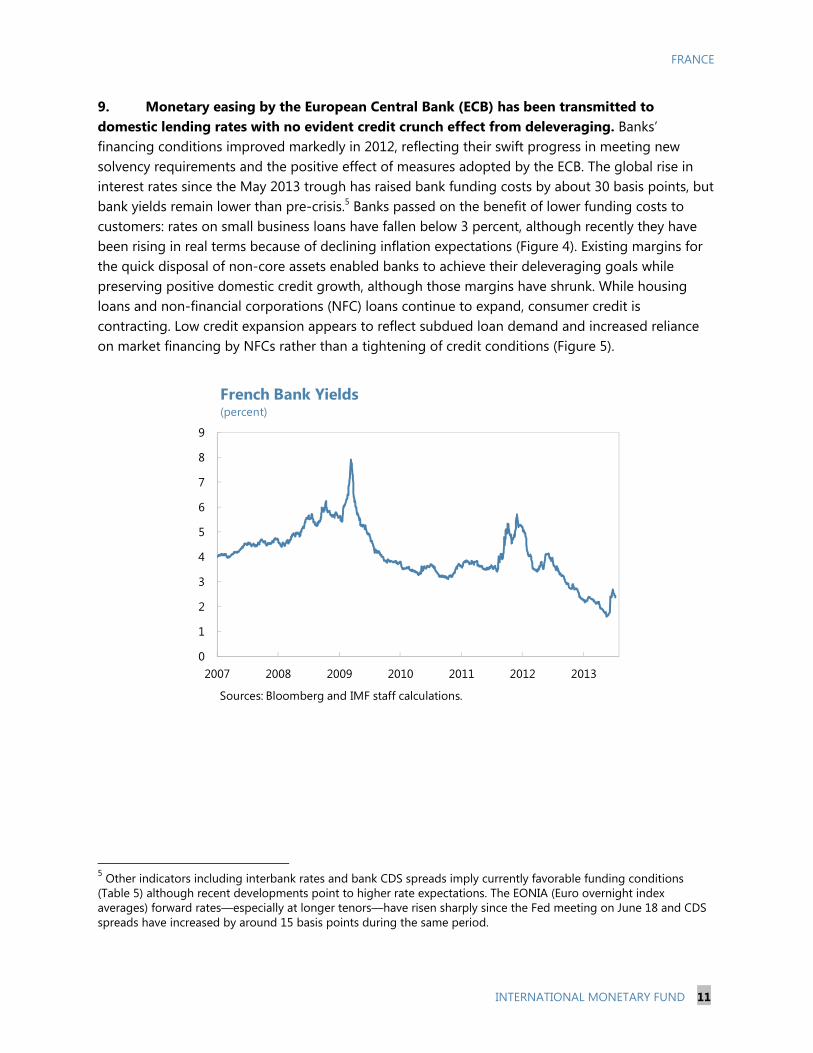
9. Monetary easing by the European Central Bank (ECB) has been transmitted to domestic lending rates with no evident credit crunch effect from deleveraging. Banks’ financing conditions improved markedly in 2012, reflecting their swift progress in meeting new solvency requirements and the positive effect of measures adopted by the ECB. The global rise in interest rates since the May 2013 trough has raised bank funding costs by about 30 basis points, but bank yields remain lower than pre-crisis.5 Banks passed on the benefit of lower funding costs to customers: rates on small business loans have fallen below 3 percent, although recently they have been rising in real terms because of declining inflation expectations (Figure 4). Existing margins for the quick disposal of non-core assets enabled banks to achieve their deleveraging goals while preserving positive domestic credit growth, although those margins have shrunk. While housing loans and non-financial corporations (NFC) loans continue to expand, consumer credit is contracting. Low credit expansion appears to reflect subdued loan demand and increased reliance on market financing by NFCs rather than a tightening of credit conditions (Figure 5).
5 Other indicators including interbank rates and bank CDS spreads imply currently favorable funding conditions (Table 5) although recent developments point to higher rate expectations. The EONIA (Euro overnight index averages) forward rates—especially at longer tenors—have risen sharply since the Fed meeting on June 18 and CDS spreads have increased by around 15 basis points during the same period.
0
1
2
3
4
5
6
7
8
9
2007 2008 2009 2010 2011 2012 2013
French Bank Yields(percent)
Sources: Bloomberg and IMF staff calculations.

FRANCE
12 INTERNATIONAL MONETARY FUND
Figure 4. Financial Sector Developments The banks have deleveraged without engendering a
credit crunch….
….and continued to strengthen their balance sheets.
Liquidity risk has abated in part reflecting the use of ECB
facilities….
….and banks have raised their share of stable funding in
total liabilities.
Lending rates on small business loans have fallen below
3 percent…
….and there is no evidence of fragmentation issues.
-8 -6 -4 -2 0 2 4 6
DEU
UK
FRA
ITA
ESP
Domestic loansForeign loansSecuritiesOther assetsTotal
Sources: Bank financial statements; SNL Financial; and IMF staff estimates (April 2013 Global Financial Stability Report).Note: Based on consolidated data for a sample of large banks headquartered in each country. Excludes cash, derivatives, and intangible assets. Domestic loans exclude mergers.
Large EU Banks: Contributions to Change in Balance Sheets (2011:Q3-2012:Q3, In percent)
2.0
2.5
3.0
3.5
4.0
4.5
35 40 45 50 55Tang
ible
com
mon
equ
ity t
o ta
ngib
le a
sset
s (P
erce
nt)
French Banks: Tangible Common Equity to Tangible Assets(Percent)
Reliance on wholesale funding (Percent of total funding)
June 2012
June 2010
December 2008
Source: ECB CBD - Statistics on Consolidated Banking Data.
0
100000
200000
300000
400000
500000
600000
700000
May-11 Aug-11 Nov-11 Feb-12 May-12 Aug-12 Nov-12 Feb-13 May-13
France
Finland, Germany, and LuxembourgItaly and Spain
Greece, Ireland, and Portugal
Use of ECB Long-Term Refinancing Operations (NSA, Mil.EUR)
Source: Banque de France/Haver Analytics.
0%10%20%30%40%50%60%70%80%90%
100%
Dec-07 Jun-08 Dec-08 Jun-09 Dec-09 Jun-10 Dec-10 Jun-11 Dec-11 Jun-12 Dec-12
Medium and Long-Term Wholesale and Interbank Funding (more than 3 months)
Short-Term Wholesale and Interbank Funding (less than 3 months)
Customer Deposits
Funding Structure of the Five Largest Banks (Percent)
Source: SGACP.
0
1
2
3
4
5
6
7
Jan:11 Apr:11 Jul:11 Oct:11 Jan:12 Apr:12 Jul:12 Oct:12 Jan:13 Apr:13
Nominal Rate Real Rate 1/
Sources: Haver and Consensus Forecasts.1/ Deflated using CPI consensus forecasts for the current year.
France: Lending Rates on New Business Loans up to One Million Euros (in percent)
-1.2
-1
-0.8
-0.6
-0.4
-0.2
0
0.2
0.4
0.6
Jan:11 Apr:11 Jul:11 Oct:11 Jan:12 Apr:12 Jul:12 Oct:12 Jan:13 Apr:13
Real Interest Rate Differential 1/Nominal Lending Rate Differential
France: Interest Rate Differential relative to Germany on New Business Loans up to One Million Euros (in percent)
Sources: Haver Analytics; Consensus Forecasts; and staff calculations.1/ Nominal rates deflated using CPI consensus forecasts.

FRANCE
INTERNATIONAL MONETARY FUND 13
Figure 5. France: Bank Lending to the Non-Financial Private Sector
-5
0
5
10
15
20
May-07 May-08 May-09 May-10 May-11 May-12 May-13
Corporate loans
Consumer credit
Housing loans
Corporate and Household Loans(Year-on-year percent change)
Sources: Haver Analytics; ECB; and IMF staff calculations.
-40
-20
0
20
40
60
80
100
20032004200520062007200820092010201120122013
Corporate criteriaCriteria for house purchase
Lending Standards(Changes in criteria for allocation of credits 1/)
Source: Global Insight. 1/ Criteria above (below) zero indicates expected tightening (loosening) of lending standards compared to previous 3 months.
-150
-100
-50
0
50
100
150
20032004200520062007200820092010201120122013
Corporate demand
Demand for house purchase
Lending Demand (Balance of Opinion)
Source: Global Insight.

FRANCE
14 INTERNATIONAL MONETARY FUND
B. Outlook, Risks and Spillovers
10. Supported by a recent improvement in leading indicators, the recovery is projected to unfold gradually in the second half of 2013. Given the impact of fiscal consolidation and low confidence, real GDP would still contract by 0.2 percent this year, but then grow by 0.8 percent in 2014, under the added stimulus of improved external conditions and supportive monetary policy. The projected decline in the households’ saving rate (to 15.2 percent in 2013 from 15.6 percent in 2012) should help stabilize consumption in the face of a further fall in disposable income. The decline of the saving rate is predicated on an improvement in confidence, but also reflects the fact that tax increases have fallen mostly on higher income households who have a higher capacity to adjust their saving rate to smooth consumption (Figure 6).
-1.5
-1
-0.5
0
0.5
1
1.5
2
2.5
3
2012 2013 2014 Av.2015-18
ImportsExportsStockbuildingResidential construction&business investmentGovernment consumption and investmentPrivate consumptionGross domestic product
GDP Contributions by Demand Components(In percentage points)
Sources: Haver Analytics and IMF staff calculations.

FRANCE
INTERNATIONAL MONETARY FUND 15
11. Private demand is unencumbered by balance sheet repair issues and can thus respond relatively quickly to an improvement in confidence and profit shares. The financial situation of households and enterprises remains relatively healthy (in an aggregate sense) as measured by debt ratios. Given relatively low profit shares, enterprises are more dependent on external financing than enterprises in Germany, for instance, but should be able to mobilize required financing in an upturn.
Figure 6: France: High-Frequency Indicators, and Savings’ Countercyclical Role
HouseholdsDebt, Income and Savings
Source: Haver Analytics; and Staff calculations.
0
20
40
60
80
100
120
140
SWE
ITA
BEL
AU
SFR
AD
EUG
RC ESP
PRT
IRL
UK
NLD
Consolidated Households Debt, 2011(In percent)
-4-3-2-10123456
2000
2001
2002
2003
2004
2005
2006
2007
2008
2009
2010
2011
2012
2013
2014
CPI inflation HDI, nominalHDI, real
Households Disposable Income (HDI) (Annual percent change)
10
12
14
16
18
20
-2
-1
0
1
2
3
4
5
2000 2002 2004 2006 2008 2010 2012 2014
HDI, realConsumption, real Saving rate (% of HDI)
Households Savings Rate(Annual percent change unless otherwise stated)
Sources: Haver Analytics and OECD.
98
98.5
99
99.5
100
100.5
101
101.5
102
Apr-
11
Jul-1
1
Oct
-11
Jan-
12
Apr-
12
Jul-1
2
Oct
-12
Jan-
13FranceUSEuro areaBig 4 Eurozone countries
Composite Leading Indicator
30
40
50
60
70
Jan:
11
Apr:1
1
Jul:1
1
Oct
:11
Jan:
12
A pr:1
2
Jul:1
2
Oct
:12
Jan:
13
A pr:1
3
France
Euro Area
PMI: Composite Output(SA, 50+=Expansion)
70
75
80
85
90
95
100
105
110
Jan:
11
Apr:1
1
Jul:1
1
Oct
:11
Jan:
12
A pr:1
2
Jul:1
2
Oct
:12
Jan:
13
A pr:1
3
Euro area France
Industrial Production, Construction(2010=100)

FRANCE
16 INTERNATIONAL MONETARY FUND
12. Low capacity utilization should continue to hold inflation down. The muted increase of the minimum wage this year (0.3 percent in January 2013) and labor market slack should weigh on wage growth. Downward pressures on inflation will be partly offset by the anticipated increase in VAT in 2014 (to finance part of the reduction of the labor tax wedge). In all, headline inflation should ease to around 1½ percent in 2013–14, down from 2 percent in 2012.
13. The authorities’ Stability Program projects a more vibrant recovery and higher growth over the medium term. This reflects stronger contributions from private consumption and exports, which in turn would trigger a faster recovery of investment. The authorities’ scenario is based on the expectation of a faster pick up of employment in 2013, under the impulse of recent labor market measures (reduction of the labor tax wedge and expansion of employment subsidies), which would in turn help sustain consumption. Staff took a more conservative approach on the short-term impact of these measures, but also considered that the drag from fiscal consolidation would remain substantial.
14. The main external risks to the outlook (and related inward spillovers) stem from the precarious growth prospects and from inadequate progress toward a crisis resolution framework in the euro area (see Risk Assessment Matrix). A protracted period of slower growth in Europe would spill over to France through the trade and investment channels, and complicate the pursuit of fiscal consolidation6. By contrast, growth spillover analysis suggests that French output co-moves less with global output 6 By way of example, the GRAM shock simulation of a protracted period of slower European growth carried out by RES would result in a growth shortfall for France, averaging -1.75 percentage points over 2014-18. Owing to the debt overhang on firms’ balance sheets, this scenario entails a 3 percent and 5 percent decline in euro area private investment (relative to baseline) in 2013 and 2014, respectively. Lower than expected growth outcomes prevent the anticipated fiscal improvement, pushing up sovereign risk premium and triggering further tightening in fiscal stances. The magnitudes of the jumps in sovereign risk premium would be proportional to the country’s level of debt and dependence on foreign funding.
Real GDP by Expenditures: Staff and Authorities' Projections
2012 2013 2014 2013 2014
Gross domestic product 0.0 -0.2 0.8 0.1 1.2
Total domestic demand -0.9 -0.5 0.7 -0.2 1.0Private consumption -0.3 -0.1 0.7 0.2 0.9Government consumption 1.4 1.0 0.3 1.2 0.6Gross Fixed Investment -1.2 -2.2 1.8 -0.8 1.2Stockbuilding 1/ -0.8 -0.2 0.0 -0.4 0.1
Foreign balance 1/ 1.0 0.3 0.1 0.3 0.2Exports of GNFS 2.5 1.4 3.1 2.0 4.5Imports of GNFS -0.9 0.2 2.7 0.8 3.5Source: France Stability Program 2013-17 and staff projections.1/ Contributions to GDP growth.
IMF Authorities
-15
-10
-5
0
5
10
15
2000 2001 2002 2003 2004 2005 2006 2007 2008 2009 2010 2011 2012
ExportsBusiness investmentEuro area growth (excluding France)
France - Exports, Business Investment, and Euro Area Growth (Annual growth rates)
Sources: WEO.
Slower Euro area growth could weaken growth through lower investment and exports

FRANCE
INTERNATIONAL MONETARY FUND 17
shocks than output of Italy, Belgium, Netherlands, or Germany, for instance.7 Reemergence of financial stress could impact French sovereign yields and disrupt funding markets even if France has enjoyed a relatively safe have status. However, exposures of banks have declined relative to the banking spillover analysis carried out for the last Staff Report.8 Higher funding costs and larger-than-expected provisions against Italian or Spanish exposures could, in turn, undermine banks’ earnings. Notwithstanding wholesale funding exposures, banks have ample collateral to access ECB financing.
15. By virtue of their size and interconnectedness, French banks could have potentially large outward spillover effects. There is no evidence that deleveraging by French banks has so far created adverse effects on other regions, as banks with stronger balance sheets often stepped in to fill the gap. However, adverse spillovers could occur if French banks were forced into an accelerated retrenchment from corporate and investment banking, from retail operations in Italy and Spain, and from their derivatives business. Staff analysis suggests that financial spillovers to and from French SIFIs are likely to affect mostly other European SIFIs in the U.K., Belgium, the Southern periphery, and U.S. banks.9
16. The main domestic risk is a stalled recovery of private demand. The forecast supposes that the household saving ratio will continue to decline this and next year. However, uncertainty over tax and transfer policies during the remaining consolidation period—and lagged effects from previously implemented austerity—could further delay spending decisions. The recovery could also be held back if structural reforms are inadequately ambitious. A growth failure in France would have significant outward spillovers to its neighbors, particularly small open economies in the euro area, and smaller but still measurable impacts on Italy and Spain.10
7 See “Growth and Fiscal Spillovers of France,” by K. Cheng and S. Weber, in France: Selected Issues, IMF Country Report No. 13/3 (January 2013). 8 See “France: Financial Spillovers,” by C. Geiregat, in France: Selected Issues, IMF Country Report No. 13/3 (January 2013). 9 See “Risk Exposures and Financial Spillovers in Tranquil and Crisis Times: Bank-Level Evidence,” by H. Poirson and J. Schmittmann, IMF Working Paper No. 13/142. 10 See “Growth and Fiscal Spillovers of France,” by K. Cheng and S. Weber, in France: Selected Issues, IMF Country Report No. 13/3 (January 2013).

FRANCE
18 INTERNATIONAL MONETARY FUND
17. Risks related to a correction in housing prices are less prominent. Model-based estimates of price misalignment typically range from 10 to 20 percent.11 This said, even after the surge of the last decade, house prices (in nominal terms) do not appear to be out of line with those of other European countries (bottom two panels of Figure 7). Still, prices have been declining: housing activity has slowed markedly and prices have fallen by 1.9 percent in 2013 Q1 from their peak in 2011 Q3 (Figure 7). In the absence of a large confidence shock, the housing valuation gap is expected to close through a very gradual price correction reflecting favorable demographics, a structural undersupply, and low household indebtedness. The macroeconomic impact of such a price correction is expected to be limited given weak wealth effects, reflecting the absence of home equity loans and limited use of real estate as collateral, generally. The impact on banks should be similarly contained owing to underwriting criteria that emphasize debt servicing capacity rather than collateral value.12 13 A more abrupt correction in house prices may lead to further compression in banks’ profit margins.
11 See FSAP Update, France: Housing Prices and Financial Stability, Technical Note, June 2013. 12 See France: Financial System Stability Assessment, IMF Country Report No. 12/341, December 2012. 13 Sensitivity stress tests carried out during the 2012 FSAP Update of a decline in property prices of 25 percent did not show a significant impact on bank capital ratios.
BelgiumFinland
France
Germany
Greece
Ireland
Italy
Netherlands
Spain
-35-30-25-20-15-10
-505
1015
-60 -50 -40 -30 -20 -10 0
Chan
ge in
hou
se p
rice
grow
th
Change in consumer confidence
House Price Growth and Consumer Confidence, 2000Q1-2012Q3
Sources: Haver Analytics; Organisation for Economic Cooperation and Development; and IMF staff calculations.

FRANCE
INTERNATIONAL MONETARY FUND 19
Figure 7. France: Housing Market Developments
-15
-10
-5
0
5
10
15
20
Mar
-99
Mar
-00
Mar
-01
Mar
-02
Mar
-03
Mar
-04
Mar
-05
Mar
-06
Mar
-07
Mar
-08
Mar
-09
Mar
-10
Mar
-11
Mar
-12
Mar
-13
Nominal house price index
Real house price index
Nominal and Real House Price Growth(y-o-y, in percent)
Sources: Haver Analytics; and staff calculations.
-25-20-15-10-505
10152025303540
Jan-06 Jan-07 Jan-08 Jan-09 Jan-10 Jan-11 Jan-12 Jan-13
Total housing starts (cumul over 12 months)Housing sales (cumul over 12 months)
Housing Activity and Demand(y-o-y percent change)
Sources: Haver Analytics; CGEDD.; and staff calculations.
0
1
2
3
4
5
6
7
Feb-
05Ju
n-05
Oct
-05
Feb-
06Ju
n-06
Oct
-06
Feb-
07Ju
n-07
Oct
-07
Feb-
08Ju
n-08
Oct
-08
Feb-
09Ju
n-09
Oct
-09
Feb-
10Ju
n-10
Oct
-10
Feb-
11Ju
n-11
Oct
-11
Feb-
12Ju
n-12
Oct
-12
Feb-
13Ju
n-13
MFI interest rates on new loans for house purchasesBenchmark 10-year yield
Relative Loan Profitability(iIn percent)
Sources: Banque de France and Global Insight.
30
60
90
120
150
180
Jun-05 Jun-06 Jun-07 Jun-08 Jun-09 Jun-10 Jun-11 Jun-12
FRA DEU ITA
ESP UK AUS
Source: Haver Analytics.
Household Debt (Percent of disposable income)
0 100 200 300 400 500 600 700
PRTITAFINUK
USAIRL
ESPBEL
DNKSWENLDDEUFRALUXCHE
Sources: KBC Bank, Economagic.com, and IMF staff calculations.
Average Sales Price of Existing Properties, 2011(In thousands of euros)
0
100
200
300
400
1996 1998 2000 2002 2004 2006 2008 2010 2012
FRA DEU NLD
ITA ESP IRL
UK AUS SWE
Sources: Global Insight, Haver Analytics, and staff calculations.
Selected Countries - Real House Prices(1996 = 100)

FRANCE
20 INTERNATIONAL MONETARY FUND
FRANCE: RISK ASSESSMENT MATRIX14 Source of Risk Relative Likelihood Impact if Realized
Continuing euro area sovereign debt problems and possible re-emergence of financial stress (triggered by stalled or incomplete delivery of national or euro area commitments)
Medium Growth contagion from shocks to peripheral countries Increased financial segmentation due to uncertainty over euro area viability Accelerated bank deleveraging aggravating crisis
High Adverse effects through the trade channel, notably from Spain and Italy. Fiscal consolidation objectives would become more challenging Higher interest rates owing to euro viability concerns may affect French yields Limited losses for French SIFIs from exposure to the periphery Policy response: euro area monetary policy remains first line of defense.
Protracted period of slower European growth
High Slowing demand from European partners Additional measures needed to achieve medium-term fiscal targets Lower potential growth from higher structural unemployment
High Impact from trade links within the EU But likely mitigated by lower interest rates and automatic stabilizers Fiscal consolidation objectives would become more challenging Policy response: fiscal policy response coordinated at European level to support demand where fiscal space is available
Stalled recovery of private domestic demand
Medium Private consumption and investment decisions restrained further by ongoing fiscal consolidation and policy uncertainty
High Stagnation of domestic demand would complicate fiscal consolidation objectives and cause outward slipover effects Policy response: provide greater clarity of consolidation measures over the medium term and accelerate structural reforms.
Closure of wholesale funding to French banks or significant increase in costs (triggered for instance by distortions from unconventional monetary policy.
Low-Medium ECB support has eased funding conditions and availability of eligible assets seems adequate so far
Medium French SIFIs structurally dependent on wholesale funding. Significant refinancing needs in 2014 and 2015, but also ample collateral to access the ECB. Policy response: liquidity support from the ECB, coupled with capital preservation measures on banks if necessary.
Adverse market or rating reaction to adverse growth of fiscal developments
Low-Medium Market reaction to an overshooting of the deficit target likely to be muted, but failure to contain spending could undermine confidence and stability in the medium term
Medium Higher sovereign yields would complicate fiscal adjustment. Policy response: provide clarity on measures to meet medium-term fiscal targets.
Housing price correction Medium Housing prices supported by strong fundamentals but empirical estimates suggest 10-20 percent overvaluation
Low Limited impact on banks due to sound lending standards, but possibly larger impact in the event of a sudden correction due to a concomitant shock to confidence and employment Policy response: support gradual price correction by loosening supply constraints.
14 The Risk Assessment Matrix (RAM) shows events that could materially alter the baseline path (the scenario most likely to materialize in the view of IMF staff). The relative likelihood of risks listed is the staff’s subjective assessment of the risks surrounding the baseline. The RAM reflects staff views on the source of risks and overall level of concern at the time of discussions with the authorities.

FRANCE
INTERNATIONAL MONETARY FUND 21
18. Market concerns about fiscal sustainability appear to have diminished. While headline deficit targets have been missed in the face of a stagnating economy, the strong record of structural adjustment has lent credibility to the authorities’ medium-term commitments. Sovereign yields have increased by nearly 60 basis points since May trough; interest rate assumption underlying the baseline projections had incorporporated an increase of about this magnitude. In any event, with an average maturity of 7 years, sovereign debt dynamics are not very responsive to changes in interest rates, except in the case of a very extreme shock such as the one illustrated in the Debt Sustainability Analysis (Appendix IV).
POLICY DISCUSSIONS 19. Staff Diagnostic: In the face of a trend decline in total factor productivity (TFP) growth since the 1990s, real wage growth in France has been sustained at the expense of the share of income going to profits. This shift in the distribution of value added has helped support consumption, but has also undermined, over time, the capacity of enterprises to innovate and remain competitive in international markets. Meanwhile, the extensive social insurance and redistribution system, which has contributed to the economy’s resilience to shocks, has also become more difficult to sustain since the income base from which it is financed lost buoyancy. The related pressures to correct a long standing structural fiscal imbalance have so far been met by increasing the tax burden, with a risk of undermining potential growth.
A. Scope for Easing Fiscal Adjustment, but Refocused on Expenditure Containment
20. Faced with lower-than-expected growth in 2013, the authorities decided not to take additional measures in pursuit of the nominal deficit target, but to allow automatic stabilizers to work in full. Even so, the degree of adjustment (1.8 percent of GDP in structural terms) remains large, and staff considered that less front-loading would have been preferable on cyclical grounds. The authorities explained that fiscal policy decisions for 2013 had been constrained by European commitments and the need to solidify market confidence. The deficit is projected to decline from 4.8 percent of GDP in 2012 to 3.9 percent in 2013.
21. Under the Stability Program of April 2013, structural adjustment would remain substantial in 2014, with a proposed 70 percent contribution from expenditure containment and 30 percent from revenue measures. Adjustment would moderate thereafter until a small structural surplus is reached in 2016. The Stability Program is built on more optimistic growth assumptions than those of staff. Differences in estimated potential GDP and output gaps result in differences in measured structural fiscal adjustment for the same underlying fiscal effort. These differences are illustrated in Figure 8. Thus, whereas the Stability Program (blue line in Figure 8) estimates structural fiscal adjustment to be 1 percent of GDP in 2014, the same underlying effort produces a structural adjustment of 0.8 when using the staff’s macroeconomic framework (green line in Figure 8). Similarly, based on the staff’s macroeconomic assumptions, the structural fiscal

FRANCE
22 INTERNATIONAL MONETARY FUND
balance would still be in a deficit of about 0.3 percent of potential GDP in 2016, compared to a 0.2 percent surplus in the authorities’ scenario.
22. The authorities confirmed that they would henceforth by guided by structural deficit targets (Box 1). They welcomed the role played by the Fund in swaying the policy debate in this direction, and underscored that structural deficit targets would not only avoid procyclicality but also make policy making more predictable. They also stressed the need to maintain potential growth assumptions unchanged over the policy horizon in order to provide a stable framework for measuring the fiscal effort. Staff agreed that the metric by which adjustment is measured should be stable. However, as Figure 8 illustrates, the use of optimistic potential growth assumptions implies that the medium-term target may not be reached in the intended time frame. As stressed in the previous consultation, staff suggested that prudent growth assumptions would be preferable since the implications of an upward revision to potential GDP (e.g., the opening of additional fiscal space) are much easier to handle than the opposite.15 In its commentary on the Stability Program, the newly created Fiscal Council also urged the use of less optimistic macroeconomic assumptions in policy planning.
15 See accompanying Selected Issues Paper, “Potential GDP Estimates for France: Prudent (and Calling for Action).”

FRANCE
INTERNATIONAL MONETARY FUND 23
Box 1. Moving to Structural Fiscal Targets: Framework and Challenges
The October 2012 “organic law” aligning French laws to the requirement of the European Treaty on Stability, Coordination, and Governance stipulates that the multi-year fiscal laws (Lois de Programmation des Finances Publiques, LPFP) define annual structural deficit targets (in euros) over a five-year policy horizon. The LPFP covering 2013–2017, which was adopted in December 2012, is the first LPFP to meet these criteria and thus sets the annual targets against which performance will be measured until 2017. The Stability Programs submitted to the European Commission in April can modify the projections but the structural targets have to remain consistent with the LPFP.
Annual budget laws have to be consistent with the trajectory set in the LPFP. The fiscal council (Haut Conseil des Finances Publiques, HCPF) established by the organic law has to provide an independent opinion on the macroeconomic assumption underlying draft budgets and their consistency with the LPFP targets. The HCPF also verifies ex-post execution of the budget and issues an alert if the fiscal outturn deviates from the medium-term trajectory by more than 0.5 percent of GDP in one year or cumulatively over two subsequent years. The Government then has to implement corrective measures.
In order to monitor performance under this framework, structural targets should ideally only reflect policy choices and not revisions of potential GDP.1 For this reason, the authorities and the HCFP have decided to monitor future fiscal performance based on the potential GDP as estimated in the last LPFP, regardless of future revisions to potential GDP.
Even for a given level of potential GDP, revisions in national accounts can affect the measurement of structural fiscal deficits. For instance, the recent upward revision of the 2011 GDP (and associated revision of the output gap) mechanically increased the 2012 structural deficit by 0.3 points. Following this revision, no corrective measures have been recommended for 2012, but it will be up to the HCFP to advise whether this deviation, together with the 2013 fiscal outturn, calls for a correction.
1 For example, between the April 2012 Stability Program and the April 2013 Stability Program, the structural deficit for 2011 was revised from 3.7 percent to 4.9 percent of potential GDP owing to a change in the estimated potential GDP.

FRANCE
24 INTERNATIONAL MONETARY FUND
Figure 8. France: Medium-Term Fiscal Adjustment, 2012–17
1/ In percent of potential GDP.
2/ Same revenue-to-GDP ratio and real expenditure growth as in the stability program.
3/ Based on the Inspection Générale des Finances (2012) estimates of real expenditure trend growth of 1.5 percent per year during 2014–17.
Assumes a revenue-to-GDP ratio at the stability program level, IMF macroeconomic framework, and no fiscal multiplier effect.
Sources: French authorities and IMF staff.
23. Staff recommended easing somewhat the pace of fiscal consolidation in 2014 relative to the Stability Plan in order to support the uncertain recovery. The structural adjustment expected to be completed over 2011-13 (4 percentage points of GDP) covers 2/3 of the estimated cumulative effort needed to reach the medium-term structural balance objective. Given this track record, and in order not to undermine the fragile recovery, staff recommended retaining only the expenditure containment part (i.e., 70 percent) of the adjustment proposed for 2014 under the Stability Program (red line in Figure 8). This would deliver structural adjustment of 0.5 percent of GDP in 2014. The foregone adjustment in 2014 (0.3 percent of GDP) is relatively small and would be recovered by maintaining a steady pace of structural adjustment over a longer period of time than envisaged under the Stability Program (Figure 8).
87
88
89
90
91
92
93
94
95
96
97
98
2012 2013 2014 2015 2016 2017
Debt-to-GDP Ratio
Stability Program 2013
IMF recommended scenario
Stability Program with IMF macroeconomic projections 2/
No expenditure containment 3/

FRANCE
INTERNATIONAL MONETARY FUND 25
24. Staff stressed that the move to structural deficit targeting should also be the occasion for anchoring medium-term adjustment to an explicit expenditure norm while stabilizing the tax burden. As noted above, tax measures have raised the tax burden to 46 percent of GDP, one of the highest levels in Europe. The perceived risk that taxation will rise further appears to be one of the factors holding back spending by households and enterprises. Staff emphasized the importance of targeting more explicitly expenditure growth at the general government level to strengthen fiscal credibility and improve the growth potential. Staff noted that the pace of public expenditure growth implied by the Stability Program for 2014-15 (0.4 percent in real terms in 2014 and 0.2 percent in 2015) was appropriate. Combined with a stabilization of the revenue-to-GDP ratio at its 2013 level, this expenditure path would result in a deficit of around 3½ percent of GDP in 2014 and under 3 percent in 2015, consistent with the recent proposed recommendations of the European Commission. Real expenditure growth could then be capped at around 0.3 percent a year until the structural budget balance objective is reached in 2017, i.e., one year later than envisaged by the authorities. The debt-to-GDP ratio would peak in 2014 at 95 percent of GDP. Because of the sensitivity of the debt path to growth
2011 2012 2013 2014 2015 2016 2017
Stability Program (April 2011) 2.0 2.3 2.5 2.5
Stability Program (April 2012) 1.7 0.7 1.8 2.0 2.0 2.0
Budget 2013 (October 2012) 1.7 0.3 0.8 2.0 2.0 2.0 2.0
Stability Program (April 2013) 1.7 0.0 0.1 1.2 2.0 2.0 2.0
IMF 2.0 0.0 -0.2 0.8 1.5 1.7 1.8
Stability Program (April 2011) -5.7 -4.6 -3.0 -2.0
Stability Program (April 2012) -5.2 -4.4 -3.0 -2.0 -1.0 0.0
Budget 2013 (October 2012) -5.2 -4.5 -3.0 -2.2 -1.3 -0.6 -0.3
Stability Program (April 2013) -5.2 -4.8 -3.7 -2.9 -2.0 -1.2 -0.7
IMF -5.3 -4.8 -3.9 -3.5 -2.8 -1.9 -1.0
Stability Program (April 2011) -3.8 -2.9 -1.6 -0.9
Stability Program (April 2012) -3.7 -2.6 -1.2 -0.4 0.4 1.2
Budget 2013 (October 2012) -4.8 -3.6 -1.6 -1.1 -0.5 0.0 0.0
Stability Program (April 2013) -4.9 -3.7 -2.0 -1.0 -0.2 0.2 0.5
IMF -4.6 -3.5 -1.7 -1.2 -0.8 -0.4 0.0
Note: IMF data for 2011 includes the impact of national accounts revision, see Box 1 for details.
Macroeconomic assumptions
Real GDP Growth
Fiscal Deficit
Structural Fiscal Deficit
88.2
91.488.7
65
70
75
80
85
90
95
100
2008 2009 2010 2011 2012 2013 2014 2015 2016 2017 2018
Authorities' projections
IMF baseline
Debt-to-GDP ratio(Percent)
Sources: French authorities and IMF staff.
FRANCE
26 INTERNATIONAL MONETARY FUND
outcomes (Appendix IV), stronger expenditure containment might become necessary over the medium term.
25. The authorities confirmed that the adjustment effort would be rebalanced toward expenditure containment starting in 2014, but that revenue measures may still be necessary. They noted that reducing tax expenditures could be an efficient adjustment instrument, even though it would raise the tax-to-GDP ratio, as in the case of the recently announced reduction in the family tax allowance. Furthermore, reducing tax expenditures was, in many cases, akin to reducing transfers in terms of its economic impact. At the same time, the authorities have stated that they would stabilize tax incentives pertaining to enterprises in order to reduce tax uncertainty.
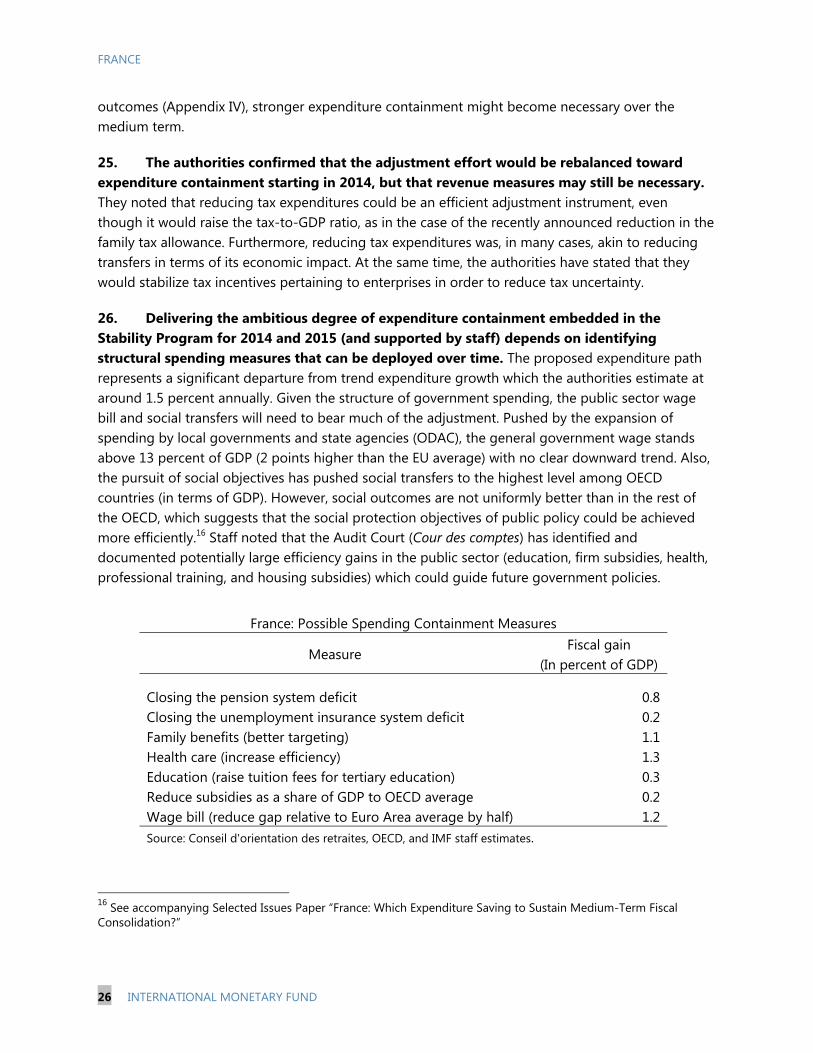
26. Delivering the ambitious degree of expenditure containment embedded in the Stability Program for 2014 and 2015 (and supported by staff) depends on identifying structural spending measures that can be deployed over time. The proposed expenditure path represents a significant departure from trend expenditure growth which the authorities estimate at around 1.5 percent annually. Given the structure of government spending, the public sector wage bill and social transfers will need to bear much of the adjustment. Pushed by the expansion of spending by local governments and state agencies (ODAC), the general government wage stands above 13 percent of GDP (2 points higher than the EU average) with no clear downward trend. Also, the pursuit of social objectives has pushed social transfers to the highest level among OECD countries (in terms of GDP). However, social outcomes are not uniformly better than in the rest of the OECD, which suggests that the social protection objectives of public policy could be achieved more efficiently.16 Staff noted that the Audit Court (Cour des comptes) has identified and documented potentially large efficiency gains in the public sector (education, firm subsidies, health, professional training, and housing subsidies) which could guide future government policies.
16 See accompanying Selected Issues Paper “France: Which Expenditure Saving to Sustain Medium-Term Fiscal Consolidation?”
France: Possible Spending Containment Measures
Measure Fiscal gain
(In percent of GDP)
Closing the pension system deficit 0.8Closing the unemployment insurance system deficit 0.2Family benefits (better targeting) 1.1Health care (increase efficiency) 1.3Education (raise tuition fees for tertiary education) 0.3Reduce subsidies as a share of GDP to OECD average 0.2Wage bill (reduce gap relative to Euro Area average by half) 1.2Source: Conseil d'orientation des retraites, OECD, and IMF staff estimates.

FRANCE
INTERNATIONAL MONETARY FUND 27
27. The authorities underlined that a number of reforms in progress would sustain expenditure containment. They noted that expenditure norms were already in effect at the central government level and for health spending. Ongoing cuts in transfers to local governments would reduce their resources by 0.2 percent of GDP by 2015. The inter-ministerial committee charged with rationalizing public policies (Modernisation de l’ action publique, i.e., MAP) would be the main instrument to identify future expenditure measures. The MAP is currently reviewing policies accounting for 20 percent of government spending. The government has also announced its intention to reform the pension and unemployment insurance systems by year end, with a view to closing the deficit of the pension system by 2020 (0.8 percent of GDP).
B. A Multi-Pronged Structural Reform Strategy to Revive Growth
28. The overarching objective of structural policies should be to close the gap between the cost of labor and productivity and to increase activation of underused labor resources. The preferred outcome would be to raise productivity and reduce the non-wage cost of hiring and doing business by removing rigidities in the labor market and obstacles to competition in product markets. To the extent that the wage-productivity gap is too large to be closed by acting on these levers, however, an adjustment in wages may be necessary. There is also scope to generate growth by increasing incentives to seek employment and remain in the labor force.
29. The authorities have undertaken reforms on a broad front to meet these objectives (Appendices III and IV). They shared the mission’s diagnostic that the institutional and regulatory environment in which enterprises operate needs to be more supportive of investment and growth and that direct and implicit costs need to be reduced to restore profits shares. They underscored the actions taken to improve cost competitiveness (reduction of the labor tax wedge) and reduce labor market rigidities (labor market reform), as well as planned reforms to strengthen labor training and simplify regulations. The authorities had not yet decided on an approach to product market reform.

FRANCE
28 INTERNATIONAL MONETARY FUND
Labor market policies and reforms
30. A significant competitiveness boost has been provided by the reduction of the labor tax wedge which is expected to cut labor costs by about 3 percent by 2015.17 The related increase in profit margins should enable enterprises to improve competitiveness through lower prices or through investment. The budgetary cost of the measure (about 1 percent of GDP) will be split evenly between lower expenditure and higher other taxes (VAT and yet-to-be-identified environmental taxes).
31. The broad labor market agreement negotiated by social partners and its transposition into law represent a very significant step toward flexicurity (Box 2). The authorities pointed out that the success of the negotiations opened the door to a more collaborative relation between social partners and thus better labor market outcomes. The government’s decisions to adopt the agreement without any changes gives it added legitimacy. The reform creates flexibility for firms under economic pressure to renegotiate (within certain limits) wages and working hours. It also aims at reducing labor market duality by encouraging a shift from reliance on short-term contracts as the primary labor market shock absorber to a model where regular (open-ended) contracts provide sufficient flexibility to accommodate shocks. The extent to which the flexibility provisions of the law will increase incentives to hire and reduce the duality of the labor market depends in large part on implementation and the effective reduction of judicial uncertainty associated with labor disputes. The authorities emphasized that this reform should be allowed to bear fruit before contemplating additional reforms. Staff noted that the reform goes in the right direction but would need to go further to effectively reduce labor market duality.
17 As explained in IMF Country Report 12/342, the measure was implemented through a tax credit based on the wage bill (Crédit d’impôt pour la compétitivité et l’emploi, CICE), rather than a reduction of social security contributions, although the economic impact is the same.

FRANCE
INTERNATIONAL MONETARY FUND 29
Box 2. Labor Market Reform on a Forward Momentum
The role of social partners. In the face of poor labor market outcomes (e.g., rising structural unemployment and a dysfunctional dual labor market), the new government decided to launch a broad reform in July 2012. To give the reform legitimacy and weight, it tasked social partners to negotiate a deal. The resulting agreement of January 2013 (Accord National Interprofessionnel, or ANI), was signed by a majority of the unions and of employers’ federations, and was transposed into law in May. It is the broadest labor market reform since the 1980s, and the successful negotiation marks a very significant improvement in labor market relations (top right chart below).
The reform. The reform trades off more flexibility in adjusting working conditions at the enterprise level for enhanced security and training opportunities for employees. By reducing the (implicit) cost of labor, the flexibility provisions should increase firms’ incentives to hire. Greater security for workers can be expected to translate into higher and better training (both in the workplace and during job transitions), raising productivity growth.
The flexibility part of the agreement has two main components:
Internal flexibility: To preserve jobs in the face of a downturn, the “agreements on safeguarding jobs” allow companies to negotiate a reduction of working hours and/or wages (no lower than 1.2 times the minimum wage) during a maximum period of two years. Any employee that refuses the agreement can be dismissed under simplified dismissal procedures. Internal mobility within companies under restructuring is facilitated by removing formal redundancy procedures (which prevent the transfer of workers across units).
External flexibility: Both collective and individual dismissals will be eased. Owing to a very complex labor code, long prescription periods, and lengthy judicial processes, France’s job protection system has been particularly cumbersome. There is ample evidence that legal uncertainty over dismissals inhibits hiring by firms, besides acting as a hindrance to competitiveness.1 Following the reform, redundancy plans will be decided by collective agreement and endorsed by the labor ministry within short delays. Although workers will still be able to challenge collective dismissal in court, the prescription period is shortened from 12 to 2 months. On individual dismissals, the agreement facilitates conciliation by setting benchmark compensations for separations, which should help reach settlements and shorten legal procedures.
The security dimension of the agreement expands health and unemployment insurance, provides for more effective training, and discourages the use of fixed-term contracts to reduce labor market duality, all of which should improve economic efficiency.
Expanded health and unemployment insurance: (i) Health insurance. In 2012, social security covered 78 percent of health costs, with a supplemental health insurance being provided by employers to their employees on a voluntary basis. To reduce inequality, complementary health insurance will be extended to 3.5 million additional workers by 2016 at the latest, and financed by an increase in employers’ and employees’ social contributions (equally split); (ii) Unemployment insurance. To improve job search incentives, employees will be allowed to carry their accrued unemployment benefits’ rights to another job or from an unemployment situation to a job (droits rechargeables).
Reduced labor market duality: Some 12 percent of private sector employees work under temporary contracts, but, because of their revolving nature, these contracts account for 85 percent of hiring and have de facto been used by enterprises to adjust the labor force in response to changing demand conditions. To
1. See “Structural Reforms and Export Performance,” by J.J. Hallaert, in France: Selected Issues, IMF Country Report No. 13/3 (January 2013).

FRANCE
30 INTERNATIONAL MONETARY FUND
Box 2. Labor Market Reform on a Forward Momentum (Concluded)
internalize the social costs of overusing these contracts, employers’ unemployment contributions will be increased by 4-7 percent for contracts shorter than 3 months. Permanent contracts will be encouraged by waving the first three months of employers’ contributions to unemployment benefits for new hires under 26 years old.
Better targeted training: Under the current system, social security contributions finance part of training, but the rights to training acquired in one job are not easily transferred to another job or even to unemployment status. The result is that training is poorly targeted, and benefits those already in a permanent job rather than on job seekers. To improve employability, workers will receive a personal “training account” which they will be able to draw from at any point during their career.
Assessment and risks. Overall, the reform is an important step towards increasing flexibility in the labor market. Still, uncertainties remain over its implementation by social partners and the judiciary. The scope for modulating wages and working hours has to be negotiated at the enterprise level; and the extent to which the enhanced flexibility will encourage firms to increase hiring also depends on whether judicial uncertainty is curbed in practice. If flexibility is not increased sufficiently, the objective of reducing labor market duality may be short-circuited by recourse to interim employment contracts, which are not covered by the agreement. For some firms, the financing of the supplemental health insurance may prove costly. And finally, the costs of carrying cumulated unemployment benefit and training rights across jobs are as yet uncertain.
Next steps. The fact that trade unions and employers were able to find a compromise is positive and paves the way for broader reforms. To remove existing distortions and lift employment durably, significant avenues for reform remain in the areas of unemployment benefits, geographical and professional mobility, and further simplification of individual dismissal procedures.
France: Labor Market Indicators
Sources: INSEE; Déclarations Uniques d'Embauche , Ministry of Labor; World Economic Forum, Global Competitiveness Report 2012-13; and Staff calculations.
6
7
8
9
10
11
12
2008
Q1
2008
Q2
2008
Q3
2008
Q4
2009
Q1
2009
Q2
2009
Q3
2009
Q4
2010
Q1
2010
Q2
2010
Q3
2010
Q4
2011
Q1
2011
Q2
2011
Q3
2011
Q4
2012
Q1
2012
Q2
2012
Q3
2012
Q4
2013
Q1
Unemployment rate (In percent of total workforce)
0
1
2
3
4
5
6
7
FRA
GRC ITA
ESP
POL
PRT
AUS
BEL
USA
GBR LU
XFI
ND
EU IRL
JPN
SWE
NLD
AUT
DN
KCH
E
Quality of Cooperation between Social Partners(Index number, 2012) 1/
1/ Index ranging 1 to 7, 7=greatest cooperation. Based on a question posed to 14,000 business leaders (129 in France).
77%
8%
2%1%
12%
Open ended Fixed term Interims Apprentices Self employed
Distribution of Employment by Contract Modality - 2011(In percent of total employment)
0
0.1
0.2
0.3
0.4
0.5
0.6
0.7
0.8
2007 2008 2009 2010 2011 2012
Fixed term, >1 month Fixed term, < 1 month Open ended
Hirings by Contract Modality - 2006-2012(In percent of total hirings)

FRANCE
INTERNATIONAL MONETARY FUND 31
32. The minimum wage remains an obstacle to employment at the lower-skill end of the labor force and for youth, despite substantial reductions in the tax wedge and employment subsidies targeted to these group. Even after such targeted reductions, the cost of unskilled labor compares unfavorably to that of other European countries. Budget constraints limit the potential for reducing the tax wedge any further. The authorities expected substantial job creation from the expansion of subsidy schemes (see Appendix IV). The mission suggested that a temporary freeze of the minimum wage indexation could help bridge the productivity-labor cost wedge. The next index jump will take place in January 2014.
33. Training and activation policies are also critical to improving labor market outcomes. Spending on training comes to about 1.5 percent of GDP, but is broadly recognized to be poorly targeted and ineffective. In addition to creating personal “training accounts” (Box 2), the government has launched a broader reform process aimed at broadening the reach of training programs to those most in need (e.g., the unemployed), and upgrading the quality of the training. While the planned reforms of the pension and the unemployment insurance systems (paragraph 27) are primarily intended to close financial deficits, they should also be seen as instruments to increase employment rates. The 2010 pension reform and phasing out of various early-retirement schemes have already increased the employment rate of older workers, but the gap relative to other countries remains large, as it is for young workers. Thus, staff recommended that these reforms focus on lengthening professional lives and increasing incentives to shorten unemployment spells, rather than increasing contribution rates.
Source: OECD
0
10
20
30
40
50
60
70
80
90
15-19 20-24 25-29 30-34 35-39 40-44 45-49 50-54 55-59 60-64
France
Best performing countries 1/
1/ Australia, Canada, Denmark, Iceland, New Zealand, Norway, the Netherlands, Switzerland, and the UK
Employment Rates by Age Group(Employment in percent of the population age group, average2005-2011)
0
10
20
30
40
50
60
70
80
90
Age 15-24 Age 55-64 Age 55-64
2008
2011
Employment Rage by Age Group, 2011(In percent of the population by age group)

FRANCE
32 INTERNATIONAL MONETARY FUND
Figure 9. France: Labor Cost Reducing Measures
Source: Eurostat
1/ The labor cost levels are based on the latest Labour Cost Survey (2008) and an extrapolation based on the quarterly Labor Cost Index (LCI). Data
covers all the economy except public administration, defense, and compulsory social security.
0
5
10
15
20
25
30
35
40
Germany Spain France Italy
Employers' social contributions and other labour costs paid by employerWages and salaries
Labor Costs per Hour by Components - Selected Euro area Countries(EUR, 2012; total economy) 1/
95
97
99
101
103
105
107
109
2010Q12010Q22010Q32010Q42011Q12011Q22011Q32011Q42012Q12012Q22012Q32012Q4
Germany Spain France Italy
Labor Cost per Hour - Selected Euro Area Countries(Index, 2010Q1=100, total economy) 1/
Labor-Cost Reducing Measures
Measure Entry into forceWage threshold and other
requirementsValidity Labor contract
Rate Lump sum
Generalized reliefs in contributions
General relief of social security contributions for low-paid
workers7/1/2005
26 (28.1) percent if > (<) 20
employees1.6 SMIC
Crédit d'Impôt pour la Compétitivité et l'Emploi 1/1/20134 percent in 2013; 6
percent as of 20142.5 SMIC All
Contrat de génération 3/18/2013 EUR 4,000 per year 3 years Open ended
Unemployment benefit relief (ANI 2/) 7/1/2013 4 percent3 (4) months if > (<) 50
employeesOpen ended
Targeted subsidies
Contrat Unique d'Insertion non Marchands 1/1/2010
Around EUR 1,300 per
month (around 65 percent
of gross wages depending
on total distance to
workplace; additional
relief on social security
Addressed to workers
with social/professional
difficulties
They can take the form of
both open ended and
fixed contracts; in practice
the average duration of
those contracts is 9
months
All, provided working
week is at least 20 hours.
Fixed-term contracts
cannot be less than 6
months
Emplois d'Avenir 11/1/2012
Around EUR 1,500 per
month (around 75 percent
of gross wages; additional
relief on social security
contributions)
Addressed to workers
under 26 years: with no
diploma; or
or very low-skilled and
unemployed for at least 6
months; or
living in deprived urban
areas unemployed for at
least 12 months
3 years
All, provided on a full-
time basis. Fixed-term
contracts cannot be less
than 12 months
Source: France Labor Ministry, DARES
2/ Accord National Interprofessionnel
Amount
-60
-50
-40
-30
-20
-10
0
1,750 2,000 2,250 2,500 2,750 3,000 3,250 3,500 3,750 4,000 4,250 4,500 4,750 5,000
CICEU benefits relief (within first 4 months)Contrat de générationGeneral relief for low-paid workers All measures
France - Labor Cost-Reducing Measures(Percent reduction in gross monthly wages paid by employers, 2013)
Sources: Ministry of Labor, DARES

FRANCE
INTERNATIONAL MONETARY FUND 33
Regulatory and Product Market Reform
34. Staff reemphasized the potential benefits of product market liberalization carried out in conjunction with labor market reforms. It pointed to the productivity gains and employment opportunities that could be created by removing regulatory and administrative obstacles to competition in the services sector (regulated professions, transportation and distribution) and redistributing the associated rents (through lower prices). Non-tradable sectors are characterized by lower competitive pressures, weaker TFP growth and, relatedly, higher ULC increases.18 Because of their high forward linkages to the rest of the economy, inefficiencies in the non-tradable sectors are transmitted to the exposed sectors. Given the imbalance between the powerful vested interests of protected sectors and the diffused benefits of liberalization, staff suggested that a stronger role be given to the competition authority as an advocate of reform, by empowering it to review practices and regulations and guiding the public debate through an enhanced consultative role. This would enable a more ambitious implementation of the EU Services Directive.19
35. The authorities saw the benefits of services liberalization as being too uncertain relative to the adjustment costs. They emphasized the possible backlash against a broad liberalization effort because of possible short-term adverse effects on employment, and indicated that selected and opportunistic initiatives to increase competition would be more effective. They noted that efforts to protect consumers against anti-competitive practices were being strengthened, notably through the introduction of a class action provision in the new consumer law (the first such provision in France).
36. The authorities have announced a “simplification shock” to alleviate the regulatory burden on enterprises. They recognized that the business environment needed to be stabilized and improved. In addition to a commitment to tax stability for enterprises, the “simplification shock” would lighten administrative procedures and shorten response delays (Appendix IV). Indeed, the regulatory and tax systems appear to create important threshold effects in the enterprise sector. 20 For example, a firm becomes subject to more than 30 additional laws and regulations when it exceeds 50 workers. One implication is the much smaller median size of French enterprises compared with German enterprises, which also acts as an impediment to accessing export markets.
37. Given the limited success of policies to promote housing construction and ownership, the authorities have redirected efforts toward addressing supply rigidities. There is increasing recognition that tax incentives and financing advantages that stimulate demand without addressing constraints on the supply side have in fact contributed to raising prices, making housing less
18 A sector breakdown of TFP growth over the pre-crisis period shows that some market services (real estate, professional services, wholesale and retail trade, and transport) were characterized by weak TFP gains, while sectors exposed to deregulation (utilities and information and communication) registered rapid TFP growth. 19 The principles of “necessity, proportionality, and public interest” embedded in the Services Directive have given EU member countries considerable latitude in how strictly to implement the Directive. 20 See accompanying Selected Issues Paper, “French Firms and Globalization.”

FRANCE
34 INTERNATIONAL MONETARY FUND
affordable to most, and benefiting property owners at the expense of taxpayers. Rising real estate prices have been found to worsen inequality and undermine business competitiveness.21 Supply constraints stem from zoning restrictions by local authorities and long and cumbersome procedures on building permits.
C. Reduced Risks to Financial Stability but a Financial System Under Transformation
38. The French financial system still needs to adapt fully to new international regulations on bank liquidity and insurance solvency ratios. Bank credit has played a central role in the financing of the economy. However, because household savings have been channeled (by tax incentives) to life insurance and regulated savings products, banks have in turn relied heavily on wholesale funding to meet demand for credit. Pressure to reduce exposure to wholesale funding is thus creating a broader need to reorganize financial intermediation.
39. Measures to foster more market-intermediated credit would support banks’ adaptation to new liquidity ratio requirements. Banks have started transitioning toward the originate-and-transfer model of credit, although their ability to do so is constrained by narrow interest margins which is compressing loan profitability. This reflects both intense competition and cost rigidities on the funding side (discussed below). Margins on new loans have recently improved and this should gradually improve profitability. The authorities also noted that measures were underway to foster greater securitization of SME credit, with a first issuance planned for October 2013. Combined with a proposed rebalancing of tax incentives on life insurance policies toward long-term riskier assets, these measures should help deepen market financing mechanisms, especially for SMEs (Appendix IV).
40. Continued progress towards new prudential norms would also be supported by removing tax and regulatory incentives that undermine deposit collection by banks. Going forward, domestic credit growth may be constrained if bank deposits cannot adequately compete with products that benefit from tax advantages. The ceiling on regulated savings has been raised by 50 percent (to EUR 22,950 per person) since October 2012. Combined with an attractive yield, this action has resulted in a surge in collection. Regulated savings account for 29 percent of customer deposits and banks retain only 35 percent, on average, of these inflows. The remainder is centralized at the Caisse des Dépôts et Consignations (CDC)22. Staff recommended more flexible sharing arrangements with the CDC and a broader reform of financial savings taxation that levels the playing-field between products of similar risk characteristics (e.g., maturity) in the medium-term.23 21 Égert and Kierzenkowski, (2010) and Ministère de l’économie (2012). 22 The CDC’s is a public institution mandated to finance social housing, but it has also been used to finance local governments in the wake of the collapse of Dexia. 23 The 2013 Berger-Lefèbvre report’s recommendation to shift the tax incentives for life insurance policies toward riskier long-term instruments decreases at the margin their substitutability with bank deposits, but at the cost of creating yet another layer of complexity and fails to level the playing field.
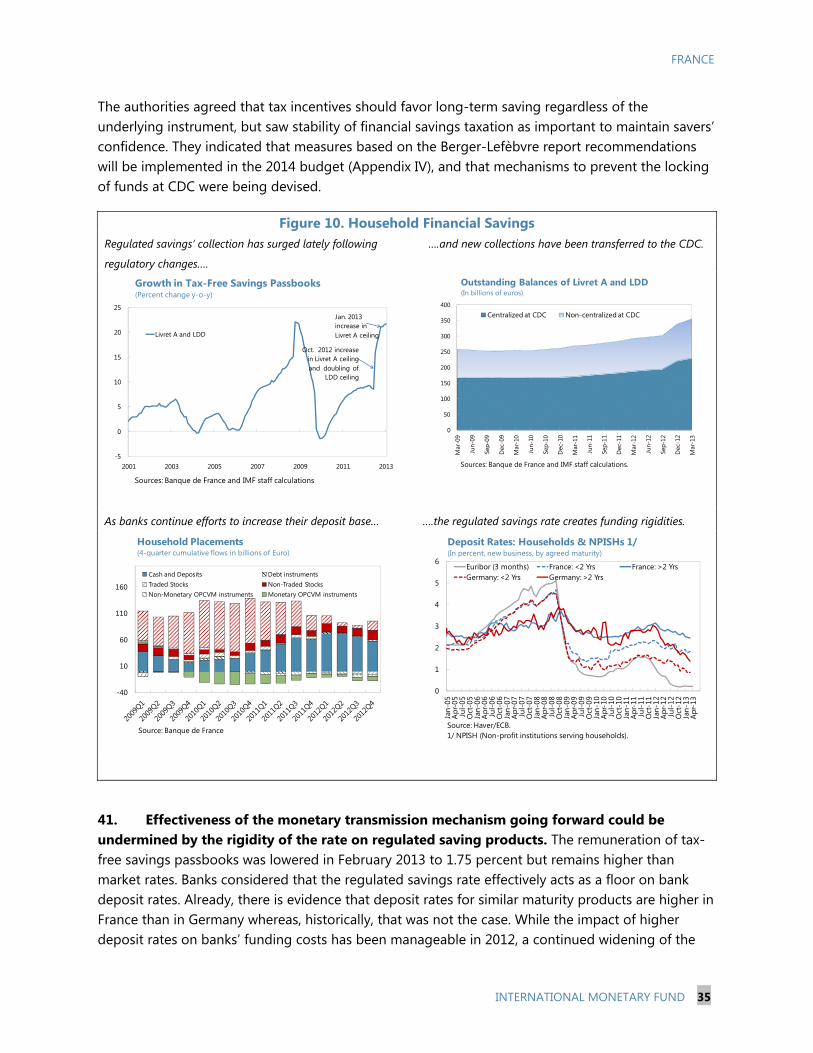
FRANCE
INTERNATIONAL MONETARY FUND 35
The authorities agreed that tax incentives should favor long-term saving regardless of the underlying instrument, but saw stability of financial savings taxation as important to maintain savers’ confidence. They indicated that measures based on the Berger-Lefèbvre report recommendations will be implemented in the 2014 budget (Appendix IV), and that mechanisms to prevent the locking of funds at CDC were being devised.
Figure 10. Household Financial Savings Regulated savings’ collection has surged lately following
regulatory changes….
….and new collections have been transferred to the CDC.
As banks continue efforts to increase their deposit base… ….the regulated savings rate creates funding rigidities.
41. Effectiveness of the monetary transmission mechanism going forward could be undermined by the rigidity of the rate on regulated saving products. The remuneration of tax-free savings passbooks was lowered in February 2013 to 1.75 percent but remains higher than market rates. Banks considered that the regulated savings rate effectively acts as a floor on bank deposit rates. Already, there is evidence that deposit rates for similar maturity products are higher in France than in Germany whereas, historically, that was not the case. While the impact of higher deposit rates on banks’ funding costs has been manageable in 2012, a continued widening of the
-5
0
5
10
15
20
25
2001 2003 2005 2007 2009 2011 2013
Livret A and LDD
Growth in Tax-Free Savings Passbooks(Percent change y-o-y)
Sources: Banque de France and IMF staff calculations
Oct. 2012 increasein Livret A ceiling and doubling of
LDD ceiling
Jan. 2013 increase in Livret A ceiling
0
50
100
150
200
250
300
350
400
Mar
-09
Jun-
09
Sep-
09
Dec
-09
Mar
-10
Jun-
10
Sep-
10
Dec
-10
Mar
-11
Jun-
11
Sep-
11
Dec
-11
Mar
-12
Jun-
12
Sep-
12
Dec
-12
Mar
-13
Centralized at CDC Non-centralized at CDC
Outstanding Balances of Livret A and LDD (In billions of euros)
Sources: Banque de France and IMF staff calculations.
-40
10
60
110
160
Cash and Deposits Debt instrumentsTraded Stocks Non-Traded StocksNon-Monetary OPCVM instruments Monetary OPCVM instruments
Source: Banque de France
Household Placements(4-quarter cumulative flows in billions of Euro)
0
1
2
3
4
5
6
Jan-
05A
pr-0
5Ju
l-05
Oct
-05
Jan-
06A
pr-0
6Ju
l-06
Oct
-06
Jan-
07A
pr-0
7Ju
l-07
Oct
-07
Jan-
08A
pr-0
8Ju
l-08
Oct
-08
Jan-
09A
pr-0
9Ju
l-09
Oct
-09
Jan-
10A
pr-1
0Ju
l-10
Oct
-10
Jan-
11A
pr-1
1Ju
l-11
Oct
-11
Jan-
12A
pr-1
2Ju
l-12
Oct
-12
Jan-
13A
pr-1
3
Euribor (3 months) France: <2 Yrs France: >2 Yrs Germany: <2 Yrs Germany: >2 Yrs
Source: Haver/ECB.1/ NPISH (Non-profit institutions serving households).
Deposit Rates: Households & NPISHs 1/ (In percent, new business, by agreed maturity)

FRANCE
36 INTERNATIONAL MONETARY FUND
spread between administered and market rates may eventually impair the monetary transmission mechanism. The authorities agreed that such a risk could materialize in the event of future reductions in ECB policy rates and that a tighter link between the rate on regulated saving products and market or policy rates would be desirable, although they noted that, currently, any evidence of fragmentation issues or funding cost rigidities was limited to deposit rates.
42. Given the vulnerability of French global systemically important banks (G-SIBs) to funding shocks and their potential for propagating the shock, actions to reduce perceived risks assume critical importance.24 An essential next stage to the planned Single Supervisory Mechanism (SSM) in 2014 is the asset quality review (AQR). Staff stressed the importance of ensuring the highest credibility and transparency for such an exercise to be effective in restoring confidence in the EA banking system. Given the risk of re-ignition of financial stress should the exercise raise concerns about the burden sharing of possible capital shortfalls, staff emphasized the importance of (1) pro-active communication on the framework and methodologies of the AQR and (2) involvement of an independent third party. The authorities were confident that the reliance on harmonized methodologies for NPLs, provisioning rules, and risk weights, and the involvement of other national authorities (along with the ECB and EBA) would go a long way toward establishing the credibility of the AQR. They were less convinced of the need to involve an independent third party. The mission and the authorities agreed that, while loan loss provisioning ratios have stabilized in the first quarter of 2013, corporate exposures are a key near-term risk in light of the fragile recovery. By contrast, absent an unexpectedly large deterioration in unemployment, banks’ housing exposures appear less risky and historical default rates have been low. Staff took note of the regular assessments by the supervisor (Autorité de Contrôle Prudentiel, or ACP) of the adequacy of risk weights and internal risk-based models used by banks and generally conservative origination practices for housing loans. They authorities considered that these actions placed them in a relatively sound position ahead of the AQR. Since market participants are not fully aware of the extent and frequency of ACP’s control measures, and because low risk ratios of French G-SIBs relative to comparable jurisdictions have raised questions about the reliability of risk weights, staff encouraged the authorities to publish the key findings of their regular evaluations and, more generally, to enhance financial disclosures as recommended by the 2012 FSAP Update (Appendix IV).
43. The authorities restated their support for rapid progression on the three pillars of a European banking union (supervision, resolution, and deposit insurance). They considered that the next steps should focus on strengthening national regimes and harmonizing rules and approaches (e.g., provisioning policies) at the European level. As regards supervisory arrangements, the authorities believed that first-level supervision should be entrusted to joint national supervisory
24 As reported in the 2012 Spillover Report, the French, UK, and German banking system would be the most affected by an adverse funding shock and, because of their large absolute amount of liabilities, are likely to amplify the initial shock through interbank exposures.

FRANCE
INTERNATIONAL MONETARY FUND 37
teams rather than a single ECB-led team.25 Staff and the authorities agreed on the need for early introduction of the SRM to ensure the effectiveness of the future SSM. In staff’s view, a strong Single Resolution Authority (SRA) with the right incentives to act in a timely and least costly way, especially on cross-border banks, is an essential basis for the SRM. In contrast to the EC’s proposal that the Commission is best placed to be entrusted with the single decision-making authority, the French and German authorities favored a “single resolution board” involving national resolution authorities, with financing from the industry and national private backstop arrangements, allowing the SRA to become operational swiftly without a Treaty change. Acknowledging that the debate on SRA had shifted more recently toward issues of depositor preference and bail-in, the authorities noted their preference for equal treatment of large depositors and other senior unsecured creditors, while acknowledging that views were still evolving.26 Finally, they favored a gradual implementation of the third and last pillar of the Banking Union, involving in a first stage a system of national deposit guarantee schemes (DGSs) that follow harmonized rules and use own funds, with access by DGSs to re-financing at the European level in a second stage.
25 As noted in the 2013 Euro Area Staff Report, outstanding legal uncertainties on the respective responsibilities of the ECB and national competent authorities will have to be clarified to make the SSM operational. 26 Since the Article IV discussions took place, an agreement on procedures to handle failing banks was reached by EU Finance Ministers on June 27, 2013. The agreement provides national regulators some flexibility to shield certain types of creditors and liabilities using national backstops if hair cutting them out would put financial stability at risk or spark contagion.
0
20
40
60
80
100
120
Gaz
prom
bank
Bk S
aint
-Pet
ersb
urYa
pi K
redi
Sber
bank
Nom
os-B
ank
Isba
nkPr
omsv
yazb
ank
VTB
Bank
Vaki
fban
kPK
O B
ank
Pols
ki S
AVo
zroz
hden
ie B
ank
Akba
nkG
aran
tiH
alkb
ank
Spar
eBan
k 1
SMN
DLR
Kre
dit
SR-B
ank
Raiff
eise
nZi
raat
CGD
UBI
Banc
o Po
pula
rBB
VAEr
ste
Bank
Saba
dell
Sydb
ank
Uni
cred
itD
NB
Inte
saSa
ntan
der
Banc
o Po
pola
reH
SBC
Jysk
e Bk
KBC
BMPS
Spar
eBan
ken
Vest
RBS
NO
RDLB
ING
Lloy
ds B
anki
ng G
rpG
roup
e BP
CECo
mm
erzb
ank
ABN
AM
RO G
roup
NV
Hel
aba
BNP
Parib
asBR
Fkre
dit A
/SBa
rcla
ysSo
cGen
Swed
bank
Nor
dea
Läns
förs
äkrin
gar
Cred
it Su
isse
Créd
it Ag
ricol
eSE
BD
ansk
e Ba
nkN
ykre
dit R
lkre
dit
Han
dels
bank
enD
euts
che
Bank
Dex
iaU
BSPo
rtig
on
Risk ratios Peer EU 1/ France
Risk Ratios, 2012(Risk-weighted assets as a percent of assets)
Sources: SNL Financial; and IMF staff calculations.1/ Average of a group of peers in Europe sharing the same business profile.
French banks

FRANCE
38 INTERNATIONAL MONETARY FUND
44. The authorities have anticipated in their own banking reform the proposed EU Recovery and Resolution Directive and possible follow-ups to the Liikanen report. The draft banking reform law (hereafter, the law), expected to be voted in the summer of 2013, creates a new resolution authority by reinforcing the powers of the supervisor (ACP) to prevent and manage banking crises, under the new name of Autorité de Contrôle Prudentiel et de Résolution (ACPR) (see Appendices IV and V). It also requires banks to put in place recovery and resolution plans and gives the ACPR the authority to mandate organizational changes in entities when the existing organization could potentially complicate resolution. The law provides for the possibility of bail-in of subordinated creditors. The structural provisions of the law aim at carving out only those activities that do not significantly contribute to the financing of the economy, thus exempting market-making activities which are considered critical to serving corporate clients. In response to the mission’s concern about consistency of these reforms with future EU-wide provisions, the authorities indicated that the national resolution framework—including the stance on bail-in rule and other provisions of the law related to structural bank reforms—would be adjusted as needed to ensure compliance with the evolving EU framework. Similarly, they expected the EU financial transactions tax (FTT) to replace the French FTT introduced in August 2012. The mission argued that the far-reaching market implications of the EU FTT (particularly for French banks which are major players in the derivatives markets) warrant a reconsideration of its planned introduction next year. The authorities agreed with the mission that the initial proposal would likely be amended leading to some delays in introduction, but reiterated their support for an FTT.
STAFF APPRAISAL 45. Recent improvements in economic indicators support the expectation of a gradual turnaround in economic conditions in the second half of 2013, although downside risks remain substantial. In a context of continued rapid fiscal adjustment, the recovery of domestic demand depends critically on reducing the policy uncertainty that weighs on spending decisions of households and enterprises. On the positive side, the relatively sound financial position of households and enterprises implies that an improvement in confidence can translate relatively quickly into a demand response.
46. While fiscal consolidation needed to restore the health of public finances remains considerable, there is scope to ease the pace of adjustment in 2014 while rebalancing it toward stronger expenditure containment. A somewhat smoother adjustment in 2014 (than envisioned by the authorities’ Stability Program) would support the fragile recovery. At the same time, the adjustment effort may well need to be sustained for a longer period to reach structural balance, than the authorities’ optimistic medium-term growth assumptions suggest. The transition to structural deficit targeting is a welcome change in the fiscal policy framework and should provide greater stability in policy planning. It should, however, be anchored by an explicit commitment to contain expenditure growth as the key instrument of adjustment going forward combined with greater clarity about the sources of these expenditure savings over the medium term. Such a rebalancing would reduce policy uncertainty and thereby strengthen the recovery.

FRANCE
INTERNATIONAL MONETARY FUND 39
47. The government expenditure containment assumed in the authorities’ Stability Program is appropriately ambitious and as such needs to be backed by structural fiscal measures. The authorities’ approach to spending rationalization has produced some useful recommendations, and more is expected from the upcoming reform of pensions and unemployment insurance. However, the scale of the expenditure adjustment needed over the medium term will require a more ambitious approach to rationalizing spending by local authorities and deeper reforms to improve the efficiency of social spending.
48. Structural policy priorities should go to strengthening the economy’s growth potential beyond the pending recovery, and improving external competitiveness. As discussed in last year’s report, significant rigidities have hindered the economy’s capacity to grow and to create jobs, and weakened the external accounts as noted in the staff’s external assessment. The gap relative to European trading partners in terms of cost and non-cost competitiveness remains a dampening factor and ultimately a risk for macroeconomic balances, notably in a context where euro area periphery countries are registering large competitiveness gains. On the positive side, France benefits from a number of structural strengths which, in a more supportive environment, could provide a substantial impulse to growth. They include a high household saving rate, first rate global enterprises, positive demographics, a strong scientific research capacity, and high quality public infrastructure.
49. Since the last Article IV consultation in October 2012, the authorities have made meaningful progress on the structural reform front. The reduction of the labor tax wedge gives a boost to enterprises until the impact of structural reforms gains ground. The 2013 labor market reform represents a significant change in both approach and content. The success of the negotiations and its broad support could portend a more collaborative relation between social partners going forward, which, as much as institutions, is key to producing efficient labor outcomes. On the substance, the reform introduces important elements of flexisecurity, although much will depend on implementation.
50. While these reforms are welcome, they are not as yet sufficient to reverse the loss of competitiveness. Deeper reforms are needed to close the gap between labor costs and productivity and activate France’s structural strengths. The launching of reforms on several critical fronts (pensions, worker training, administrative reforms and simplification, activation policies and unemployment insurance) offers an opportunity to address a number of growth impediments. Priority should go to increasing labor market participation, reducing regulatory hindrances and opening product markets to greater competition. As demand recovers it will become increasingly important to increase employment incentives, especially at the two ends of the age distribution. Also, while it is important to allow the labor market reform to gain ground, there is scope to go further in enhancing the flexibility of the labor market. Enhancing competition in product markets, especially in the sheltered services sector, is an important lever of productivity growth and employment creation. Notwithstanding potential adjustment costs, enhanced competition, combined with the French social safety net, could be an effective instrument of economic inclusiveness by redistributing rents and creating new business opportunities and thus jobs. Even

FRANCE
40 INTERNATIONAL MONETARY FUND
with productivity enhancing measures, the cost of labor remains a critical obstacle to employment at the lower-skill end of the labor market, particularly for new entrants. To improve employment outcomes, the rationing effect of the high minimum wage should be reduced and contractual work arrangements could be eased for first-time entrants into the labor force.
51. Financial sector priorities should go to solidifying the significant progress achieved in terms of financial stability and ensuring that the efficiency of financial intermediation is preserved as financial institutions adjust to new prudential requirements. Balance sheet restructuring on the part of banks has greatly reduced financial stability concerns. Signs of stabilization in loan loss provision ratios in the first quarter of 2013 are encouraging, although continued vigilance is necessary to ensure adequate provisioning levels given uncertain recovery prospects. Regular and strict assessments by the supervisor suggest that the French banking system is comparatively well positioned ahead of the AQR. Reaching regulatory liquidity and funding ratios remains a challenge for many French banks requiring continued improvement in funding structures, higher deposit collection and a move toward more market-intermediated credit. It would be important, in this regard, to ensure that tax incentives on financial products are better aligned with bank regulatory objectives, for instance by limiting the capture of saving by government financial institutions, phasing out regulated interest rates, and taking maturity-based rather than a product-based approach to tax incentives.
52. Finally, it is important to underscore the positive role played by the authorities to maintain the process of European convergence toward the Single Supervisory Mechanism and Single Resolution Mechanism in the European Union on track. Apart from the efforts deployed at the European level, the domestic banking reform now before Parliament contributes to the process by aligning the resolution regime to the EU directives in line with FSAP recommendations.
53. It is recommended that the next Article IV consultation with France be held on the standard 12-month cycle.

FRANCE
INTERNATIONAL MONETARY FUND 41
Table 1. Selected Economic and Social Indicators, 2010–18
2010 2011 2012 2013 2014 2015 2016 2017 2018(Proj.) (Proj.) (Proj.) (Proj.) (Proj.) (Proj.)
Real economy (change in percent) Real GDP 1.7 2.0 0.0 -0.2 0.8 1.5 1.7 1.8 1.9 Domestic demand 1.8 2.0 -0.9 -0.5 0.8 1.1 1.3 1.5 1.6 Nominal GDP (billions of euros) 1937 2001 2032 2061 2114 2178 2251 2336 2427 CPI (year average) 1.5 2.1 2.0 1.4 1.5 1.5 1.6 1.7 1.8 Unemployment rate (in percent) 9.7 9.6 10.2 11.2 11.6 11.4 10.9 10.6 10.4 Gross national savings (percent of GDP) 17.7 18.8 17.5 17.7 18.1 18.7 19.3 20.0 20.5 Gross domestic investment (percent of GDP) 19.3 20.8 19.8 19.1 19.4 19.5 19.7 20.0 20.3
Public finance (percent of GDP) Central government balance -6.3 -4.4 -3.9 -2.8 -2.4 -2.0 -1.5 -1.1 -0.9 General government balance -7.1 -5.3 -4.8 -3.9 -3.5 -2.8 -1.9 -1.0 -0.8 Structural balance (percent of potential GDP) -5.7 -4.6 -3.5 -1.7 -1.2 -0.8 -0.4 0.0 0.0 Primary balance -4.8 -2.8 -2.5 -1.8 -1.5 -0.8 0.1 0.9 1.2 General government gross debt 82.4 85.8 90.2 93.5 95.0 94.9 93.8 91.4 88.7
Money and interest rates (in percent) Money market rate 1/ 0.5 0.8 0.1 0.0 ... ... ... ... ... Government bond yield 1/ 3.1 3.3 2.5 2.0 ... ... ... ... ...
Balance of payments (in percent of GDP) Exports of goods 20.2 21.2 21.5 21.1 21.0 21.1 21.2 21.4 21.6 Volume growth (in percent) 9.5 5.4 2.4 1.4 3.1 4.4 4.5 4.6 4.6 Imports of goods 23.0 24.9 25.0 24.1 24.0 23.7 23.5 23.4 23.3 Volume growth (in percent) 8.9 5.1 -1.1 0.2 2.7 3.0 3.2 3.6 3.7 Trade balance -2.7 -3.7 -3.5 -3.0 -3.0 -2.6 -2.3 -2.0 -1.8 Current account -1.6 -1.9 -2.3 -1.3 -1.2 -0.8 -0.3 0.0 0.3 FDI (net) -1.8 -1.8 0.1 -0.3 -0.6 -0.9 -1.2 -1.4 -1.7 Official reserves (US$ billion) 55.8 48.6 ... ... ... ... ... ... ...
Fund position (as of January 31, 2012) Holdings of currency (percent of quota) 79.7 73.1 70.9 ... ... ... ... ... ... Holdings of SDRs (percent of allocation) 96.1 95.5 94.2 ... ... ... ... ... ... Quota (SDRs million) 10739 10739 10739 ... ... ... ... ... ...
Exchange rates Euro per U.S. dollar, period average 0.75 0.72 0.78 ... ... ... ... ... ... Nominal effective rate, ULC-styled (2000=100) 102.4 102.4 100.1 ... ... ... ... ... ... Real effective exchange rate, ULC-based (2000=100) 104.3 105.4 104.8 ... ... ... ... ... ...
Potential output and output gap Potential output 0.8 0.8 0.8 0.9 1.0 1.1 1.2 1.3 1.4 Output gap -2.2 -1.0 -1.8 -2.9 -3.0 -2.6 -2.1 -1.6 -1.1
Social indicators
Per capita GDP (2006): US$35,471; Life expectancy at birth (2009): 77.7 (male) and 84.4 (female);
Poverty rate (mid-2000s): 14.1 percent (60 percent line), 7.1 percent (50 percent line); Income distribution (ratio of income received by top and bottom quintiles, 2004): 4.2.
Sources: French authorities; IMF staff estimates and projections.1/ For 2013, average for January-May.

FRANCE
42 INTERNATIONAL MONETARY FUND
Table 2. Balance of Payments, 2011–18 (Percent of GDP)
2011 2012 2013 2014 2015 2016 2017 2018
Current account -1.9 -2.3 -1.3 -1.2 -0.8 -0.3 0.0 0.3Net exports of goods -3.7 -3.5 -3.0 -3.0 -2.6 -2.3 -2.0 -1.8
Exports of goods 21.2 21.5 21.1 21.0 21.1 21.2 21.4 21.6Imports of goods -24.9 -25.0 -24.1 -24.0 -23.7 -23.5 -23.4 -23.3
Net exports of services 1.2 1.5 1.5 1.5 1.6 1.7 1.8 1.9Exports of services 8.1 8.1 8.1 8.1 8.1 8.2 8.3 8.3Imports of services -6.9 -6.6 -6.6 -6.6 -6.5 -6.5 -6.4 -6.4
Income balance 1.7 1.1 1.1 1.1 1.0 1.0 1.0 0.9Current transfers -1.8 -1.8 -1.5 -1.5 -1.5 -1.5 -1.5 -1.5
Capital and financial accountCapital account 0.0 0.0 0.0 0.0 0.0 0.0 0.0 0.0Financial account 2.9 4.8 1.3 1.2 0.7 0.3 0.0 -0.3Direct investment -1.8 0.1 -0.3 -0.6 -0.9 -1.2 -1.4 -1.7Portfolio investment 12.6 1.8 -1.3 -1.0 -1.1 -1.1 -1.1 -1.1
Equity securitiesDebt securities 2.6 2.7 2.8 2.8 2.8 2.8 2.7 2.7
Bonds and notesMoney market instruments
Financial derivativesOther investment -8.9 2.9 2.9 2.8 2.7 2.6 2.5 2.4
Trade creditsLoansCurrency and depositsOther
Reserve assets 0.3 -0.2 0.0 0.0 0.0 0.0 0.0 0.0
Errors and omissions -1.0 -2.5 0.0 0.0 0.0 0.0 0.0 0.0
Source: IMF, Balance of Payments Statistics; and Direction Générale des Douanes et Droits Indirects for goods exports and imports.

FRANCE
INTERNATIONAL MONETARY FUND 43
Table 3a. France: General Government Statement of Operations, 2008–18 (In percent of GDP; unless otherwise Indicated)
2008 2009 2010 2011 2012 2013 2014 2015 2016 2017 2018(in percent of GDP)
Revenue 49.9 49.2 49.5 50.6 51.8 53.2 53.2 53.2 53.2 53.2 52.6Taxes 26.7 25.1 25.6 26.7 27.7 29.1 29.4 29.7 30.0 30.1 29.8Social contributions 18.1 18.8 18.6 18.8 19.0 18.9 18.6 18.3 18.1 17.9 17.6Grants ... ... ... ... ... ... ... ... ... ... ...Other revenue ... ... ... ... ... ... ... ... ... ... ...
Expenditure 53.3 56.8 56.6 55.9 56.6 57.1 56.7 56.0 55.2 54.2 53.4Expense 52.4 55.8 56.0 55.4 56.2 56.6 56.2 55.5 54.7 53.8 53.0
Compensation of employees 12.8 13.5 13.4 13.1 13.2 13.1 12.9 12.7 12.4 12.0 11.7Use of goods and services 5.1 5.6 5.8 5.5 5.6 5.7 5.6 5.6 5.6 5.6 5.6Consumption of fixed capital 2.5 2.6 2.6 2.7 2.7 2.6 2.6 2.6 2.5 2.4 2.4Interest 2.9 2.4 2.4 2.6 2.6 2.2 2.2 2.2 2.1 2.1 2.1Subsidies 1.4 1.7 1.7 1.5 1.5 1.5 1.5 1.5 1.5 1.5 1.5Grants 0.8 0.8 0.7 0.7 0.9 0.8 0.8 0.8 0.8 0.7 0.7Social benefits 23.5 25.5 25.6 25.5 26.1 26.5 26.4 26.0 25.5 25.3 25.6Other expense 3.4 3.8 3.8 3.7 3.7 4.2 4.2 4.2 4.3 4.0 3.3
Net acquisition of nonfinancial assets 0.9 1.0 0.6 0.5 0.5 0.5 0.5 0.4 0.4 0.4 0.4Acquisitions of nonfinancial assets ... ... ... ... ... ... ... ... ... ... ...Disposals of nonfinancial assets ... ... ... ... ... ... ... ... ... ... ...Consumption of fixed capital -2.5 -2.6 -2.6 -2.7 -2.7 -2.6 -2.6 -2.6 -2.5 -2.4 -2.4
Gross Operating Balance 0.1 -4.0 -3.9 -2.0 -1.7 -0.7 -0.4 0.2 1.0 1.8 2.0Net Operating Balance -2.5 -6.6 -6.5 -4.7 -4.4 -3.4 -3.0 -2.3 -1.5 -0.6 -0.4Net lending (+)/borrowing (–) -3.3 -7.5 -7.1 -5.3 -4.8 -3.9 -3.5 -2.8 -1.9 -1.0 -0.8Net acquisition of financial assets 3.1 0.8 1.0 1.6 ... ... ... ... ... ... ...
Monetary gold and SDRs 0.0 0.0 0.0 0.0 ... ... ... ... ... ... ...Currency and deposits 0.6 1.1 0.1 1.1 ... ... ... ... ... ... ...Debt securities 1.2 -1.1 0.8 -0.6 ... ... ... ... ... ... ...Loans 0.4 -0.2 0.2 0.3 ... ... ... ... ... ... ...Equity and investment fund shares 0.3 0.6 -0.5 -0.2 ... ... ... ... ... ... ...Insurance, pensions, and standardized guarantee sche 0.0 0.0 0.0 0.0 ... ... ... ... ... ... ...Financial derivatives and employee stock options 0.1 0.0 0.0 0.0 ... ... ... ... ... ... ...Other accounts receivable 0.5 0.3 0.4 0.9 ... ... ... ... ... ... ...
Net incurrence of liabilities 6.4 8.3 8.1 6.7 ... ... ... ... ... ... ...SDRs 0.0 0.0 0.0 0.0 ... ... ... ... ... ... ...Currency and deposits -0.1 0.1 0.9 0.6 ... ... ... ... ... ... ...Debt securities 5.7 8.0 5.5 5.6 ... ... ... ... ... ... ...Loans 0.6 0.4 1.0 -0.5 ... ... ... ... ... ... ...Equity and investment fund shares 0.0 0.0 0.0 0.0 ... ... ... ... ... ... ...Insurance, pensions, and standardized guarantee sche 0.0 0.0 0.0 0.0 ... ... ... ... ... ... ...Financial derivatives and employee stock options 0.0 0.0 0.0 0.0 ... ... ... ... ... ... ...Other accounts payable 0.3 -0.1 0.6 1.0 ... ... ... ... ... ... ...
Memorandum items:Structural balance -4.1 -5.9 -5.8 -4.7 -3.6 -1.8 -1.3 -0.8 -0.5 0.0 0.0Structural balance (in percent of potential GDP) -4.1 -5.7 -5.7 -4.6 -3.5 -1.7 -1.2 -0.8 -0.4 0.0 0.0Structural primary balance 1/ -1.2 -3.8 -3.7 -2.3 -1.6 -0.4 0.0 0.5 1.1 1.7 1.7Central government net lending/borrowing -3.3 -6.2 -6.3 -4.4 -3.9 -2.8 -2.4 -2.0 -1.5 -1.1 -0.9General government Maastricht balance -3.3 -7.5 -7.1 -5.3 -4.8 -3.9 -3.5 -2.8 -1.9 -1.0 -0.8Gross debt (Maastricht definition) 68.2 79.2 82.4 85.8 90.2 93.5 95.0 94.9 93.8 91.4 88.7
Source: GFS yearbook, INSEE, French authorities, and IMF staff estimates and projections.1/ Excludes cyclical effects.
Projections

FRANCE
44 INTERNATIONAL MONETARY FUND
Table 3b. France: General Government Integrated Balance Sheet, 2003–11 (Percent of GDP)
2003 2004 2005 2006 2007 2008 2009 2010 2011(in percent of GDP)
STOCK POSITIONS:Net worth ... ... ... ... ... ... ... ... ...
Nonfinancial assets ... ... ... ... ... ... ... ... ...Net financial worth -46.6 -47.4 -45.4 -39.3 -35.7 -45.8 -52.1 -57.3 -62.8Financial assets 28.6 29.7 33.6 34.6 37.3 33.4 39.2 38.2 36.9
Monetary gold and SDRs 0.0 0.0 0.0 0.0 0.0 0.0 0.0 0.0 0.0Currency and deposits 3.4 3.5 3.2 1.3 1.3 2.1 3.2 2.3 3.0Debt securities 1.5 1.3 1.4 1.7 1.9 2.6 2.5 2.5 2.4Loans 2.1 2.2 1.9 1.7 1.6 1.5 1.9 2.0 2.3Equity and investment fund shares 13.5 15.4 19.3 22.1 24.2 18.8 22.0 21.7 19.2Insurance, pensions, and standardized 0.1 0.1 0.1 0.1 0.1 0.1 0.1 0.1 0.1Financial derivatives and employee 0.0 0.0 0.0 0.0 0.0 0.1 0.1 0.1 0.1Other accounts receivable 8.1 7.2 7.7 7.8 8.1 8.2 9.5 9.5 9.9
Liabilities 75.2 77.1 78.9 73.9 73.0 79.2 91.2 95.4 99.7Monetary gold and SDRs 0.0 0.0 0.0 0.0 0.0 0.0 0.0 0.0 0.0Currency and deposits 1.0 0.9 0.9 1.2 1.2 1.4 1.3 1.2 1.5Debt securities 56.3 59.5 61.3 56.2 54.5 60.8 71.1 74.5 78.8Loans 10.0 9.8 9.9 9.7 10.0 9.8 11.1 11.7 10.9Equity and investment fund shares 0.0 0.0 0.0 0.0 0.0 0.0 0.0 0.0 0.0Insurance, pensions, and standardized 0.0 0.0 0.0 0.0 0.0 0.0 0.0 0.0 0.0Financial derivatives and employee 0.0 0.0 0.0 0.0 0.0 0.0 0.0 0.0 0.0Other accounts payable 7.9 6.9 6.8 7.0 7.3 7.3 7.8 8.1 8.5
Memorandum items:Debt (at market value) 75.2 77.1 78.9 73.9 73.0 79.2 91.2 95.4 99.6Debt at face value 71.1 71.9 73.5 70.9 71.5 75.5 87.0 90.4 94.3Maastricht debt 63.3 65.2 66.8 64.1 64.2 68.2 79.2 82.4 85.8
OTHER ECONOMIC FLOWS:Change in net worth from other flows ... ... ... ... ... ... ... ... ...Nonfinancial assets ... ... ... ... ... ... ... ... ...Net financial worth 0.7 0.9 3.3 6.4 4.5 -7.6 2.5 0.5 -2.1Financial assets 0.5 2.0 3.7 4.3 3.4 -5.1 2.3 1.0 -1.6
Monetary gold and SDRs 0.0 0.0 0.0 0.0 0.0 0.0 0.0 0.0 0.0Currency and deposits 0.0 0.1 -0.1 0.0 0.0 0.0 0.2 0.0 0.0Debt securities 0.1 -0.2 0.0 0.0 0.0 0.1 0.1 0.0 0.0Loans -0.3 0.0 -0.1 0.0 0.0 0.0 -0.1 0.0 0.0Equity and investment fund shares 0.7 2.1 3.9 4.3 3.3 -5.2 2.1 0.9 -1.6Insurance, pensions, and standardized 0.0 0.0 0.0 0.0 0.0 0.0 0.0 0.0 0.0Financial derivatives and employee 0.0 0.0 0.0 0.0 0.0 0.0 0.0 0.0 0.0Other accounts receivable 0.0 0.0 0.0 0.0 0.1 0.0 0.1 0.1 0.0
Liabilities -0.2 1.1 0.5 -2.2 -1.1 2.5 -0.1 0.5 0.5Monetary gold and SDRs 0.0 0.0 0.0 0.0 0.0 0.0 0.0 0.0 0.0Currency and deposits 0.0 0.0 0.0 0.0 0.0 0.0 0.0 0.0 0.0Debt securities -0.2 1.1 0.3 -2.1 -1.1 2.4 0.1 0.5 0.6Loans 0.0 0.1 0.2 -0.1 -0.1 0.0 0.0 0.0 0.0Equity and investment fund shares 0.0 0.0 0.0 0.0 0.0 0.0 0.0 0.0 0.0Insurance, pensions, and standardized 0.0 0.0 0.0 0.0 0.0 0.0 0.0 0.0 0.0Financial derivatives and employee 0.0 0.0 0.0 0.0 0.0 0.0 0.0 0.0 0.0Other accounts payable 0.0 0.0 0.0 0.0 0.1 0.1 -0.2 0.0 0.0
Source: GFS yearbook.

FRANCE
INTERNATIONAL MONETARY FUND 45
Table 4. Vulnerability Indicators, 2006–12 (In percent of GDP; unless otherwise indicated)
Est.
2006 2007 2008 2009 2010 2011 2012
External IndicatorsExports (annual percentage change, in U.S. dollars) 9.1 13.7 10.5 -12.5 5.7 14.3 -5.0Imports (annual percentage change, in U.S. dollars) 14.2 15.4 15.5 -33.1 13.1 17.5 -5.7Terms of trade (annual percentage change) -1.5 1.3 -0.7 2.8 -1.5 -2.2 -0.7Current account balance -0.6 -1.0 -1.7 -1.3 -1.6 -1.9 -2.3Capital and financial account balance 1.4 1.7 1.0 1.2 1.4 2.9 4.8
Of whichInward portfolio investment (debt securities, etc.) 8.4 4.5 6.4 16.7 5.0 3.7 1.6Inward foreign direct investment 3.2 3.7 2.3 0.9 1.2 1.5 2.1Other investment (net) 9.5 8.5 3.3 -7.8 -4.6 -8.9 2.9
Total reserves minus gold (in billions of U.S. dollars, end-of-period) 42.7 45.7 33.6 46.6 55.8 48.6 54.2Euros per U.S. dollar (period average) 0.8 0.7 0.7 0.7 0.8 0.7 0.8
Market IndicatorsFinancial Markets
Public sector debt 1/ 64.1 64.2 68.2 79.2 82.4 85.8 90.23-month T-bill yield (percentage points, eop) 3.5 3.8 1.9 0.4 0.5 0.1 0.1
3-month T-bill yield in real terms (percentage points, eop) 2.0 1.3 0.9 -0.5 -1.3 -2.2 -1.3US 3 month T-bill 4.8 3.1 0.0 0.1 0.2 0.0 0.1Spread with the US T-bill (percentage points, eop) -1.4 0.7 1.9 0.3 0.3 0.1 0.0
5- to 8-year government bond (percentage points, eop) 3.8 4.4 3.5 3.5 3.3 3.2 2.010-year government bond (United States) 4.6 4.1 2.4 3.6 3.3 2.0 1.7Spread with US bond (percentage points, eop) -0.8 0.3 1.1 -0.1 0.1 1.2 0.3
Yield curve (10 year - 3 month, percentage points, eop) 0.3 0.5 1.6 3.1 2.8 3.0 1.9Stock market index (period average) 273.1 306.1 232.0 178.6 200.3 192.1 179.0Real estate prices (index, Q1-10=100, period average) 98.6 105.1 106.0 98.5 103.5 109.7 109.1
Credit markets (end-of-period 12-month growth rates)Credit to the private sector 11.0 13.4 6.2 -0.7 5.6 4.4 2.0
Bank credit to households 11.4 10.7 5.7 2.9 6.0 5.8 2.1Housing Loans 15.1 12.8 7.5 3.7 8.2 6.2 3.0
Bank credit to nonfinancial enterprises 9.7 14.1 10.6 -2.1 1.4 4.7 -0.2Sectoral risk indicators
Household sectorHousehold savings ratio 14.9 15.4 15.5 16.4 15.9 16.0 15.6Household financial savings ratio 4.9 5.0 5.0 7.4 7.0 6.7 6.1Real estate household solvency ratio (index, 2001=100) 2/ 97 97 101 102.0 99.4 100.9 97.7
Corporate sectorProfitability of business sector (financial margin) 37.8 38.4 38.1 35.8 36.6 35.8 35.1Investment ratio 17.4 18.4 18.9 17.1 18.0 18.4 18.0Savings ratio 15.2 16.5 14.0 13.8 16.2 14.4 12.8Self-financing ratio 81.6 83.8 69.3 75.7 83.8 72.6 66.0
Banking sectorShare of housing loans in bank credit to the private sector 37.3 37.1 37.6 39.2 40.2 40.8 41.2Share of nonperforming loans in total loans 3.0 2.7 2.8 4.0 3.8 4.3 4.4Ratio of nonperforming loans net of provisions to capital 6.8 6.6 10.3 19.3 17.2 20.8 19.4Liquid assets to total short-term liabilities 146.7 150.3 128.3 93.1 76.2 87.6 91.4Return on assets 0.6 0.4 0.1 0.3 0.6 0.4 0.3Return on equity 14.0 9.8 3.6 7.2 12.0 8.3 9.8Regulatory capital to risk-weighted assets 10.9 10.2 10.5 12.4 12.7 12.3 14.3
Sources: French authorities; INSEE; BdF; ECB; Haver; Credit Logement; IMF, International Financial Statistics; and Bloomberg.1/ The debt figure does not include guarantees on non-general government debt.2/ This index combines the effect of real disposable income, repayment conditions for loans, real estate prices, and interest subsidies.

FRANCE
46 INTERNATIONAL MONETARY FUND
Table 5. France: Daily Movements of Selected Financial Indicators
Table 6. France: The Core Set of Financial Soundness Indicators, 2005–12
Latestobservation:7/15/2013 Last Closing 7 days ago 7/1/2011 Trough Peak Trough Peak
CAC 40 Index 3872.4 0.4 3.2 -3.4 39.2 -6.8 61.1 -44.1BNP Paribas Equity 44.3 0.6 3.1 -18.8 92.1 -25.7 113.1 -51.6Crédit Agricole Equity 6.8 0.6 0.3 -37.2 135.4 -50.4 135.4 -79.3Société Générale Equity 28.3 1.3 4.7 -33.4 88.4 -45.9 88.4 -79.9Eurostoxx 600 297.1 0.3 3.1 8.1 38.3 -4.3 88.1 -26.7VSTOXX Index 19.1 -0.1 -15.7 -3.4 28.3 -64.4 64.3 -78.2
3M Basis Swap Spread -10.9 0.1 0.1 16.6 146.6 -3.3 199.1 -8.4Euribor-OIS 3M Spread 11.7 0.0 -0.6 -9.9 2.6 -88.9 20.4 -195.2
Sovereign 10Y Yield Spread 63.5 0.2 5.7 25.7 44.8 -126.6 64.9 -126.6Sovereign 5Y CDS Spread 76.8 -1.4 -3.8 -2.5 47.1 -172.8 75.3 -172.8BNP Paribas 5Y CDS Spread 141.3 -2.8 -7.3 28.3 91.2 -218.3 135.9 -218.3Crédit Agricole 5Y CDS Spread 179.8 -5.4 -7.4 46.5 117.7 -223.9 174.0 -223.9Société Générale 5Y CDS Spread 179.2 -6.4 -6.1 47.2 117.6 -261.1 173.2 -261.1
Sources: Bloomberg; and staff calculations.
Change since:2010-2011 Since 2000
(Percent)
(Basis points)
EstimateIndicator 2005 2006 2007 2008 2009 2010 2011 2012
Deposit-taking institutions 1/
Regulatory capital to risk-weighted assets 11.3 10.9 10.2 10.5 12.4 12.5 12.2 14.0
Regulatory Tier I capital to risk-weighted assets 8.2 8.2 7.7 8.5 10.2 10.7 10.9 13.3
Nonperforming loans net of provisions to capital 8.6 6.8 6.6 8.2 10.8 10.0 9.2 10.7
Bank provisions to Nonperforming loans n.a. 170 158.3 131.0 109.5 112.0 115.3 106.7
Nonperforming loans to total gross loans 3.5 3.0 2.7 2.8 3.6 3.5 3.5 4.0
Sectoral distribution of loans to total loans, of whichDeposit-takers 30.1 30.6 32.2 33.6 34.1 36.5 40.2 40.7Nonfinancial corporation 18.8 18.6 18.1 18.3 17.5 20.5 19.2 18.8Households (including individual firms) 26.5 26.6 24.8 24.1 24.5 30.5 28.7 28.9Nonresidents (including financial sectors) 4.7 4.2 4.7 4.7 4.6 6.1 5.9 5.6
ROA (aggregated data on a parent-company basis) 2/ 0.6 0.6 0.4 0.0 0.4 0.3 0.0 0.2ROA (main groups on a consolidated basis) 3/ 0.49 0.57 0.35 0.1 0.3 0.6 0.4 0.3ROE (aggregated data on a parent-company basis) 2/ 11.8 14.0 9.8 -1.0 8.2 7.9 1.2 5.5ROE (main groups on a consolidated basis) 3/ 13.5 17.22 13.34 3.8 6.4 11.8 8.2 6.6
Interest margin to gross income 32.4 28.2 25.3 40.4 34.9 49.4 51.5 41.4
Noninterest expenses to gross income 64.3 62.4 68.4 84.2 63.1 65.7 67.4 63.2
Liquid assets to total assets 20.5 19.9 18.9 18.3 18.3 23.0 24.1 26.2Liquid assets to short-term liabilities 150.1 146.7 150.3 139.6 150.1 144.4 136.3 164.0
Net open position in foreign exchange to capitalNet open positions in FX (in millions of euros) 4/ 5275 5,283 7,058 n.a. n.a. n.a. n.a. n.a.Net open positions in equities to Tier I capital n.a. n.a. n.a. n.a. n.a. n.a. n.a. n.a.
Sources: Banque de France, ACP
1/ These may be grouped in different peer groups based on control, business lines, or group structure.2/ All credit institutions' aggregated data on a parent-company basis.3/ Consolidated data for the seven main banking groups (2005, IFRS).4/ Impact of the creation of the euro has to be taken into account.

FRANCE
INTERNATIONAL MONETARY FUND 47
Table 7. Encouraged Financial Soundness Indicators, 2005–12 (In percent unless otherwise indicated)
EstimateIndicator 2005 2006 2007 2008 2009 2010 2011 2012
Corporate sectorTotal debt to equity 71.0 59.2 55.1 87.5 78.4 77.7 87.8 85.7Return on equity 5.2 4.4 4.0 5.6 4.5 4.5 4.7 4.6Interest paid to financial firms 1/ 8.8 9.7 11.5 13.7 9.9 8.8 10.1 n.a.Corporate net foreign exchange exposure to equity n.a. n.a. n.a. n.a. n.a. n.a. n.a. n.a.Number of enterprise bankruptcies (thousands) n.a. n.a. n.a. n.a. n.a. n.a. n.a. n.a.Number of enterprise creations (thousands) n.a. n.a. n.a. n.a. n.a. n.a. n.a. n.a.
Deposit-taking institutions Capital (net worth) to assets 4.4 4.5 4.1 4.2 4.5 4.6 5.5 4.8International consolidated claims of French banks, of which(BIS data, as percent of total international claims)
Advanced countries 83.7 85.1 84.0 84.2 83.3 79.8 79.4 78.0Developing Europe 2.8 3.2 4.0 4.3 4.6 5.7 6.0 7.1Latin America and Caribbean 1.1 0.9 1.0 1.1 1.2 1.4 1.4 1.5Africa and Middle East 3.1 2.6 2.6 3.1 3.5 4.4 5.1 5.2Asia and Pacific Area 2.6 2.5 2.9 2.6 2.9 4.0 3.6 4.1Offshore Financial Centers 6.6 5.6 5.5 4.7 4.4 4.7 4.6 4.1
Gross asset position in financial derivatives to capital 543.7 337.0 235.0 633.2 362.7 286.2 388.8 346.2Gross liability position in financial derivatives to capital 484.7 293.0 227.0 616.3 361.9 286.7 388.0 346.0Large exposures to capital 3.6 1.4 4.7 3.1 4.1 14.1 26.9 7.6Trading income to total income 23.9 26.0 16.8 -63.9 16.4 10.3 -13.2 6.4Personnel expenses to noninterest expenses 58.3 54.0 53.3 51.6 61.1 44.9 42.1 36.0Spread between reference lending and deposit rates 215 226 232 218 237 246 227 219Spread between highest and lowest interbank rate n.a. n.a. n.a. n.a. n.a. n.a. n.a. n.a.Customer deposits to total (noninterbank) loans 83.5 80.5 77.4 78.0 85.3 79.5 78.4 67.9FX loans to total loans 2/ 12.0 11.4 11.3 10.5 10.4 9.8 8.9 8.4FX liabilities to total liabilities 17.8 18.6 18.1 16.8 15.3 16.4 15.4 13.9Net open position in equities to capital n.a. n.a. n.a. n.a. n.a. n.a. n.a. n.a.
Market liquidityAverage bid-ask spread in the securities market 3/ n.a. n.a. n.a. n.a. n.a. n.a. n.a. n.a.Average daily turnover ratio in the securities market n.a. 7.0 7.7 5.4 3.4 4.3 n.a. n.a.
Other financial corporationsAssets to total financial system assets 20.2 20.9 20.6 19.7 20.9 20.3 19.0 19.5Assets to GDP 180.8 207.8 223.1 207.4 227.5 214.2 200.5 211.4
HouseholdsHousehold debt to GDP 42.1 44.6 47.1 49.3 53.1 54.6 55.7 56.0
Household debt service and principal payments to income 12.9 14.5 12.1 11.7 12.3 13.2 13.0 12.7Real estate markets
Real estate prices 14.8 10.0 5.5 -3.8 -4.2 7.7 3.7 -1.7Residential real estate loans to total loans n.a. n.a. n.a. n.a. n.a. n.a. n.a. n.a.Commercial real estate loans to total loans n.a. n.a. n.a. n.a. n.a. n.a. n.a. n.a.
Sources: Banque de France ; ACP ; BIS ; Ministère des Finances1/ In percent of financial firms' gross operating surplus.2/ Data cover interbank and customer lending to residents and nonresidents on a metropolitan basis.
3/ Or in other markets that are most relevant to bank liquidity, such as foreign exchange markets.
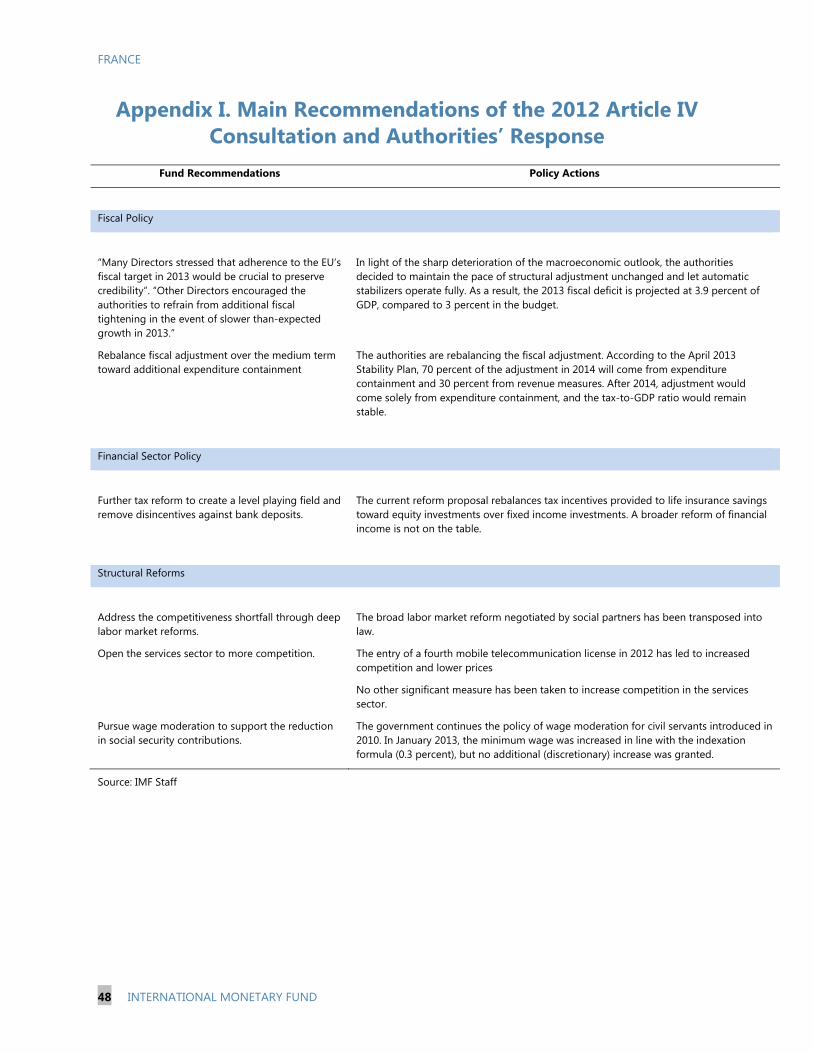
FRANCE
48 INTERNATIONAL MONETARY FUND
Appendix I. Main Recommendations of the 2012 Article IV Consultation and Authorities’ Response
Fund Recommendations Policy Actions
Fiscal Policy
“Many Directors stressed that adherence to the EU’s fiscal target in 2013 would be crucial to preserve credibility”. “Other Directors encouraged the authorities to refrain from additional fiscal tightening in the event of slower than-expected growth in 2013.”
In light of the sharp deterioration of the macroeconomic outlook, the authorities decided to maintain the pace of structural adjustment unchanged and let automatic stabilizers operate fully. As a result, the 2013 fiscal deficit is projected at 3.9 percent of GDP, compared to 3 percent in the budget.
Rebalance fiscal adjustment over the medium term toward additional expenditure containment
The authorities are rebalancing the fiscal adjustment. According to the April 2013 Stability Plan, 70 percent of the adjustment in 2014 will come from expenditure containment and 30 percent from revenue measures. After 2014, adjustment would come solely from expenditure containment, and the tax-to-GDP ratio would remain stable.
Financial Sector Policy
Further tax reform to create a level playing field and remove disincentives against bank deposits.
The current reform proposal rebalances tax incentives provided to life insurance savings toward equity investments over fixed income investments. A broader reform of financial income is not on the table.
Structural Reforms
Address the competitiveness shortfall through deep labor market reforms.
The broad labor market reform negotiated by social partners has been transposed into law.
Open the services sector to more competition. The entry of a fourth mobile telecommunication license in 2012 has led to increased competition and lower prices
No other significant measure has been taken to increase competition in the services sector.
Pursue wage moderation to support the reduction in social security contributions.
The government continues the policy of wage moderation for civil servants introduced in 2010. In January 2013, the minimum wage was increased in line with the indexation formula (0.3 percent), but no additional (discretionary) increase was granted.
Source: IMF Staff

Appendix II. Overview of Main Structural Reforms
Measure Description Status
Product Market and Regulatory Reform
Reducing the labor tax wedge Crédit d'Impôt pour la Compétitivité et l'Emploi EUR 20 billion (1 percent of GDP) allocated to reduce the labor tax wedge through a
corporate tax credit linked to the payroll (excluding wages above 2.5 times the minimum wage). The tax credit is phased in over three years. The rebate amounts to a 3 percent cut in labor costs. The tax credit will be financed in equal measure by revenue measures (VAT and a new green tax) and expenditure measures
Implementation in course
Fiscal support to investment activities by SMEs Existing tax incentives, including rebates for research SME investments, will be kept over the next 5 years
Commitment
Rationalizing public guarantees to SMEs Public support was channeled through OSEO, the CDC enterprises and the Strategic Investment Fund until 2012
The Public Investment Bank (BPI), created in 2012 by merging the three existing public investment entities, will provide about EUR 42 billion in the form of public guarantees and equity participations to SMEs in 2013. New government guarantees worth EUR 500 million will be provided to ease financing schemes of SMEs
Implementation in course
Supporting SMEs’ presence in foreign markets
The BPI will provide personalized help to 1,000 SMEs and intermediate-sized firms to access and expand their presence in international markets; the revamped export bpifrance label (an enhanced partnership between bpifrance, Coface and UBIFRANCE) will provide easier access to export-financing products, and assist enterprises more effectively. A new "export development loan" will be created; international corporate volunteers will be increased by 25 percent over the next three years to assist SMEs with market prospection; a "France Brand" will be launched to promote French products
Commitment
Upgrading the industrial base Investissements d'avenir program towards priority sectors (politique industrielle de filières)
EUR 35 billion program over ten years to promote innovation in enterprises; priority sectors include renewable energy and health; the National Conference of Industry will be restructured to better manage the "contrats de filières" (reciprocal commitments of industry and the state to reinforce competitiveness within specific sectors)
"contrats de filières" have already been signed for a number of sectors, including, automobile, aircraft and railway construction, nuclear, chemistry, fashion and luxury, and food
FRANCE
INTERN
ATION
AL MO
NETARY FU
ND
49
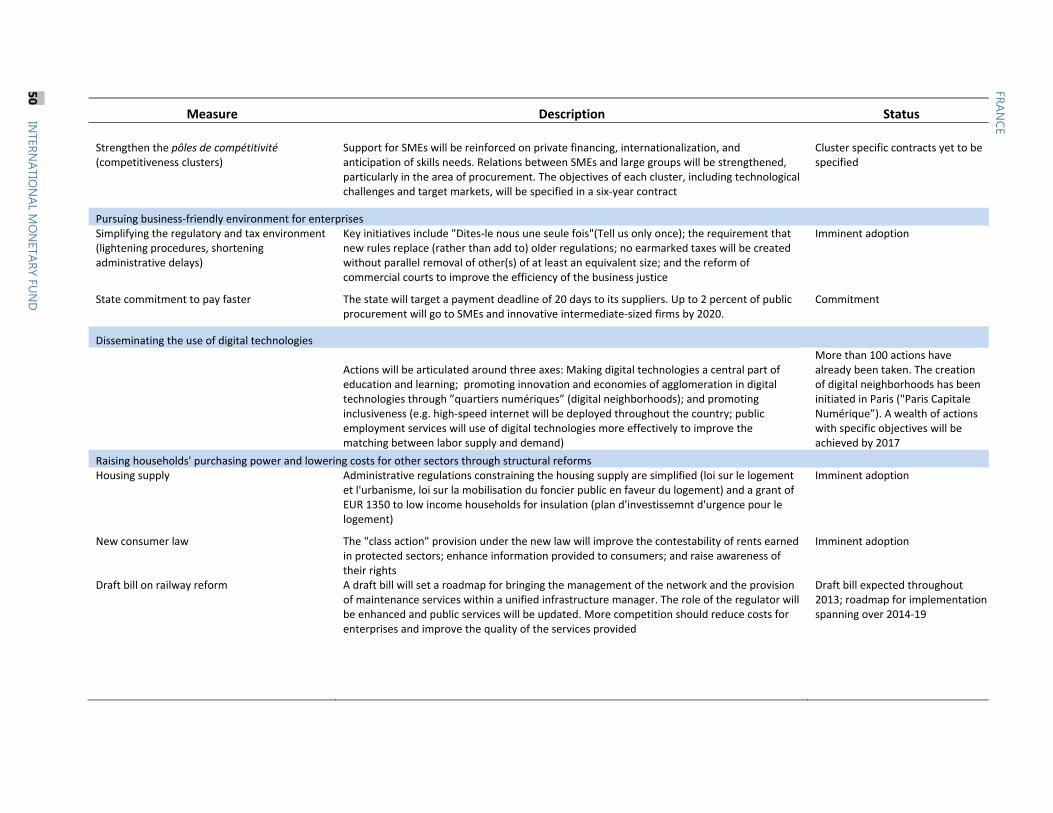
Measure Description Status
Strengthen the pôles de compétitivité (competitiveness clusters)
Support for SMEs will be reinforced on private financing, internationalization, and anticipation of skills needs. Relations between SMEs and large groups will be strengthened, particularly in the area of procurement. The objectives of each cluster, including technological challenges and target markets, will be specified in a six-year contract
Cluster specific contracts yet to be specified
Pursuing business-friendly environment for enterprises Simplifying the regulatory and tax environment (lightening procedures, shortening administrative delays)
Key initiatives include "Dites-le nous une seule fois"(Tell us only once); the requirement that new rules replace (rather than add to) older regulations; no earmarked taxes will be created without parallel removal of other(s) of at least an equivalent size; and the reform of commercial courts to improve the efficiency of the business justice
Imminent adoption
State commitment to pay faster The state will target a payment deadline of 20 days to its suppliers. Up to 2 percent of public procurement will go to SMEs and innovative intermediate-sized firms by 2020.
Commitment
Disseminating the use of digital technologies
Actions will be articulated around three axes: Making digital technologies a central part of education and learning; promoting innovation and economies of agglomeration in digital technologies through ”quartiers numériques” (digital neighborhoods); and promoting inclusiveness (e.g. high-speed internet will be deployed throughout the country; public employment services will use of digital technologies more effectively to improve the matching between labor supply and demand)
More than 100 actions have already been taken. The creation of digital neighborhoods has been initiated in Paris ("Paris Capitale Numérique”). A wealth of actions with specific objectives will be achieved by 2017
Raising households' purchasing power and lowering costs for other sectors through structural reforms Housing supply Administrative regulations constraining the housing supply are simplified (loi sur le logement
et l'urbanisme, loi sur la mobilisation du foncier public en faveur du logement) and a grant of EUR 1350 to low income households for insulation (plan d'investissemnt d'urgence pour le logement)
Imminent adoption
New consumer law The "class action" provision under the new law will improve the contestability of rents earned in protected sectors; enhance information provided to consumers; and raise awareness of their rights
Imminent adoption
Draft bill on railway reform A draft bill will set a roadmap for bringing the management of the network and the provision of maintenance services within a unified infrastructure manager. The role of the regulator will be enhanced and public services will be updated. More competition should reduce costs for enterprises and improve the quality of the services provided
Draft bill expected throughout 2013; roadmap for implementation spanning over 2014-19
FRANCE
50 IN
TERNATIO
NAL M
ON
ETARY FUN
D

Measure Description Status
Measures to Curb Unemployment
New contractual arrangements to promote youth's job inclusiveness Emplois d'avenir Emplois d'avenir are open-ended contracts or fixed-term arrangements longer than 3 years
addressed to low-skilled workers. The employer commits to a reinforced training program and receives, in return, a subsidy of up to 75 percent of the minimum wage in the non-market sector (35 percent in the market sector). The target is to create 150,000 jobs under this scheme by end-2014.
Implemenation in course
Contrats de génération Firms hiring young workers on open-ended contracts while preserving the jobs of their senior employees benefit from a yearly lump-sum of EUR 4,000 (per worker hired) during the 3-year term following recruitment. These contracts are meant to facilitate the intergenerational transmission of knowledge. The target is to create 500,000 jobs under this scheme over the next five years (of which 100,000 by end-2013).
Implementation in course
Strenghtening incentives to exit unemployment Reform of the unemployment insurance Objective of the reform is to close the deficit of the unemployment insurance system
(0.13 percent of GDP in 2012). Choice of parametric reform (raising contributions vs. tightening benefits and eligibility) will have an impact on labor market outcomes.
Unemployment insurance is managed by social partners who have primary responsibility for its reform. The government will launch the process at the June 2013 social conference.
Reform of professional training The current system is ill-targeted, besides suffering from non-transparent financing. To improve the effectiveness of training throughout life, the labor market reform passed into law in May 2013 promotes portability of training rights through the creation of a personal account. This will be followed by more comprehensive reform later this year to direct it to those who need it most (jobseekers, less skilled workers, youth). The regions will have more prominent role in the administration of training funds. Target of the reform is also to generate fiscal savings of EUR 1.3 billion (0.06 percent of GDP). The adult training systems costs 1.5 percent of GDP (including contributions by the state and social partners)
The reform falls in part under the responsibility of social partners because they contribute to the funding of job training. The government will launch the process at the June 2013 social conference, with a view to having a reform before parliament by end-2013.
FRANCE
INTERN
ATION
AL MO
NETARY FU
ND
51

Measure Description Status
Public Spending
Modernisation de l'action publique Audit by 2017 all public policies with a view to reduce their fiscal cost, to increase policies efficiency, and to simplify them: 40 audits (covering 20 percent of General Government spending) were launched in the first half of 2013 and 9 additional ones will be launched in the second half of 2013. These audits include family allowances, professional training, and subsidies to firms (see below).
Being implemented
Pension reform ● The pension reform aims at ensuring the financial sustainability, increasing the fairness of the system, and simplifying it. The deficit should be reduced starting in 2014 with a view to reaching financial balance at the latest in 2020. The means to achieve this objective will be discussed with the social partners based on the analytical input by the Conseil d'orientation des retraites (COR) and the reform proposals by the Commission pour l’avenir des retraites (CAR).
Preparatory diagnostic by the COR was completed in January 2013. A report by the CAR was done in June 2013. Discussions with the social partners began in June, with a view to have a draft reform before parliament by end-2013.
● Social partners agreed to a 3-year under-indexation) of supplementary pensions (under the mandatory system of retraites complémentaires) and an increase in contributions by 0.2 percentage points. Estimated fiscal gain: EUR 1 billion in 2014 (0.05 percent of GDP) of which EUR 0.7 billion from the increase in contributions.
Implemented as of April 1, 2014
Health spending Tightening of the spending growth ceiling (ONDAM) to 2.6 percent in 2014 and 2.5 percent during 2015-17 (trend growth is estimated at above 4 percent). Estimated fiscal saving of EUR 3 billion in 2014 (0.14 percent of GDP).
Done
Family allowances The law caps tax expenditure which benefits mostly families with children (quotient familial). Estimated fiscal gain: EUR 1 billion in 2014 (0.05 percent of GDP). Total spending on family allowances (tax expenditure plus outright transfers) was 2.8 percent of GDP in 2012.
Done
State subsidies to firms Targeted reduction by EUR 2 billion by 2015 (0.1 percent of GDP out of a total subsidies of 1.8 percent of GDP, and 2.8 percent when tax expenditures are included)
Announced
Decentralization Three laws will reinforce decentralization by transferring additional competencies from the center to local governments (regional transport, student housing, promotion of local languages) while clarifying responsibilities of each level of government so as to avoid duplication. Introduction of larger metropolitan area authorities (beyond city boundaries) to rationalize spending.
The first draft law is under discussion in Parliament. Parliament will discuss the second draft law in the fall. The third law will be discussed in 2014
FRANCE
52 IN
TERNATIO
NAL M
ON
ETARY FUN
D

Measure Description Status
Financial Sector Reforms
Draft Law on Banking Reform Separation of Activities French banks will have to separate "speculative activities" but without a drastic change to
their business model. By July 1, 2015 French banks will have to isolate their proprietary trading activities in a subsidiary separately capitalized and self-funded. The trading entity will be prohibited from: (i) ownership of, or unsecured lending to, hedge funds; (ii) high-frequency trading; and (iii) involvement in agricultural commodity derivatives. Banks will continue to provide a wide range of services to their clients under the universal banking model, including hedging, financing, and investment. In contrast to the EU-wide proposals of the Liikanen Committee, market-making activities will be permitted within the bank, on grounds that they support market liquidity and hence benefit clients
The draft law is under discussion in Parliament. The reform is expected to be adopted by the summer of 2013. See: http://legifrance.gouv.fr/affichLoi Preparation.do;jsessionid=958694 DAFC9034DD63CBBDC4791570A9. Tpdjo04v_2?idDocument=JORFDOL E000026795365&type=general
Bank Resolution ● The draft law aligns the resolution regime to the draft EU Recovery and Resolution Directive. The new regime requires recovery and resolution plans for large banks and investment companies. It also gives the banking supervisor new responsibilities for banking crisis preparedness and resolution, under the new name of Autorité de Contrôle Prudentiel et de Résolution (ACPR)
● The draft law also allows the ACPR To involve the deposit guarantee fund in bank resolution, under the new name of the Fonds de Garantie des Dépôts et de Résolution
● The draft law gives the authorities powers to separate failing entities into good and bad banks and to establish bridge banks, in line with FSAP Update recommendations, and will gradually increase the prefunding of the deposit guarantee fund from the current €2 billion to €10 billion
Macroprudential Surveillance The institutional framework for macroprudential surveillance will be strengthened. The draft law broadens the powers of the current structure (Conseil de régulation financière et du risque systémique) under a new name of Haut conseil de stabilité financière (HCSF). The HCSF’s composition will remain unchanged (Minister of Finance, Governor of Banque de France, Vice-President of ACP, Presidents of Autorité des Marchés Financiers and of Autorité des Normes Comptables, as well as three independent board members). The HCSF will be able to recommend measures to maintain financial stability, including a capital surcharge on banks during periods of "financial bubbles" "; activation of the measures will be only possible following a proposal by the Governor of the Banque de France, who will be solely entrusted with this responsibility. The HCSF’s powers to implement macroprudential measures will be legally binding, consistent with the provisions of the Capital Requirement Directive IV/Capital Requirement Regulation.
INTERN
ATION
AL MO
NETARY FU
ND
53

Measure Description Status
Supervisory Powers Supervisory powers over governance of financial institutions will be strengthened, in line with FSAP Update recommendations. ACPR will be able to oppose the nomination of managers of credit institutions, investment firms, and insurance companies, if they do not meet fit-and-proper requirements. ACPR will also be able to suspend managers during their mandate. Other measures will also broaden the powers of the securities regulator
Raise financing available to small- and medium-sized enterprises (SMEs), social housing, and high-growth sectors Higher ceilings on regulated savings products The ceilings on the LDD and Livret A will be doubled to increase supply of financing for social
housing and SMEs (the former through CDC loans for the construction of social housing and the latter through refinancing facilities at the BPI)
The ceiling on the LDD was doubled from €6,000 to €12,000 in October 2012. The ceiling on the Livret A was raised by 50 percent in two steps (October 2012 and January 2013), to the current amount of €22,950. No further increases in the Livret A ceiling have been announced
Reform of tax incentives for life insurance policies
● The Berger-Lefèbvre report (hereafter, Report) recommends making tax incentives for life insurance policies that carry a capital guarantee (i.e., contrats en euros)conditional on a minimum risk investment (e.g., in contrats en unités de compte, contrats euros-diversifiés, or the new contrats Euro croissance) past a €500,000 amount. About 1 percent of the households that own life insurance savings are expected to be affected by this measure
Measures based on the recommendations of the report are expected to be passed in the 2014 budget
● The Report also recommends extending fiscal incentives (with no ceiling) to a new contrat Euro croissance (life insurance product with capital guaranteed only at maturity). By removing the liquidity constraint resulting from the need to provide a capital guarantee throughout the life of the policy, insurers are expected to be able to invest the proceeds in riskier, long-duration, assets, including unlisted equity
Raise equity financing of high-growth sectors and SMEs
The report recommends the creation of a Plan d'épargne en actions-PME (investment product in equity of SMEs), modelled on the existing Plan d'épargne en actions (vehicle for investments in listed stocks or stock mutual funds with income and capital gains exempt from income tax if held for a minimum of 5 years), and which would be open to both retail and institutional investors.
Under consideration
FRANCE
54 IN
TERNATIO
NAL M
ON
ETARY FUN
D

Measure Description Status
Access by SMEs to market-intermediated credit A securitization company will be created to issue asset backed securities (ABS) backed by bank loans to SMEs. Only loans currently eligible for re-financing at the Banque de France will be accepted for securitization. The Banque de France will publish ratings for the ABS on the basis of the ratings it already prepares for the SME universe concerned (and which are currently used by banks as input in the origination process)
Announced. A first ABS issuance is expected in October 2013
Banque Publique d'Investissements (BPI) Existing support programs to innovation and SMEs will be rearranged within the BPI, with the goal of channeling public funds more efficiently
The BPI is expected to start operations in 2013
Sources: National Reform Program 2013, French authorities, Competitiveness pact, IMF staff.
1/ Government's response to the Gallois report.
FRANCE
INTERN
ATION
AL MO
NETARY FU
ND
55
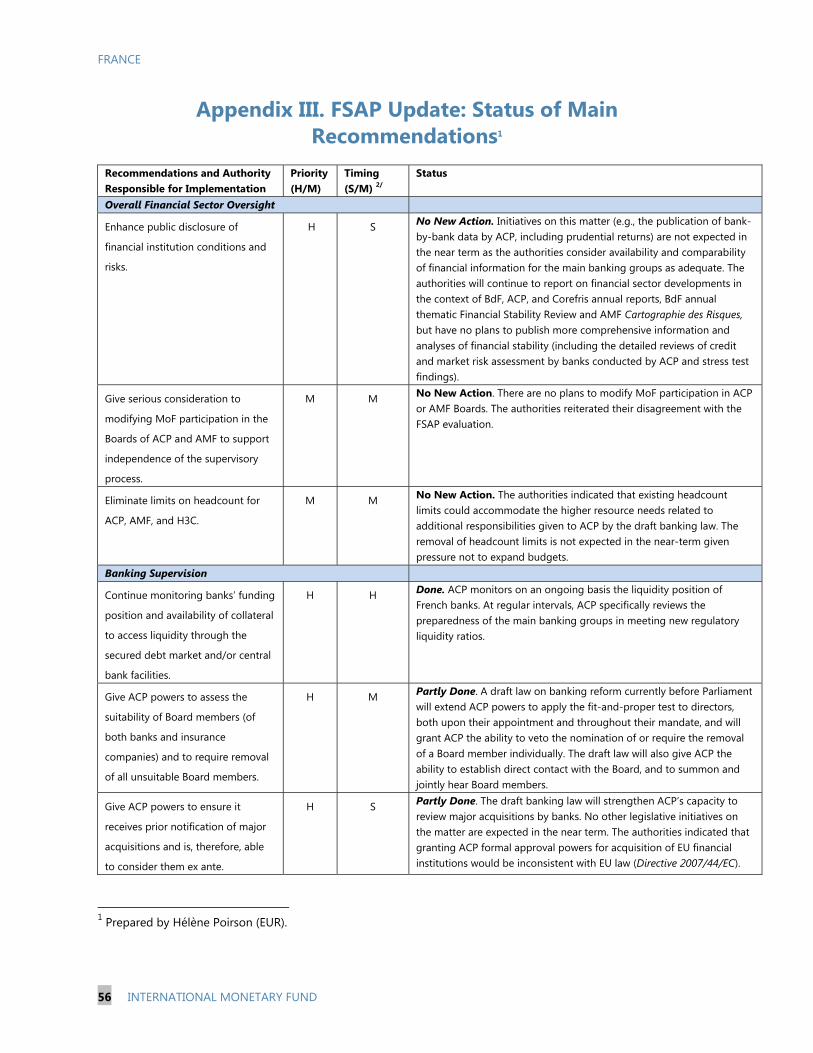
FRANCE
56 INTERNATIONAL MONETARY FUND
Appendix III. FSAP Update: Status of Main Recommendations1
Recommendations and Authority Responsible for Implementation
Priority (H/M)
Timing (S/M) 2/
Status
Overall Financial Sector Oversight
Enhance public disclosure of
financial institution conditions and
risks.
H S No New Action. Initiatives on this matter (e.g., the publication of bank-by-bank data by ACP, including prudential returns) are not expected in the near term as the authorities consider availability and comparability of financial information for the main banking groups as adequate. The authorities will continue to report on financial sector developments in the context of BdF, ACP, and Corefris annual reports, BdF annual thematic Financial Stability Review and AMF Cartographie des Risques, but have no plans to publish more comprehensive information and analyses of financial stability (including the detailed reviews of credit and market risk assessment by banks conducted by ACP and stress test findings).
Give serious consideration to
modifying MoF participation in the
Boards of ACP and AMF to support
independence of the supervisory
process.
M M No New Action. There are no plans to modify MoF participation in ACP or AMF Boards. The authorities reiterated their disagreement with the FSAP evaluation.
Eliminate limits on headcount for
ACP, AMF, and H3C.
M M No New Action. The authorities indicated that existing headcount limits could accommodate the higher resource needs related to additional responsibilities given to ACP by the draft banking law. The removal of headcount limits is not expected in the near-term given pressure not to expand budgets.
Banking Supervision
Continue monitoring banks’ funding
position and availability of collateral
to access liquidity through the
secured debt market and/or central
bank facilities.
H H Done. ACP monitors on an ongoing basis the liquidity position of French banks. At regular intervals, ACP specifically reviews the preparedness of the main banking groups in meeting new regulatory liquidity ratios.
Give ACP powers to assess the
suitability of Board members (of
both banks and insurance
companies) and to require removal
of all unsuitable Board members.
H M Partly Done. A draft law on banking reform currently before Parliament will extend ACP powers to apply the fit-and-proper test to directors, both upon their appointment and throughout their mandate, and will grant ACP the ability to veto the nomination of or require the removal of a Board member individually. The draft law will also give ACP the ability to establish direct contact with the Board, and to summon and jointly hear Board members.
Give ACP powers to ensure it
receives prior notification of major
acquisitions and is, therefore, able
to consider them ex ante.
H S Partly Done. The draft banking law will strengthen ACP’s capacity to review major acquisitions by banks. No other legislative initiatives on the matter are expected in the near term. The authorities indicated that granting ACP formal approval powers for acquisition of EU financial institutions would be inconsistent with EU law (Directive 2007/44/EC).
1 Prepared by Hélène Poirson (EUR).

FRANCE
INTERNATIONAL MONETARY FUND 57
Recommendations and Authority Responsible for Implementation
Priority (H/M)
Timing (S/M) 2/
Status
Require full and consistent
disclosure of the capital treatment
in place and the related financial
interactions within complex groups.
H S No New Action. The exemption allowing the more lenient EU capital treatment by bancassurance groups was allowed to end at end-2012, as stated by the authorities at the time of the 2012 FSAP update. On the matter of disclosure of current treatment and the related financial interactions within complex groups, there are no plans to revise disclosure requirements. The authorities reiterated their disagreement with the FSAP evaluation.
Insurance Supervision
Introduce enforceable legal and
regulatory corporate governance
requirements.
H M Ongoing. Revisions to corporate governance requirements are ongoing. The EIOPA Guidelines related to the preparation for Solvency II currently under public consultation will require the introduction of systems of governance, internal control, and risk management based on clear and formalized procedures subject to approval at the highest managerial level. The recommendations are being considered for legislation.
Require insurance companies to
have internal audit and actuarial
control functions.
H M Ongoing. Revisions to internal audit and actuarial control functions’
requirements are ongoing. The EIOPA Guidelines related to the
preparation for Solvency II currently under public consultation will
require the introduction of four key functions, amongst which internal
audit and actuarial function. The recommendations are being
considered for legislation.
Enhance insurance companies’
disclosures, including on valuation
of technical provisions; risk
exposures and concentrations; risk
management; corporate
governance; and sensitivity results
from forms of stress testing.
H S Ongoing. Revisions to data reporting requirements are ongoing. The Solvency II Directive will require enhanced disclosures. The date of entry into force of the Solvency II regime is however still uncertain due to delays in adopting the Omnibus II Directive.
Securities Regulation
Establish stronger conflict-of-
interest arrangements to govern
industry participation in the AMF
Board.
H M No New Action. There are no plans to modify the composition of AMF Board. The authorities reiterated their disagreement with the FSAP evaluation.
Strengthen AMF’s supervision of
investment service providers and
financial advisors by increasing
onsite work, including inspections.
H S Partly Done. AMF has reviewed all the associations of financial
investment advisors (CIF) between 2012 and early 2013 to assess
their capacity to inspect and control their members. AMF is still
designing its supervisory approach for supervision of CIF. This
approach could be announced in the context of the new AMF
strategic plan which sets priorities for coming years.
Provide greater enforcement
powers to the H3C and increase its
staffing levels.
M M Partly Done. H3C is expanding the number of staff dedicated to
supervision of commissaires aux comptes and this trend is expected
to continue in the near-term. An audit reform is currently under
negotiation at the European level and should results in

FRANCE
58 INTERNATIONAL MONETARY FUND
Recommendations and Authority Responsible for Implementation
Priority (H/M)
Timing (S/M) 2/
Status
strengthening of H3C powers.
Resolution Framework
Modify composition of Fonds de
Garantie des Dépôts (FGD) Board to
limit the potential for conflict of
interest.
H M No New Action. There are no plans to change the composition of the FGD Supervisory Board.
Expand FDG’s powers in the
resolution process, so as to assume
assets and liabilities from a failing
bank.
H S Partly Done. The draft banking law allows the FGD to be involved in bank resolution under the new name of FGDR (Fonds de Garantie des Dépôts et de Résolution),in association with the renamed banking supervisor, ACPR (Autorité de Contrôle Prudentiel et de Résolution).
Central Counterparties
LCH.Clearnet SA should measure its
exposures continuously throughout
the business day.
H S Partly Done. The central counterparty is able to calculate multiple intra-day margin calls as prices and positions change. For fixed-income instruments, one automatic intraday margin call is calculated. For CDS, a margin call is done upon initiation of the operation independently of all netting. Margin calls are manually triggered for cash& derivatives.
Carry out annually an external audit
of LCH.Clearnet SA business
continuity plan, including that of the
in-sourcing company.
H M Partly Done. Implementation is still on-going. In compliance with the authorization process under European Market Infrastructure Regulation (EMIR), ACP will conduct an audit of LCH.Clearnet SA’s business continuity plan. Consistent with EMIR obligations, internal rules of LCH.Clearnet SA will require an annual external audit of the BCP. Moreover, contractual arrangements with the providers of business continuity services were modified to allow for the possibility of external audit at any time.
AML/CFT
Strengthen the implementation of
AML/CFT measures in the overseas
territories.
H M Partly Done. An agreement covering the financial aspects of the December 19, 2011 agreement between ACP and the overseas issuance institutes (IEDOM and IEOM) was signed on September 10, 2012. These agreements enlarge the mandate of the institutes to cover AML/CFT, including provision of assistance to the ACP’s onsite controls. On November 23, 2012, the Ministry of Justice released two circulars to remind prosecutors (including in overseas departments and territories) to be vigilant and deepen exchanges with TRACFIN.
Complete legislation to enable the
authorities to seize laundered
property.
H M Done. The law nº2010-768 dated July 9, 2010 was strengthened by the provisions of the law nº 2012-409 dated March 27, 2012, which aims to (i) generalize the seizure and the confiscation of property value up to an amount commensurate with the crime and (ii) enable the authorities to seize and confiscate property which the condemned person not only owns but also has free disposal of.
2/ H/M: indicates high or medium priority level. S/M: indicates the time span in which the recommendation could be implemented
(short or medium term).

FRANCE
INTERNATIONAL MONETARY FUND 59
Appendix IV. Debt Sustainability Analysis 1
A. Background
1. Debt ratio. The combined effect of low growth over several years and the persistence of high fiscal deficits (due to the impact of large automatic stabilizers and of the fiscal stimulus) have increased the debt-to-GDP ratio by 26 percentage points in five years to 90.2 percent in 2012. Part of the increase (2.4 percent of GDP as of end-2012) reflects financial support to other Euro area countries.2 Such support is projected to increase to 3.3 percent of GDP by 2014. The debt ratio would continue to increase in the short term peaking at 95 percent of GDP in 2014-15 and decline thereafter.
2. Sovereign yields. Currently, yields on French debt are at historically low levels. The benchmark yield (10 years) has declined from 4.7 percent in July 2008 about 2.2 percent in mid-July 2013. The spreads over German Bunds, which had increased to almost 200 basis points in November 2011, were back to 57 basis points at mid-July 2013.
1 Prepared by Jean-Jacques Hallaert (EUR). 2 Bilateral loans (direct and through the EFSF to Greece, Ireland, and Portugal) and contributions to the ESM.
88.2
91.488.7
65
70
75
80
85
90
95
100
2008 2009 2010 2011 2012 2013 2014 2015 2016 2017 2018
Authorities' projections
IMF baseline
Debt-to-GDP ratio(Percent)
Sources: French authorities and IMF staff.
0.0
0.5
1.0
1.5
2.0
2.5
3.0
3.5
4.0
1 3 5 7 9 11 13 15 17 19 21 23 25 27 29 31 33 35 37 39 41 43 45 47 49 51Maturity in Years
10/2011
4/2013 (trough)
5/2013
French Government Yield Curve (quote at the end of the month, in percent)
Sources: French Authorities.
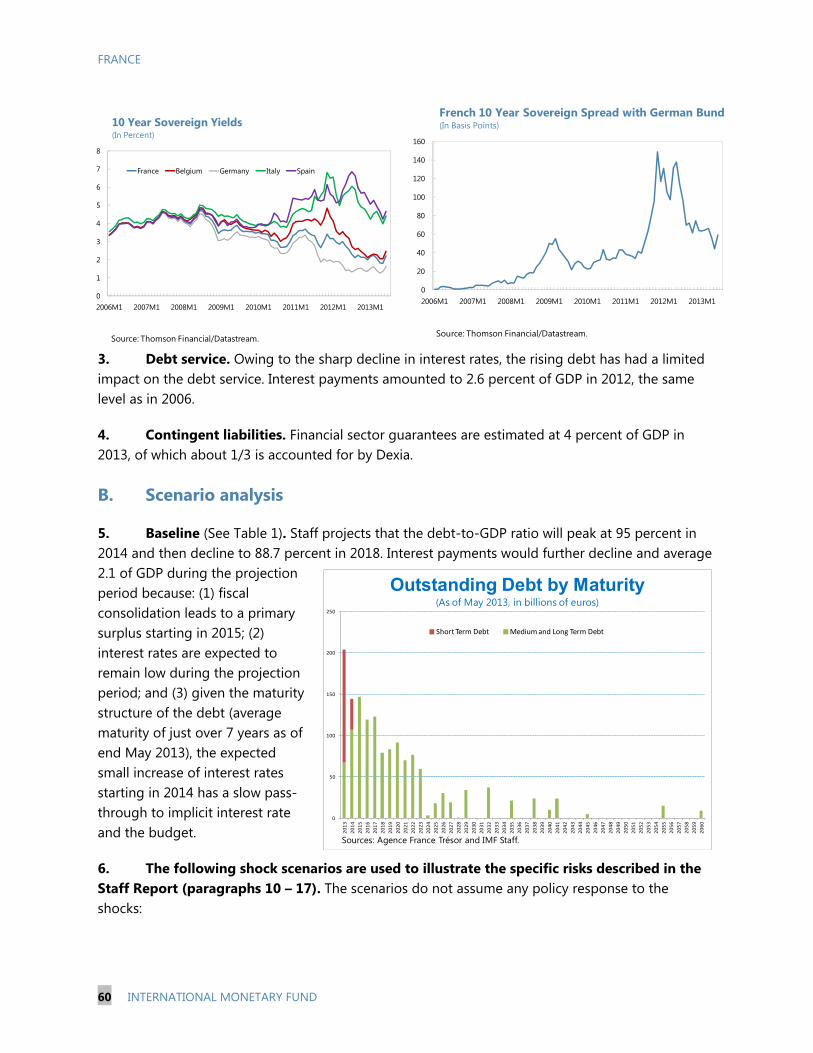
FRANCE
60 INTERNATIONAL MONETARY FUND
3. Debt service. Owing to the sharp decline in interest rates, the rising debt has had a limited impact on the debt service. Interest payments amounted to 2.6 percent of GDP in 2012, the same level as in 2006.
4. Contingent liabilities. Financial sector guarantees are estimated at 4 percent of GDP in 2013, of which about 1/3 is accounted for by Dexia.
B. Scenario analysis
5. Baseline (See Table 1). Staff projects that the debt-to-GDP ratio will peak at 95 percent in 2014 and then decline to 88.7 percent in 2018. Interest payments would further decline and average 2.1 of GDP during the projection period because: (1) fiscal consolidation leads to a primary surplus starting in 2015; (2) interest rates are expected to remain low during the projection period; and (3) given the maturity structure of the debt (average maturity of just over 7 years as of end May 2013), the expected small increase of interest rates starting in 2014 has a slow pass-through to implicit interest rate and the budget.
6. The following shock scenarios are used to illustrate the specific risks described in the Staff Report (paragraphs 10 – 17). The scenarios do not assume any policy response to the shocks:
0
50
100
150
200
250
20
13
20
14
20
15
20
16
20
17
20
18
20
19
20
20
20
21
20
22
20
23
20
24
20
25
20
26
20
27
20
28
20
29
20
30
20
31
20
32
20
33
20
34
20
35
20
36
20
37
20
38
20
39
20
40
20
41
20
42
20
43
20
44
20
45
20
46
20
47
20
48
20
49
20
50
20
51
20
52
20
53
20
54
20
55
20
56
20
57
20
58
20
59
20
60
Sources: Agence France Trésor and IMF Staff.
Outstanding Debt by Maturity(As of May 2013, in billions of euros)
Short Term Debt Medium and Long Term Debt
0
1
2
3
4
5
6
7
8
2006M1 2007M1 2008M1 2009M1 2010M1 2011M1 2012M1 2013M1
France Belgium Germany Italy Spain
10 Year Sovereign Yields (In Percent)
Source: Thomson Financial/Datastream.
0
20
40
60
80
100
120
140
160
2006M1 2007M1 2008M1 2009M1 2010M1 2011M1 2012M1 2013M1
French 10 Year Sovereign Spread with German Bund(In Basis Points)
Source: Thomson Financial/Datastream.

FRANCE
INTERNATIONAL MONETARY FUND 61
7. Slow recovery. Under this scenario, real GDP is assumed to remain flat in 2014 and to grow only gradually thereafter to 1 percent by 2018. As a result, the debt-to-GDP would increase to 99½ percent in 2018, despite the implementation of the medium term fiscal consolidation. Such as scenario could result from the convergence of a number of adverse developments including, an external demand shortfall and weak confidence in the euro area resolution strategy, failure to implement domestic structural reforms, and additional bank deleveraging affecting domestic credit growth.
8. Fiscal policy slippage. In line with standard DSA shocks, one scenario assumes a permanent increase in primary spending of 1 percent of GDP starting in 2014. The second scenario assumes that the expenditure containment policy spending growth returns to its trend (1.5 percent in real terms) starting in 2014. The latter scenario has a more adverse effect and illustrates the importance of expenditure containment for the success of the consolidation strategy.
99.4
88.7
65
70
75
80
85
90
95
100
105
2008 2009 2010 2011 2012 2013 2014 2015 2016 2017 2018
Growth shock
Baseline
Growth Shock(Percent per year)
Sources: IMF staff estimates.
93.4
97.7
88.7
65
70
75
80
85
90
95
100
105
2008 2009 2010 2011 2012 2013 2014 2015 2016 2017 2018
Scenario 1: Primary expenditure shock
Scenario 2: Real growth of expenditure at trend growth
Baseline
Fiscal Policy Slippage Scenario(Percent)
Sources: IMF staff estimates.

FRANCE
62 INTERNATIONAL MONETARY FUND
9. Increase in real interest rate. An interest rate shock could be triggered by renewed tensions in the euro area, more generalized financial stress, including closure of wholesale markets to French banks. The scenario illustrates the impact of a 200 basis points increase in interest rates (well beyond the standard DSA shock scenario). This scenario illustrates that debt dynamics would be substantially affected only under an extreme shock.
10. Combined shock. This scenario combines the growth shock with the interest rate shock and the first expenditure shock (one time increase of spending by 1 percent of GDP). The combination of multiple shocks reflects the tendency for adverse shocks to compound one another during periods of stress, although we consider this to be a tail end scenario.
102.5
88.7
65
70
75
80
85
90
95
100
105
2008 2009 2010 2011 2012 2013 2014 2015 2016 2017 2018
Combined
Baseline
Combined Shock(Percent per year)
Sources: IMF staff estimates.
97.8
88.7
65
70
75
80
85
90
95
100
105
2008 2009 2010 2011 2012 2013 2014 2015 2016 2017 2018
i-rate shock
Baseline
Interest Rate Shock 1/ (Percent)
Sources: IMF staff estimates.1/Real interest rate is at baseline plus 4 standard deviations in projection years
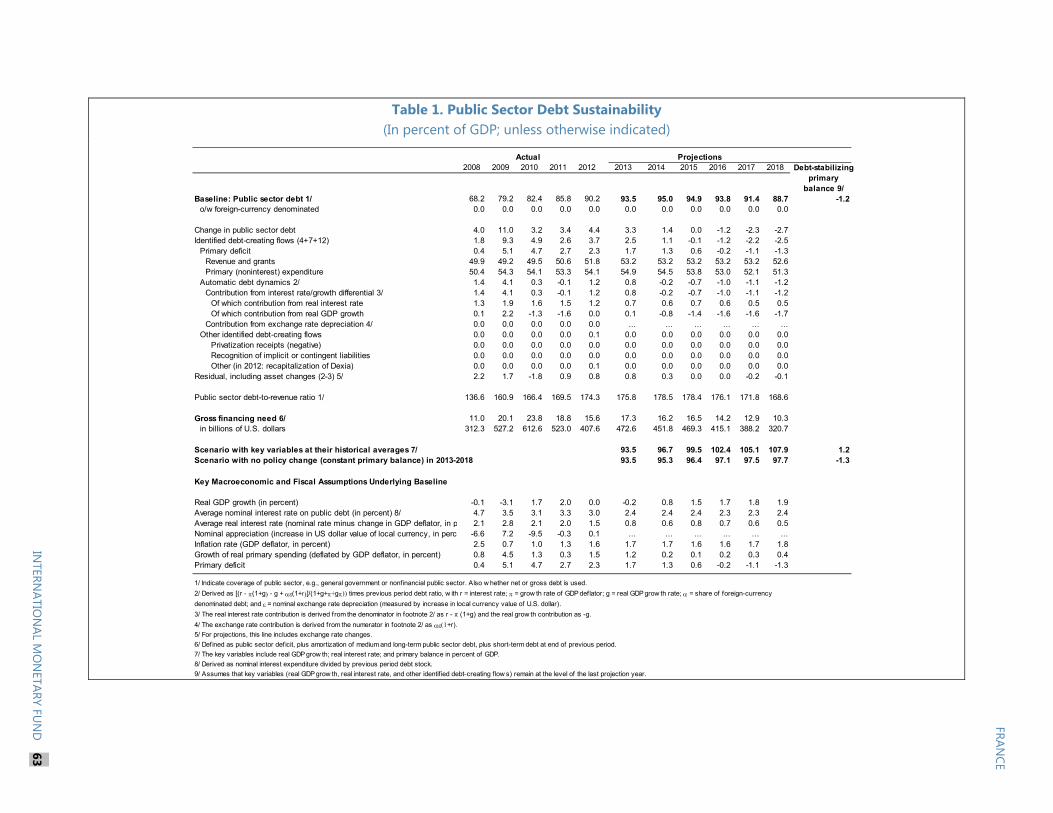
Table 1. Public Sector Debt Sustainability (In percent of GDP; unless otherwise indicated)
Projections
2008 2009 2010 2011 2012 2013 2014 2015 2016 2017 2018 Debt-stabilizingprimary
balance 9/Baseline: Public sector debt 1/ 68.2 79.2 82.4 85.8 90.2 93.5 95.0 94.9 93.8 91.4 88.7 -1.2
o/w foreign-currency denominated 0.0 0.0 0.0 0.0 0.0 0.0 0.0 0.0 0.0 0.0 0.0
Change in public sector debt 4.0 11.0 3.2 3.4 4.4 3.3 1.4 0.0 -1.2 -2.3 -2.7Identified debt-creating flows (4+7+12) 1.8 9.3 4.9 2.6 3.7 2.5 1.1 -0.1 -1.2 -2.2 -2.5
Primary deficit 0.4 5.1 4.7 2.7 2.3 1.7 1.3 0.6 -0.2 -1.1 -1.3Revenue and grants 49.9 49.2 49.5 50.6 51.8 53.2 53.2 53.2 53.2 53.2 52.6Primary (noninterest) expenditure 50.4 54.3 54.1 53.3 54.1 54.9 54.5 53.8 53.0 52.1 51.3
Automatic debt dynamics 2/ 1.4 4.1 0.3 -0.1 1.2 0.8 -0.2 -0.7 -1.0 -1.1 -1.2Contribution from interest rate/growth differential 3/ 1.4 4.1 0.3 -0.1 1.2 0.8 -0.2 -0.7 -1.0 -1.1 -1.2
Of which contribution from real interest rate 1.3 1.9 1.6 1.5 1.2 0.7 0.6 0.7 0.6 0.5 0.5Of which contribution from real GDP growth 0.1 2.2 -1.3 -1.6 0.0 0.1 -0.8 -1.4 -1.6 -1.6 -1.7
Contribution from exchange rate depreciation 4/ 0.0 0.0 0.0 0.0 0.0 ... ... ... ... ... ...Other identified debt-creating flows 0.0 0.0 0.0 0.0 0.1 0.0 0.0 0.0 0.0 0.0 0.0
Privatization receipts (negative) 0.0 0.0 0.0 0.0 0.0 0.0 0.0 0.0 0.0 0.0 0.0Recognition of implicit or contingent liabilities 0.0 0.0 0.0 0.0 0.0 0.0 0.0 0.0 0.0 0.0 0.0Other (in 2012: recapitalization of Dexia) 0.0 0.0 0.0 0.0 0.1 0.0 0.0 0.0 0.0 0.0 0.0
Residual, including asset changes (2-3) 5/ 2.2 1.7 -1.8 0.9 0.8 0.8 0.3 0.0 0.0 -0.2 -0.1
Public sector debt-to-revenue ratio 1/ 136.6 160.9 166.4 169.5 174.3 175.8 178.5 178.4 176.1 171.8 168.6
Gross financing need 6/ 11.0 20.1 23.8 18.8 15.6 17.3 16.2 16.5 14.2 12.9 10.3in billions of U.S. dollars 312.3 527.2 612.6 523.0 407.6 472.6 451.8 469.3 415.1 388.2 320.7
Scenario with key variables at their historical averages 7/ 93.5 96.7 99.5 102.4 105.1 107.9 1.2Scenario with no policy change (constant primary balance) in 2013-2018 93.5 95.3 96.4 97.1 97.5 97.7 -1.3
Key Macroeconomic and Fiscal Assumptions Underlying Baseline
Real GDP growth (in percent) -0.1 -3.1 1.7 2.0 0.0 -0.2 0.8 1.5 1.7 1.8 1.9Average nominal interest rate on public debt (in percent) 8/ 4.7 3.5 3.1 3.3 3.0 2.4 2.4 2.4 2.3 2.3 2.4Average real interest rate (nominal rate minus change in GDP deflator, in p 2.1 2.8 2.1 2.0 1.5 0.8 0.6 0.8 0.7 0.6 0.5Nominal appreciation (increase in US dollar value of local currency, in perc -6.6 7.2 -9.5 -0.3 0.1 ... ... ... ... ... ...Inflation rate (GDP deflator, in percent) 2.5 0.7 1.0 1.3 1.6 1.7 1.7 1.6 1.6 1.7 1.8Growth of real primary spending (deflated by GDP deflator, in percent) 0.8 4.5 1.3 0.3 1.5 1.2 0.2 0.1 0.2 0.3 0.4Primary deficit 0.4 5.1 4.7 2.7 2.3 1.7 1.3 0.6 -0.2 -1.1 -1.3
1/ Indicate coverage of public sector, e.g., general government or nonfinancial public sector. Also w hether net or gross debt is used.
2/ Derived as [(r - (1+g - g + (1+r]/(1+g++g)) times previous period debt ratio, w ith r = interest rate; = grow th rate of GDP deflator; g = real GDP grow th rate; = share of foreign-currency
denominated debt; and = nominal exchange rate depreciation (measured by increase in local currency value of U.S. dollar).
3/ The real interest rate contribution is derived from the denominator in footnote 2/ as r - π (1+g) and the real grow th contribution as -g.
4/ The exchange rate contribution is derived from the numerator in footnote 2/ as (1+r).
5/ For projections, this line includes exchange rate changes.
6/ Defined as public sector deficit, plus amortization of medium and long-term public sector debt, plus short-term debt at end of previous period.
7/ The key variables include real GDP grow th; real interest rate; and primary balance in percent of GDP.
8/ Derived as nominal interest expenditure divided by previous period debt stock.
9/ Assumes that key variables (real GDP grow th, real interest rate, and other identif ied debt-creating f low s) remain at the level of the last projection year.
Actual
FRANCE
INTERN
ATION
AL MO
NETARY FU
ND
63

FRANCE STAFF REPORT FOR THE 2013 ARTICLE IV CONSULTATION—INFORMATIONAL ANNEX Prepared By
The European Department
FUND RELATIONS ________________________________________________________________________ 2
STATISTICAL ISSUES ______________________________________________________________________ 8
TABLE OF COMMON INDICATORS REQUIRED FOR SURVEILLANCE ___________________ 9
CONTENTS
July 12, 2013

FRANCE
2 INTERNATIONAL MONETARY FUND
FUND RELATIONS (As of May 31, 2013)
Membership Status: Joined December 27, 1945; Article VIII.
General Resources Account: SDR Million Percent of Quota
Quota 10,738.50 100.00Fund Holding of Currency (Exchange Rate) 7,504.59 69.88Reserve Tranche Position 3,234.09 30.12Lending to the Fund New Arrangements to Borrow 2,321.62
SDR Department: SDR Million Percent of Allocation
Net Cumulative Allocation 10,134.20 100.00Holdings 9,418.04 92.93
Outstanding Purchases and Loans: None
Latest Financial Arrangements: None
Projected Payments to Fund (SDR million; based on existing use of resources and present holdings
of SDRs): Forthcoming 2013 2014 2015 2016 2017Principal Charges/Interest 0.22 0.49 0.49 0.49 0.49Total 0.22 0.49 0.49 0.49 0.49
Implementation of HIPC Initiative: Not applicable
Implementation of Multilateral Debt Relief Initiative (MDRI): Not applicable
Implementation of Post-Catastrophe Debt Relief (PCDR): Not applicable
Exchange Rate Arrangements:
France’s currency is the euro, which floats freely and independently against other currencies.

FRANCE
INTERNATIONAL MONETARY FUND 3
France maintains an exchange system free of restrictions on the making of payments and transfers for current international transactions, except for exchange restrictions imposed solely for the preservation of international security. These restrictions involving certain individuals and entities and which target specified countries have been notified to the Fund pursuant to Executive Board Decision No. 144-(52/51). In accordance with the relevant EU regulations and UNSC resolutions, certain restrictions are maintained on the making of payments and transfers for current or military international transactions with respect to Belarus, the Democratic Republic of Congo, the former Government of Côte d’Ivoire, the Islamic Republic of Iran, the former government of Iraq, the Democratic People’s Republic of Korea, Guinea (republic of), Guinea Bissao, the former Government of Liberia, the former Government of Libya, Myanmar, the former Government of Tunisia, Transnistria (the independentist region of Moldova), Eritrea, the former Government of Egypt, Somalia, Sudan and South Sudan, Syria, certain individuals associated with the murder of former Lebanese Prime Minister Rafiq Hariri, and Zimbabwe.
Measures have been taken to freeze accounts of listed persons and entities linked to terrorists pursuant to the relevant EU regulations (n°881/2002, n°2580/2001 and n°753/2011) and UN Security Council resolutions (resolutions 1267 and 1373 and subsequent resolutions).
Article IV Consultation:
The last Article IV consultation was concluded on December 20, 2012. The associated Executive
Board assessment is available at http://www.imf.org/external/np/sec/pn/2012/pn12146.htm and the
staff report at http://www.imf.org/external/pubs/ft/scr/2012/cr12342.pdf. France is on the standard
12-month consultation cycle.
FSAP Participation and ROSC:
France–Report on the Observance of Standards and Codes October 17, 2000
(ROSC): Module I–Fiscal Transparency
Fiscal Transparency—Update IMF Country Report
No. 01/196, 11/05/01
Fiscal Transparency—Update IMF Country Report
No. 04/345, 11/03/04
Summary: The report found that France has achieved a high level of fiscal transparency and has
introduced a number of improvements in coverage and presentation of fiscal information. Notable
areas of progress include the development in the final accounts publication to include more

FRANCE
4 INTERNATIONAL MONETARY FUND
complete information on government assets and liabilities as well as disclosure of contingent
liabilities. Accounting standards have been changed to reflect accruals principles in a number of
areas, and these standards are clearly explained. The staff suggested that further steps could be
taken to identify and report quasi-fiscal activities in the budget presentation, provide a more
consolidated picture of fiscal activity outside the appropriation process, and improve the
reconciliation of stated policies with outcomes at the general government level.
These issues have been addressed in the Loi organique aux lois de finance (LOLF), which has become
fully effective on January 1, 2006. In addition to the annual appropriations, the first multi-annual
fiscal framework law was adopted in January 2009, and contains fiscal objectives for the
period 2009–12. The budget is organized along missions and provides details on the level of
appropriations for each mission and performance indicators by which the expected results of the
mission will be assessed ex post. The State Audit Office has been given the new assignment of
certifying the public accounts, and implementation of accruals basis accounting has been confirmed.
Parliamentary oversight powers have been strengthened.
France–Report on the Observance of Standards and Codes October 2000, corrected:
(ROSC): Module II–Transparency in Monetary and Financial 2/15/01
Policies
Transparency in Monetary and Financial Policies—Update IMF Country Report
No. 01/197, 11/05/01
Transparency in Monetary and Financial Policies—Update IMF Country Report
No. 02/248, 11/13/02
Summary: The 2000 ROSC noticed that transparency of financial policies is accorded a high priority
by all financial agencies assessed, and they are in observance of the good practices of the Code of
Good Practices on Transparency in Monetary and Financial Policies. The major agencies disclose their
objectives, their legal and institutional frameworks, and have open processes of policymaking and
regulation. The principles of transparency are observed by dissemination of relevant information to
the public and in the agencies’ arrangements for internal conduct, integrity, and accountability.
However, the staff noted that the framework for supervision and regulation applicable to mutual
insurance firms is not as well defined and suggested to improve its transparency. The transparency
of monetary policy was not assessed by the Fund team as the Banque de France is a member of the
European System of Central Banks and no longer conducts independent monetary policy.

FRANCE
INTERNATIONAL MONETARY FUND 5
Subsequently, the framework for supervision and regulation applicable to a specific group of mutual
insurance firms was modified in a number of steps. In August 2003, legislation created a single
supervisory body, the Commission de Contrôle des Assurances, Mutuelles et Institutions de
Prévoyance (CCAMIP) by merging the regular insurance supervisor (CCA) and mutualities’ supervisor
(CCMIP). Coordination with the banking sector supervisors was strengthened and the powers of the
supervisory authorities extended.
France–Report on the Observance of Standards and Codes IMF Country Report
(ROSC): Data Module No. 03/339, 10/2903
Data Module––Update IMF Country Report
No. 04/345, 11/03/04
Data Module––Update IMF Country Report
No. 05/398, 11/07/05
Summary: The report found that France is in observance of the Fund’s Special Data Dissemination
Standard (SDDS). In particular, the mandate of INSEE and the Banque de France for the production
of the six macroeconomic datasets is clearly defined, with the reporting burden and the
confidentiality provisions given special consideration notably through the CNIS. Professionalism is
central to the statistical operations of the two institutions, internationally and/or European accepted
methodologies are generally followed, the degree of accuracy and reliability of the six datasets is
remarkable, statistics are relevant and provided on a timely basis, and they are accessible to the
public.
The report made a number of suggestions for further improvements: the responsibility of INSEE as
the producer of government finance statistics should be clarified; data sharing between the Banque
de France and the rest of the French statistical system improved; classification and valuation
methods in balance-of-payments statistics reviewed; consistency between the current account of the
balance of payments and the goods and services account in the national accounts improved; the
timing of revisions in the quarterly and annual national accounts aligned; and identification of data
production units of INSEE facilitated.
France continues to implement several of the 2003 ROSC Data Module recommendations, including
by promoting a broader understanding of statistical data revisions, making greater use of firm-level

FRANCE
6 INTERNATIONAL MONETARY FUND
data to improve the measurement of changes in stocks, and intensifying work on portfolio
investment income with the objective of starting to record those transactions on an accrual basis.
France–Financial System Stability Assessment (FSSA) IMF Country Report
No. 04/344, 11/03/04
FSAP Assessment and Reports on ROSCs IMF Country Report
No. 04/345, 11/03/04
FSAP Assessment IMF Country Report
No. 05/185, 06/08/05
Publication of FSAP—Detailed Assessment of Observance of IMF Country Report
Standards and Codes No. 05/186, 06/08/05
France–Financial System Stability Assessment (FSSA) IMF Country Report
No. 12/341, 12/07/12
Summary: The 2004 report concluded that France’s financial sector is strong and well supervised.
No weaknesses that could cause systemic risks were identified. The strength of the system is
supported by the financial soundness indicators and the strong conformity to the supervisory and
regulatory standards approved by the Basel Committee, IAIS, IOSCO, FATF, and CPSS. The degree of
observance of the transparency code is high in all relevant areas. The French banking sector has
been modernized and restructured over the past two decades and is well capitalized. Systemic
vulnerabilities in the important insurance sector are well contained. Securities markets are large and
sophisticated.
The FSAP Update undertaken in January and June 2012 confirmed the resilience of France’s financial
system to severe market pressures but also identified challenges faced by the system. While its
structure has contributed to solid profit generation, the crisis exposed the risks posed by the banks’
size, complexity, and dependence on wholesale funding. The larger banks have been actively
restructuring their balance sheets—moving to more stable sources of funding; reducing their cross-
border presence; and building up capital. They remain, however, vulnerable to sustained disruptions
in funding markets and reduced profitability, which would cause delays in meeting capital-raising
plans.
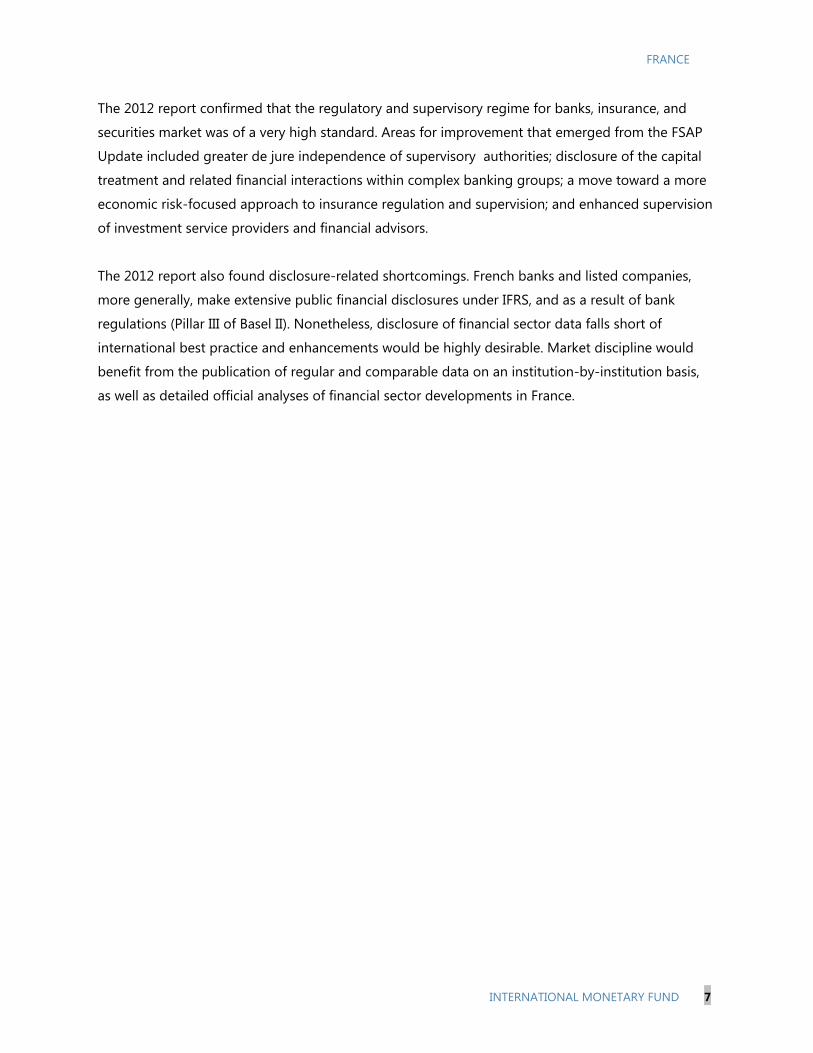
FRANCE
INTERNATIONAL MONETARY FUND 7
The 2012 report confirmed that the regulatory and supervisory regime for banks, insurance, and
securities market was of a very high standard. Areas for improvement that emerged from the FSAP
Update included greater de jure independence of supervisory authorities; disclosure of the capital
treatment and related financial interactions within complex banking groups; a move toward a more
economic risk-focused approach to insurance regulation and supervision; and enhanced supervision
of investment service providers and financial advisors.
The 2012 report also found disclosure-related shortcomings. French banks and listed companies,
more generally, make extensive public financial disclosures under IFRS, and as a result of bank
regulations (Pillar III of Basel II). Nonetheless, disclosure of financial sector data falls short of
international best practice and enhancements would be highly desirable. Market discipline would
benefit from the publication of regular and comparable data on an institution-by-institution basis,
as well as detailed official analyses of financial sector developments in France.
FRANCE
8 INTERNATIONAL MONETARY FUND
STATISTICAL ISSUES The economic database is comprehensive and of high quality, and data provision to the Fund is
adequate for surveillance. The authorities regularly publish a full range of economic and financial
data, and calendar dates of main statistical releases are also provided. France subscribes to the
Fund’s Special Data Dissemination Standard. The transmission of data in electronic form from INSEE
(Institut national de la statistique et des études économiques) and the profusion of data from various
institutions (Banque de France, INSEE, ministry of finance, ministry of labor and solidarity) have
helped to build an infrastructure, in which all data can be easily accessed through the Economic
Data Sharing System. A data ROSC mission conducted an assessment of the statistical system in
March 2003, and the report was published in October 2003. A factual update to the main report was
published in November 2004.
France’s monetary and banking statistics methodology conforms with the European Central Bank
framework, which provides comparable details as the Standardized Report Forms developed by STA.
Statistics for International Financial Statistics on banking institutions and monetary aggregates are
prepared on a monthly basis and are timely. Monetary data are also disseminated in the quarterly
IFS Supplement on monetary and financial statistics. France follows the European System of
Integrated Economic Accounts 1995 (ESA95). Data for GDP and its expenditure components are
available from 1978 onwards. Both annual and quarterly accounts provide reliable information,
although estimates from the two accounts differ slightly before the quarterly accounts are revised to
be aligned to the annual ones. In 2005, national accounts estimates were rebased to 2000 prices.
Government finance statistics have been strengthened recently. Both central and general
government data are presented in a more comprehensive fashion than previously and the data
for 2006 and 2007 also reflect the various impacts of recent budgetary reform. Although the source
data is collected by the Ministry of Economy and Finance, INSEE is principally responsible for the
compilation and dissemination of fiscal data in a framework that is consistent with ESA95. INSEE’s
website has recently been enhanced; in particular, it includes expenditure tables and government
revenues by subsector (central government, miscellaneous central government agencies, local
governments, and social security administration).
Balance-of-payments statistics should be interpreted with caution, given large errors and omissions.
Greater coherence between the external current account and the rest of the world account in the
national accounts is needed. In this regard, work with promising early results has been undertaken
on the transportation account.

FRANCE
INTERNATIONAL MONETARY FUND 9
TABLE OF COMMON INDICATORS REQUIRED FOR SURVEILLANCE (As of June 17, 2013)
Date of Latest
Observation
Date Received
Frequency of
Data
Frequency of
Reporting
Frequency of
Publication
Exchange Rates 05/13 05/13 Monthly Monthly Monthly International Reserve Assets and Reserve Liabilities of the Monetary Authorities1 03/13 05/12 Monthly Monthly Monthly International Investment Position 2011 Q1:2012 Annual Annual Annual Reserve/Base Money 04/13 05/13 Monthly Monthly Monthly Broad Money 04/13 05/13 Monthly Monthly Monthly Central Bank Balance Sheet 04/13 05/13 Monthly Monthly Monthly Consolidated Balance Sheet of the Banking System 04/13 05/13 Monthly Monthly Monthly Interest Rates2 04/13 05/13 Monthly Monthly Monthly Consumer Price Index 05/13 06/13 Monthly Monthly Monthly Revenue, Expenditure, Balance and Composition of Financing3—General Government4 Q4:2012 05/13 Quarterly Quarterly Quarterly Revenue, Expenditure, Balance and Composition of Financing3—Central Government5 04/13 06/13 Monthly Monthly Monthly Stock of Central Government Debt 04/13 05/13 Monthly Monthly Monthly Stock of Central Government-Guaranteed Debt Q1:2011 04/13 Quarterly Quarterly Quarterly External Current Account Balance 04/13 06/13 Monthly Monthly Monthly Exports and Imports of Goods and Services 04/13 06/13 Monthly Monthly Monthly GDP/GNP Q1:2013 05/13 Quarterly Quarterly Quarterly Gross External Debt Q4:2012 05/13 Quarterly Quarterly Quarterly 1 Includes reserve assets pledged or otherwise encumbered as well as net derivative positions. 2 Both market-based and officially-determined, including discount rates, money market rates, rates on treasury bills, notes and bonds. 3 Foreign, domestic bank, and domestic nonbank financing. 4 The general government consists of the central government (budgetary funds, extra budgetary funds, and social security funds) and state and local governments. 5 This information is provided on a budget-accounting basis (not on a national accounts basis).

Public Information Notice (PIN) No. 13/xx FOR IMMEDIATE RELEASE August 2, 2013 IMF Executive Board Concludes 2013 Article IV Consultation with France
On July 29, 2013, the Executive Board of the International Monetary Fund (IMF) concluded the Article IV consultation with France.1 Background
In a context of weakening economic conditions in Europe, sizeable fiscal consolidation, and domestic policy uncertainty the economy flat lined in 2012, but recent improvements in economic indicators support the expectation of a gradual recovery in the second half of 2013. Credit conditions remain supportive, and private demand is unencumbered by balance sheet repair issues and so is more apt to respond favorably to an improvement in confidence. In all, the economy is projected to contract by 0.2 percent in 2013 and to grow by 0.8 percent in 2014.
The economy’s growth potential, beyond its cyclical recovery, is hindered by structural rigidities in labor and product markets, which have, over time, contributed to a gradual loss of cost competitiveness and export performance. These have been accompanied by sizeable declines in the share of manufacturing production and employment and a narrowing of profit shares in national income. Structural reforms to address these constraints have been given an important forward momentum by the recent reduction in labor taxes and reform of the labor market reform toward greater “flexicurity.”
The pace of fiscal consolidation was accelerated further in 2013, with a structural adjustment equivalent to 1.8 percent of GDP, which comes on top of adjustment of 2.2 percent of GDP sustained over the previous two years. IMF Staff projects that the fiscal deficit will decline to 3.9
1 Under Article IV of the IMF's Articles of Agreement, the IMF holds bilateral discussions with members, usually every year. A staff team visits the country, collects economic and financial information, and discusses with officials the country's economic developments and policies. On return to headquarters, the staff prepares a report, which forms the basis for discussion by the Executive Board. At the conclusion of the discussion, the Managing Director, as Chairman of the Board, summarizes the views of Executive Directors, and this summary is transmitted to the country's authorities. An explanation of any qualifiers used in summings up can be found here: http://www.imf.org/external/np/sec/misc/qualifiers.htm.
International Monetary Fund 700 19th Street, NW Washington, D. C. 20431 USA
2 percent of GDP in 2013, from 4.8 percent in 2012. The bulk of the adjustment to date (about 90 percent) has been realized through revenue measures, whereas IMF staff had suggested a more balanced distribution of the effort. Under the new fiscal government framework, the government has announced that it would henceforth be setting and monitoring fiscal objectives in terms of the structural deficit, thus increasing the stability and reducing the procyclicality of fiscal policy. The Stability Program of April 2013 targets an easing of the pace of adjustment starting in 2014 and a rebalancing of the adjustment effort toward expenditure measures.
Financial stability risks have abated considerably, as banks have completed their deleveraging objectives and strengthened capital and liquidity buffers. However, bank profitability remains low. The French financial system still needs to adapt fully to new international regulations on bank liquidity.
Executive Board Assessment Executive Directors were encouraged by recent improvements in economic indicators, supporting the expectation of a gradual recovery during the second half of the year. Given remaining risks, including from uncertain euro area prospects, Directors underscored the importance of pursuing structural reforms to support the recovery of private demand and strengthen competitiveness, while continuing efforts to ensure fiscal sustainability and safeguard financial stability.
Directors welcomed the significant progress already achieved towards consolidating public finances. Going forward, many Directors saw merit in allowing for a smoother pace of adjustment than envisaged in the Stability Program to support the hesitant recovery. Many other Directors advised the authorities to persevere with the consolidation plans under the program, noting that it already allows automatic stabilizers to operate. While Directors welcomed the shift to structural deficit targeting, a number of them noted that nominal targets should not be neglected. With tax rates already at a very high level, Directors stressed that rebalancing fiscal adjustment toward expenditure containment is critical, including in the areas of social security and local spending where there is room for improved efficiency.
Directors welcomed the progress made on structural reforms. They noted that the reduction in the labor tax wedge would boost enterprise competitiveness until the impact of deeper structural reforms gains ground. They commended the broad labor market reform of 2013 and its contribution to greater labor market flexibility while still protecting worker security, and encouraged the authorities to follow up on its implementation.
Directors underscored the importance of pursuing reforms on a broader front to improve competitiveness and growth prospects. They welcomed ongoing efforts to simplify the regulatory framework and improve labor training mechanisms, and urged the authorities to reform pensions in a way that increases labor market participation rather than contribution rates. Directors called for deeper labor market reforms to increase employment of the young and low-skilled, and underscored the potential growth and employment gains from opening product and services markets to greater competition.
3 Directors welcomed the significant progress achieved in reducing financial vulnerabilities while preserving the capacity of banks to provide credit. Nonetheless, the combination of low bank profitability and weak growth prospects calls for continued vigilance. Directors also noted that the French financial system would need to adapt further to prudential requirements, notably in regard to bank funding structures, which continue to rely heavily on wholesale funding. To that end, Directors recommended that tax incentives on financial products be better aligned with regulatory objectives, including by removing tax disincentives against deposits and phasing out regulated interest rates.
Directors welcomed the efforts deployed by the authorities to keep the process of convergence toward the Single Supervisory Mechanism and Single Resolution Mechanism in the European Union on track. They commended the banking reform for aligning the resolution regime to the EU directive, in line with FSAP recommendations, ring-fencing trading activities, and strengthening the macro-prudential framework.
Public Information Notices (PINs) form part of the IMF's efforts to promote transparency of the IMF's views and analysis of economic developments and policies. With the consent of the country (or countries) concerned, PINs are issued after Executive Board discussions of Article IV consultations with member countries, of its surveillance of developments at the regional level, of post-program monitoring, and of ex post assessments of member countries with longer-term program engagements. PINs are also issued after Executive Board discussions of general policy matters, unless otherwise decided by the Executive Board in a particular case.

4
Table 1. Selected Economic and Social Indicators, 2010–18 2010 2011 2012 2013 2014 2015 2016 2017 2018
(Proj.) (Proj.) (Proj.) (Proj.) (Proj.) (Proj.) Real economy (change in percent) Real GDP 1.7 2.0 0.0 -0.2 0.8 1.5 1.7 1.8 1.9 Domestic demand 1.8 2.0 -0.9 -0.5 0.8 1.1 1.3 1.5 1.6 Nominal GDP (billions of euros) 1937 2001 2032 2061 2114 2178 2251 2336 2427 CPI (year average) 1.5 2.1 2.0 1.4 1.5 1.5 1.6 1.7 1.8 Unemployment rate (in percent) 9.7 9.6 10.2 11.2 11.6 11.4 10.9 10.6 10.4 Gross national savings (percent of GDP) 17.7 18.8 17.5 17.7 18.1 18.7 19.3 20.0 20.5 Gross domestic investment (percent of GDP) 19.3 20.8 19.8 19.1 19.4 19.5 19.7 20.0 20.3 Public finance (percent of GDP) Central government balance -6.3 -4.4 -3.9 -2.8 -2.4 -2.0 -1.5 -1.1 -0.9 General government balance -7.1 -5.3 -4.8 -3.9 -3.5 -2.8 -1.9 -1.0 -0.8 Structural balance (percent of potential GDP) -5.7 -4.6 -3.5 -1.7 -1.2 -0.8 -0.4 0.0 0.0 Primary balance -4.8 -2.8 -2.5 -1.8 -1.5 -0.8 0.1 0.9 1.2 General government gross debt 82.4 85.8 90.2 93.5 95.0 94.9 93.8 91.4 88.7 Money and interest rates (in percent) Money market rate 1/ 0.5 0.8 0.1 0.0 Government bond yield 1/ 3.1 3.3 2.5 2.0 Balance of payments (in percent of GDP) Exports of goods 20.2 21.2 21.5 21.1 21.0 21.1 21.2 21.4 21.6 Volume growth (in percent) 9.5 5.4 2.4 1.4 3.1 4.4 4.5 4.6 4.6 Imports of goods 23.0 25.0 25.0 24.1 24.0 23.7 23.5 23.4 23.4 Volume growth (in percent) 8.9 5.1 -1.1 0.2 2.7 3.0 3.2 3.6 3.7 Trade balance -2.8 -3.8 -3.5 -3.1 -3.0 -2.6 -2.3 -2.0 -1.8 Current account -1.3 -1.8 -2.2 -1.2 -1.1 -0.7 -0.2 0.1 0.4 FDI (net) -1.2 -0.8 -0.5 -0.7 -0.9 -1.1 -1.3 -1.5 -1.7 Official reserves (US$ billion) 55.8 48.6 Fund position (as of January 31, 2012) Holdings of currency (percent of quota) 79.7 73.1 70.9 Holdings of SDRs (percent of allocation) 96.1 95.5 94.2 Quota (SDRs million) 10739 10739 10739 Exchange rates Euro per U.S. dollar, period average 0.75 0.72 0.78 Nominal effective rate, ULC-styled (2000=100) 102.4 102.4 100.1 Real effective exchange rate, ULC-based (2000=100) 104.3 105.4 104.8 Potential output and output gap Potential output 0.8 0.8 0.8 0.9 1.0 1.1 1.2 1.3 1.4 Output gap -2.2 -1.0 -1.8 -2.9 -3.0 -2.6 -2.1 -1.6 -1.1 Social indicators
Per capita GDP (2006): US$35,471; Life expectancy at birth (2009): 77.7 (male) and 84.4 (female);
Poverty rate (mid-2000s): 14.1 percent (60 percent line), 7.1 percent (50 percent line); Income distribution (ratio of income received by top and bottom quintiles, 2004): 4.2.
Sources: French authorities; IMF staff estimates and projections.
1/ For 2013, average for January-May.

Statement by Mr. Hervé de Villeroché, Executive Director for France— July 29, 2013
We would like to thank staff for a very interesting and well-written set of papers that offers a balanced assessment both of the challenges that France is facing and of the policy actions that have been taken to address them. Discussions with my authorities during the Article IV mission have been thorough and fruitful, notably thanks to the open and frank approach taken by the mission team.
Macroeconomic outlook
After two quarters of weaker than expected activity in late 2012 and early 2013, early signs of returning growth are beginning to show for the second quarter of 2013. In this regard, my authorities concur with staff analysis that growth should progressively pick up during the second part of the calendar year, due to a gradual rebound of internal and external private demand. . The size of the rebound in 2014 compared to 2013, as estimated by staff, is quite in line with what my authorities expect.
Nevertheless, we forecast a higher level of growth than staff in 2013 as well as in 2014, even if these forecasts will be reassessed for the 2014 budget law draft. This difference notably comes from the fact that my authorities include the macroeconomic impact of the National Pact for growth, competitiveness and employment that was adopted in November, and notably the corporate tax credit that was introduced as part of this package, which will amount to 20bn€ (1% of GDP) as of next year, based on payrolls (with an estimated reduction in the cost of targeted labor force of more than 4%, yielding a total reduction of 3% of overall labor costs). Its effects on competitiveness should help boost exports performance and contribute to the rebound.
We also have a different view than staff regarding the potential negative impact of policy uncertainty on growth. The determination of our authorities to keep on a fiscal adjustment mostly driven by reducing expenditures and to implement structural reforms in order to boost competitiveness is strong and clearly stated. Consulting stakeholders, notably social partners, might entail a longer process, but it ensures full ownership. Indeed the experience with the labor market agreement in January 2013 has shown how productive social dialogue can be. In this regard, we do not think it is appropriate to say that policy uncertainty has increased, especially based on a somewhat uncertain indicator.
Fiscal policy
My authorities’ stance on fiscal policy has been unchanged since the last Article IV consultation, in line with our European commitments and also with recommendations of the IMF: the main focus of our medium-term consolidation plan is still on structural adjustment, so that debt will be put on a firm downward path, while at the same time letting the automatic stabilizers fully play in case the outlook deteriorates, which happened in end 2012-early

2
2013. Consistent with that approach, the Council of the European Union has decided to postpone the target of reaching a 3 percent of GDP nominal deficit of the general Government by two years, to 2015. The consolidation path still entails a substantial structural effort, continuing what has been achieved already in 2012 and 2013.
In terms of composition of the fiscal adjustment, France has also chosen a mix that is consistent with the fiscal stance recommended by the IMF and aims at minimizing the induced drag on growth (notably by targeting the efforts on better-off households and on big enterprises),The bulk of the effort is progressively shifting from revenue raising to rationalization of expenditures (the balance should thus shift from 70% of the effort in new revenue and 30% in expenditures containment to 30% and 70% respectively). On this question, we would like to stress two points:
– First, as a methodological point, it should be noted that social entitlement schemes, and more generally public policies, often take the form of tax rebates and exemptions alongside direct cash transfers. Closing tax loopholes and rationalizing exemptions should thus be considered as much an expenditures side reform as a revenue side measure. This was typically the case in the recently announced reform of family benefits, where the reform consists in a mix of reducing direct cash transfers and implementing a lower ceiling for the reduction on income tax that benefit parents;
– Second, a lot is underway to ensure more efficient public spending. Mechanisms do already exist, that help with containing expenditures growth at levels even below their natural trend. This is not only true for the central Government, where spending freeze in real terms represents a notable effort, but also for social security administrations, where for instance the progression of healthcare insurance spending has been firmly kept in check, as noted by staff in the selected issues paper on expenditure savings. Local governments’ deficit is constrained by a golden rule that prevents them from financing current expenditures or debt rollover through new debt. All major public policies are currently under review with the objective of improving their efficiency. In particular, we agree with staff that the pension reform will be a key element of this strategy. Following a first move by social partners on mandatory supplementary pensions (3-year under-indexation as of next year), the Government should be in a position to present a draft law to Parliament by the end of summer.
Last but not least as regards fiscal policy, we would like to underline that much attention has been given to public finances governance these last years, putting France at the highest standard in this matter with mechanisms that allow for flexibility while ensuring credible enforcement of medium-term fiscal targets, in line with our European commitments. As part of this new framework, the new independent fiscal council, the Haut conseil des finances publiques (High Council for Public Finances), has begun its work and already issued a first assessment of macroeconomic assumptions underlying the Government projections. More public advices will follow in the fall as a contribution to the discussions on the 2014 budget.

3
Structural agenda
The main issue at the moment remains employment. As explained in the framework of the previous Article IV discussion, the roll-out of the emplois d’avenir (subsidized jobs targeted at low-skilled young people), and the contrat de génération (contracts that grant firms with a subsidy when they hire young workers while keeping older ones, geared to boost employment at the bottom and top of the age range) should help curb the increase in unemployment. The staff report also rightly emphasizes the importance of the agreement reached between social partners in January (Accord national interprofessionnel sur l’emploi – ANI – interprofessional agreement on employment) and its transcription into the law without changes. My authorities are confident that its implementation will give more flexibility to enterprises to adapt to economic conditions and provide workers with a higher degree of security. The fact that many decisions will now be taken at firm level, notably temporary reductions of wages and working hours in case of a downturn, will provide flexibility to adapt to short term economic developments while enhancing social dialogue at enterprise level.
Two reforms are also planned, that should contribute to increase further the flexibility of the job market and the labor force participation rate: social partner are discussing a reform of the unemployment insurance scheme, which should enhance active unemployment measures, and also the reform of the pension system, which should continue increasing the incentives to work longer and thus senior workforce participation.
We do not entirely concur with staff’s appraisal on the minimum wage. Indeed reductions in the tax wedge are sizable. They have proven effective to offset the negative effect on labor demand of the minimum wage and to stabilize the share of unskilled labor in total employment. It has to be noted that the automatic minimum wage increase should be relatively low due to subdued inflation. My authorities are not convinced by the proposed freeze of the minimum wage, at a time when indexation rules just changed in 2013.
Building on the social dialog method that has successfully been experimented for the ANI, the Government has tasked social partners on the 8th of July to reach an agreement on an overhaul of the system of professional training, where room for improvement is considerable, as underlined by staff. Their proposals should be made in the fall, in time for the Government to be able to propose a draft law on this basis before the end of 2013.
My authorities also intend to implement the comprehensive agenda that was launched last fall with the National Pact for growth, competitiveness and employment. The French trade balance has started to regain ground both in terms of price and non-price competitiveness (the commercial deficit outside energy stands at 5bn€ at end-May (0.25% of GDP), compared to 15bn€ at the same period in 2011 (0.75% of GDP)). The competitiveness agenda is also epitomized by the long term investment plan of 12bn€ presented on July 9

4
(which will be funded mostly through the selling of public stakes in listed enterprises), but it is larger than these specific action plans and permeate a number of other structural policies.
My authorities are also launching a series of measures aimed at simplifying the business environment and enhancing the quality of public service, as noted by staff. The last Comité interministériel pour la modernisation de l’Etat (Cabinet meeting on State administration modernization) on July 17 has seen the Government approving a number of concrete measures to give substance to the “simplification shock” announced by the President of the Republic. Inter alia, it has been decided to reverse one of the overarching principles of French administrative law, which required an explicit approval of the administration for individual decisions in most fields. In the future, tacit approval will be the norm - in most fields, absence of reaction in a two-month delay will be considered approval.
A law is currently debated in the Parliament on rationalizing competences between the various levels of local administration by transferring some powers to the level deemed the most efficient for each policy and by designating a clear leader in a number of policy fields. It will notably give reinforced powers to the metropolitan level, with a view to create strong institutions covering each of the major urban areas so as to overcome the institutional weaknesses and the lack of coordination between fragmented city councils, without adding to the layers of local government (see for instance specific measures for the future métropoles of Paris, Lyon and Marseille).
As regards housing market developments, which in the past years have weighed not only on household’s consumption but also on the overall competitiveness evolution, my authorities concur with staff’s appraisal that prices are modestly overvalued, although we would estimate the probability of a price correction in the short-term as “low-medium” rather than “medium”. In a medium-term perspective, my authorities are committed to address shortcomings on the supply side, both by making a portion of public landing property available for construction and by preparing measures intended at simplifying the way new construction is decided at local level.
As regards markets for goods and services, we concur with staff that a number of bottlenecks should be lifted in the medium-run to boost productivity and employment. It should be noted that France will participate during the next two years in a review exercise of the Services directive, aimed notably at assessing transparency of regulated professions. In the transportation sector, the reform currently underway aims at reuniting infrastructure and maintenance activities into one entity so that management of the network infrastructure will be more efficient. This prepares the railway sector to competition, which should be opened around 2019, depending on new European directives currently under discussion. It should also be noted that the draft law on decentralization mentioned above also contains measures to liberalize interregional bus transportation services.

5
Financial sector
We concur with staff’s analysis on the good health of the French financial system, as demonstrated also in last year’s FSAP. French banking groups have pursued the rebalancing of their funding model, in line with the French supervisory authority (ACP, Autorité de contrôle prudentiel) and the IMF recommendations, and have reinforced their capital base with the objective of complying with Basel III’s new rules already in 2013.
We welcome the follow-up of the FSAP, which is useful to keep a fruitful ongoing dialog with the authorities. Indeed, measures relating to powers of the ACP and to governance of financial institutions (banking and insurance sectors) have been included in the banking law that the Parliament definitely adopted a few days ago. This law represents a substantial enhancement of the legislative framework in three main elements:
– It introduces the cantonment of speculative business lines, with the financing of the real economy as a key criterion;
– It reinforces the crisis management framework by setting up a resolution authority with the ACP at its core, now relabeled ACPR (Autorité de contrôle prudentiel et de resolution). It receives new powers to prevent and manage banking crisis (notably regarding the internal organization of banking groups, in line with mandatory individual recovery and resolution plans), under the direction of a resolution board that comprises all stakeholders. This whole set up is in line with the framework of the future European resolution directive, on which the ECOFIN Council reached an agreement two weeks ago;
– Regarding macroprudential supervision, it transforms the COREFRIS (Comité de regulation financière et du risque systémique – Committee on Financial Regulation and Systemic Risk) into a new body endowed with legally binding powers, the Haut Conseil de Stabilité Financière (High Council for Financial Stability), which draws heavily on the expertise of the Banque de France under the presidency of the Minister for Finance.
We also welcome the assessment by staff that supervision by the ACP is of high quality, based on a culture of intrusive and on-site supervision. We are notably pleased that the staff takes note of the seriousness of ACP’s controls over the adequacy of risk weights and internal risk-based models used by banks.
On the financing of the economy, we concur with staff that the overall robustness of the banking sector has resulted in a more resilient credit flow to the real economy. We also concur with the thrust of staff’s appraisal regarding the reforms needed to accompany the structural transformation underway, towards a more disintermediated system, and to better mobilize long-term savings for long-term financing projects. Recourse by corporates to capital markets has substantially risen in the past years, and initiatives have been launched to

6
help securitize SME loans. Long-term savings mobilization is underway through a multipronged approach:
– The creation of the Banque Publique d’Investissement brings together a number of public tools for investment both in equity and in debt, that were scattered and will be better coordinated;
– Rebalancing of tax incentives regarding different products of long-term savings is underway and the recommendations of the Berger-Lefebvre report offer a good basis in this regard. Changes in the life-insurance framework should also be noted, which will enable insurance group to invest more in SMEs debt;
– Lastly, the Government announced last week that 30bn€ of regulated savings product (notably livret A) should be given back to commercial banks (“decentralized”) to enhance their capacity to lend to SMEs, thus making it easier for them to beef up their liquidity ratios and lessening the impact of this specific system.
Déclaration de M. Hervé de Villeroché, Administrateur pour la France 29 juillet 2013
Je voudrais remercier les services du FMI de l’ensemble de documents très intéressants et bien écrits qu’ils ont préparés et qui offrent une évaluation équilibrée à la fois des défis auxquels la France est confrontée et des actions entreprises pour y répondre. Les entretiens qui ont eu lieu avec les autorités françaises dans le cadre des consultations au titre de l’article IV ont été exhaustifs et fructueux, grâce notamment à l’esprit d’ouverture et à la franchise des membres de la mission.
Perspectives macroéconomiques
Après deux trimestres, fin 2012 et début 2013, durant lesquels l’activité a été plus faible que prévu, les premiers signes d’un retour de la croissance commencent à apparaître pour le deuxième trimestre de 2013. À cet égard, les autorités françaises partagent l’analyse des services du FMI selon laquelle la croissance devrait s’accélérer progressivement pendant le second semestre de l’année, grâce à un rebond graduel de la demande intérieure et extérieure. L’ampleur de ce rebond en 2014 par rapport à 2013, tel qu’il ressort des estimations des services du FMI, correspond tout à fait à ce que prévoient les autorités françaises.
Cependant, nous prévoyons pour 2013 et 2014 une croissance plus forte que les services du FMI, même si ces prévisions seront revues pour le projet de loi de finances 2014. Cette différence tient notamment au fait que les autorités françaises tiennent compte de l’effet macroéconomique du Pacte national pour la croissance, la compétitivité et l’emploi qui a été adopté en novembre, et notamment du crédit d’impôt pour les entreprises mis en place dans ce cadre, basé sur la masse salariale, dont le montant atteindra 20 milliards d’euros (1 % du PIB) l’année prochaine (avec une réduction estimative de plus de 4 % du coût de la maind’oeuvre visée, ce qui entraînera une réduction totale de 3 % du coût global du travail). Par ses effets sur la compétitivité, le Pacte devrait aider à stimuler les exportations et contribuer au rebond de l’activité.
Notre avis diffère aussi de celui des services du FMI en ce qui concerne l’effet negative potentiel sur la croissance de l’incertitude qui entourerait l’action des pouvoirs publics. Les autorités françaises ont clairement exprimé leur ferme volonté de poursuivre un ajustement budgétaire axé essentiellement sur la réduction des dépenses et de mettre en oeuvre des réformes structurelles pour renforcer la compétitivité. La consultation des parties prenantes, notamment des partenaires sociaux, est certes susceptible d’allonger le processus, mais elle garantit l’adhésion de tous à l’action engagée. À cet égard, l’expérience de l’accord de janvier 2013 sur la réforme du marché du travail a montré à quel point le dialogue social pouvait être productif. Il nous semble donc inexact de dire que l’incertitude entourant l’action des pouvoirs publics s’est accentuée, surtout en se fondant sur un indicateur à la fiabilité incertaine.
Politique budgétaire

2
L’orientation de la politique budgétaire n’a pas varié depuis les dernières consultations au titre de l’article IV, conformément à nos engagements européens et aussi aux ecommandations du FMI : le pilier central de notre plan de rééquilibrage à moyen terme reste l’ajustement structurel, afin de remettre fermement la dette sur une trajectoir e descendante tout en laissant jouer pleinement les stabilisateurs automatiques en cas de dégradation des perspectives, comme cela s’est produit fin 2012–début 2013. En coherence avec cette approche, le Conseil de l’Union européenne a décidé de différer de deux ans, jusqu’à 2015, l’objectif de réduction du déficit nominal des administrations publiques à 3 % du PIB. La poursuite du rééquilibrage suppose encore un effort considérable sur le plan structurel, dans le prolongement de ce qui a déjà été réalisé en 2012 et 2013.
En ce qui concerne la composition de l’ajustement budgétaire, la France a aussi choisi un ensemble de mesures qui correspond à l’orientation budgétaire recommandée par le FMI et vise à limiter autant que possible les effets négatifs sur la croissance (notamment en ciblant les efforts sur les ménages les plus aisés et sur les grandes entreprises). Le plus gros de l’effort est progressivement transféré de la mobilisation de recettes vers la rationalisation des dépenses (la proportion devrait ainsi passer de 70 % de l’effort pour l’augmentation des recettes et 30 % pour la limitation des dépenses à 30 % et 70 % respectivement). À ce sujet, je voudrais souligner deux points:
– Premièrement, du point de vue méthodologique, il convient de noter que les dispositifs de prestations sociales, et plus généralement les politiques publiques, prennent souvent la forme d’exonérations et de dégrèvements fiscaux, aux côtés des transferts monétaires directs. La suppression des niches fiscales et la simplification des exonérations devraient donc être considérées autant comme desmesures touchant aux dépenses que comme des mesures touchant aux recettes. Tel a été le cas, en particulier, avec la réforme des allocations familiales annoncée récemment, qui prévoit à la fois une réduction des transferts monétaires directs et l’abaissement du plafond applicable pour la réduction de l’impôt sur le revenue dont bénéficient les parents;
– Deuxièmement, un grand nombre de mesures sont en cours pour assurer une plus grande efficacité des dépenses publiques. Existe déjà des mécanismes qui aident à limiter l’accroissement des dépenses en le maintenant à un niveau qui est meme en deçà de sa tendance naturelle. Il en est ainsi non seulement pour l’administration centrale, où le gel des dépenses en termes réels représente un effort notable, mais aussi pour les administrations de sécurité sociale, où, par exemple, la progression des dépenses d’assurance-santé est fermement maîtrisée, comme le relèvent les services du FMI dans leur document sur les economies réalisables du côté des dépenses. Le déficit des collectivités locales est soumis à une règle d’or qui empêche celles-ci de financer leurs dépenses courantes ou le refinancement de leurs dettes par de nouveaux emprunts. Les grandes politiques publiques font actuellement l’objet d’un réexamen dont l’objectif est d’en améliorer l’efficacité. En particulier, nous partageons l’avis des services du FMI qui estiment que la réforme des retraites sera un élément clé de

3
cette stratégie. Après une première avancée des partenaires sociaux concernant les retraites complémentaires obligatoires (sous-indexation pendant trois ans à compter de l’année prochaine), le gouvernement devrait être en mesure de présenter un projet de loi au Parlement d’ici à la fin de l’été.
Dernière considération, mais non des moindres, concernant la politique budgétaire, nous voudrions souligner que, ces dernières années, une grande attention a été accordée à la gouvernance des finances publiques. La France observe ainsi les norms les plus strictes en la matière, au moyen de mécanismes qui permettent une certain souplesse tout en assurant de façon crédible le respect des objectifs budgétaires à moyen terme, conformément à nos engagements européens. Dans ce nouveau cadre, le Haut Conseil des finances publiques, instance indépendante nouvellement créée, a commencé ses travaux et a déjà publié une première évaluation des hypotheses macroéconomiques qui sous-tendent les projections du gouvernement. De nouveaux avis publics suivront à l’automne pour alimenter le débat sur le budget 2014.
Programme structurel
Actuellement, le chômage reste la principale préoccupation. Comme cela a été expliqué lors des précédents entretiens au titre de l’article IV, le lancement des emplois d’avenir (employs subventionnés destinés aux jeunes peu qualifiés) et des contrats de génération (contrats qui accordent une subvention aux entreprises lorsqu’elles recrutent de jeunes travailleurs en gardant ceux qui sont plus âgés, et dont l’objectif est de stimuler l’emploi dans les tranches d’âge inférieure et supérieure) devrait contribuer à ralentir la progression du chômage. Le rapport des services du FMI insiste à juste titre sur l’importance de l’Accord national interprofessionnel sur l’emploi (ANI), accord conclu entre les partenaires sociaux en janvier, et de sa transposition dans la loi sans modifications. Les autorités que je représente sont convaincues que la mise en oeuvre de cet accord donnera une plus grande souplesse aux entreprises pour s’adapter aux conditions économiques et offrir aux travailleurs davantage de sécurité. Nombre de décisions seront désormais prises au niveau des entreprises, notamment pour ce qui est des réductions temporaires des salaires et des heures de travail en cas de ralentissement de l’activité, ce qui leur permettra de mieux s’adapter à l’évolution économique à court terme tout en renforçant le dialogue social au niveau de l’entreprise.
Deux réformes sont aussi prévues qui devraient contribuer à assouplir encore le marché du travail et à accroître le taux d’activité : les partenaires sociaux débattent actuellement d’une réforme du système d’assurance-chômage, qui devrait renforcer les mesures actives contre le chômage, mais aussi de la réforme du système de retraite, qui devrait continuer à accroître les incitations à travailler plus longtemps et donc la participation des seniors au marché du travail.
Nous ne sommes pas tout à fait d’accord avec l’évaluation des services du FMI concernant le salaire minimum. En effet, les réductions du «coin» fiscal sont importantes. Elles se sont

4
révélées efficaces pour compenser l’effet négatif du salaire minimum sur la demande de travail et pour stabiliser la proportion de main-d’oeuvre non qualifiée dans l’emploi total. Il convient de noter que l’augmentation automatique du salaire minimum devrait être relativement faible compte tenu du niveau modéré de l’inflation. Les autorités françaises ne sont pas convaincues par la proposition de gel du salaire minimum, alors que les règles d’indexation viennent d’être modifiées en 2013.
En s’appuyant sur la méthode de dialogue social appliquée avec succès pour l’ANI, le gouvernement a demandé le 8 juillet aux partenaires sociaux de se mettre d’accord sur une refonte du système de formation professionnelle, domaine où les possibilités d’amélioration sont considérables, comme l’ont souligné les services du FMI. Ils devraient présenter leurs suggestions à l’automne pour permettre au gouvernement de proposer un projet de loi avant la fin de 2013.
Les autorités françaises entendent aussi mettre en oeuvre le vaste programme lancé à l’automne dernier dans le cadre du Pacte national pour la croissance, la compétitivité et l’emploi. La balance commerciale française a commencé à se redresser à la fois en termes de compétitivité par les prix et hors prix (le déficit commercial hors énergie s’établissait fin mai à 5 milliards d’euros (0,25 % du PIB), contre 15 milliards d’euros pour la même période de 2011 (0,75 % du PIB)). Le programme pour la compétitivité est aussi illustré par le plan d’investissement à long terme d’un montant de 12 milliards d’euros présenté le 9 juillet (qui sera financé principalement par la vente de participations de l’État dans des enterprises cotées), mais il va au-delà de ces plans d’action spécifiques et fait aussi intervenir plusieurs autres politiques structurelles.
Les autorités françaises ont également engagé une série de mesures destinées à simplifier l’environnement administratif dans lequel les entreprises exercent leurs activités et à accroître la qualité du service public, comme l’ont noté les services du FMI. Le dernier Comité interministériel pour la modernisation de l’État, qui s’est réuni le 17 juillet, a vu legouvernement approuver plusieurs mesures concrètes pour donner corps au «choc de simplification» annoncé par le Président de la République. Entre autres, il a été décidé de revenir sur l’un des principes fondamentaux du droit administratif français, en vertu duquel l’approbation explicite de l’administration est requise pour chaque décision dans la plupart des domaines. À l’avenir, l’approbation tacite sera la norme — dans la plupart des domaines, l’absence de réaction dans un délai de deux mois vaudra approbation.
Une loi est actuellement débattue au Parlement sur la rationalisation des compétences entre les différents niveaux de l’administration locale : certains pouvoirs seront transférés au niveau considéré le plus efficace pour chaque politique et un dirigeant sera clairement désigné pour un certain nombre de domaines de l’action publique. La loi conférera notamment des pouvoirs renforcés au niveau métropolitain, l’objectif étant de créer des institutions solides couvrant chacune des grandes zones urbaines de manière à remédier aux carences institutionnelles et à l’absence de coordination entre des municipalités fragmentées,

5
sans pour autant ajouter de nouvelles strates administratives au niveau local (voir par exemple, les mesures spécifiques concernant les futures métropoles de Paris, Lyon et Marseille).
En ce qui concerne l’évolution du marché immobilier, qui ces dernières années a pesé non seulement sur la consommation des ménages mais aussi sur l’évolution globale de la compétitivité, les autorités françaises souscrivent à l’évaluation des services du FMI, selon laquelle les prix sont légèrement surévalués, même si nous estimons qu’à court terme la probabilité d’une correction des prix est «faible à moyenne» plutôt que «moyenne». Dans une perspective de moyen terme, les autorités françaises sont déterminées à corriger l’insuffisance de l’offre, à la fois en ouvrant à la construction une partie des terrains de l’État et en préparant des mesures pour simplifier la manière dont les décisions en matière de construction sont prises au niveau local.
Pour ce qui est des marchés de biens et de services, nous estimons, comme les services du FMI, qu’un certain nombre de goulets d’étranglement devraient être supprimés à moyen terme pour stimuler la productivité et l’emploi. Il convient de noter que la France participera au cours des deux années à venir à un exercice de revue de la directive Services, visant notamment à évaluer la transparence des professions réglementées.
Dans le secteur des transports, la réforme en cours a pour but de réunir les activités d’infrastructure et de maintenance en une seule entité afin d’assurer une gestion plus efficiente de l’infrastructure du réseau. Il s’agit de préparer le secteur ferroviaire à la concurrence, qui devrait être ouverte aux environs de 2019, en fonction du résultat des négociations en cours sur les nouvelles directives européennes. Il convient enfin de noter que le projet de loi de décentralisation mentionné plus haut comporte aussi des mesures visant à libéraliser les services de transport interrégionaux par car.
Secteur financier
Nous partageons l’analyse des services du FMI sur la bonne santé du système financier français, attestée également par le PESF de l’année dernière. Les groupes bancaires français ont continué à rééquilibrer leur mode de financement, conformément aux recommandations de l’Autorité de contrôle prudentiel (ACP) et du FMI, et ont renforcé leurs capitaux propres pour se conformer aux nouvelles règles de Bâle III dès 2013.
Nous nous félicitons du suivi du PESF, démarche utile pour assurer la poursuite d’un dialogue fructueux avec les autorités. De fait, les mesures relatives aux compétences de l’ACP et à la gouvernance des institutions financières (secteurs de la banque et de l’assurance) ont été intégrées à la loi bancaire, que le Parlement a adoptée définitivement il y a quelques jours. Cette loi représente une amélioration substantielle du cadre législatif dans trois domaines clés :

6
– elle instaure le cantonnement des activités spéculatives, avec le financement de l’économie réelle comme critère essentiel;
– elle renforce le cadre de gestion des crises en créant une autorité de resolution dont l’ACP, désormais dénommée ACPR (Autorité de contrôle prudentiel et de résolution), est la pièce maîtresse. Celle-ci est investie de nouveaux pouvoirs pour prévenir et gérer des crises bancaires (en particulier en ce qui concerne l’organisation interne des groupes bancaires, en phase avec les plans obligatoires de redressement et de résolution), sous la direction d’un conseil de resolution regroupant toutes les parties prenantes. L’ensemble de ce dispositif est conforme au cadre de la future directive européenne relative à la résolution des banques, sur laquelle le Conseil ÉCOFIN est parvenu à un accord il y a deux semaines;
– en ce qui concerne la supervision macroprudentielle, elle transforme le Comité de régulation financière et du risque systémique (COREFRIS) en un nouvel organisme doté de pouvoirs juridiquement contraignants, le Haut conseil de stabilité financière, qui met largement à contribution l’expertise de la Banque de France sous la présidence du Ministre des finances.
Nous nous réjouissons également de l’opinion des services du FMI selon laquelle la supervision exercée par l’ACP est de grande qualité et fondée sur une culture de supervision intrusive et sur place. En particulier, nous sommes heureux de constater que les services du FMI prennent acte du sérieux dont l’ACP fait preuve en contrôlant la validité des pondérations des risques ainsi que celle des modèles internes basés sur le risque utilisés par les banques.
Pour ce qui est du financement de l’économie, nous partageons l’avis des services du FMI qui estiment que la solidité globale du secteur bancaire a conduit à une plus grande resilience des flux de crédit vers l’économie réelle. Nous partageons aussi pour l’essentiel l’évaluation des réformes nécessaires pour accompagner la transformation structurelle en cours vers un système axé davantage sur la désintermédiation et pour mieux mobiliser l’épargne à long terme au profit des projets de financement à long terme. Le recours des entreprises aux marchés financiers s’est fortement accru ces dernières années, et des initiatives ont été lancées pour promouvoir la titrisation des prêts aux PME. La mobilisation de l’épargne à long terme est en cours à travers une approche à plusieurs volets :
– la création de la Banque publique d’investissement, qui regroupe plusieurs outils publics permettant d’effectuer des investissements sous forme de prises de participation et de prêts, outils qui étaient dispersés et qui seront désormais mieux coordonnés;
– le rééquilibrage des incitations fiscales relatives à divers produits d’épargne à long terme est en cours et les recommandations du rapport Berger-Lefebvre constituent une bonne base à cet égard. Il convient également de noter les modifications

7
apportées au cadre de l’assurance-vie, qui permettront aux groups d’assurance d’investir davantage dans le crédit aux PME;
– enfin, le gouvernement a annoncé la semaine dernière que 30 milliards d’euros de produits d’épargne réglementés (notamment le livret A) seraient reversés aux banques commerciales («décentralisés») pour accroître leur capacité de prêt aux PME, ce qui les aidera à renforcer leurs ratios de liquidité et atténuera l’impact de ce système spécifique.