Embed Size (px)
DESCRIPTION
IMD World Competitiveness Index VS Unemployment. Lam Ka Man 06015360 Sung Yuk Ling 06007260 Chow Cheuk Yin 06007201 Wan Tai Ho 06009077 Au Chun Lung 06015840. Academic definition of competitiveness. A field of Economic knowledge - PowerPoint PPT Presentation
Citation preview

IMD World IMD World Competitiveness Index Competitiveness Index VS VS UnemploymentUnemployment
Lam Ka Man 06015360
Sung Yuk Ling 06007260
Chow Cheuk Yin 06007201
Wan Tai Ho 06009077
Au Chun Lung 06015840

Academic definition of competitiveness
A field of Economic knowledge Analyzes the facts and policies that shape
the ability of a nation Create and maintain an environment that
sustains more value creation for its enterprises and more prosperity for its people

More precisely
Competitiveness analyzes how nations
and enterprises manage the totality of their
competencies to achieve prosperity and
profit

About WCI The ranking represent a success, economic
performance, wealth of a nation
The ability of nations create and maintain a competitive environment
Investigate the global economic situation
WCI and its ranking provide a frame of reference to asses how nations mange their economic future

WCI – World Competitiveness IndexComputed by IMD - International Institute for Management
Development
A leading provider of Executive Education located in Swiss

WCI – World Competitiveness IndexPublished in
WCY - World Competitiveness Yearbook World’s most renowned and comprehensive annual report on the competitiveness of nations
Ranking and analyzing how a nation’s environment creates and sustains the competitiveness of enterprises
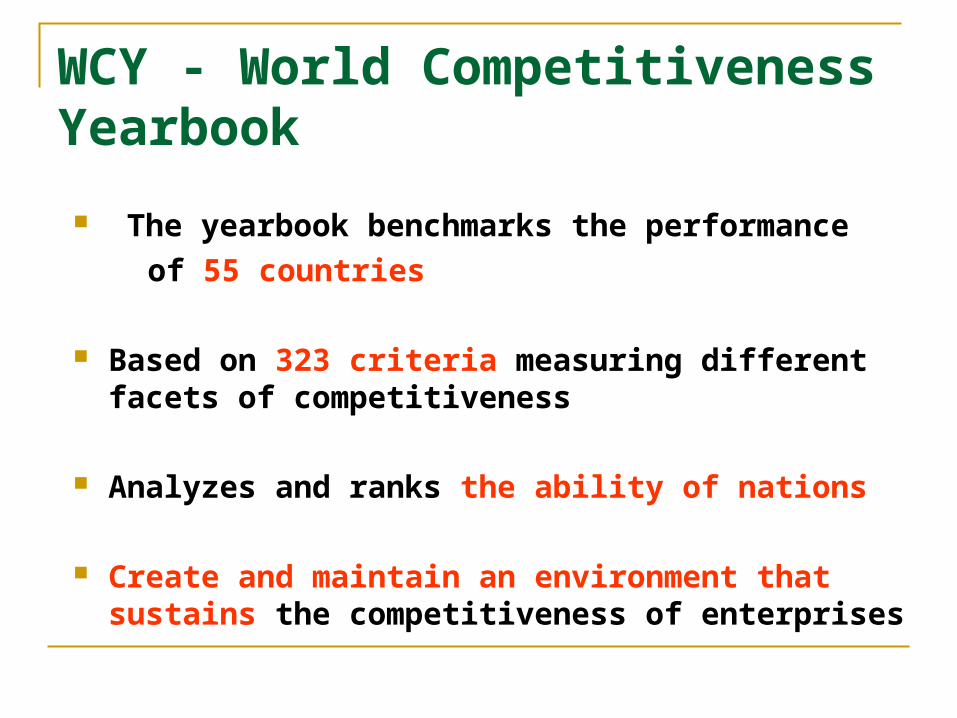
WCY - World Competitiveness Yearbook
The yearbook benchmarks the performance
of 55 countries
Based on 323 criteria measuring different facets of competitiveness
Analyzes and ranks the ability of nations
Create and maintain an environment that sustains
the competitiveness of enterprises

Why are these economies are chosen?
All key players in world markets
Impact on the global economy
In 2007, added two new countries (Lithuania and Ukraine)

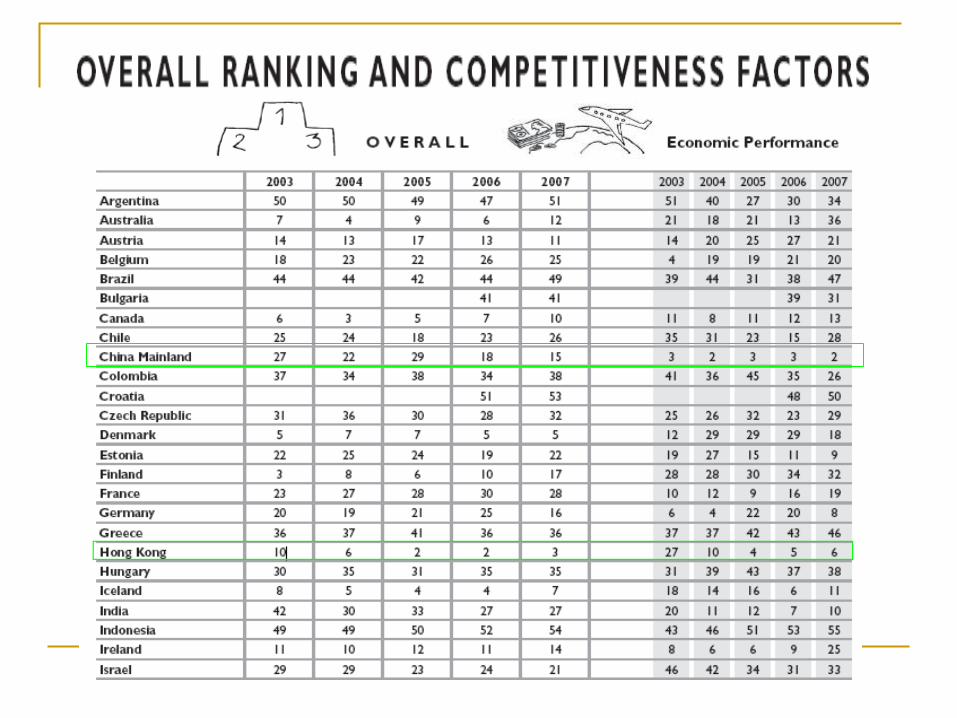
Methodology
The criteria used to compute the
rankings are grouped into 4 main
factors divided into 20 sub-factors

Methodology
Economic Performance
Government Efficiency
Business Efficiency
Infrastructure

Economic Performance
Domestic economy
International trade
International investment
Employment
Prices

Government Efficiency
Public finance
Fiscal policy
Institutional framework
Business legislation
Societal framework

Business Efficiency
Productivity
Labor market
Finance
Management practices
Attitudes and values

Infrastructure
Basic infrastructure
Technological infrastructure
Scientific infrastructure
Health and environment
Education

The Golden Rules of Competitiveness Rule 1 Create a stable and predictable legislative environment Rule 2 Work on a flexible and resilient economic structure• Rule 3 Invest in traditional and technological infrastructure

The Golden Rules of Competitiveness Rule 4 Promote private savings and domestic
investment Rule 5
Develop aggressiveness on the
international markets as well as
attractiveness for foreign direct
investment

The Golden Rules of Competitiveness Rule 6 Focus on quality, speed and transparency
in government and administration Rule 7
Maintain a relationship between wage
levels, productivity and taxation Rule 8
Preserve the social fabric by reducing wage
disparity and strengthening the middle class

The Golden Rules of Competitiveness Rule 9 Invest heavily in education, especially at
the secondary level, and in the life-long
training of the labor force Rule 10
Balance the economies of proximity and
globality to ensure substantial wealth creation,
while preserving the value systems that citizens
desire


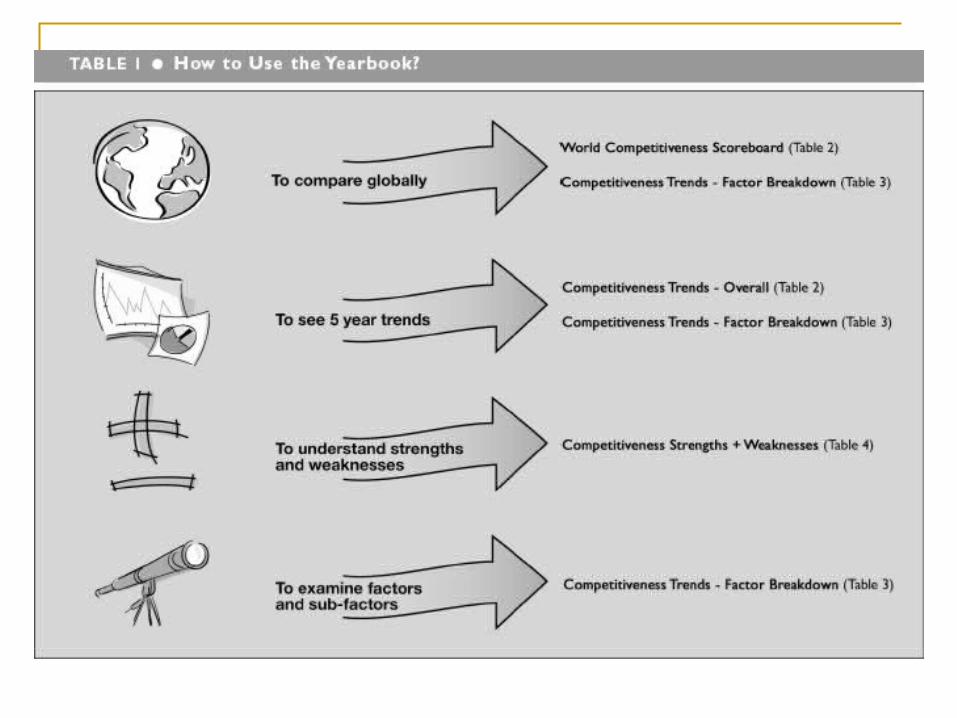
How to use the
World Competitiveness Index?


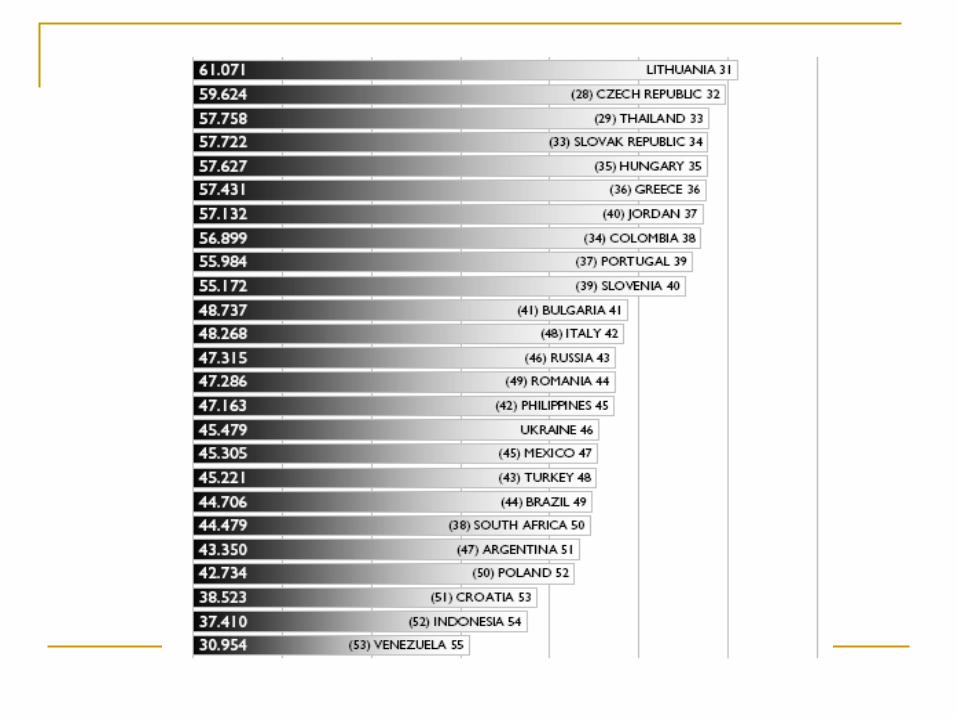
World Competitiveness Scoreboard Presents the 2007 overall rankings for the
55 economies covered by the WCY The rankings are calculated on the basis
of the 246 ranked criteria included in the
Yearbook
127 Hard and 119 Survey data The countries are ranked from the most to
the least competitive


The relationship between WCI and unemployment
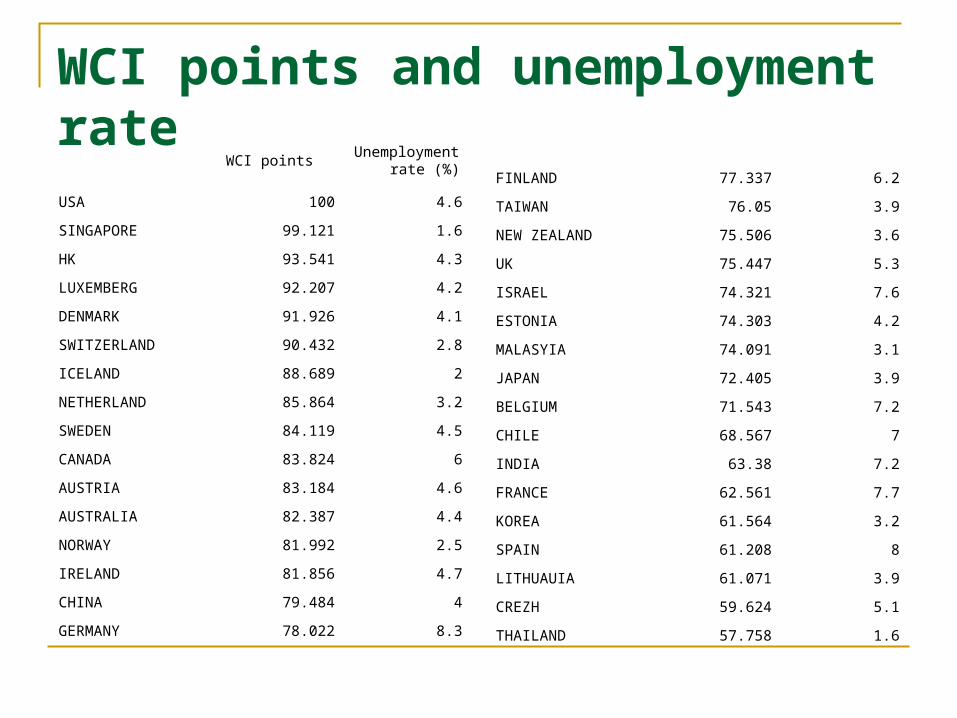
WCI points and unemployment rate
WCI pointsUnemploymen
t rate (%)
USA 100 4.6
SINGAPORE 99.121 1.6
HK 93.541 4.3
LUXEMBERG 92.207 4.2
DENMARK 91.926 4.1
SWITZERLAND 90.432 2.8
ICELAND 88.689 2
NETHERLAND 85.864 3.2
SWEDEN 84.119 4.5
CANADA 83.824 6
AUSTRIA 83.184 4.6
AUSTRALIA 82.387 4.4
NORWAY 81.992 2.5
IRELAND 81.856 4.7
CHINA 79.484 4
GERMANY 78.022 8.3
FINLAND 77.337 6.2
TAIWAN 76.05 3.9
NEW ZEALAND 75.506 3.6
UK 75.447 5.3
ISRAEL 74.321 7.6
ESTONIA 74.303 4.2
MALASYIA 74.091 3.1
JAPAN 72.405 3.9
BELGIUM 71.543 7.2
CHILE 68.567 7
INDIA 63.38 7.2
FRANCE 62.561 7.7
KOREA 61.564 3.2
SPAIN 61.208 8
LITHUAUIA 61.071 3.9
CREZH 59.624 5.1
THAILAND 57.758 1.6

WCI points and unemployment rateSLOVAK 57.722 11.3
HUNGARY 57.627 7.2
GREECE 57.431 7.9
JORDAN 57.132 13.5
COLOMBIA 56.899 11.2
PORTUGAL 55.984 7.9
SOLVENIA 55.172 4.4
BULGARIA 48.737 6.6
ITALY 48.268 5.6
RUSSIA 47.315 5.9
ROMANIA 47.286 6
PHILLIPINES 47.163 7.3
UKRAINE 45.479 2.5
MEXICO 45.305 3.9
TURKEY 45.221 9.2
BRAZIL 44.706 9.3
SOUTH AFRICA 44.479 25.5
ARGENTINA 43.35 8.9
POLAND 42.734 9
CROATIA 38.523 11.8
INDONESIA 37.41 9.7
VENEZUELA 30.954 8.3

France VS Korea
France: rank:29 (62.561)
unemployment rate: 7.7% Korea: rank:30 (61.564)
unemployment rate: 3.2%

France VS Korea
France(7.7) Korea(3.2)
GDP - real growth rate 1.8% (2007 est.) 4.9% (2007 est.)
GDP - per capita (PPP): $33,800 (2007 est.) $24,600 (2007 est.)
Inflation rate (consumer prices):
1.5% (2007 est.) 2.5% (2007)
Investment (gross fixed): 20.7% of GDP (2007 est.) 27.8% of GDP (2007 est.)
Budget: revenues: $1,311 billion expenditures: $1,372 billion
Deficit: 61billion
(2007 est.)
revenues: $269.7 billion expenditures: $256.6 billion
Deficit: 13.1billion
(2007 est.)
Current account balance: -$35.94 billion (2007 est.) $5.95 billion (2007)

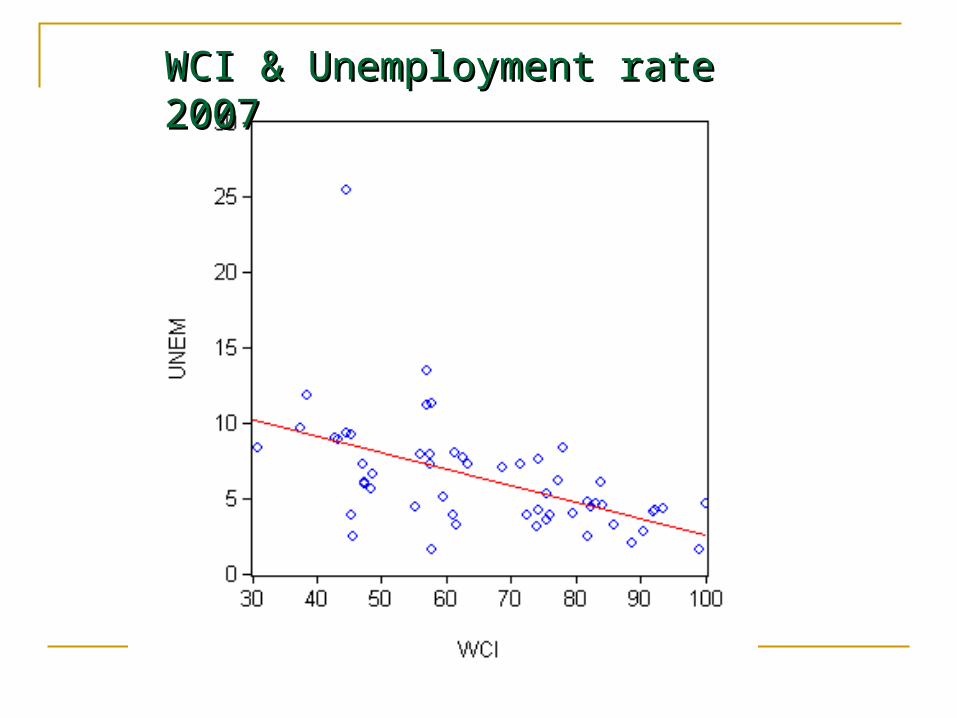
WCI & Unemployment rate 2007WCI & Unemployment rate 2007

The relation between WCI and unemployment rate (2007 calculation) H0: β1=0
HA: β1≠0Rejection rule: reject H0 if |t| > tc
Let α=0.05degree of freedom =55-1-1tc: t0.025, 53≈ 2.0003
From Eview, |t|=4.37584
As |t| > tc, we reject H0. Therefore we conclude that β1 is significantly different form 0.
The relation between WCI and unemployment rate
After the calculation, we can conclude that WCI has a weak negative relationship with UNEMPLOYMENT RATE.

Why the relationship between WCI and unemployment rate are so weak? Only a few components of WCI are directly
reflected the Employment/Labor Market.

Why the relationship between WCI and unemployment rate are so weak? (con’t) The goals of WCI is not measuring the labor
market . It ignored many factors which affecting the employment.
- The law of protesting labor. - The market power of union. - The welfare of no job workers. - The tradition of the country

The law of protesting labor Example: minimum wages. Theoretically, By raising the wage of
unskilled and inexperienced workers above the equilibrium level, minimum wage laws raise the quantity of labor supplied and reduce the quantity demanded. The resulting excess supply of labor represents unemployment.

The market power of union When the unions are having enough market
power. When unions push the wages in unionized industries above the equilibrium level, they create an excess supply of labor.
On the other hand, unions can bargain with the company and government. It result the firm can not fire the labor easily. (France)

The welfare for unemployed workers
the Frictional unemployment.
Unemployment insurance is a government policy that, while protesting workers’ incomes
the amount of search unemployment.

The tradition of the country For example, Japan’s tradition is lifetime
employment Most large firms offer guaranteed lifetime
employment. Retirement age is 55.
Therefore, the Japan unemployment rate keeps in low level.

WCI has a negative relationship with UNEMPLOYMENT RATE The WCI ranking represent a success, economic
performance, wealth of a nation. It can Implied that the higher WCI rank the higher output (GDP) lower unemployment rate

WCI has a negative relationship with UNEMPLOYMENT RATE Those factors are affecting the output level
and GDP level Such as the Domestic Economy, Fiscal
Policy, Productivity & Efficiency. Some factors also affect the quality of labor
indirectly Such as Basic Technological, Health &
Environment and Education.

WCI has a negative relationship with UNEMPLOYMENT RATE
We can conclude that WCI can explain the unemployment rate. But the relation is not too close.


![œ‹際瞭望台.pdfWORLDWIDE (International Institute for Management Development, IMD tž (World Competitiveness Yearbook) (UBS Prices and , (IMD) [2] [3] [4] [5] [6] [12] [131 [25]](https://img.dokumen.tips/doc/110x75/60dc61b7e3f85f0dd33cb958/oeecoepdf-worldwide-international-institute-for-management-development.jpg)