Embed Size (px)
Citation preview
Navy Experimental Diving Unit 321 Bullfinch Rd. Panama City, FL 32407-7015
TA 05-02 NEDU TR 08-04 MARCH 2008
PULMONARY EFFECTS OF U.S. NAVY TREATMENT TABLE 6
HYPERBARIC EXPOSURE
IMAVSEA NAVAL SEA SYSTEMS COMMAND
Navy Experimental Diving Unit
Author: B. Shykoff, Ph.D. Distribution Statement A:
Approved for public release;
distribution is unlimited.
20090203134

UNCLASSIFIED SECURITY CLASSIFICATION OF THIS PAGE
REPORT DOCUMENTATION PAGE
1a. REPORT SECURITY CLASSIFICATION Unclassified
1b. RESTRICTIVE MARKINGS
2a. SECURITY CLASSIFICATION AUTHORITY
2b. DECLASSIFICATION/DOWNGRADING AUTHORITY
3. DISTRIBUTION/AVAILABILITY OF REPORT
DISTRIBUTION STATEMENT A: Approved for public release; distribution is unlimited.
4. PERFORMING ORGANIZATION REPORT NUMBER(S) NEDU Technical Report No 08-04
5. MONITORING ORGANIZATION REPORT NUMBER(S)
6a. NAME OF PERFORMING ORGANIZATION Navy Experimental Diving Unit
6b. OFFICE SYMBOL (If Applicable)
7a. NAME OF MONITORING ORGANIZATION
6c. ADDRESS (City, State, and ZIP Code) 321 Bullfinch Road, Panama City. FL 32407-7015
7b. ADDRESS (City, State, and Zip Code)
8a. NAME OF FUNDING SPONSORING ORGANIZATION
NAVSEA N873
8b. OFFICE SYMBOL (If Applicable)
9. PROCUREMENT INSTRUMENT IDENTIFICATION NUMBER
8c. ADDRESS (City, State, and ZIP Code)
CNO N873, Deep Submergence, Chief of Naval Operations, Submarine Warfare Division, 2000 Navy Pentagon, PT-4000, Washington, DC 20350
10. SOURCE OF FUNDING NUMBERS
PROGRAM ELEMENT NO.
PROJECT NO.
TASK NO. 05-02
WORK UNIT ACCESSION NO.
11. TITLE (Include Security Classification) (U) Pulmonary Effects of U.S. Navy Treatment Table 6 Hyperbaric Exposure
12. PERSONAL AUTHOR(S) B. Shykoff, Ph.D.
13a. TYPE OF REPORT Technical Report
13b. TIME COVERED April 2005
14. DATE OF REPORT March 2008
15. PAGE COUNT '10
16. SUPPLEMENTARY NOTATION
17. COSATI CODES 18. SUBJECT TERMS (Continue on reverse if necessary and identify by block number)
FIELD GROUP SUB-GROUP TT6, Pulmonary oxygen toxicity, FVC, DLCO, FEVi, diffusing capacity, recompression treatment, MK 25, LAR V
19. ABSTRACT: Eighteen healthy subjects underwent pulmonary function measurements after single experimental Treatment Table 6 (TT6) recompression exposures in which oxygen was delivered from MK 25 rebreather underwater breathing apparatus. Most subjects showed no pulmonary function changes, but three had mildly decreased flow-volume parameters on surfacing and one developed changes later, for a 22% incidence (95% binomial confidence interval 6 to 48%). All changes resolved spontaneously over the next several days. This incidence of decreased pulmonary function after rebreather TT6 may underestimate slightly the incidence after conventional oxygen delivery, because inspired oxygen fraction is lower and gas is more humid with the MK 25 than with conventional systems. Nonetheless, the pulmonary insult from a TT6 is minor in comparison to the benefit to be gained if recompression therapy is indicated.
20. DISTRIBUTION/AVAILABILITY OF ABSTRACT
f| UNCLASSIFIED/UNLIMITED |x| SAME AS RPT. | | DTIC USERS
21. ABSTRACT SECURITY CLASSIFICATION
Unclassified
22a. NAME OF RESPONSIBLE INDIVIDUAL NEDU Librarian
22b. TELEPHONE (Include Area Code) 850-230-3100
22c. OFFICE SYMBOL 03
DD Form 1473 UNCLASSIFIED
CONTENTS
Page No.
DD Form 1473 i Contents ii
Introduction 1 Methods 2
General 2 Experimental Design and Analysis 2 Equipment and Instrumentation 2
Results 3 Discussion 5 Conclusions 6
References 7
TABLES
Table 1. Decreases in Pulmonary Function when Outside Normal Variation .... 3 Table 2. Average Changes in Pulmonary Function Variables 3
FIGURES
Figure 1. U.S. Navy Diving Manual Treatment Table 6 1 Figure 2. % Changes from baseline, flow-volume parameters 4 Figure 3. % Changes from baseline, DLCO 5
INTRODUCTION
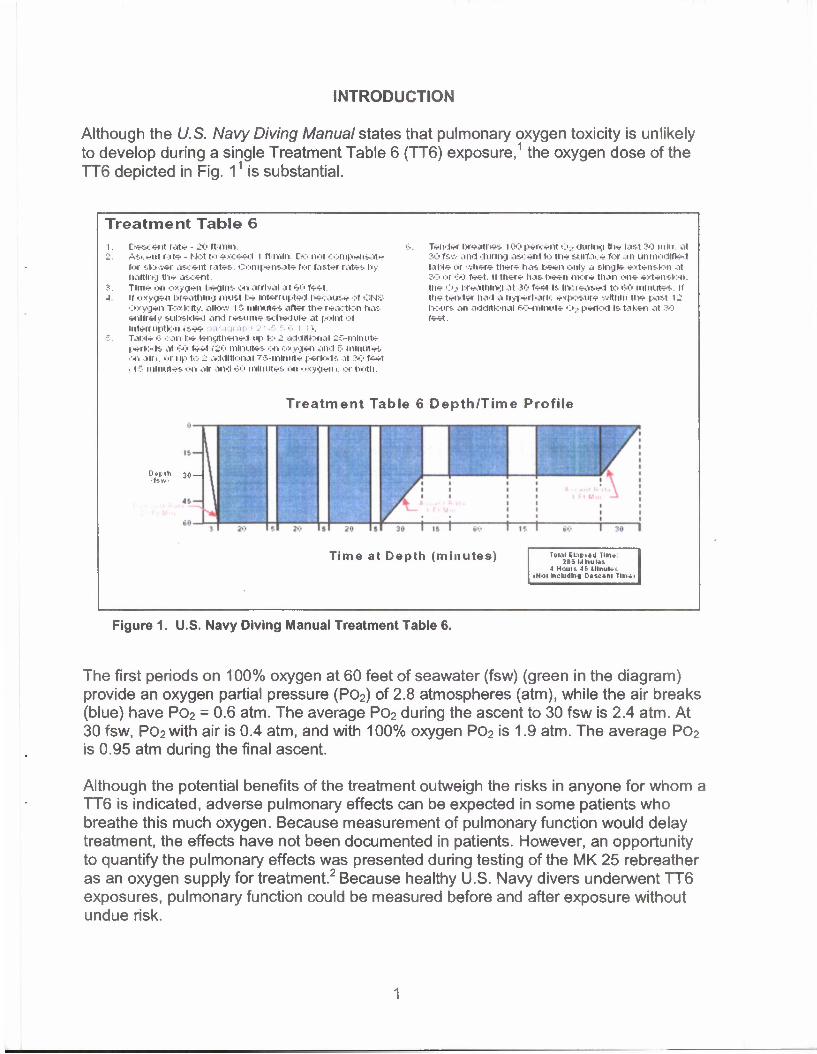
Although the U.S. Navy Diving Manual states that pulmonary oxygen toxicity is unlikely to develop during a single Treatment Table 6 (TT6) exposure,1 the oxygen dose of the TT6 depicted in Fig. 11 is substantial.
Treatment Table 6
Descent rate - JO ft mm. Ascent rate - Not to exceed l ft mm Do not compensate for slower ascent rates-. Compensate for taster rates by- halting the ascent. Tim* on oxygen begins on arrival at 60 feet if oxygen breathing must be Interrupted because of CNS Oxygen Toxicity. aiio-.v if. minutes after the reaction ha-:. entirely subsided and resume schedule at point of Interruption (see iragraph 21-5 5 6 i l). Table ':• can be lengthened up to - additional 26-nilnut* periods at 60 feet (iO minutes on oxygen and 5 minutes on alri. or up to 2 additional 75-mmute periods at ?••:• feet • I "• minutes on air and 60 minutes "ii oxygeni. >>r both.
Tender breathes 100 percent Oa during the last 30 mm. at 30 fsw and during as.<: ent to the surface for in unmodified table or where there has \:-s*ri\ only a single extension at 30 or 60 feet. If there has been more than on* extension. th* Oa breathing .it JO feet Is. Increased to 60 minutes If the tender had a hyperbarfc exposure within the past 12 hours an additional 60-nihuite •:». period Is taken at 30 feet.
Treatment Table 6 Depth/Time Profile
D*Mh 30 — • fsv. •
Time at Depth (minutes) row Ekiptod Tin*: 265 MktuMs
4 Hounds IllnuU'. >Nol Including Descent llnw
Figure 1. U.S. Navy Diving Manual Treatment Table 6.
The first periods on 100% oxygen at 60 feet of seawater (fsw) (green in the diagram) provide an oxygen partial pressure (PO2) of 2.8 atmospheres (atm), while the air breaks (blue) have PO2 = 0.6 atm. The average PO2 during the ascent to 30 fsw is 2.4 atm. At 30 fsw, P02with air is 0.4 atm, and with 100% oxygen PO2 is 1.9 atm. The average PO2 is 0.95 atm during the final ascent.
Although the potential benefits of the treatment outweigh the risks in anyone for whom a TT6 is indicated, adverse pulmonary effects can be expected in some patients who breathe this much oxygen. Because measurement of pulmonary function would delay treatment, the effects have not been documented in patients. However, an opportunity to quantify the pulmonary effects was presented during testing of the MK 25 rebreather as an oxygen supply for treatment.2 Because healthy U.S. Navy divers underwent TT6 exposures, pulmonary function could be measured before and after exposure without undue risk.
We recorded forced flow-volume loops to determine forced vital capacity (FVC), forced expired volume in one second (FEVi), peak expired flow or maximum forced expired flow (FEFmax), and average forced expiratory flow from 25% to 75% of expired volume (FEF25-75). Diffusing capacity of the lung for carbon monoxide (DLCO) was determined from single breath tests.
METHODS
GENERAL
Eighteen divers from Navy Experimental Diving Unit (NEDU) participated in TT6 dive profiles in the Ocean Simulation Facility. Divers used the MK 25 underwater breathing apparatus (UBA) as their oxygen sources. Details of the dives are given in a separate report.2
Before ("baseline") and for at least two days following (longer if we saw changes), we measured flow-volume loops and diffusing capacity for carbon monoxide for 17 divers once a day. We considered averages from three consistent maneuvers. DLCO values from 10 s breath holds were adjusted for carboxyhemoglobin and hemoglobin concentrations,3 and samples were chosen to ensure that the analyzer signal was stable when measurements were recorded.4
EXPERIMENTAL DESIGN AND ANALYSIS
Each subject's posttreatment values were compared to his baseline values. Variables were considered to have decreased if they were below the lower 95% confidence bands previously found for the NEDU population: namely, 7.7% for FVC, 8.4% for FEV^ 16.8% for FEFmax, 17.0% for FEF25-75, and 14.2% for DLC0.5
Confidence in estimates of the incidence of changes in pulmonary function with a = 0.05 (95% confidence in the proportion) was obtained from the binomial distribution.
EQUIPMENT AND INSTRUMENTATION
The Collins CPL or GS Pulmonary Function Testing System instruments (Collins Ferraris Respiratory; Louisville, CO) were used to measure pulmonary function. The test gas used to measure DLCO contained 0.3% CO and 0.3% methane. A CO oximeter (Instrumentation Laboratory; Lexington, MA) determined carboxyhemoglobin and hemoglobin concentrations from a venous blood sample.
RESULTS
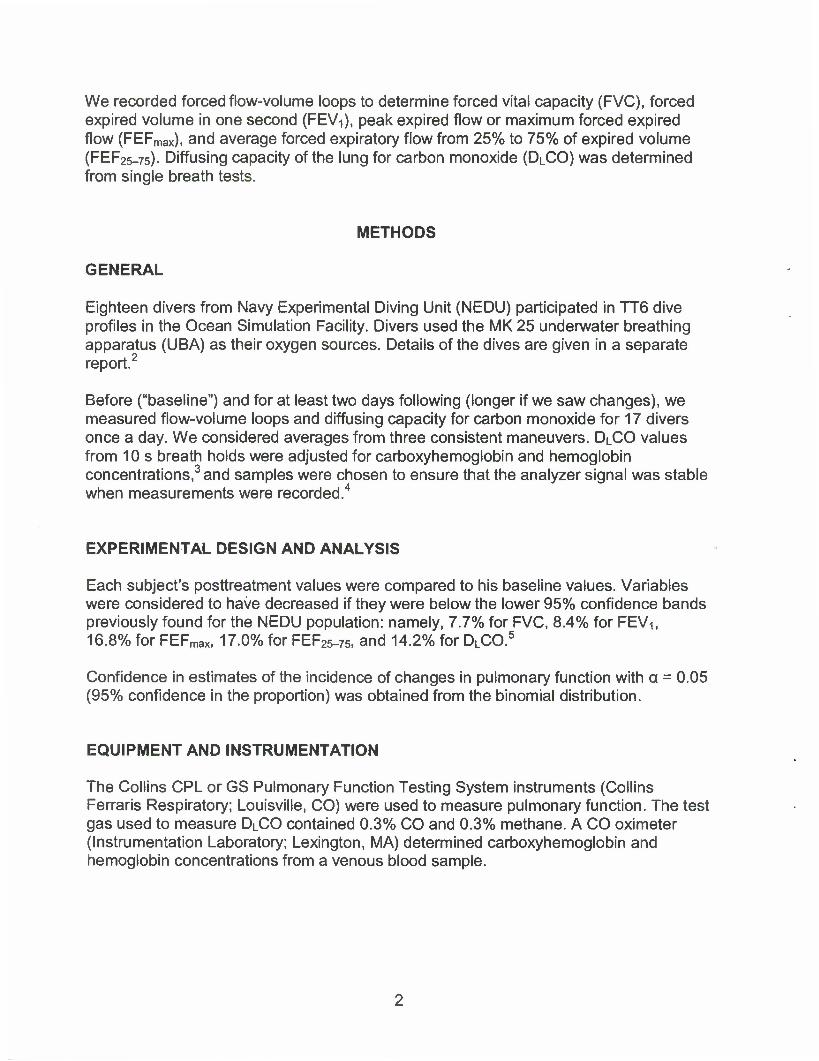
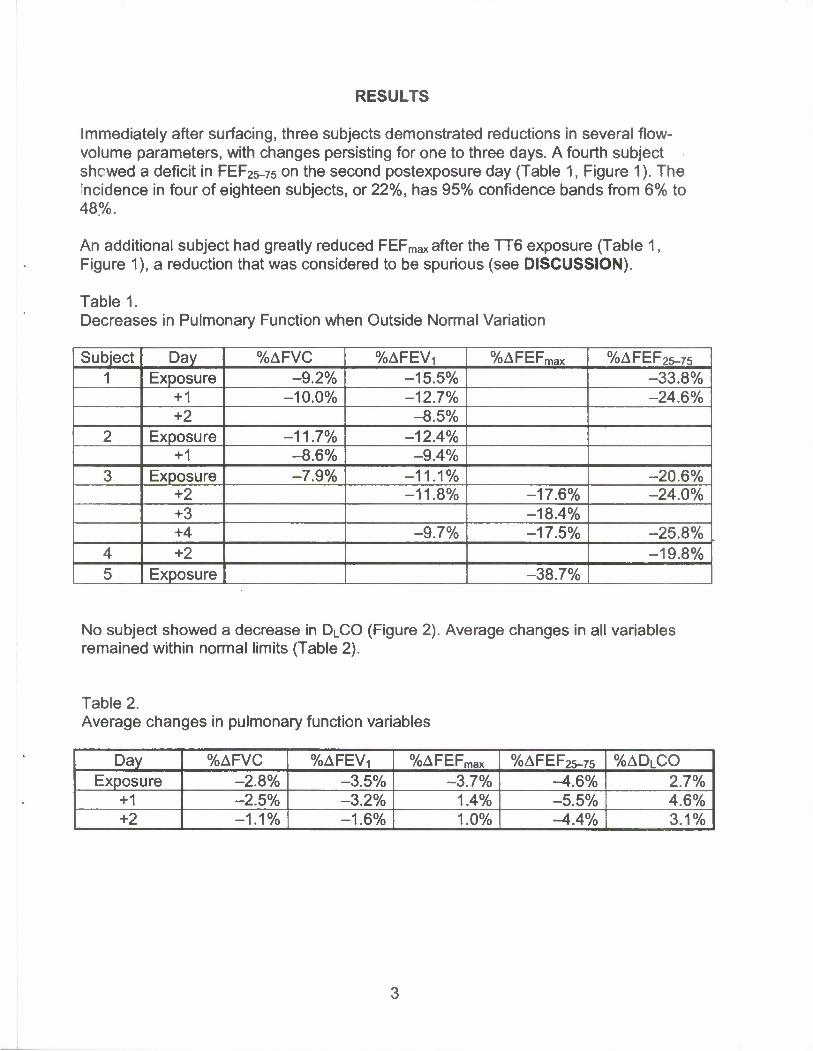
Immediately after surfacing, three subjects demonstrated reductions in several flow- volume parameters, with changes persisting for one to three days. A fourth subject shewed a deficit in FEF25-75 on the second postexposure day (Table 1, Figure 1). The incidence in four of eighteen subjects, or 22%, has 95% confidence bands from 6% to 48%.
An additional subject had greatly reduced FEFmax after the TT6 exposure (Table 1, Figure 1), a reduction that was considered to be spurious (see DISCUSSION).
Table! Decreases in Pulmonary Function when Outside Normal Variation
Subject Day %AFVC %AFEV, %AFEFmax %AFEF25-75 1 Exposure -9.2% -15.5% -33.8%
+1 -10.0% -12.7% -24.6% +2 -8.5%
2 Exposure -11.7% -12.4% +1 -8.6% -9.4%
3 Exposure -7.9% -11.1% -20.6% +2 -11.8% -17.6% -24.0% +3 -18.4% +4 -9.7% -17.5% -25.8%
4 +2 -19.8% 5 Exposure -38.7%
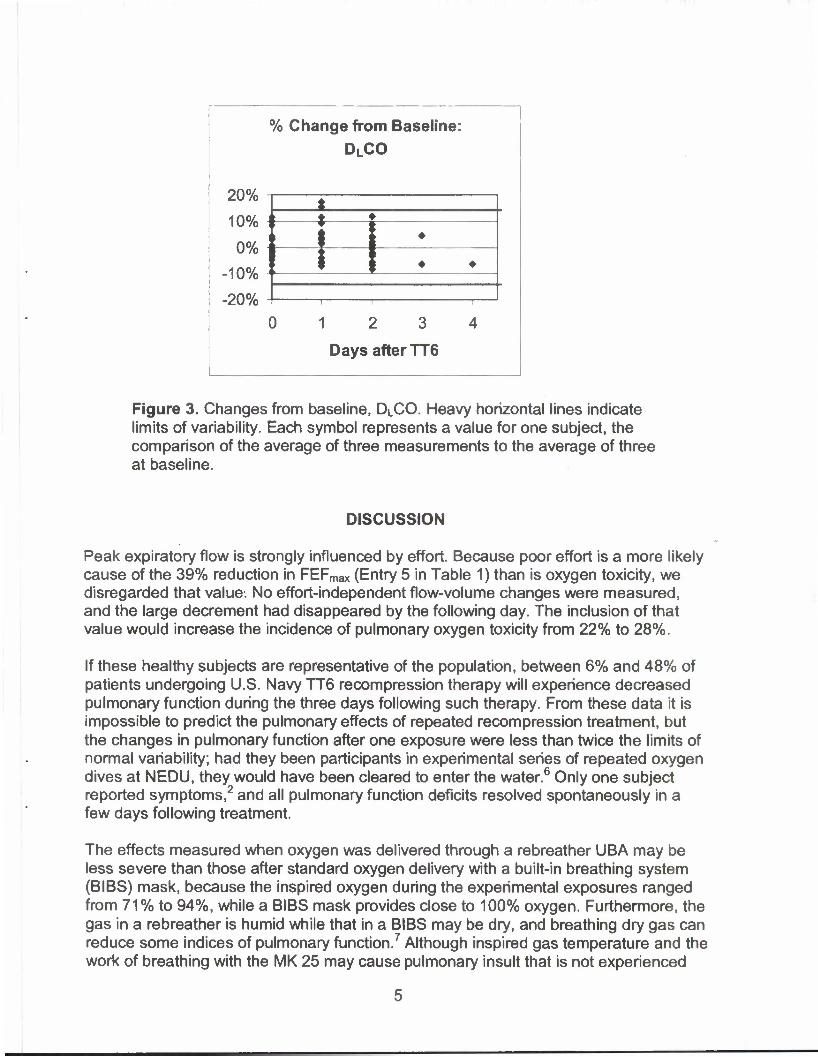
No subject showed a decrease in DLCO (Figure 2). Average changes in all variables remained within normal limits (Table 2).
Table 2. Average changes in pulmonary function variables
Day %AFVC %AFEVT %AFEFmax %AFEF25-75 %ADLCO Exposure -2.8% -3.5% -3.7% -^.6% 2.7%
+1 -2.5% -3.2% 1.4% -5.5% 4.6% +2 -1.1% -1.6% 1.0% -4.4% 3.1%

% Change from Baseline: FVC
16%
8%
0%
-8%
-16%
} i 1 1—
1 2 3
Days after TT6
% Change from Baseline:
FEFmax
40%
0%
-40%
f 4 •
0 12 3 4
Days after TT6
% Change from Baseline: FEVi
8%
0%
-8% i
-16%
$ -•-
0 12 3 4
Days after TT6
% Change from Baseline: FEF25.75
20%
0% ]
-20% i
-40%
•
rt •
12 3 4 Days after TT6
Figure 2. Changes from baseline, flow-volume parameters. Heavy horizontal lines indicate limits of variability. Each symbol represents a value for one subject, the comparison of the average of three measurements to the average of three at baseline.
% Change from Baseline: DLCO
20%
10%
0%
-10%
-20% 1 2 3
Days after TT6
Figure 3. Changes from baseline, Di_CO. Heavy horizontal lines indicate limits of variability. Each symbol represents a value for one subject, the comparison of the average of three measurements to the average of three at baseline.
DISCUSSION
Peak expiratory flow is strongly influenced by effort. Because poor effort is a more likely cause of the 39% reduction in FEFmax (Entry 5 in Table 1) than is oxygen toxicity, we disregarded that value. No effort-independent flow-volume changes were measured, and the large decrement had disappeared by the following day. The inclusion of that value would increase the incidence of pulmonary oxygen toxicity from 22% to 28%.
If these healthy subjects are representative of the population, between 6% and 48% of patients undergoing U.S. Navy TT6 recompression therapy will experience decreased pulmonary function during the three days following such therapy. From these data it is impossible to predict the pulmonary effects of repeated recompression treatment, but the changes in pulmonary function after one exposure were less than twice the limits of normal variability; had they been participants in experimental series of repeated oxygen dives at NEDU, they would have been cleared to enter the water.6 Only one subject reported symptoms,2 and all pulmonary function deficits resolved spontaneously in a few days following treatment.
The effects measured when oxygen was delivered through a rebreather UBA may be less severe than those after standard oxygen delivery with a built-in breathing system (BIBS) mask, because the inspired oxygen during the experimental exposures ranged from 71% to 94%, while a BIBS mask provides close to 100% oxygen. Furthermore, the gas in a rebreather is humid while that in a BIBS may be dry, and breathing dry gas can reduce some indices of pulmonary function.7 Although inspired gas temperature and the work of breathing with the MK 25 may cause pulmonary insult that is not experienced
with the BIBS mask, none of these subjects reported that the gas was uncomfortably warm, and only two divers reported that the work of breathing the MK 25 was noticeable.2
CONCLUSIONS
Although even a single TT6 does cause pulmonary changes in some subjects, pulmonary oxygen toxicity is a minor risk for the benefit possible when recompression therapy is indicated. The pulmonary effects did not impact in these healthy subjects on the days following the exposure.

REFERENCES
1. Commander, Naval Sea Systems Command, U.S. Navy Diving Manual, Revision 5 (Arlington, VA: NAVSEA, 2005), pp. 20-25, 20-42.
2. P. J. Hennessey and S. Allain, Evaluation of Perfomiance ofMK 25 Mod 2 UBA During Conduct of a U.S. Navy Treatment Table 6, NEDU TR 05-11, Navy Experimental Diving Unit, May 2005.
3. Instruction Manual for the Collins Comprehensive Pulmonary Laboratory (CPL) (Braintree, MA: Collins Medical, 2000), p. 149.
4. B. E. Shykoff, Measurement of Diffusing Capacity for Carbon Monoxide (DLCO), NEDU TR 02-04, Navy Experimental Diving Unit, May 2002.
5. B. E. Shykoff, Pulmonary Effects of Submerged Breathing of Air or Oxygen, NEDU TR 02-14, Navy Experimental Diving Unit, Nov 2002.
6. B. E. Shykoff, Repeated Four-Hour Dives with Po2 - 1.35 atm, NEDU TR 04-29, Navy Experimental Diving Unit, June 2004.
7. E. Thorsen, I. Ronnestad, K. Segedal, and A. Hope, "Respiratory Effects of Warm and Dry Air at Increased Ambient Pressure," Undersea Biomed. Res., Vol. 19, No. 2 (1992), pp. 73-83.