Embed Size (px)
Citation preview

Imaging of PediatricPituitary Abnormalit ies
Bradley N. Delman, MD
KEYWORDS
� Pituitary imaging � Pituitary malformations� Midline anomalies � Imaging of endocrinopathy
The normal pituitary is a bean-shaped gland that resides in the sella turcica, a fossa inthe superior sphenoid bone within the central skull base. In humans, the gland has twodominant lobes, the posterior lobe (neurohypophysis, neural lobe) and the anteriorlobe (adenohypophysis). The adenohypophysis is further comprised of: the pars dis-talis, which forms the most the anterior lobe; the pars tuberalis, which partiallyenvelops the inferior stalk; and the pars intermedia, which correlates with the interme-diate lobe in lower animals and which may secrete pro-opiomelanocortin (POMC) inthe younger population, but is felt to involute by adulthood.1 Anterior and posteriorlobes are distinct embryologically and functionally. The hypothalamus, which is situ-ated directly above, along the inferolateral aspect of the third ventricle, directs activityto each lobe by a different mechanism.
Magnocellular pathway. Hormonal supply to the posterior pituitary (neurohypo-physis) is mediated through the magnocellular neurosecretory pathway.Because the posterior gland develops in contiguity with the hypothalamus,axons run continuously from the hypothalamic supraoptic and paraventricularnuclei into the neurohypophysis. The secretory mechanism relies on preservedaxonal structure to transport oxytocin and vasopressin-containing vesicles fromthe cell bodies into the neurohypophysis.
Parvocellular pathway. The anterior pituitary (adenohypophysis) develops from anembryologic anlage that is distinct from the hypothalamus. As a result, no axonalcontiguity exists between the hypothalamus and the anterior gland. This mech-anism of hypothalamic-pituitary communication relies instead on the hypotha-lamic-hypophyseal portal system. The portal system transmits parvocellularmessengers from the hypothalamic median eminence into the capillary bed ofthe anterior gland, where the messenger hormones can effect their influence toregulate adenohypophyseal secretion. Hormones secreted from the anterior glandinclude those that are derived from the basophilic population (follicle-stimulating
Department of Radiology, The Mount Sinai School of Medicine, One Gustave L. Levy Place, Box1234, New York, NY 10029-6574, USAE-mail address: [email protected]
Endocrinol Metab Clin N Am 38 (2009) 673–698doi:10.1016/j.ecl.2009.09.001 endo.theclinics.com0889-8529/09/$ – see front matter ª 2009 Elsevier Inc. All rights reserved.

Delman674
hormone, luteinizing hormone, corticotropin [ACTH], and thyroid-stimulatinghormone) and those that are derived from the eosinophilic population (prolactinand growth hormone). In addition to these classic hormones, it is clear that theadenohypophysis also secretes many additional growth factors, cytokines, neuro-transmitters, and other peptides.2
Both the hypothalamic axons and the hypophyseal portal system course throughthe hypothalamic infundibulum into the pituitary stalk. The stalk then inserts on thegland at or near its midline, at approximately the junction of the mid and posteriorthirds. This position correlates roughly with the midpoint of the junction of the largeranterior and smaller posterior lobes. In practice, there can be significant variabilityeven within the normal population in the overall size of the gland, the relative propor-tions of anterior and posterior lobes, the laterality of stalk insertion, and the overallbilateral symmetry of the gland.
Because of their differing embryologic origins, the anterior and posterior lobes havedistinct arterial supplies.3,4
Posterior pituitary supply. The posterior pituitary derives its supply primarily fromthe inferior hypophyseal arteries, which arise bilaterally from the meningohypo-physeal trunks. These meningohypophyseal trunks, which branch from thedorsal precavernous internal arteries, also give rise to local tentorial and menin-geal branches. The inferior hypophyseal arteries may also supply portions of thesuperficial (peripheral) anterior pituitary lobe.
Anterior pituitary supply. Supply to the anterior gland is predominantly through thehypophyseal portal system on the surface of the pituitary stalk, which drainsfrom the median eminence. Arterial supply to the median eminence itself isderived from the superior hypophyseal arteries, which may arise from eitherthe posterior communicating arteries or from the supraclinoid internal carotidarteries directly. The superior hypophyseal arteries also supply portions of thesuperior stalk and optic chiasm.5 The anterior lobe also receives venous bloodfrom short portal vessels draining from the posterior lobe, accounting for up toone-third of the anterior pituitary supply.
Venous drainage. Venous blood drains from the anterior and posterior lobes intothe cavernous sinuses. Blood draining from these sinuses may be sampledvia simultaneous bilateral inferior petrosal sinus catheters to suggest lateralityof secretory tumors when imaging is unable to resolve tumor location.
Although the sella itself is formed as a fossa within the central sphenoid bone, sellarmargins are largely comprised of dura. Thus, the superior margin of the sella is definedby a dural plane, the diaphragma sella, with the infundibulum penetrating through thediaphragmatic hiatus to meet the gland below. The osseous anterior sellar wall, sellarfloor, and posterior sellar wall are also lined by dura, which may consist of a thin sheetof fairly uniform thickness or it may be somewhat thicker, particularly around the ante-rosuperior and posterosuperior portions of the gland. Venous intercavernous sinusesmay run within a thickened dural margin to communicate with one or both cavernoussinuses.5 A dural plane also separates the sella from the cavernous sinuses laterally.Sinusoids within the cavernous sinuses contain venous drainage from not only thepituitary but also inflow from the ophthalmic veins, middle cerebral veins, and spheno-parietal sinuses. The sinuses further drain into the superior and inferior petrosalsinuses, pterygoid plexuses, and ophthalmic and angular veins of the face. It is thedrainage into the inferior petrosal sinus that enables venous sampling via jugular cath-eters to determine the side of a hormone-secreting lesion.

Imaging of Pediatric Pituitary Abnormalities 675
Knowledge of surrounding structures is crucial for the surgical transsphenoidalendoscopic approach that has become widely used for exploration to the gland.Thus the floor and anterior wall of the sella may both abut the sphenoid sinus, offeringa potential surgical window for resection of intrasellar pituitary tumors. Patients inwhom tumors extend significantly into the suprasellar compartment may, in addition,require a subfrontal craniotomy for more complete tumor resection.
EMBRYOLOGY
The pituitary gland, and indeed the entire hypothalamic-infundibular-pituitary axis,develop through a complex interplay between the developing diencephalon and theprimitive oral stomodeum.1,5–8 The process has been studied extensively in loweranimals, and is believed to parallel the development in humans albeit at a differentrate. Development and tropism proceed through opposing gradients of growthfactors, transcription factors, and signaling proteins to encourage or discourage differ-entiation of specific cell types along what will become the infundibulum, stalk, andpituitary gland.
Development of the hypothalamic-pituitary axis is felt to proceed through 4 stages1
1. Pituitary placode. At approximately the fifth week of gestation, the anterior ridge ofthe neural plate displaces ventrally to form the roof of the developing oral cavity.The roof of the oral cavity thickens to compose the pituitary placode, which marksthe onset of pituitary organogenesis.
2. Rudimentary Rathke pouch. As the oral cavity roof invaginates, it forms the rudi-mentary Rathke pouch. Because of a lack of overlying mesenchyme, when theroof invaginates it soon comes into contact with the evaginated diencephalonthat will ultimately develop into the posterior pituitary. The contacting portion ofthe pouch develops into the pars intermedia.
3. Definitive Rathke pouch. Rathke pouch further deepens and folds on itself until itcloses and the communication of the Rathke pouch cavity with the primitive oralcavity is lost. During this phase, the continued evagination of diencephalon resultsin development of the infundibulum.
4. Adult Gland. There is no further communication of the pouch with the oral cavity,and the specific cell types have developed in a specific spatial and temporalsequence.
Inherent in the development of the pituitary and associated structures is a well-orchestrated signaling system that allows cell differentiation and migration in specificorders. Thus, early in development the ventral diencephalon secretes several factors,including bone morphogenetic proteins (BMPs), Wnt5a, and fibroblastic growth factor(FGF) 10. Likewise, the oral ectoderm expresses Sonic Hedgehog (Shh) and Lhx3,ultimately thickening to form the pituitary placode. Gradations in signaling hormonessuch as BMP2 and FGFs provide for differentiation of specific pituitary cell types intheir characteristic spatial and temporal arrangement. For example, there is a greatertendency for gonadotropes, thyrotropes, lactotropes, and somatotropes to developventrally (in this order, with gonadotropes most ventral), and melanotropes and corti-cotropes to develop dorsally.9 Several factors are necessary to develop the posteriorlobe, including Pit-1, Oct-1 and Oct-2, and Pit-Oct-Unc domain factors of the Brnfamily. Defects in specific genes may cause precise malformations. For example,a mutated or absent Brn-2 does not affect initial hypothalamic development, but itis associated with failed differentiation of the hypothalamic supraoptic and paraven-tricular nuclei; without these nuclei, the axons normally leading from them do not

Delman676
form and therefore the posterior gland will not form normally either. The reader isreferred to several excellent reviews of the genetics of pituitary development andgenetic basis of anomalies.1,6,10–12
IMAGING TECHNIQUE
Preliminary evaluation of the sella is almost always performed using magnetic reso-nance imaging (MRI). Although an MRI examination takes considerably longer thancomputed tomography (CT) (at least 20 minutes for MRI and perhaps up to 35–40minutes depending on the sequences obtained, compared with 5 minutes for CT),MRI offers markedly better parenchymal definition than CT, uses no ionizing radiation,and may be acquired in any orthogonal or oblique plane. MRI is not prone to the beam-hardening artifact from the surrounding sphenoid bone that is present on CT, but otherartifacts can influence image quality, particularly metallic artifacts in dental braces orprostheses.
Sequences obtained for MRI vary significantly by institution, and choice ofsequences depend on the specific scanner hardware available, field strength, andradiologist preference. In general, scans are obtained to survey the gland andsurrounding tissue adequately, with coverage in at least 2 planes. Thus examinationsmight include sagittal and coronal T1-weighted and T2-weighted sequences, and ga-dolinium-enhanced sagittal and coronal T1-weighted sequences. Because sellarstructures are so fine it is imperative to obtain thin-section images to limit the effectsof partial volume averaging, a condition in which 2 adjacent structures cannot beclearly resolved because they lie within the same slice. Traditional imaging at 1.5 T em-ployed 2 or 3 mm scan thickness with little or no gap (10% or less) between sections.With advances in scanner technology, and with the growing popularity and prevalenceof 3 T scanners, many centers now obtain 1- or 1.5-mm sections or even volumetricscans to assess the sella. However, because increasing magnetic fields are associ-ated with greater susceptibility artifacts, further advances in field strength may notoffer similar gains in imaging resolution. Artifacts are of particular concern when scan-ning the sella, particularly in the peripubertal population in whom dental braces arecommon; technologists may be able to modify scanning parameters to minimize theeffect of such metallic artifacts.
In addition to high-resolution sellar imaging, many institutions also obtain one ormore survey sequences of the entire brain. As certain pituitary abnormalities can beassociated with other midline defects, these larger field images should be scrutinizedfor congenital or developmental anomalies.
Some pituitary abnormalities, most notably microadenomas, are best or most reli-ably seen using T1-weighted sequences obtained with gadolinium chelate administra-tion. Gadolinium is a lanthanide element that has 7 unpaired electrons, giving itparamagnetic properties.13 This atom shortens the so-called T1 and T2 relaxationtimes of water. As a result, gadolinium that either remains in the blood pool or extra-vasates from the blood pool through a damaged blood-brain barrier causes the con-taining structure to appear bright, or hyperintense. This property distinguishesenhancing tissues from nonenhancing tissues.
It has long been known that free gadolinium is highly toxic to humans. However, whengadolinium is chelated to specific ligands it has a favorable safety profile. Ligands inclinical use include agents such as diethylene triamine pentaacetic acid (DTPA), whichbind strongly to the gadolinium ion thereby minimizing release of free gadolinium intoserum. Until about 2006, the approved gadolinium chelates were believed to haveminimal potential side effects apart from the occasional allergic reaction. However, it

Imaging of Pediatric Pituitary Abnormalities 677
has become clear that patients in dialysis-dependent kidney failure are at significant riskfor a recently described and remarkably debilitating scleroderma-like disorder knownas nephrogenic systemic fibrosis (NSF, formerly known as nephrogenic fibrosing derm-opathy).14 Although there is evidence that patients with a glomerular filtration rate <30mL/min/1.73 m2 are at greatest risk for NSF, particularly patients dependent on dialysis,many centers exercise caution in patients with even moderate renal failure (GFR 5 30–59 mL/min/1.73 m2). Depending on the degree of renal function remaining, thesepatients may be offered a half-dose preparation of a newer cyclic agent with greaterT1-relaxivity, conferring improved contrast enhancement even at a lower dose. Alterna-tively, the contrast may be withheld entirely with recognition of the limitation on the diag-nostic yield of the study.
APPEARANCE OF THE NORMAL SELLA
The pituitary stalk extends inferiorly as a direct continuation of the hypothalamic infun-dibulum, projecting into the gland through a hiatus in the diaphragma sella. The stalk isbroadest superiorly and tapers inferiorly to its insertion in the gland (Figs. 1 and 2).Although the upper limits of each segment of stalk have been defined in adults(3.5 mm at the median eminence, 2.9 mm at the midpoint and 1.9 mm at its insertion15)corresponding standards are scarce in children and assessment of pediatric stalk sizetends to be based on experience rather than reference to age-appropriate measure-ment ranges. In children, as in adults, the stalk should taper from infundibulum toinsertion on the gland, and caliber significantly less than 1 mm at any point shouldbe regarded with suspicion.
In general the stalk is best seen on postgadolinium T1-weighted imaging because ofthe strong enhancement of the stalk. The stalk is moderately well seen on T2-weightedimaging because cerebrospinal fluid (CSF) acts as a natural source of contrast againstthe lower signal stalk. It is seen poorest on T1-weighted imaging because CSF andstalk are relatively close in inherent signal.
Fig. 1. A coronal section through the mid-sella. Note the tapering stalk that penetratesthrough the hiatus of diaphragma sella (not labeled) to insert on the central pituitary gland.The third (III), fourth (IV), ophthalmic trigeminal (V1) and maxillary trigeminal (V2) nerves sitin the lateral dural wall of the cavernous sinus; the sixth cranial nerve (VI) is the only nerveactually within the sinus, usually near the inferolateral margin of the internal carotid artery(ICA). The ICA continues anterior to the depicted plane before projecting intracranially,superiorly, and posteriorly back into plane, where it bifurcates into the middle cerebralartery (MCA) and anterior cerebral artery (ACA).

Fig. 2. Normal MR imaging through the sella. (A) Coronal T2-weighted image showing thestalk inserting on the central gland. Portions of the cavernous internal carotid artery (Cav IntCar Art) are shown, with the abducens nerve (VI) near the inferolateral vessel margin. Theoptic chiasm, supraclinoid internal carotid artery, and anterior cerebral arteries are alsolabeled. (B) Sagittal noncontrast T1-weighted midline image through the sella. The hypo-thalamus (Hypoth) and infundibulum (Infun) continue into the stalk, which inserts just ante-rior to the junction of the ‘‘bright spot’’ laden neurohypophysis (NH) and adenohypophysis(AH). The chiasm sits directly superior to the pituitary. The CSF-filled third ventricle (3V) isseen as a low signal fluid-filled structure. Portions of the brain stem including midbrain(MB) and pons are also labeled. (C) Sagittal postcontrast T1-weighted image. Distinctionbetween AH and NH is lost, because the anterior gland is now enhanced. The infundibulumand stalk also enhance well. Portions of the sphenoid bone (Sph) and clivus (Cl) are alsolabeled. (D) Coronal postcontrast T1-weighted image shows many of the structures in (A).Note how well and homogeneously the gland enhances. In addition, with the benefit ofcontrast cranial nerves can be seen as nonenhancing foci in the lateral cavernous sinuswall: third (III), fourth (IV), ophthalmic trigeminal (V1), and maxillary trigeminal (V2).
Delman678
CSF surrounding the stalk follows the properties of simple fluid, specifically lowsignal on T1-weighted imaging and high signal on T2-weighted imaging. SometimesCSF pulsation artifacts reduce T2 signal in areas of greatest fluid motion, that is, dis-placed from other turbulence-causing structures such as the stalk and supraclinoid

Imaging of Pediatric Pituitary Abnormalities 679
internal carotid arteries. Ordinarily the diaphragma sella is not well seen on routinesequences, however heavily T2-weighted sequences obtained at higher resolution(such as fast imaging employing steady-state acquisition [FIESTA] or constructiveinterference in steady state [CISS] imaging) may clarify the diaphragma in somepatients by intensifying signal in the adjacent CSF.
Although the stalk must communicate with both the posterior and anterior lobes ofthe pituitary, it is frequently seen entering the gland near the midline above the poste-rior aspect of the anterior lobe, rather than at the junction of the anterior and posteriorlobes. This apparently discordant configuration is likely related to the frequent anteriorprotrusion of the posterior lobe tissue in the midline that meets the stalk at its insertion.This lobule of posterior lobe, which is almost too thin to resolve by MRI but is clearlyseen on gross specimens, is partially surrounded by the pars tuberalis of the anteriorlobe.5
The gland is traditionally felt to be bilaterally symmetric, but within the normal pop-ulation there exists considerable asymmetry even within normally functioning glands.Thus the pituitary stalk may normally insert slightly off midline, the configuration of theposterior pituitary bright spot may lie off-center, and even the gross contour of thegland may vary from side to side. In addition, the sella turcica itself may not besymmetric, either on a developmental basis or related to acquired factors such astortuosity of the cavernous internal carotid artery.
Almost directly superior to the stalk’s insertion on the gland sits the optic chiasm. Oncoronal images this may appear ovoid or slightly indented, such as the cross section ofan erythrocyte. Signal tends to be isointense to white matter on T1-weighted imagingand T2-weighted imaging. It is ordinarily symmetric, and does not exhibit significantenhancement following gadolinium administration.
Lateral to the sella are the cavernous sinuses. Although they collect blood fromdiscrete veins, instead of hollow central cavities the cavernous sinuses contain count-less sinusoids, which together return venous blood to the petrosal sinuses. The sinu-soids are isointense on T1-weighted imaging, slightly hyperintense on T2-weightedimaging, and enhance significantly with gadolinium because of the relatively largeconcentration of blood that fills them. The most conspicuous structure within eachcavernous sinus is the cavernous segment of the internal carotid artery. The rapidflow of blood in these arteries leaves little magnetic signal, and thus normally flowingarterial blood appears dark. The cavernous carotid arteries loop anteriorly beforecontinuing intracranially, ultimately bifurcating into the middle and anterior cerebralarteries.
Poorly seen about the sinuses, but of great clinical and surgical importance, are thethird to sixth cranial nerves. Of these, only the abducens nerve (CN VI) actually sitswithin the sinusoids, usually near the inferolateral margin of the cavernous internalcarotid artery. The remaining cranial nerves in this region, the oculomotor nerve (CNIII), trochlear nerve (CN IV), ophthalmic trigeminal nerve (CN V1), and maxillary trigem-inal nerve (CN V2), actually reside in the lateral cavernous sinus wall. Although theentire trigeminal nerve complex leaves the pons and enters Meckel cave together,the fibers of the mandibular portion (CN V3) are the most inferiorly placed among allthe trigeminal fibers, and are best seen on sella scans as they exit the foramen ovale.
GLAND SIZE AND SIGNAL
Several large series of pediatric subjects have showed considerable variability in thesize, shape, and signal of normal pediatric pituitary glands. Even among endocrinolog-ically normal subjects of identical age and gender, gland measurements may vary

Delman680
significantly. Therefore the size of the gland must be considered within the clinicalscenario, and assessment of gland function may be normal across a wide range ofpituitary sizes and shapes.
The normal gland is hyperintense on T1-weighted imaging at birth, so that the ante-rior and posterior lobes are almost indistinguishable. The gland is also physiologicallyenlarged, with a corresponding concave superior margin. The high gland signal andprominent size are usually attributed to the lingering effects of maternal hormones.In the next 8 to 10 weeks the gland assumes the infant configuration: (1) the volumedeclines to a normal infant size; and (2) T1 signal in the anterior lobe drops to near iso-intensity with the posterior pons, the structure that is ordinarily used as an internalreference on pituitary studies (Fig. 3).
Signal in the posterior gland remains high on T1-weighted imaging in most patients.The source of this neurohypophyseal bright spot has been the subject of spiriteddebate. It is well known that fatty substances appear bright on T1-weighted imaging,so the lipid-rich secretory vesicle bilayer wall had historically been believed to accountfor the high T1 signal. However, it is also well known that concentrated protein solu-tions may also give a high T1 signal, and many investigators now believe that the neu-rophysin-vasopressin complex itself accounts for much of the high signal in the
Fig. 3. Normal postnatal progression of the pituitary gland. All sagittal T1 noncontrastmidline images. (A) At birth and through the early days of life the anterior lobe is hyperin-tense, and the gland is prominent with a convex superior margin. (B) After approximately 2weeks the gland has begun to shrink and the anterior lobe is not quite as bright. (C) Byapproximately 2 months the gland assumes its normal infant state, with lower signal inthe anterior gland and slight concavity of the superior gland margin.

Imaging of Pediatric Pituitary Abnormalities 681
posterior gland.16 The relevance lies not in the source of the signal but its very pres-ence. High signal in the posterior gland suggests a functioning hypothalamic-infundib-ular-pituitary axis, whereas the ectopic location of this signal (ie, hypothalamus,infundibulum, or stalk) suggests disruption of the normal axonal pathway leadinginto the posterior gland. This signal is characteristically absent in patients with centraldiabetes insipidus.16
The normal pituitary gland enhances symmetrically following administration of intra-venous gadolinium. Intravenous gadolinium is used to characterize blood flow andtissue types within the sella. Dynamic contrast-enhanced sella scans, which requirespecial preparation and are thus not included in the routine scanning protocol ofmost centers, have revealed the timing and pattern with which the hypothalamic-pitu-itary axis enhances. In general, the gland enhancement may take well over a minute,and with modern scanners many sets of images may be obtained in that time tochronicle temporal progression. The normal hypothalamus does not enhance wellbut the infundibulum does, reflecting the concentration of gadolinium in the bloodfilling the portal plexus that supplies the anterior gland. Enhancement then spreadsdown the pituitary stalk, with contrast especially intense at the diamond-shaped pitu-itary tuft at the stalk insertion. From the tuft, the contrast spreads centrifugally, firstfilling the central adenohypophysis and then incrementally enhancing to the outermargin. Anterior gland enhancement is considerably more robust than posterior glandenhancement, but because the posterior gland is intense even at baseline it alsoappears bright after contrast. Indeed, reference to unenhanced T1-weighted imagesis necessary for interpretation of postcontrast scans, because one must be sure thathigh signal on those scans actually reflects enhancement and not baseline signal.Many gland lesions enhance less than the anterior gland, but some sellar lesions(such as a diaphragma sella meningioma) may enhance quite prominently.
The simplest and earliest method used for measuring gland size was measurementof the maximum height in the midline. Gland height may indeed be the single mostuseful measurement in gland size determination, and it is still used for quick approx-imation of gland size. However, there is significant variability in the shapes of normalglands, and a gland that appears shallow may have a large width (transverse measure-ment) and/or depth (anterior-posterior measurement) resulting in normal volume over-all. A more advanced technique uses the product of the maximal 3 orthogonaldimensions and a correction factor (0.524, or p/6), which is derived from the formulafor the volume of a sphere (4pr3/3); because glands are usually aspherical this formulais inaccurate in most situations. The most accurate formula based on current imagingtechnology adds the volume of the gland on each slice, either from a single plane(usually sagittal) or by averaging results from 2 or 3 planes. Indeed, investigatorshave found high correlation between measurements obtained in different planes, con-firming the accuracy of both measurements.17 From these studies, representativenormal pituitary growth curves can be generated (Fig. 4). However, ranges of normaldo vary among investigators, emphasizing the difficulty of relying on so-called normalranges obtained using differing scanning techniques.
Glands of preterm infants are taller than those of normal term infants, even whencorrecting for gestational age. Preterm glands are so tall that preterm infants witha corrected postnatal age of up to 6 months have larger glands than even 2-year-old normal term children. The large gland size may relate to reduced insulin-likegrowth factor 1 and increased growth hormone in premature infants.18
In normal term children the pituitary height is fairly stable for the first 2 years of life, withsome investigators measuring a modest decline in this period and others showingmodest growth.19,20 Much of the gland growth in the first 2 years is derived from
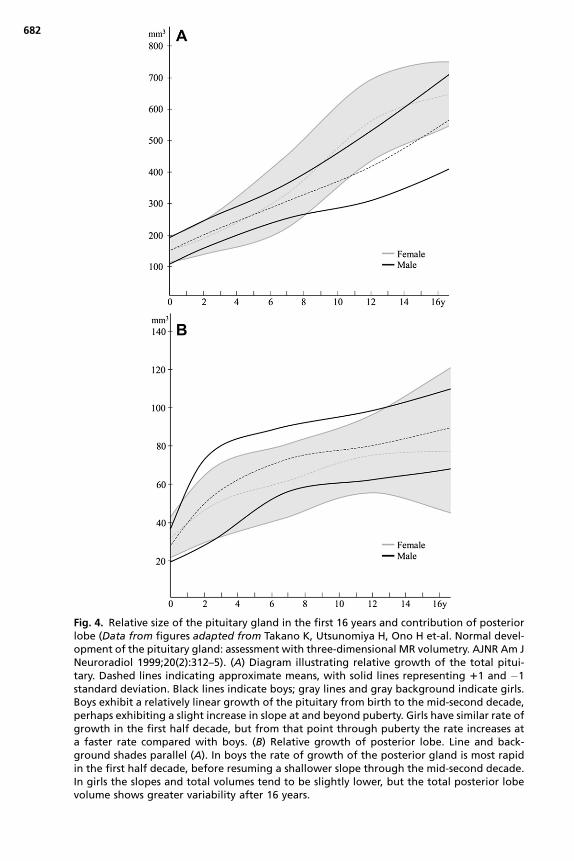
Fig. 4. Relative size of the pituitary gland in the first 16 years and contribution of posteriorlobe (Data from figures adapted from Takano K, Utsunomiya H, Ono H et-al. Normal devel-opment of the pituitary gland: assessment with three-dimensional MR volumetry. AJNR Am JNeuroradiol 1999;20(2):312–5). (A) Diagram illustrating relative growth of the total pitui-tary. Dashed lines indicating approximate means, with solid lines representing 11 and �1standard deviation. Black lines indicate boys; gray lines and gray background indicate girls.Boys exhibit a relatively linear growth of the pituitary from birth to the mid-second decade,perhaps exhibiting a slight increase in slope at and beyond puberty. Girls have similar rate ofgrowth in the first half decade, but from that point through puberty the rate increases ata faster rate compared with boys. (B) Relative growth of posterior lobe. Line and back-ground shades parallel (A). In boys the rate of growth of the posterior gland is most rapidin the first half decade, before resuming a shallower slope through the mid-second decade.In girls the slopes and total volumes tend to be slightly lower, but the total posterior lobevolume shows greater variability after 16 years.
682

Imaging of Pediatric Pituitary Abnormalities 683
increases in gland width and depth, and the rate of gland growth is similar in boys andgirls.
Gender-associated differences in rate of gland growth tend to manifest themselvesafter 5 years of age, with boys and girls experiencing similar linear growth of theirglands up to that point.17 Boys continue the relatively linear rate of growth intopuberty, with slight increase in growth rate beyond this into the late second decade.After the first half decade, overall growth rate in girls is greater than that in boys, untilabout puberty when the growth slope declines to a rate similar to that seen in the firsthalf decade. A significant portion of gland growth in the first half decade in boys isrelated to enlargement of the posterior gland, with more balanced gland growthbeyond this. Posterior gland growth is less prominent in girls in the first half decade,and anterior lobe growth becomes even more dominant into puberty. By adulthood,female glands are slightly larger than male glands and remain so into old age.
The characteristic neurohypophyseal bright spot on T1-weighted imaging may beabsent even in normal patients, but such a pattern is more common in adult popula-tions than in children. When pathologic, absence of this posterior pituitary hyperinten-sity reflects either a central secretory deficit, disruption of the integrity of axonsprojecting from hypothalamus to neurohypophysis, or hypoplasia of the gland(Figs. 5–7). Fujisawa16 has defined 4 typical scenarios in which posterior gland inten-sity is abnormally low:
1. A subset of the normal population does not accumulate significant neurophysin-vasopressin (NP-VP) complex, but these patients are asymptomatic and clinicallynormal. These patients likely secrete VP soon after it is formed, and therefore donot accumulate enough to confer high signal to the posterior gland.
2. Mass effect within the sella from tumor or even granulomatous disease may, byvirtue of its bulk, functionally prevent normal axonal transport of vesicles, resultingin their accumulation just superior to the mass. This is referred to as the ‘‘dammingphenomenon.’’
3. When the stalk is transected, either on a congenital basis or from prior trauma,a high signal focus of variable size may be identified along the stalk trajectory
Fig. 5. Ectopic posterior pituitary gland. (A) Sagittal T1-weighted noncontrast imageshowing a focal hyperintensity along the inferior hypothalamic margin (arrow). No stalkis seen and the pituitary gland is hypoplastic (arrowhead). (B) Coronal T1-weighted noncon-trast image revealing the focal hyperintensity representing nontransported neurophysin-vasopressin vesicles stalled at the inferior hypothalamic margin.

Fig. 6. Markedly hypoplastic pituitary with absent bright spot. (A) Sagittal noncontrast T1-weighted and (B) contrast-enhanced T1-weighted imaging shows almost complete absenceof the gland with an associated shallow sella (arrowheads). The upper infundibulum ispresent but the characteristic high T1-weighted signal is not seen on noncontrast imaging.After contrast administration (B) the location of the infundibulum and the faint band ofsellar pituitary (arrowheads) are defined. The chiasm appears thin but is present (hatchedarrow).
Delman684
but ectopically (ie, above the level of the normal neurohypophysis). Thus, eventhough vesicles containing NP-VP may form normally in the hypothalamus, theywill not be completely transported into the gland.
4. Patients with central diabetes insipidus may not show any hyperintensity fromhypothalamus to pituitary, reflecting an inability to manufacture or package anyappreciable NP-VP.
Fig. 7. Anterior pituitary aplasia and posterior pituitary ectopia. (A) Coronal T2-weightedimage reveals a thin stalk terminating in the bulbous, incompletely formed posterior pitu-itary tissue (arrowhead). (B) Sagittal T1-weighted noncontrast image showing hypothalamichypoplasia, a thin infundibulum, and the bulbous neurohypophysis (arrowhead) dippinginto a shallow, malformed sella. No anterior pituitary was identified.
Imaging of Pediatric Pituitary Abnormalities 685
In the past, anecdotal evidence had suggested that a breech delivery was associ-ated with an ectopic neurohypophysis. Breech delivery was believed to predisposeto extreme shearing influences on the stalk, possibly in part related to a consequenceof the sharp edge of the diaphragm sella against the stalk. Research has shown thatbirth trauma may explain only perhaps a third of the cases of pituitary dwarfism, indi-cating that abnormal mediobasal brain induction may underlie both a pituitary axisabnormality and breech positioning.21 However, postnatal trauma has more clearlybeen associated with pituitary dysfunction, with clinically detected endocrine dysfunc-tion in 10% of pediatric patients subject to mild to severe traumatic brain injury. Defi-ciency of growth hormone is the most prevalent feature.22 Additional consequencesfrom head trauma include precocious puberty relating to the inability of damaged ex-trahypothalamic loci to inhibit gonadotropin secretion.
PITUITARY ADENOMAS
Adenomas arise almost exclusively in the anterior lobe. These tumors seem to behavedifferently in children than in adults.23 In adults, tumors that are functional tend topresent when small (microadenomas, measuring <10 mm); tumors that are larger(macroadenomas) tend to present because of consequences of mass effect (suchas the classic bitemporal hemianopsia seen with chiasmatic compression). In childrenmany of the secreting tumors are quite large at diagnosis. In one pediatric series, atleast 70% of tumors had suprasellar extension at diagnosis, and almost 10% werefurther characterized as giant tumors measuring more than 4 cm.23
Pituitary adenomas are rare in childhood, accounting for less than 3% of all supra-tentorial tumors. Approximately 4% of pituitary adenomas are found in children.23
However, adenomas are more likely to be functioning in children than in adults.7
Indeed, some investigators report that up to 95% of pediatric adenomas arehormone-secreting, compared with perhaps one-third in the adult population.23
Multiple series have shown that prolactinomas are the most common adenoma inthe pediatric age group overall, accounting for 48%–52% of tumors. However, prolac-tinomas are not uniformly prominent throughout the pediatric age range, because therelative proportion of prolactinomas increases steadily through the first decade. Infact, ACTH-releasing tumors with Cushing disease and Nelson syndrome are muchmore common in the first decade than prolactinomas (71% vs 16%).24 There is subse-quent decrease in ACTH-secreting tumors after the age of 11 years, with these tumorsrepresenting 18% to 29% of adenomas for the rest of the second decade. Growthhormone-secreting tumors represent about 8% of lesions, with the proportion slightlyhigher into later pediatric years.
Detection and conspicuity of microadenomas on imaging depends on lesion size,scan technique, and scan timing. Lesions larger than 3 to 4 mm are usually wellseen, regardless of technique employed; resolution of smaller lesions may rely ona higher signal technique to generate thinner sections, higher in-plane resolution,and less imaging noise overall. Typical adenoma signal on routine imaging can varyeven within adenoma subtypes, but in general adenomas are isointense or slightly hy-pointense relative to gray matter on T1-weighted imaging, and isointense to slightlyhyperintense on T2-weighted imaging. Hemorrhage may confer susceptibility withinthe lesion, often seen as diminished T2 signal (and possibly increased T1 signal).Lesions larger than 3 to 4 mm are usually easily seen as areas of diminished signalon postgadolinium imaging, with sensitivity diminishing in smaller lesions (Fig. 8).Contrast-enhanced images must be compared with nonenhanced images to confirmparenchymal enhancement, lest an area of high signal be interpreted as enhancement

Fig. 8. Pituitary adenoma with incidental residual craniopharyngeal canal. (A) Coronal T1-weighted contrast-enhanced image reveals an area of diminished enhancement in theleft side of the gland (asterisk), compatible with a microadenoma. There is only slight right-ward deviation of the stalk in this instance. (B) Coronal T2-weighted image fails to show theadenoma, but does show the residual craniopharyngeal canal (arrows).
Delman686
when in fact it was hyperintense on noncontrast imaging to start with (Fig. 9). Cysticchange may appear hyperintense on T2-weighted imaging, although hemorrhageinto a cyst may also be associated with a contradicting reduction in signal.
Because signal in adenomas tends to appear similar to adjacent parenchyma,contrast-enhanced sequences are ordinarily obtained to improve adenoma detection.Although adenomas enhance, they typically do so less strongly than normal pituitaryparenchyma, and their peak enhancement lags behind that of the normal gland.
Fig. 9. Pseudo-mass in the pituitary. (A) Congenitally asymmetric appearance of the brightposterior pituitary (PP) on coronal noncontrast T1-weighted imaging, with perhaps 80% ofthe posterior lobe sitting to the right of midline. The lower signal in the left side of thegland represents asymmetric positioning of the anterior lobe (arrowheads). The stalk(hatched arrow) still inserts near the midline. (B) After contrast is given the anterior lobeon the left side enhances, but does not become as bright as the posterior lobe on the right,causing a pseudo-mass (j).

Imaging of Pediatric Pituitary Abnormalities 687
Ordinarily scanning is begun immediately after contrast administration to capture themaximal difference between gland and adenoma. For each minute that scanning is de-layed, one would expect to detect approximately 10% to 15% fewer lesions, so that ifscanning is delayed for 7 to 10 minutes after gadolinium injection almost all adenomaswould be nearly unresolvable. For this reason the dynamic contrast technique,described earlier, may increase sensitivity further in cases in which a lesion is stronglysuspected but not detected on preliminary scanning. In instances where scanning isdelayed after contrast administration (eg, mild contrast reaction, nausea, claustro-phobia), the examination may still be salvaged by exploiting the differential washoutof contrast from the gland (Fig. 10). Because contrast clears faster from normal paren-chyma than it does from adenomas, on delayed scans adenomas will appear hyper-intense relative to the remaining gland, instead of hypointense as they do in theearly postinjection period.25 The crossover point at which enhancement of adenomasbegins to surpass normal parenchyma remains poorly defined, but in many cases itmay be less than 6 to 8 minutes after contrast injection.
CYSTIC LESIONS
Rathke cleft cysts (RCCs) are common incidental pituitary cysts that are found in up to20% of routine autopsies.26 These cysts arise from the nonobliterated intrasellarlumen of Rathke pouch,27 and most are so small that they are asymptomatic. Whencysts are large (on average 16.3 � 1.2 mm) they become symptomatic, largelybecause of their mass effect.28 Such cysts may exert enough mass effect to
Fig. 10. Gadolinium enhancement patterns. The y-axis indicates signal differential betweenenhanced and baseline images; the x-axis reflects time. The blood pool enhances earliestand strongest, but it also tapers most rapidly with renal clearance of gadolinium. Thenormal pituitary gland has a shallower increase, somewhat delayed after the blood poolcurve, and shows a gradual decrease. Most adenomas have even slower increase anddecrease. The greatest difference between parenchyma and adenomas (and thereforegreatest conspicuity of adenomas) is in the early gland enhancement period (time pointA), when the gland enhances well but the adenoma has only begun to accumulate contrast.If, for some reason, the gland cannot be imaged at that point, the patient may be re-scanned, because the adenoma may retain contrast longer and an adenoma will appearas an area of signal that is higher than the gland (time point B).

Delman688
compromise remaining pituitary tissue, or they may grow superiorly to compress theoptic chiasm, resulting in a bitemporal hemianopsia. Larger cysts may also be asso-ciated with headaches. On MRI, noncomplicated cysts follow fluid intensity, so theyare hypointense on T1-weighted imaging and hyperintense on T2-weighted imaging.RCCs may, over time, develop a higher protein concentration, resulting in an increasein T1 signal and, as protein concentration increases, a reduction in T2 signal (Fig. 11).Sludge or intracystic nodules have also been described as areas of layering or nodularsignal in the posterior aspect of the gland.29 RCCs do not enhance centrally and mostdo not enhance about their periphery unless they have suffered recent hemorrhage orinfection; enhancement about a cyst should suggest another diagnosis such ashemorrhagic adenoma or craniopharyngioma.
Fig. 11. Rathke cleft cyst. (A) Coronal T1-weighted noncontrast image shows a roundedfocus of high signal (asterisk) situated eccentrically toward the left side of the gland. Thereis associated bowing of the superior gland margin, presumably related to mass effect fromthe cyst. (B) Axial T2-weighted image, revealing a rounded cavity within the central sella, inwhich a debris level is present (between arrows). Such levels are among the most reliableimaging features confirming a cyst. (C) Sagittal T1-weighted noncontrast image revealsthe relationship of the cyst (asterisk) with the posterior lobe (arrow). A thin band of tissue(not labeled) sits between the posterior lobe and the cyst, which presumably reflects theposterior wall of Rathke cleft and makes this cyst more likely to represent a Rathke cleftcyst than a pars intermedia cyst. (D) Coronal T1-weighted dynamic sella scan proves thelesion is cystic. The y-axis indicates signal and the x-axis reflects time. Normal pituitary tissueenhances well (curve 2), whereas a cyst will not enhance (curve 1).
Imaging of Pediatric Pituitary Abnormalities 689
Pars intermedia cysts form within the pituitary along the posterior margin of Rathkepouch. These are ordinarily asymptomatic lesions measuring less than 3 mm. Config-uration varies, but a flattened cystic cavity broadest in the coronal plane, sitting at thejunction of anterior and posterior lobes, suggests this diagnosis (Fig. 12). In manyinstances pars intermedia cysts may be difficult to distinguish from RCCs, whichare more common, so many pars intermedia cysts are considered RCCs on imaging.
Craniopharyngiomas (CPs) are benign tumors that, like RCCs, are also derived fromembryologic remnants of Rathke pouch. Of the two varieties, the cystic (or adamanti-nomatous) tumors (ACPs) are more frequent in the pediatric population. These tumorsrepresent about 10% of all childhood brain tumors and account for approximately90% of pituitary neoplasms in children.30,31 The squamous-papillary variety, whichis most common in the sixth and seventh decades, has more solid configuration.ACPs typically contain one or more large cysts of varying wall thickness, with centralproteinaceous fluid typically of ‘‘crank-case oil’’-like consistency. Because of theproteinaceous nature of the cavities, these lesions may be quite hyperintense onT1-weighted imaging and only mildly elevated on T2-weighted imaging. Enhancementis seen about the rim but not centrally (Fig. 13). This peripheral enhancement may bethin or nodular, but with the high T1 signal within the cyst at baseline, any contrastenhancement may be difficult to resolve. ACPs arise within the suprasellar cisternbut may grow inferior into the sella; purely intrasellar ACPs are rare. These tumorstend to be large when detected, because they present because of mass effect or localeffect of tumor on cranial nerves, and are larger at diagnosis than even symptomaticRCCs (36.2� 4.7 mm vs 16.3� 1.2 mm).28 If distinction of RCC from ACP proves chal-lenging by MRI, a CT scan that demonstrates calcification around the lesion marginmarkedly increases the probability of craniopharyngioma. Although these tumors
Fig. 12. Presumed pars intermedia cyst. Sagittal contrast-enhanced T1-weighted imagereveals a thin band of nonenhancement (arrowhead) corresponding to the posterior aspectof the anterior lobe. A cyst in this location with thin anterior-posterior diameter relative toheight and width is suggestive of a pars intermedia cyst rather than a Rathke cleft cyst. Notethe artifact from the patient’s dental braces (arrows); technologists may be able to modifyscanning parameters to eliminate or at least shift the artifacts if they project through struc-tures of interest.

Fig. 13. Adamantinomatous (cystic) craniopharyngioma. (A) Coronal T2-weighted imagereveals a large cyst filling the sella and suprasellar cistern (asterisks). Coronal (B) and sagittal(C) postcontrast T1-weighted imaging reveals the high signal within the cyst (asterisks) char-acteristic of craniopharyngiomas. Enhancement is subtle but can be seen around the supe-rior margin of the cyst (arrowheads). In all images the sella is expanded, and mass effectdisplaces the chiasm superiorly (hatched arrows).
Delman690
are histologically benign, their insinuation into leptomeninges, cranial nerves, andvessels makes surgical eradication difficult if not impossible.
The term ‘‘empty sella’’ is largely a misnomer, as the sella is rarely truly empty.Underlying this phenomenon is atypical transmission of CSF pulsation through thehiatus of the diaphragm sella. This pulsatility may, over time, flatten the pituitary alongthe floor of the sella. In adults this may be related to an abnormally wide diaphragmatichiatus, but in children it most commonly results from prior surgery, chemotherapy, orposttraumatic affects. On imaging, the sella appears largely fluid in signal, with hypo-intense pattern on T1-weighted imaging and hyperintensity on T2-weighted imaging.The gland is typically flattened along the sellar floor and may be most conspicuousafter gadolinium administration. In most cases the stalk can be followed to its insertionon the flattened gland along the sellar floor. Little can be inferred from the resultinggland configuration, because gland function may appear clinically normal in manydegrees of gland flattening.

Imaging of Pediatric Pituitary Abnormalities 691
Arachnoid cysts are fluid accumulations within the leaves of arachnoid. These areusually congenital, but they may arise after trauma, infection, or hemorrhage.32 In chil-dren, symptomatic arachnoid cysts cause CSF flow disturbances in 95% of patients,and endocrine abnormalities in 5%. Although these are slow-growing cysts, over timethey can cause significant mass effect and even bony remodeling. As such, pediatricpatients with suprasellar arachnoid cysts may exhibit deficiencies of growth hormoneand thyrotropin, excess stimulation of the hypothalamic-pituitary axis, and possiblyhyperinsulinism-related tall stature or overweight status.32,33
SUPRASELLAR TUMORS
Gliomas may arise anywhere along the optic pathway (including optic nerve, chiasm,or tract), or within the adjacent hypothalamus. Hypothalamic gliomas are of particularconcern with regard to endocrine function, because these tumors may cause symp-toms related to obesity, diabetes insipidus, or other hypothalamic-pituitary dysfunc-tion.34 Most of these gliomas are graded as juvenile pilocytic astrocytomas. Theseare particularly common in patients with neurofibromatosis type 1 (NF-1, von Reck-linghausen disease), but NF-1 patients tend to fare better with this tumor than patientswith sporadic hypothalamic gliomas. These lesions are seen on imaging as thickeningof the third ventricular floor and hypothalamus, with margins that are sometimesobscure. On MRI, these tumors tend to show an isointense or perhaps slightly hypo-intense T1 signal and slightly hyperintense T2 signal. However, unlike other low-gradegliomas, these lesions tend to enhance well. Larger tumors may grow directly into thepituitary stalk.
Tuber cinereum hamartomas are nonneoplastic heterotopias that are comprised ofan atypical proliferation of normal cellular elements. Two different clinical scenariosmay be seen: smaller pedunculated tumors (<1 cm) tend to be associated with preco-cious puberty, whereas larger sessile tumors (>1 cm) tend to be associated with ge-lastic seizures. Because these lesions are comprised of neuronal elements, theytend to resemble brain parenchyma on all modes of imaging (Fig. 14). Some mayshow a modestly increased T2 signal.35 The blood-brain barrier is intact, so they donot enhance appreciably.
Among germ cell tumors, germinomas represent just over half; other less frequentgerm cell tumors include teratomas, choriocarcinomas, and embryonal cell carci-nomas. More than 90% of germinomas are found in males. They most commonlygrow in the pineal region but up to one-third are seen in the suprasellar region, andinvolvement of both sites simultaneously (bifocal disease) is increasingly recognized.36
A suprasellar germinoma may present as a consequence of its mass effect, forexample, through compression of the optic chiasm (producing a bitemporal hemia-nopsia), or by disruption of the hypothalamic-infundibular-pituitary axis.37 Thesetumors tend to be isointense or slightly hyperintense, with strong enhancement ofsolid portions after gadolinium administration (Fig. 15). Up to half of germinomascontain areas of cystic degeneration, which do not enhance but may appear consid-erably hyperintense on T2-weighted imaging. Because of the propensity for germino-mas to spread within the subarachnoid space, if an intracranial germinoma issuspected additional imaging of the spine is often performed to exclude drop-metastases.
SYSTEMIC CONDITIONS
Sarcoidosis is a systemic disease in which the primary feature is formation of nonca-seating epithelioid granulomas.38 The lungs and hilar nodes are most frequently
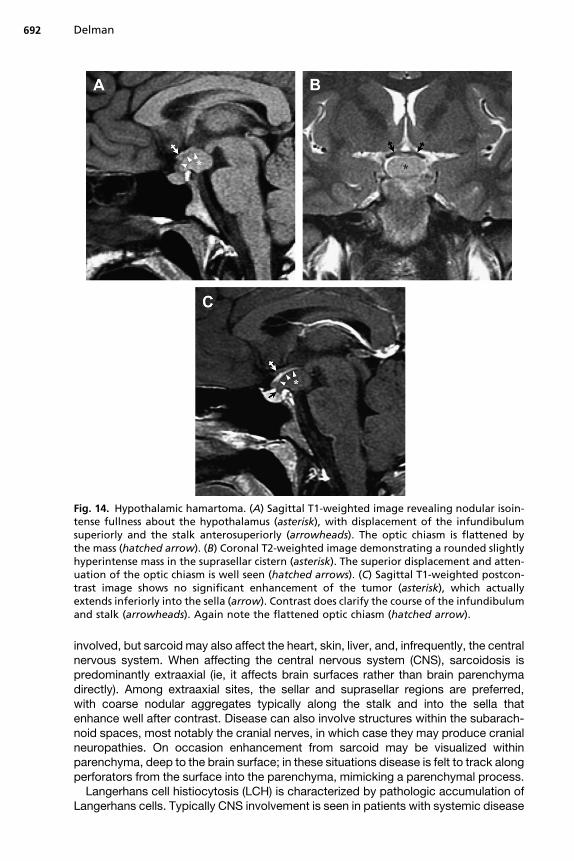
Fig. 14. Hypothalamic hamartoma. (A) Sagittal T1-weighted image revealing nodular isoin-tense fullness about the hypothalamus (asterisk), with displacement of the infundibulumsuperiorly and the stalk anterosuperiorly (arrowheads). The optic chiasm is flattened bythe mass (hatched arrow). (B) Coronal T2-weighted image demonstrating a rounded slightlyhyperintense mass in the suprasellar cistern (asterisk). The superior displacement and atten-uation of the optic chiasm is well seen (hatched arrows). (C) Sagittal T1-weighted postcon-trast image shows no significant enhancement of the tumor (asterisk), which actuallyextends inferiorly into the sella (arrow). Contrast does clarify the course of the infundibulumand stalk (arrowheads). Again note the flattened optic chiasm (hatched arrow).
Delman692
involved, but sarcoid may also affect the heart, skin, liver, and, infrequently, the centralnervous system. When affecting the central nervous system (CNS), sarcoidosis ispredominantly extraaxial (ie, it affects brain surfaces rather than brain parenchymadirectly). Among extraaxial sites, the sellar and suprasellar regions are preferred,with coarse nodular aggregates typically along the stalk and into the sella thatenhance well after contrast. Disease can also involve structures within the subarach-noid spaces, most notably the cranial nerves, in which case they may produce cranialneuropathies. On occasion enhancement from sarcoid may be visualized withinparenchyma, deep to the brain surface; in these situations disease is felt to track alongperforators from the surface into the parenchyma, mimicking a parenchymal process.
Langerhans cell histiocytosis (LCH) is characterized by pathologic accumulation ofLangerhans cells. Typically CNS involvement is seen in patients with systemic disease

Fig. 15. Suprasellar germinoma. Coronal T2-weighted (A) and T1-weighted postgadolinium(B) scans show a rounded suprasellar mass that enhances moderately well. There is markeddilatation of the lateral ventricles, related to compression of the cerebral aqueduct of Syl-vius by simultaneous pineal germinoma (not shown).
Imaging of Pediatric Pituitary Abnormalities 693
or with a skull lesion.39 It is believed that infiltration into the hypothalamic-pituitary axiscauses CNS-associated symptoms; diabetes insipidus is seen in at least 24% ofpatients with LCH, although some investigators report an even higher incidence.39,40
Anterior pituitary dysfunction is also reported but is seen less commonly; for example,growth hormone deficiency may be seen in between 10 and 20% of patients with LCH,but these patients usually also have diabetes insipidus. Inflammatory thickening,which is best seen on postcontrast T1 images, may occur anywhere along the infun-dibulum and stalk. The appearance of this infiltration may mimic other inflammatorydisorders such as sarcoid or even a lymphocytic hypophysitis.41
McCune-Albright syndrome is a rare sporadic genetic disorder characterized by theclassic triad: polyostotic fibrous dysplasia, endocrine hyperfunction, and caf�e-au-laitskin lesions. The best known hormonal association, precocious puberty, is seen morefrequently in girls. Additional endocrine manifestations include hypercortisolism,hyperthyroidism, and acromegaly. Occasionally a growth hormone–secreting microa-denoma is seen on sellar MRI examination. However, on imaging the most prominentfindings relate to fibrous dysplasia. Osseous findings relate to proliferation of fibroustissue in bone marrow by abnormal preosteoblastic cells.42 Bone lesions typicallyextend from medulla to cortex, with either a radiolucent or homogeneous ‘‘ground-glass’’ density. Long bones, ribs, and craniofacial structures are most commonlyinvolved. Radiography exposes patients to a relatively low radiation dose, but CTmay be necessary to identify subtle areas of involvement (Fig. 16). MRI is a less favor-able modality to use for assessment of fibrous dysplasia, although affected areas mayoccasionally be detected as relatively homogeneous areas of low signal.
ASSOCIATED MIDLINE LESIONS
Callosal abnormalities range from complete aplasia of the gland (callosal agenesis) tocallosal hypoplasia, in which the entire callosum forms but is thin or attenuated.43

Fig. 16. Fibrous dysplasia. (A) Coronal CT showing the ground-glass configuration that char-acterizes fibrous dysplasia through the right maxillary sinus and ethmoid region (mid andlower asterisk), with more coarse expansile bone extending along the orbital roof (upperasterisk). (B) There is a relatively homogeneous and moderately low T1 signal patternthrough the nonpneumatized right maxillary sinus, sphenoid bone, and occipital bone(asterisks).
Delman694
Callosal agenesis. Complete agenesis is characterized by (1) absent cingulatesulcus; (2) colpocephaly, in which there is a parallel arrangement of the lateralventricles that have teardrop-shaped posterior horns; (3) superior protrusionof the third ventricle, because its upper margin is not as confined as in normalpatients; and (4) abnormal longitudinal fascicles that were meant to cross themidline but instead fold back on themselves, representing disordered bundlesof Probst.44,45 Midline sagittal imaging reveals radiating bands of gyri and sulcifrom the ventricular margin, in lieu of the cingulum that is normally present.
Callosal hypogenesis. The callosum forms in a predictable pattern: genu first, fol-lowed by body and splenium, and finally the most anteroinferior rostrum.Segments that fail to form appear the latest embryologically, so hypogenesisalmost always involves rostrum, and then may involve splenium, then body,then genu. Thus, in hypogenesis the segments of callosum that do form includeG-B-S (genu-body-splenium), G-B, or G (Fig. 17). Furthermore, a callosum thatpossesses an intact rostrum but lacks another segment has likely undergonesome destruction of a portion of previously formed segment of the callosum.
Callosal hypoplasia. A hypoplastic callosum forms all of its segments, but is some-what attenuated. As the callosum experiences considerable growth, with thick-ening over time, assessment of hypoplasia in the first year may provechallenging.
Chiari hindbrain malformations are comprised of a group of 4 developmental cere-bellar anomalies. Type I, by far the most common, has been associated with multipleendocrine deficiencies.46 It is characterized by peglike protrusion of cerebellar tonsilsthrough the foramen magnum. Although numeric thresholds have been used traditionally

Fig. 17. Partial callosal agenesis. (A) Axial T2 image through the lateral cerebral ventriclesshow a parallel (rather than banana-shaped) configuration of the ventricles with colpoce-phalic tear-drip pattern posteriorly (arrows). (B) Sagittal T1-weighted image reveals a thinshortened callosum, with absence of the splenium (expected contour margin indicated byposterior dotted line) and rostrum (expected contour margin indicated by anterior dottedline). Note the radiating pattern of gyri and sulci from the callosal margin. The gland is phys-iologically hypertrophied in this 16-year-old girl.
Imaging of Pediatric Pituitary Abnormalities 695
to confirm this tonsillar ectopia (extension at least 6 mm below the foramen magnum(basion-opisthion line) in the first decade, at least 5 mm in the second and thirddecades, and so forth47) it is becoming clear that what underlies clinically relevantChiari malformations is actually the alteration in the normal CSF dynamics that resultfrom such a configuration.48 Thus investigators have used phase-contrast imaging toshow where the CSF flow abnormality exists in symptomatic patients, and may ulti-mately explain why two different patients with the same measured ectopia may exhibitvery different symptoms. Additional imaging features may include syringohydromye-lia, the abnormal dilatation of the central canal of the cord related to disorderedCSF flow patterns. Symptoms from a Chiari I malformation are nonspecific but includesuboccipital headaches (28%–63% of patients), cranial nerve palsies or brain stemsymptoms (21%), ataxia (6%–25%), and long tract signs.49
Septo-optic dysplasia (SOD, de Morsier Syndrome) comprises a spectrum of disor-ders that affect midline structures.6,50,51 Although mutations in the HESX1 gene havebeen implicated, HESX1 causation may be more common in sporadic disease than infamilial cases. The most common abnormality is optic nerve hypoplasia (seen in 75%–80% of SOD patients); this is usually bilateral (88%). Microphthalmia or anophthalmiamay be seen but is rare. Pituitary symptoms range from isolated growth hormone defi-ciency to panhypopituitarism; gonadotropin secretion may be preserved in the face ofnear complete hypopituitarism.6 Associated brain anomalies include midline forebrainabnormalities such as callosal agenesis, absence of the septum pellucidum and fornixaplasia. Additional features may include schizencephaly and cerebellar hypoplasia.Holoprosencephaly, specifically the lobar variety, may also be seen with SOD.
SUMMARY
Evaluation of the sella and surrounding structures in pediatric endocrinopathies is bestperformed with high-resolution MRI scanning. Adequate assessment relies not only on

Delman696
determining the size and shape of the gland but also on confirming normal signal char-acteristics and homogeneous parenchymal enhancement. Surrounding structures,including the hypothalamus-infundibulum-stalk and the skull base and midline struc-tures about the cerebral hemispheres, warrant careful attention to identify any associ-ated abnormalities. Tumors, whether they arise in the gland or affect gland functionthrough mass effect, are usually well resolved on today’s scanners and imagingprovides accurate characterization of these lesions.
REFERENCES
1. Mehta A, Dattani MT. Developmental disorders of the hypothalamus and pituitarygland associated with congenital hypopituitarism. Best Pract Res Clin EndocrinolMetab 2008;22(1):191–206.
2. Ray D, Melmed S. Pituitary cytokine and growth factor expression and action. En-docr Rev 1997;18(2):206–28.
3. Jinkins JR. Atlas of neuroradiologic embryology, anatomy, and variants. Baltimore(MD): Lippincott Williams & Wilkins; 2000.
4. Makulski DD, Taber KH, Chiou-Tan FY. Neuroimaging in posttraumatic hypopitu-itarism. J Comput Assist Tomogr 2008;32(2):324–8.
5. Rhoton AL Jr. The sellar region. Neurosurgery 2002;51(Suppl 4):S335–74.6. Kelberman D, Dattani MT. Hypothalamic and pituitary development: novel
insights into the aetiology. Eur J Endocrinol 2007;157(Suppl 1):S3–14.7. Diamond FB Jr. Pituitary adenomas in childhood: development and diagnosis.
Fetal Pediatr Pathol 2006;25(6):339–56.8. Scully KM, Rosenfeld MG. Pituitary development: regulatory codes in mammalian
organogenesis. Science 2002;295(5563):2231–5.9. Kioussi C, O’Connell S, St-Onge L, et al. Pax6 is essential for establishing ventral-
dorsal cell boundaries in pituitary gland development. Proc Natl Acad Sci U S A1999;96(25):14378–82.
10. Mullen RD, Colvin SC, Hunter CS, et al. Roles of the LHX3 and LHX4 LIM-homeo-domain factors in pituitary development. Mol Cell Endocrinol 2007;265-266:190–5.
11. Sloop KW, Walvoord EC, Showalter AD, et al. Molecular analysis of LHX3 andPROP-1 in pituitary hormone deficiency patients with posterior pituitary ectopia.J Clin Endocrinol Metab 2000;85(8):2701–8.
12. Cohen LE. Genetic regulation of the embryology of the pituitary gland and soma-totrophs. Endocrine 2000;12(2):99–106.
13. Weinmann HJ, Brasch RC, Press WR, et al. Characteristics of gadolinium-DTPAcomplex: a potential NMR contrast agent. AJR Am J Roentgenol 1984;142(3):619–24.
14. Grobner T, Prischl FC. Patient characteristics and risk factors for nephrogenicsystemic fibrosis following gadolinium exposure. Semin Dial 2008;21(2):135–9.
15. Rupp D, Molitch M. Pituitary stalk lesions. Curr Opin Endocrinol Diabetes Obes2008;15(4):339–45.
16. Fujisawa I. Magnetic resonance imaging of the hypothalamic-neurohypophysealsystem. J Neuroendocrinol 2004;16(4):297–302.
17. Takano K, Utsunomiya H, Ono H, et al. Normal development of the pituitary gland:assessment with three-dimensional MR volumetry. AJNR Am J Neuroradiol 1999;20(2):312–5.
18. Kiortsis D, Xydis V, Drougia AG, et al. The height of the pituitary in preterm infantsduring the first 2 years of life: an MRI study. Neuroradiology 2004;46(3):224–6.

Imaging of Pediatric Pituitary Abnormalities 697
19. Argyropoulou MI, Kiortsis DN. MRI of the hypothalamic-pituitary axis in children.Pediatr Radiol 2005;35(11):1045–55.
20. Dietrich RB, Lis LE, Greensite FS, et al. Normal MR appearance of the pituitarygland in the first 2 years of life. AJNR Am J Neuroradiol 1995;16(7):1413–9.
21. Triulzi F, Scotti G, di Natale B, et al. Evidence of a congenital midline brainanomaly in pituitary dwarfs: a magnetic resonance imaging study in 101 patients.Pediatrics 1994;93(3):409–16.
22. Einaudi S, Bondone C. The effects of head trauma on hypothalamic-pituitaryfunction in children and adolescents. Curr Opin Pediatr 2007;19(4):465–70.
23. Pandey P, Ojha BK, Mahapatra AK. Pediatric pituitary adenoma: a series of 42patients. J Clin Neurosci 2005;12(2):124–7.
24. Kunwar S, Wilson CB. Pediatric pituitary adenomas. J Clin Endocrinol Metab1999;84(12):4385–9.
25. Kucharczyk W, Bishop JE, Plewes DB, et al. Detection of pituitary microadeno-mas: comparison of dynamic keyhole fast spin-echo, unenhanced, andconventional contrast-enhanced MR imaging. AJR Am J Roentgenol 1994;163(3):671–9.
26. Zada G, Ditty B, McNatt SA, et al. Surgical treatment of Rathke cleft cysts in chil-dren. Neurosurgery 2009;64(6):1132–7 [author reply: 1037–8].
27. Takanashi J, Tada H, Barkovich AJ, et al. Pituitary cysts in childhood evaluated byMR imaging. AJNR Am J Neuroradiol 2005;26(8):2144–7.
28. Shin JL, Asa SL, Woodhouse LJ, et al. Cystic lesions of the pituitary: clinicopath-ological features distinguishing craniopharyngioma, Rathke’s cleft cyst, andarachnoid cyst. J Clin Endocrinol Metab 1999;84(11):3972–82.
29. Byun WM, Kim OL, Kim D. MR imaging findings of Rathke’s cleft cysts: signifi-cance of intracystic nodules. AJNR Am J Neuroradiol 2000;21(3):485–8.
30. Garre ML, Cama A. Craniopharyngioma: modern concepts in pathogenesis andtreatment. Curr Opin Pediatr 2007;19(4):471–9.
31. Jagannathan J, Kanter AS, Sheehan JP, et al. Benign brain tumors: sellar/parasel-lar tumors. Neurol Clin 2007;25(4):1231–49, xi.
32. Mohn A, Schoof E, Fahlbusch R, et al. The endocrine spectrum of arachnoidcysts in childhood. Pediatr Neurosurg 1999;31(6):316–21.
33. Adan L, Bussieres L, Dinand V, et al. Growth, puberty and hypothalamic-pituitaryfunction in children with suprasellar arachnoid cyst. Eur J Pediatr 2000;159(5):348–55.
34. Koeller KK, Rushing EJ. From the archives of the AFIP. Pilocytic astrocytoma:radiologic-pathologic correlation. Radiographics 2004;24(6):1693–708.
35. Boyko OB, Curnes JT, Oakes WJ, et al. Hamartomas of the tuber cinereum: CT,MR, and pathologic findings. AJNR Am J Neuroradiol 1991;12(2):309–14.
36. Lee L, Saran F, Hargrave D, et al. Germinoma with synchronous lesions in thepineal and suprasellar regions. Childs Nerv Syst 2006;22(12):1513–8.
37. Liang L, Korogi Y, Sugahara T, et al. MRI of intracranial germ-cell tumours. Neuro-radiology 2002;44(5):382–8.
38. Tsao CY, Lo WD, Rusin JA, et al. Isolated neurosarcoidosis presenting as head-ache and multiple brain and spinal cord lesions mimicking central nervoussystem metastases. Brain Dev 2007;29(8):514–8.
39. Amato MC, Elias LL, Elias J, et al. Endocrine disorders in pediatric-onset Langer-hans cell histiocytosis. Horm Metab Res 2006;38(11):746–51.
40. Donadieu J, Rolon MA, Thomas C, et al. Endocrine involvement in pediatric-onsetLangerhans’ cell histiocytosis: a population-based study. J Pediatr 2004;144(3):344–50.

Delman698
41. Gellner V, Kurschel S, Scarpatetti M, et al. Lymphocytic hypophysitis in the pedi-atric population. Childs Nerv Syst 2008;24(7):785–92.
42. Chapurlat RD, Orcel P. Fibrous dysplasia of bone and McCune-Albrightsyndrome. Best Pract Res Clin Rheumatol 2008;22(1):55–69.
43. Glenn OA, Barkovich AJ. Magnetic resonance imaging of the fetal brain andspine: an increasingly important tool in prenatal diagnosis, part 1. AJNR AmJ Neuroradiol 2006;27(8):1604–11.
44. Lee SK, Kim DI, Kim J, et al. Diffusion-tensor MR imaging and fiber tractography:a new method of describing aberrant fiber connections in developmental CNSanomalies. Radiographics 2005;25(1):53–65 [discussion: 66–8].
45. Lee SK, Mori S, Kim DJ, et al. Diffusion tensor MR imaging visualizes the alteredhemispheric fiber connection in callosal dysgenesis. AJNR Am J Neuroradiol2004;25(1):25–8.
46. Hamilton J, Blaser S, Daneman D. MR imaging in idiopathic growth hormone defi-ciency. AJNR Am J Neuroradiol 1998;19(9):1609–15.
47. Mikulis DJ, Diaz O, Egglin TK, et al. Variance of the position of the cerebellartonsils with age: preliminary report. Radiology 1992;183(3):725–8.
48. Quigley MF, Iskandar B, Quigley ME, et al. Cerebrospinal fluid flow in foramenmagnum: temporal and spatial patterns at MR imaging in volunteers and inpatients with Chiari I malformation. Radiology 2004;232(1):229–36.
49. Hankinson TC, Klimo P Jr, Feldstein NA, et al. Chiari malformations, syringohydro-myelia and scoliosis. Neurosurg Clin N Am 2007;18(3):549–68.
50. Kelberman D, Dattani MT. Septo-optic dysplasia – novel insights into the aeti-ology. Horm Res 2008;69(5):257–65.
51. Mehta A, Hindmarsh PC, Mehta H, et al. Congenital hypopituitarism: clinical,molecular and neuroradiological correlates. Clin Endocrinol (Oxf) 2009;71:376–82.


![COMMISSION ON LABORATORY …pathology.jhu.edu/department/MAS_GEN_09272007[1].pdfLaboratory General OUTLINE SUMMARY OF CHANGES 3 INSPECTION TECHNIQUES – KEY POINTS](https://img.dokumen.tips/doc/110x75/5b87a1cd7f8b9a3d028b590a/commission-on-laboratory-1pdflaboratory-general-outline-summary-of-changes-3-inspection.jpg)


![[XLS]All Common Checklist Summation - Johns Hopkins …pathology.jhu.edu/corelab/CAP/AllCommonChecklistSummation.xlsx · Web viewThe laboratory has a written quality management/quality](https://img.dokumen.tips/doc/110x75/5abc17e37f8b9a567c8d6943/xlsall-common-checklist-summation-johns-hopkins-viewthe-laboratory-has-a.jpg)