Embed Size (px)
Citation preview

Imaging Multiple Horizons with Spectral Techniques in the Sirt Basin,
LibyaAuthorsAuthors::
Sam Yates, Irena Kivior, Shiferaw Damte, Stephen Markham, Sam Yates, Irena Kivior, Shiferaw Damte, Stephen Markham, Francis VaughanFrancis Vaughan
EAGE Workshop on Non Seismic Methods EAGE Workshop on Non Seismic Methods Manama, Bahrain, 2008Manama, Bahrain, 2008

OutlineOutline
Sirt Basin HRAM survey Methodology Energy Spectrum Analysis Multi-window Testing Application of ESA to Sirt Basin Data Conclusions

Sirt Basin
Expect a strong magnetic contrast between
sediments and Precambrian basement. Also: Nubian sandstone formation
Susceptibility of approximately 0.007 (SI)
Hematitic siltstone: ( e.g.unit 3) 0.002 (SI)
Volcanics: 0.01 (SI) Good contrasts possible between layers.

Methodology Standard transformations: RTP, vertical
derivatives Data quality analysis (including 2-d spectrum) Filter maps; horizontal gradient technique for
anomaly isolation Energy Spectrum Analysis Automatic Curve Matching QC through forward modelling Will focus on ESA and new Multi-
Window Test.

Energy Spectrum Analysis
ESA is a well established technique for estimating the depth to a (magnetic) horizon.
Spector and Grant: a magnetic interface is modeled by a statistical layer of magnetized vertical blocks.
E() ∝ e -2h (1- e -t )2 S()
h = depth to top
t = thickness

ESA 2
Logarithm of spectrum Curve - slope proportional to
depth Perform at multiple points with
data windowed to sub-region Create depth map

Window size dependency
An unsuitable window size in ESA will give inaccurate results:– Window size too small: insufficient
data to capture response of interface.
– Window size too large: low-frequency decay dominated by deeper magnetic sources.

Synthetic tests The magnetic field generated by a Spector
and Grant style random ensemble of bodies Extending from 2 km to 20 km in depth,
covering approximately 75% of the 100 km by 100 km horizon.
•Bodies: susceptibility of 0.012 (SI) •Additional uniform white noise added with a peak magnitude of 0.2 nT. •The generated field was sampled every 100 m.

Window too small The spectrum for a 5 km radius window gives
a slope that is too shallow (1619 m), 8 km radius window gives a slope that is
correct (yields 2020 m)

Window too large Multiple magnetic horizons: too
large a window will give a spectrum with low frequencies dominated by the deeper sources.
A risk in practice, real presence of strong, deep-seated magnetic anomalies.
Another synthetic test demonstrates the issue.

Window too Large Same basement ensemble as before,
– Dropped to a depth of 5 km, – Additional ensemble of objects in a layer
between 4 km and 5 km. – This upper layer again has approximately
75% coverage, – Objects have a lower susceptibility 0.006 (SI).
Expect to find slopes that correspond to the two horizons at 4 km and 5 km,
Also slopes that underestimate the top horizon, or pick some intermediate depth between the two.

Too Large 2Window radius 6 kmslope → 1446 m
Window radius 12 kmslope → 3973 m
Window radius 20 kmslope → 4503 m
Window radius 26 kmslope → 4994 m
Multi Window Test
How to determine a suitable window size?
The idea:– Calculate decay rates for lots of
windows sizes.– Heuristic: solutions with low
dependence on window size are likely to be meaningful.

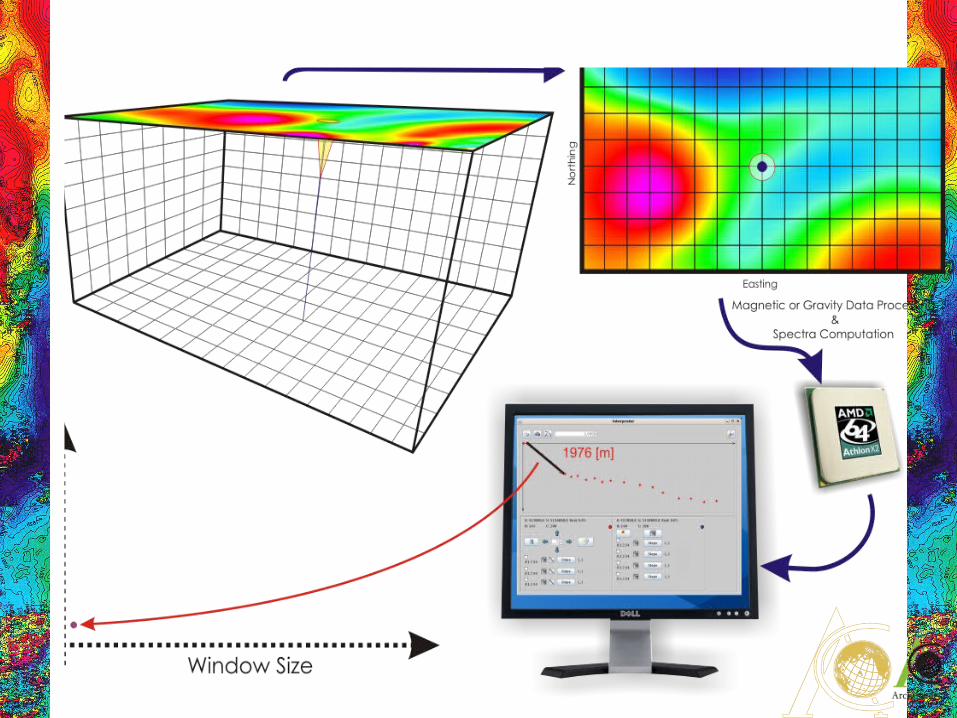
The MWT procedure
1. MWT over a point: spectra calculated in small increments in window-size (typically two grid-cells or so.)
2. Spectra interpreted to produce a depth estimate.
3. Depth estimates plotted regions of stability identified
4. Stable depths: Likely depths to magnetic interfaces Window sizes in the stable region good
candidates for applying ESA.


MWT Plateaus

Synthetic test

MWT along a profile Performed MWT at each point along a
profile, Stability of a depth solution at each
point plotted to produce an image. Stability at a given depth is
represented by window density– measure of how many window sizes give
that depth. Horizons intersecting the profile then
are imaged as lines of high-stability in the 2-d plot.

Automatic Interpretation Producing a consistent set of
interpretations for each of these window sizes is a time consuming process.
Even when partially automated by software.
In areas with good data quality– totally automatic interpretation becomes
feasible– can rapidly produce MWT profiles for
preliminary depth estimation and optimal window-size determination.

Application of MWT in interpretation process
Automatic MWT profile-plots along profiles of interest – gives rapid indication of structures and
preliminary depth estimates. A detailed, supervised, MWT:
– performed at coarse selection of points in the area of study.
Window-sizes corresponding to sound plateaus are identified, – used as basis for Energy Spectral Analysis
moving window around those points.