Embed Size (px)
Citation preview
Page1
ImagineSchoolsSummerMathChallenge
Grade Seven
Answer Key When completing the problems we need to show all of our work and show all of our thinking. In this
answer key, important information that was used to solve the problem is bolded and underlined to show
our thinking. We also provided speech balloons to show our thoughts and help you see how we thought
through the problem when we were solving it. Compare your work to ours, especially if your answer is
different than our answer.

Page2
Project #1 Domain: Expressions and Equations
Standard EE.7: Solve real‐life and mathematical problems using numerical and algebraic expressions and equations.
Directions:
1. Read the problem below.
The Murphys love to give parties. Last Friday they gave a party and the doorbell rang 15 times. At the first ring, one guest arrived. Each time the doorbell rang after that, two more guests arrived than the time before.
On Saturday they had another party. At the first ring of the doorbell a single guest arrived, at the second ring two guests appeared, at the third ring three guests and so on. If the doorbell rang 20 times Saturday night, how many guests attended? Was this party bigger than Friday's? How do you know?
Solution:
2. Draw a picture to show one way to solve this problem.
Problem 1: Friday’s party attendance with 15 doorbell rings Problem 2: Saturday’s party attendance with 20 doorbell rings
Page3
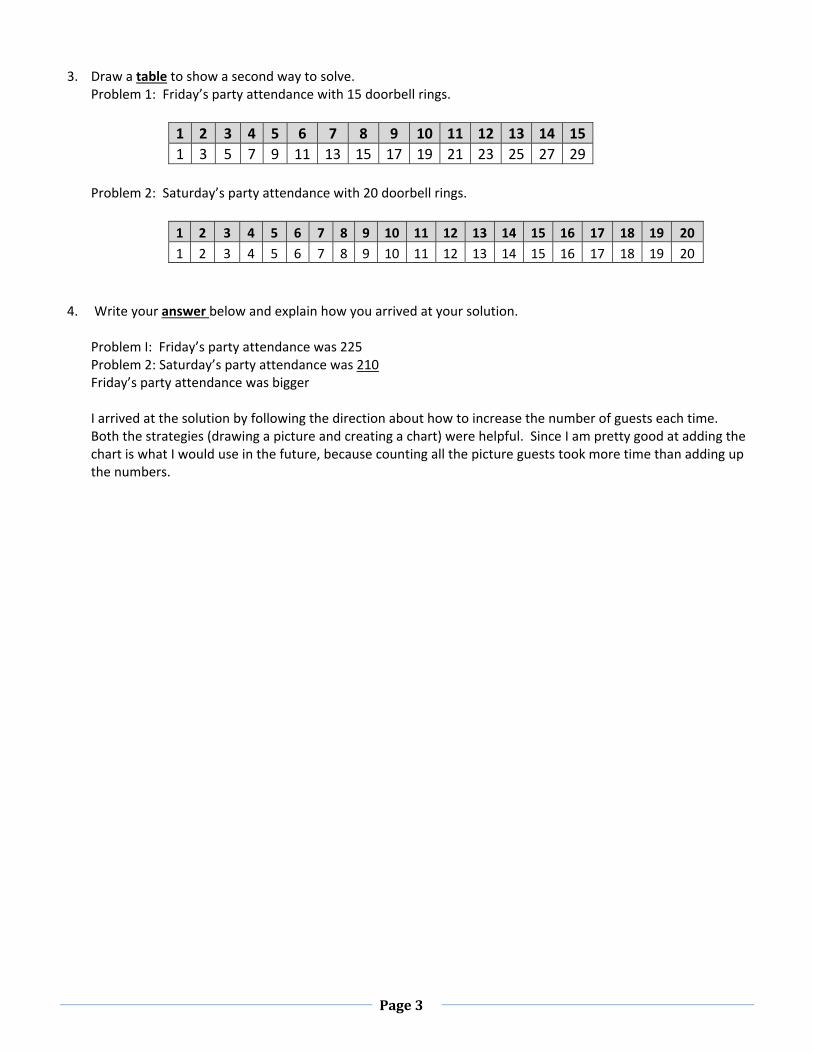
3. Draw a table to show a second way to solve.
Problem 1: Friday’s party attendance with 15 doorbell rings.
1 2 3 4 5 6 7 8 9 10 11 12 13 14 15
1 3 5 7 9 11 13 15 17 19 21 23 25 27 29
Problem 2: Saturday’s party attendance with 20 doorbell rings.
1 2 3 4 5 6 7 8 9 10 11 12 13 14 15 16 17 18 19 20
1 2 3 4 5 6 7 8 9 10 11 12 13 14 15 16 17 18 19 20
4. Write your answer below and explain how you arrived at your solution.
Problem I: Friday’s party attendance was 225 Problem 2: Saturday’s party attendance was 210 Friday’s party attendance was bigger I arrived at the solution by following the direction about how to increase the number of guests each time. Both the strategies (drawing a picture and creating a chart) were helpful. Since I am pretty good at adding the chart is what I would use in the future, because counting all the picture guests took more time than adding up the numbers.
Page4
Project#2
Domain: Ratios and Proportional Relationships
Standard RP.7: Analyze proportional relationships and use them to solve real-world and mathematical problems.
Directions: 1. Complete the following three problems to apply your understanding of percentages and ratios.
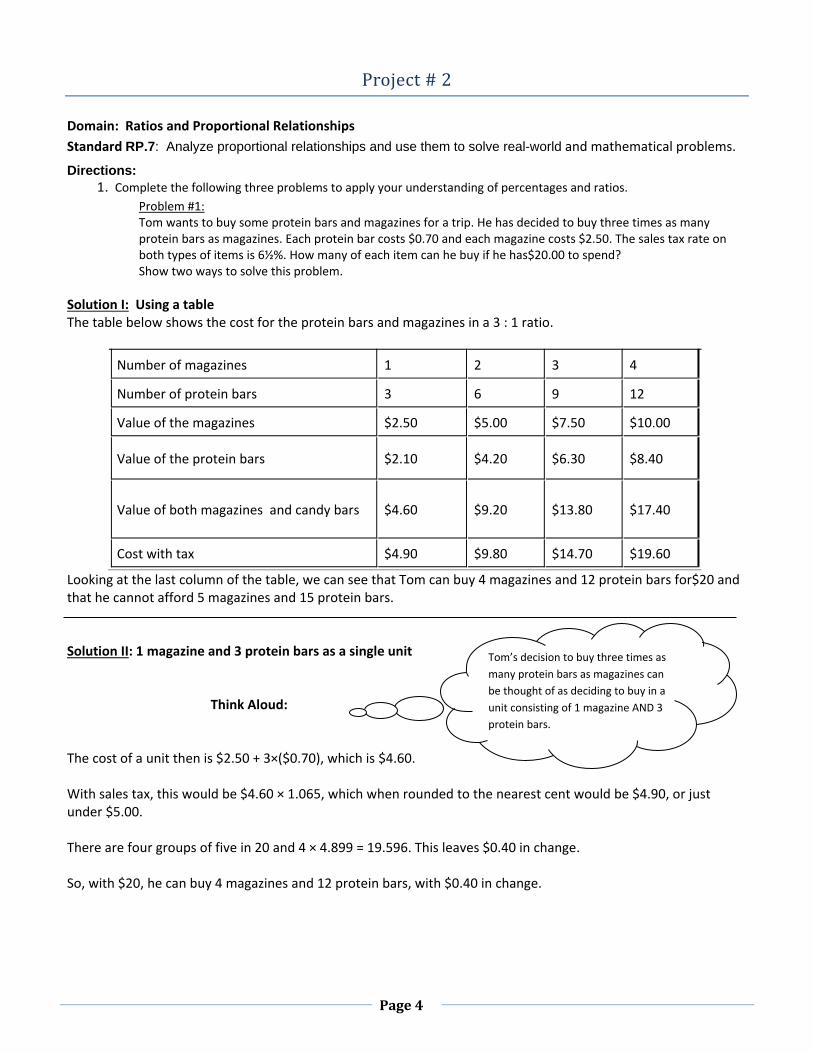
Problem #1: Tom wants to buy some protein bars and magazines for a trip. He has decided to buy three times as many protein bars as magazines. Each protein bar costs $0.70 and each magazine costs $2.50. The sales tax rate on both types of items is 6½%. How many of each item can he buy if he has$20.00 to spend? Show two ways to solve this problem.
Solution I: Using a table The table below shows the cost for the protein bars and magazines in a 3 : 1 ratio.
Number of magazines 1 2 3 4
Number of protein bars 3 6 9 12
Value of the magazines $2.50 $5.00 $7.50 $10.00
Value of the protein bars $2.10 $4.20 $6.30 $8.40
Value of both magazines and candy bars $4.60 $9.20 $13.80 $17.40
Cost with tax $4.90 $9.80 $14.70 $19.60
Looking at the last column of the table, we can see that Tom can buy 4 magazines and 12 protein bars for$20 and that he cannot afford 5 magazines and 15 protein bars. Solution II: 1 magazine and 3 protein bars as a single unit Think Aloud: The cost of a unit then is $2.50 + 3×($0.70), which is $4.60. With sales tax, this would be $4.60 × 1.065, which when rounded to the nearest cent would be $4.90, or just under $5.00. There are four groups of five in 20 and 4 × 4.899 = 19.596. This leaves $0.40 in change. So, with $20, he can buy 4 magazines and 12 protein bars, with $0.40 in change.
Tom’s decision to buy three times as
many protein bars as magazines can
be thought of as deciding to buy in a
unit consisting of 1 magazine AND 3
protein bars.
Page5
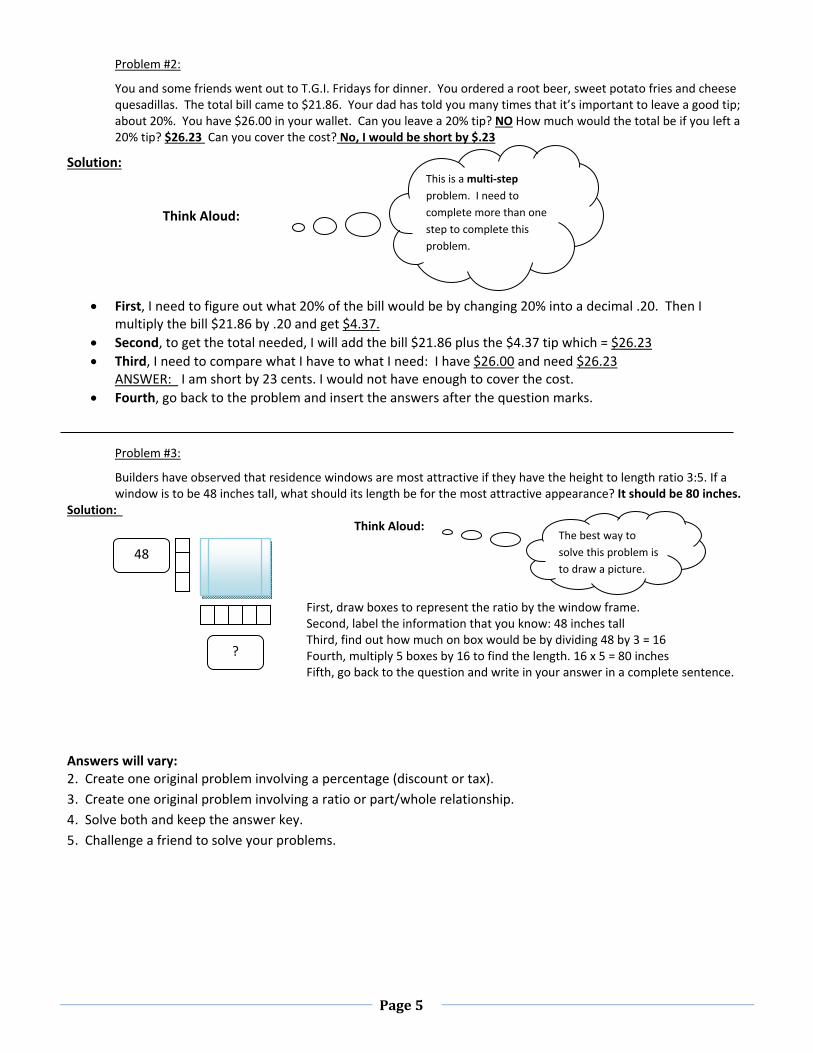
Problem #2:
You and some friends went out to T.G.I. Fridays for dinner. You ordered a root beer, sweet potato fries and cheese quesadillas. The total bill came to $21.86. Your dad has told you many times that it’s important to leave a good tip; about 20%. You have $26.00 in your wallet. Can you leave a 20% tip? NO How much would the total be if you left a 20% tip? $26.23 Can you cover the cost? No, I would be short by $.23
Solution: Think Aloud:
First, I need to figure out what 20% of the bill would be by changing 20% into a decimal .20. Then I multiply the bill $21.86 by .20 and get $4.37.
Second, to get the total needed, I will add the bill $21.86 plus the $4.37 tip which = $26.23
Third, I need to compare what I have to what I need: I have $26.00 and need $26.23 ANSWER: I am short by 23 cents. I would not have enough to cover the cost.
Fourth, go back to the problem and insert the answers after the question marks.
Problem #3:
Builders have observed that residence windows are most attractive if they have the height to length ratio 3:5. If a window is to be 48 inches tall, what should its length be for the most attractive appearance? It should be 80 inches.
Solution: Think Aloud: First, draw boxes to represent the ratio by the window frame. Second, label the information that you know: 48 inches tall Third, find out how much on box would be by dividing 48 by 3 = 16 Fourth, multiply 5 boxes by 16 to find the length. 16 x 5 = 80 inches Fifth, go back to the question and write in your answer in a complete sentence.
Answers will vary: 2. Create one original problem involving a percentage (discount or tax). 3. Create one original problem involving a ratio or part/whole relationship. 4. Solve both and keep the answer key. 5. Challenge a friend to solve your problems.
This is a multi‐step
problem. I need to
complete more than one
step to complete this
problem.
The best way to
solve this problem is
to draw a picture.
?
48

Page6
Project#3
Domain: Equations and Expressions
Standard EE.7: Use properties of operations to generate equivalent expressions.
Directions:
Complete the two problems below.
Problem 1: Using exactly four 4's and any operations [+, ‐, x, ÷, ()] write an expression to equal each of the following:
1 = __________ 4 = __________ 2 = __________ 5 = __________
3 = __________ *Example: 16 = 4 x 4 x 4 ÷ 4
Solution: (Hint: The trial and error method using a calculator worked great for me)
1 = (4 ‐ 4) + (4 ÷ 4) 4 = 4 – 4 x 4 + 4
2 = (4 ÷ 4) + (4 ÷ 4) 5 = 4 x 4 + 4 ÷ 4
3 = 4 + 4 + 4 ÷ 4
Problem 2: Find three different ways to fill in operations in the boxes below to make the equations true. Solution:
6 1 2 2 = 5 *Hint: Operations include: +, ‐, x, ÷,() 6 1 2 2 = 5 (6 1) (2 2) = 5
‐ x ÷
x ÷ +
‐ ‐ ‐
Page7
Project#4
Domain: Expressions and Equations Standard EE.7: Solve multi‐step real‐life and mathematical problems posed with positive and negative rational numbers in any form (whole numbers, fractions, and decimals), using tools strategically. Apply properties of operations to calculate with numbers in any form; convert between forms as appropriate; and assess the reasonableness of answers using mental computation and estimation strategies. Directions: Identify a situation in which it would be appropriate to estimate a measurement. Determine the level of accuracy
needed and give an explanation for why the situation you have presented is acceptable for estimation. Then,
select the appropriate method of estimation.
Example: You need to know approximately how much grass seed to buy to cover your backyard. You calculate
the perimeter and area of the yard. Research to find out how much area on bag of grass seed will cover. Then
estimate the number of bags of grass seed needed to cover the surface area of the backyard.
Solution:
Answers will vary
Rubric:
+ situation realistically uses estimation
+ method of estimation is accurate
Page8
Project#5.Domain: Number Systems
Standard NS.7:1.c. Understand subtraction of rational numbers as adding the additive inverse, p – q = p + (–q).
Show that the distance between two rational numbers on the number line is the absolute value of their
difference, and apply this principle in real‐world contexts.
Directions:
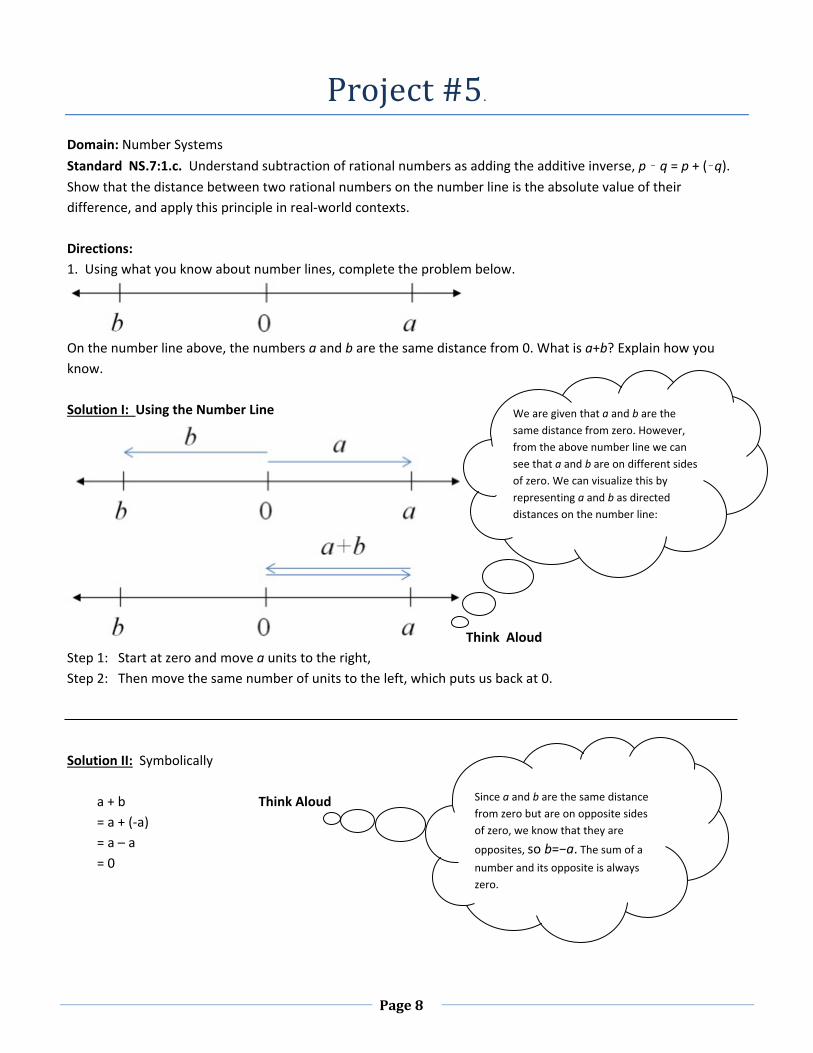
1. Using what you know about number lines, complete the problem below.
On the number line above, the numbers a and b are the same distance from 0. What is a+b? Explain how you
know.
Solution I: Using the Number Line
Think Aloud
Step 1: Start at zero and move a units to the right,
Step 2: Then move the same number of units to the left, which puts us back at 0.
Solution II: Symbolically
a + b Think Aloud
= a + (‐a)
= a – a
= 0
We are given that a and b are the
same distance from zero. However,
from the above number line we can
see that a and b are on different sides
of zero. We can visualize this by
representing a and b as directed
distances on the number line:
Since a and b are the same distance
from zero but are on opposite sides
of zero, we know that they are
opposites, so b=−a. The sum of a
number and its opposite is always
zero.

Page9
2. Use a picture or physical objects to illustrate and create a problem for others to solve:
o 3 ‐ 7 o ‐3 ‐ 7 o ‐3 ‐ (‐7) o (‐3)(‐7) o 21 ÷ (‐3)
Example for 13 – (‐8):
At noon on a certain day, the temperature was 13 degrees.
At 10:00 p.m. the same day, the temperature was ‐8 degrees.
How many degrees did the temperature drop between noon and 10:00 p.m.?
2: Solution:
Answers will vary
Rubric:
+ Illustration is similar in format to the example (level of detail)
+ A question is posed
Page10
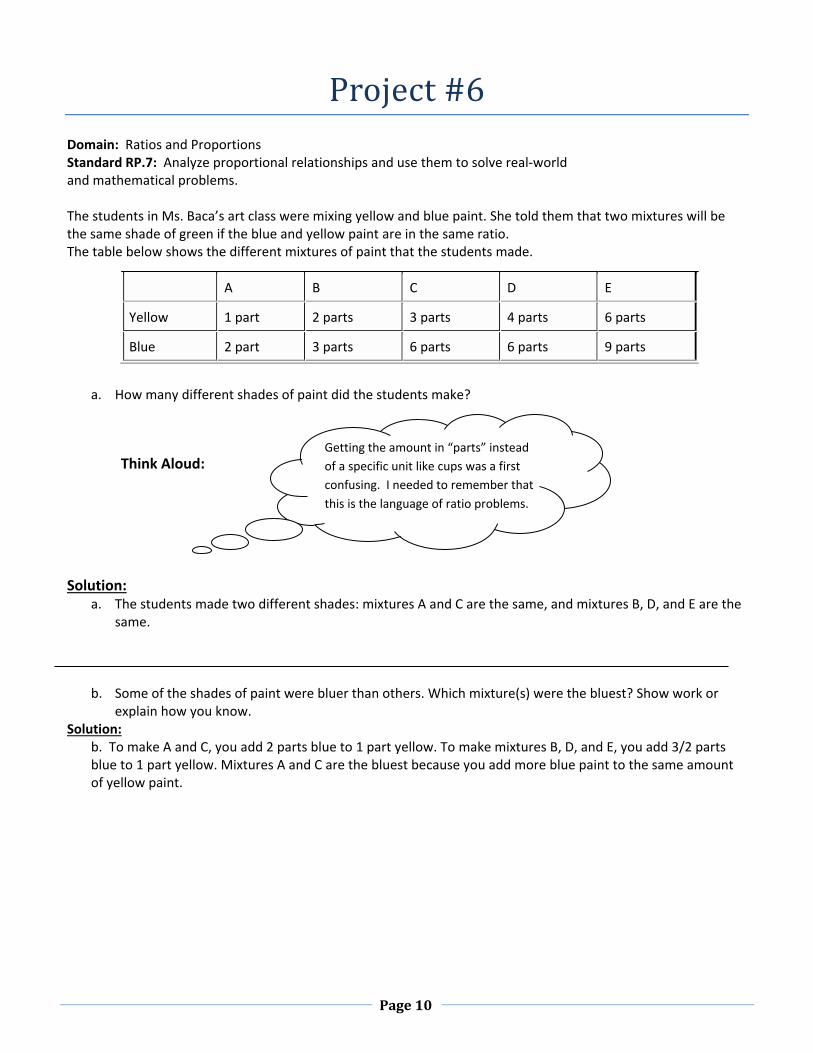
Project#6Domain: Ratios and Proportions Standard RP.7: Analyze proportional relationships and use them to solve real‐world and mathematical problems. The students in Ms. Baca’s art class were mixing yellow and blue paint. She told them that two mixtures will be the same shade of green if the blue and yellow paint are in the same ratio. The table below shows the different mixtures of paint that the students made.
a. How many different shades of paint did the students make?
Think Aloud:
Solution: a. The students made two different shades: mixtures A and C are the same, and mixtures B, D, and E are the
same.
b. Some of the shades of paint were bluer than others. Which mixture(s) were the bluest? Show work or explain how you know.
Solution: b. To make A and C, you add 2 parts blue to 1 part yellow. To make mixtures B, D, and E, you add 3/2 parts blue to 1 part yellow. Mixtures A and C are the bluest because you add more blue paint to the same amount of yellow paint.
A B C D E
Yellow 1 part 2 parts 3 parts 4 parts 6 parts
Blue 2 part 3 parts 6 parts 6 parts 9 parts
Getting the amount in “parts” instead
of a specific unit like cups was a first
confusing. I needed to remember that
this is the language of ratio problems.
Page11
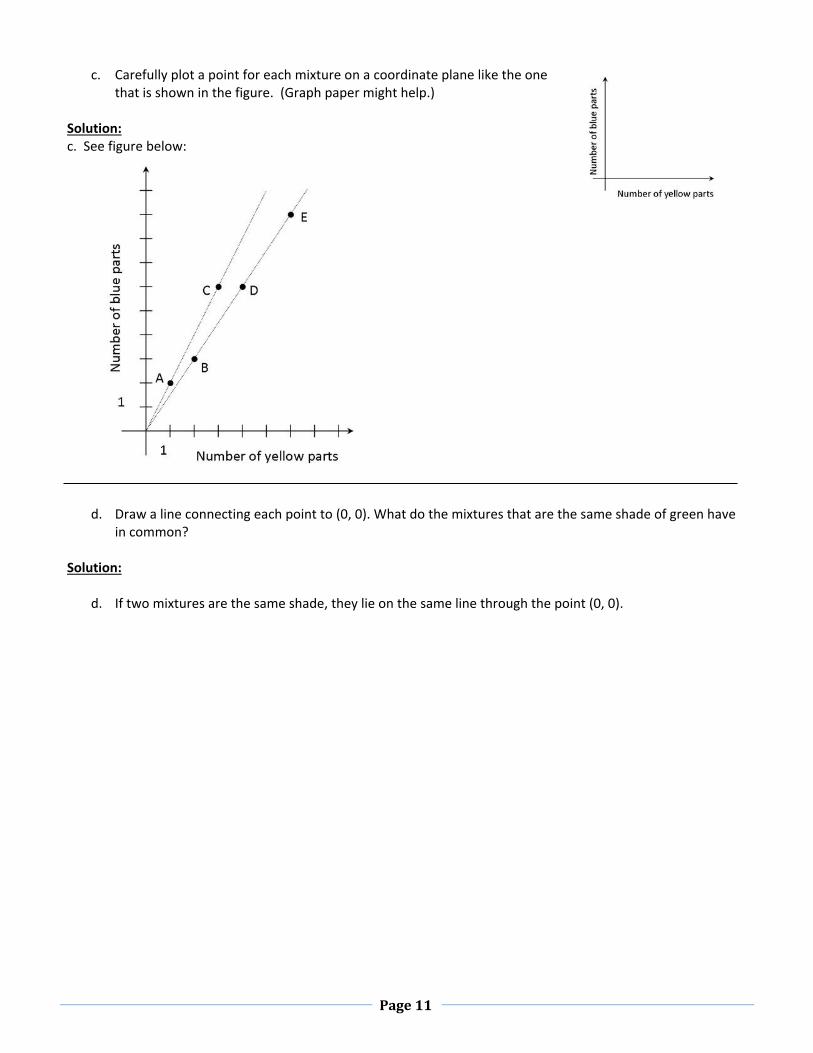
c. Carefully plot a point for each mixture on a coordinate plane like the one
that is shown in the figure. (Graph paper might help.) Solution: c. See figure below:
d. Draw a line connecting each point to (0, 0). What do the mixtures that are the same shade of green have
in common? Solution:
d. If two mixtures are the same shade, they lie on the same line through the point (0, 0).
Page12
Project#7Domain: Number System
Standard: Apply and extend previous understandings of operations with fractions to add, subtract, multiply, and
divide rational numbers.
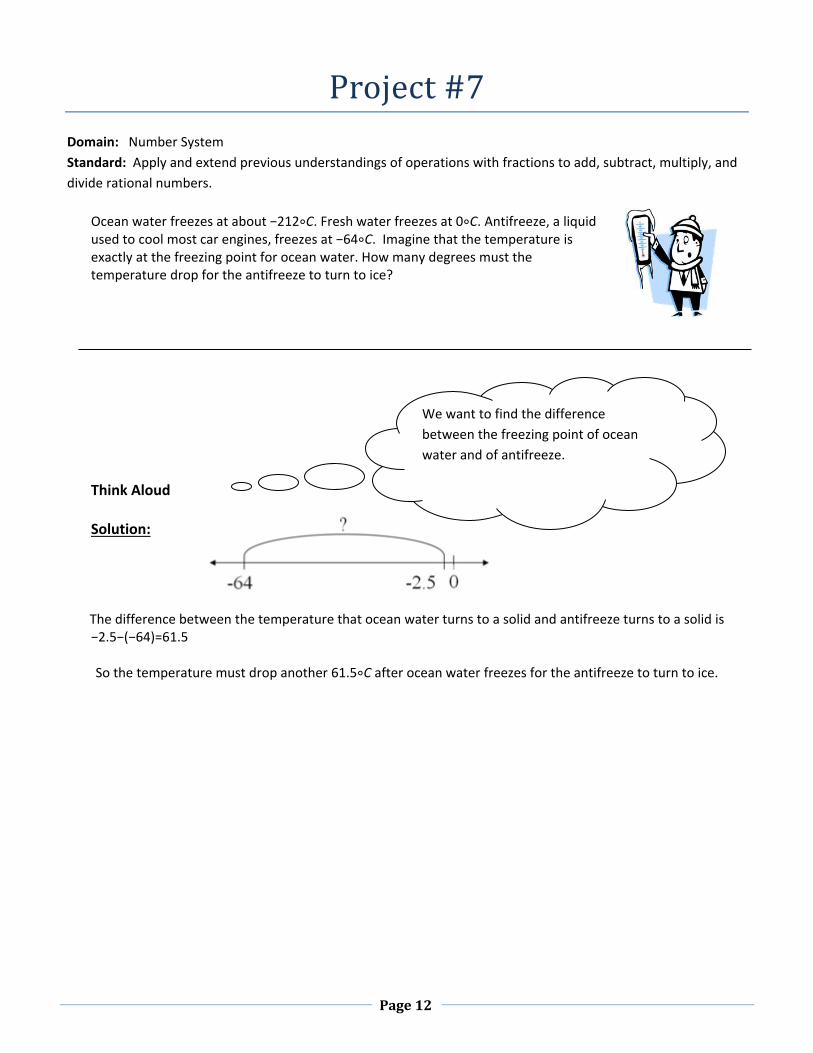
Ocean water freezes at about −212∘C. Fresh water freezes at 0∘C. Antifreeze, a liquid used to cool most car engines, freezes at −64∘C. Imagine that the temperature is exactly at the freezing point for ocean water. How many degrees must the temperature drop for the antifreeze to turn to ice?
Think Aloud Solution:
The difference between the temperature that ocean water turns to a solid and antifreeze turns to a solid is −2.5−(−64)=61.5
So the temperature must drop another 61.5∘C after ocean water freezes for the antifreeze to turn to ice.
We want to find the difference
between the freezing point of ocean
water and of antifreeze.
Page13
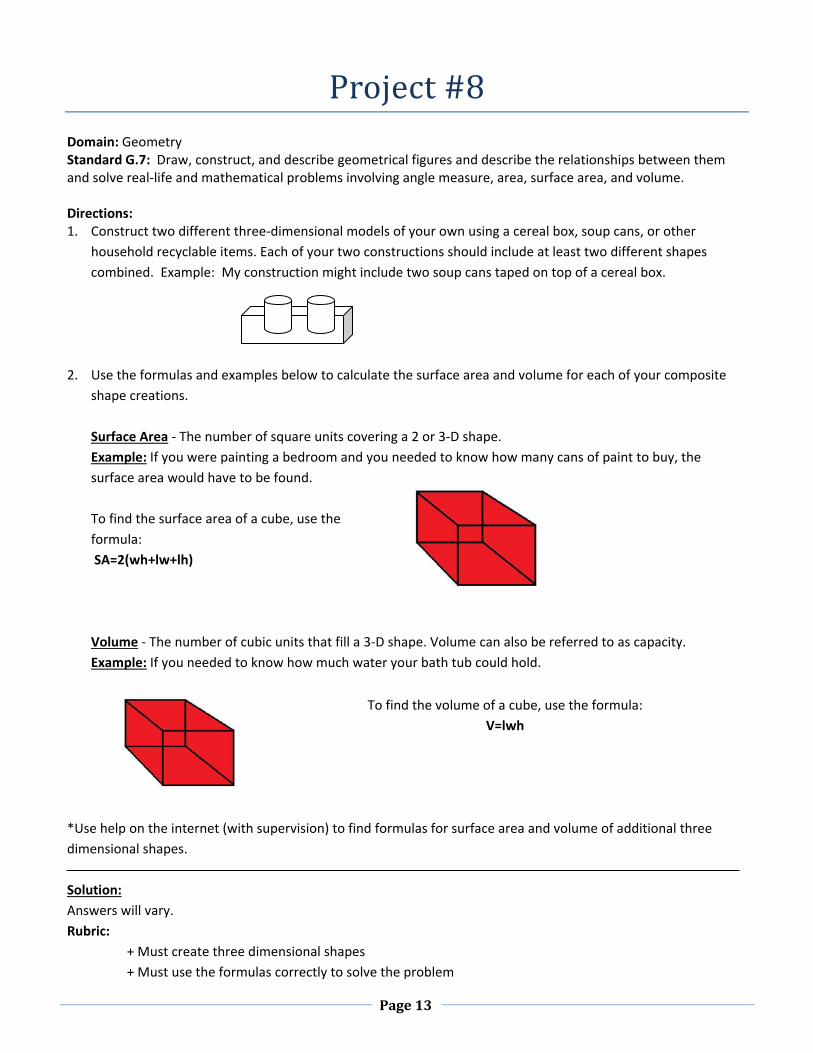
Project#8Domain: Geometry Standard G.7: Draw, construct, and describe geometrical figures and describe the relationships between them and solve real‐life and mathematical problems involving angle measure, area, surface area, and volume. Directions: 1. Construct two different three‐dimensional models of your own using a cereal box, soup cans, or other
household recyclable items. Each of your two constructions should include at least two different shapes
combined. Example: My construction might include two soup cans taped on top of a cereal box.
2. Use the formulas and examples below to calculate the surface area and volume for each of your composite
shape creations.
Surface Area ‐ The number of square units covering a 2 or 3‐D shape.
Example: If you were painting a bedroom and you needed to know how many cans of paint to buy, the
surface area would have to be found.
To find the surface area of a cube, use the
formula:
SA=2(wh+lw+lh)
Volume ‐ The number of cubic units that fill a 3‐D shape. Volume can also be referred to as capacity.
Example: If you needed to know how much water your bath tub could hold.
1.
To find the volume of a cube, use the formula:
V=lwh
*Use help on the internet (with supervision) to find formulas for surface area and volume of additional three
dimensional shapes.
Solution:
Answers will vary.
Rubric:
+ Must create three dimensional shapes
+ Must use the formulas correctly to solve the problem

Page14
Project#9
Domain: Geometry
Standard G.7: Solve real‐life and mathematical problems involving angle measure, area, surface area, and
volume.
Directions:
Study the diagram and coinciding information below.
A
Angle 1 is vertical with . Angle 2 is vertical with .
In each case these pairs of angles form an X.
and are supplementary because they form the straight line FC.
and are supplementary because they form the straight line AD.
and are vertical.
and are supplementary because they form the straight line FC.
1. Find 2‐3 real objects in your home or neighborhood that demonstrates one or more of the same relationships
expressed in the diagram above.
2. Take pictures of each of the objects you found and either download the pictures and paste them into an electronic document(s) or create a poster and paste your pictures on the poster. *If you do not have access to a digital camera and source for printing pictures, you may draw a picture of your objects instead.
3. Finally label each line, each angle, and each corresponding relationship. Use words to describe the angles and
relationships formed by the intersecting lines on your document or poster (as done in the example above).
Solution: Answers will vary. Rubric:
+ Must find at least two objects + Must define relationships of angels in writing using the correct vocabulary
F D
C B
E
P 2
1
Page15
Project#10
Domain: Geometry
Standard G.7: Solve real‐life and mathematical problems involving angle measure, area, surface area, and
volume.
Directions:
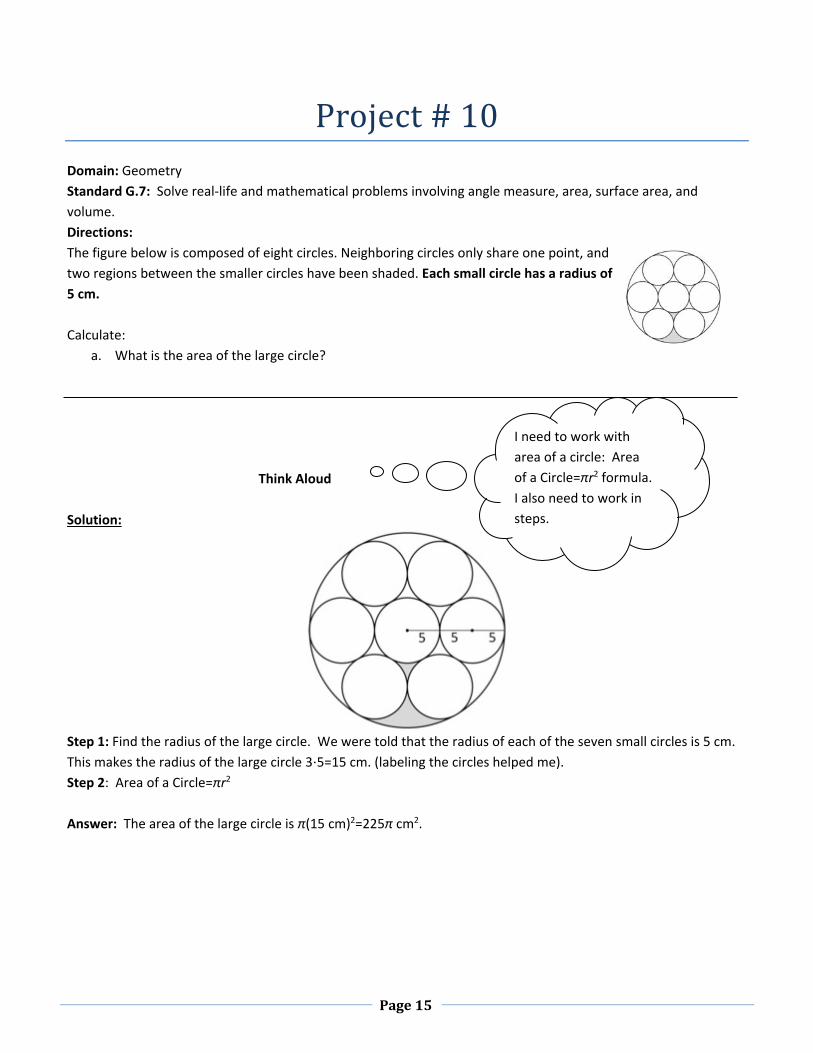
The figure below is composed of eight circles. Neighboring circles only share one point, and
two regions between the smaller circles have been shaded. Each small circle has a radius of
5 cm.
Calculate:
a. What is the area of the large circle?
Think Aloud
Solution:
Step 1: Find the radius of the large circle. We were told that the radius of each of the seven small circles is 5 cm.
This makes the radius of the large circle 3⋅5=15 cm. (labeling the circles helped me).
Step 2: Area of a Circle=πr2
Answer: The area of the large circle is π(15 cm)2=225π cm2.
I need to work with
area of a circle: Area
of a Circle=πr2 formula.
I also need to work in
steps.
Page16
b. What is the area of the shaded part of the figure?
Solution:
Step 1: The area of each small circle is π(5 cm)2=25π cm2
Think: There are seven small circles in all, so the area of all the small circles together is 7×25π cm2=175π cm2.
Step 2: Take the area of the large circle and subtract the area of the seven small circles, I was left with all of the
area contained in the large circle that is not contained in a small circle, which is, the area around the small circles.
Answer: This area is 225π cm2−175π cm2=50π cm2.
Think: The exact shape of the shaded region is repeated six times in the large circle. This makes the shaded
region 1/6 of the area that is contained in the large circle that is not contained in a small circle.
Answer: The shaded region has an area of 1 × 50π cm2 = 50π 25π
6 6 3
cm2 = cm2

Page17
Project#11Domain: Geometry
Standard G.7: Draw, construct, and describe geometrical figures and describe the relationships between them.
Directions:
1. Using a sheet on graph paper and a ruler, draw an example of each type of angle: acute, obtuse, right, straight, complementary, supplementary, and vertical.
2. Label each of your angles. 3. Then, find an example of each in the real world (i.e., in your home, neighborhood, or natural environment, at
the grocery store, baseball field, in your car, etc.). 4. Take a picture of each example and print it out and paste it on a piece of paper. Label each picture with the
correct label. *If you do not have a camera, draw a sketch of each example you find in the real world and label as using the appropriate geometric terms. Example: Right angle
Solution:
Answers will vary
Rubric
+ Two illustrations are presented for each angle: a drawing and a picture of a real world object
each type of angle is represented
+ Drawings are labeled and photos of real world objects are labeled with the correct vocabulary

Page18
Project#12Domain: Geometry
Standard G.7: Draw, construct, and describe geometrical figures and describe the relationships between them
and solve real‐life and mathematical problems involving angle measure, area, surface area, and volume.
Directions:
1. Using different colored sheets of construction paper and a ruler, draw 6 congruent triangles.
*Remember, two triangles (polygons) are congruent if all pairs of corresponding sides are congruent, and all
pairs of corresponding angles are congruent.
Example of two congruent triangles:
2. Label each triangle with a different number (#1, #2, #3, etc.).
3. Cut each of your numbered congruent triangles out of construction paper.
4. Glue “Triangle #1” on a piece of poster board just as it is. This will serve as your template or model triangle.
5. Next, take triangles #2 & #3. Using your ruler, divide each of them into two sets congruent triangles. Use a
compass to make sure your angles and length of sides are congruent on triangle #2 and #3. Label another
part of your poster board, “Triangle #2” and “Triangle #3”. Paste your new congruent triangles for each under
the appropriate label. See the following page for an example.
6. Deconstruct your three remaining triangles (#s 4, 5, & 6), to create a variety of different polygons. You are
free to cut them into as many shapes as you want, but should paste them on the poster board to show that
they can be reconstructed to form a triangle congruent to the rest of your triangles. Paste your polygons for
triangles 4, 5, & 6 on your poster board, labeling each.
*See next page for an example of a completed poster board.
Page19
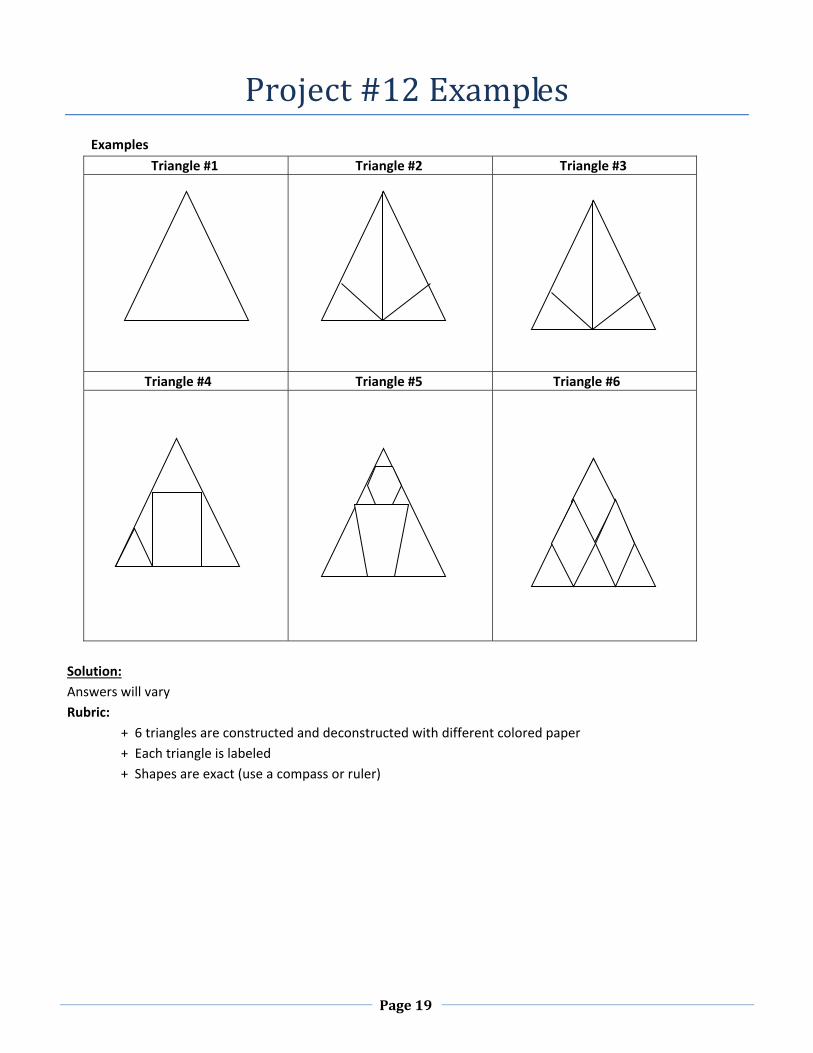
Project#12ExamplesExamples
Triangle #1 Triangle #2 Triangle #3
Triangle #4 Triangle #5 Triangle #6
Solution:
Answers will vary
Rubric:
+ 6 triangles are constructed and deconstructed with different colored paper
+ Each triangle is labeled
+ Shapes are exact (use a compass or ruler)
Page20
Project#13Domain: Geometry
Standard G.7: Solve real‐life and mathematical problems involving angle measure, area, surface area, and
volume.
Directions:
1. Get a tape measure or ruler, or make your own tape measure using paper taped together with accurate
measurements denoted on the paper created using a ruler. *Use inches for the following problems.
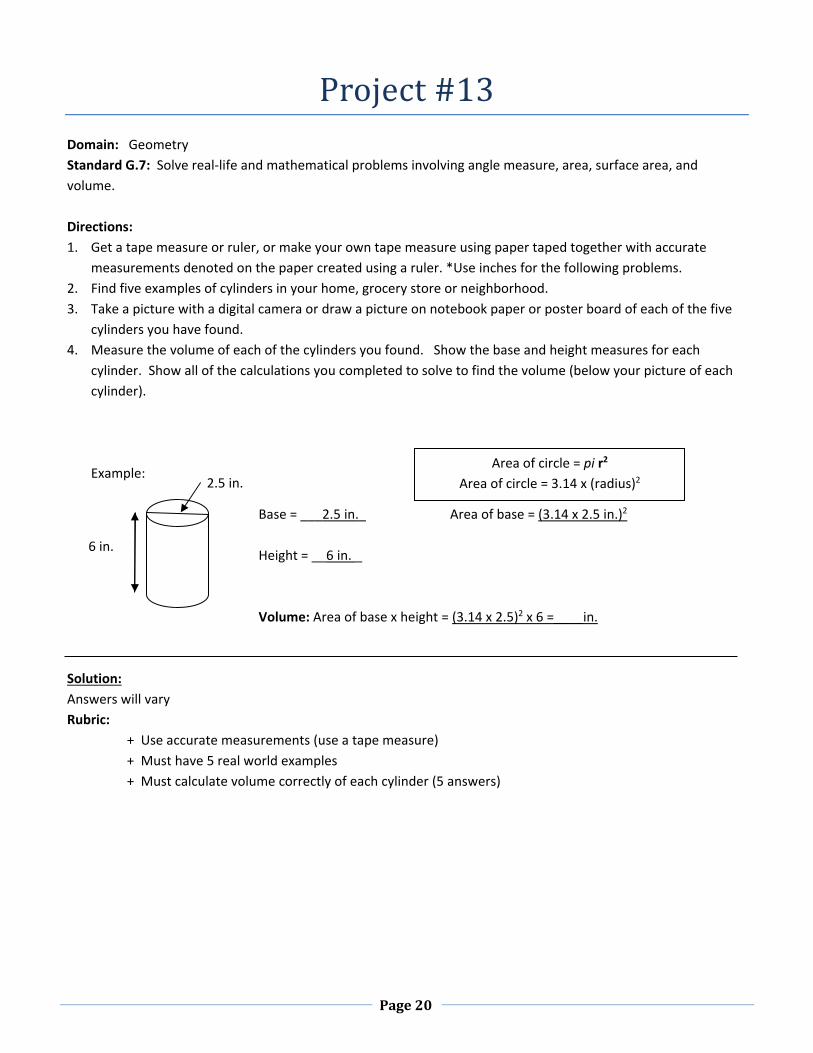
2. Find five examples of cylinders in your home, grocery store or neighborhood.
3. Take a picture with a digital camera or draw a picture on notebook paper or poster board of each of the five
cylinders you have found.
4. Measure the volume of each of the cylinders you found. Show the base and height measures for each
cylinder. Show all of the calculations you completed to solve to find the volume (below your picture of each
cylinder).
Example:
Base = ___2.5 in._ Area of base = (3.14 x 2.5 in.)2
Height = __6 in. _
Volume: Area of base x height = (3.14 x 2.5)2 x 6 =____in.
Solution:
Answers will vary
Rubric:
+ Use accurate measurements (use a tape measure)
+ Must have 5 real world examples
+ Must calculate volume correctly of each cylinder (5 answers)
6 in.
2.5 in.
Area of circle = pi r2
Area of circle = 3.14 x (radius)2

Page21
Project#14
Domain: Geometry Standard G.7: Solve real‐life and mathematical problems involving angle measure, area, surface area, and volume. Directions: Part 1: 1. Read the problem below then study the scale drawing.
Kiera showed her best friend a scale drawing of a new game room her father is going to build for her and her brothers and sisters.
2. Solve: If each 2 cm on the scale drawing equals 5 ft, what are the actual dimensions of Kiera’s room? 3. How much carpet needs to be purchased to cover the entire floor?
Solution: Multistep Problem Step 1: If 2 cm = 5 feet, then what is 1 cm = 2.5 feet Step 2: Multiply all the cm by 2.5 to convert to feet Step 3: Label all the sides with feet. (These are the actual dimensions) 3ft Think Aloud 10 ft 11 ft Step 4: Find area of the big square 10 x 11 = 110 sq feet Step5: Find area of little square 3 x 3 = 9 sq. ft Step 6: Add the two areas together for the area of Kiera’s room. This is how much carpet needs to be purchased. 110 + 9 = 119 sq. ft
This is a multistep problem
because first I need to change
all the cm measurements to
feet.
3 ft
14 ft
7 ft

Page22
Part 2: 1. Design your own game room using Kiera’s scale drawing as an example. 2. Using graph paper, determine the scale and be sure to write it in the top right corner of your paper. Example:
(1 cm = 3 ft). 3. Then, create a scale drawing of the game room you have designed. Include game areas, furniture, and more
to give the best visual representation possible. 4. Calculate the area of the floor that is showing versus the area of the floor under the furniture.
*Be sure to use a ruler to create straight lines and accurate measures.
Solution:
Answers will vary
Rubric:
+ Use a scale (the size graph paper cm or inch) to equal ft or meters or yards
+ Make accurate drawing
+ Find the area with and without the obstacles (furniture etc.)
+ Show your calculations for both.
Page23
Project#15Domain: Statistics & Probability
Standard SP.7: Investigate chance processes and develop, use, and evaluate probability models.
SP.7.1: Understand that statistics can be used to gain information about a population by
examining a sample of the population; generalizations about a population from a sample
are valid only if the sample is representative of that population. Understand that random
sampling tends to produce representative samples and support valid inferences.
Directions:
Read the following problem:
Members of the seventh grade math group have nominated a member of their group to be class president. Every
student in seventh grade will cast a vote. There are 2 candidates in the race and a candidate needs at least 50% of
the votes to be elected. The math group wants to conduct an opinion poll to assess their candidate’s prospects.
There are almost 500 students in the seventh grade at their school. They do not have the resources to interview
all seventh graders so they have decided to interview a sample of 40 seventh graders. They will obtain the seventh
grade list of names from their school principal’s office and select the sample from this list. They plan to ask each
student in the sample whether they plan to vote for their candidate or the other candidate.
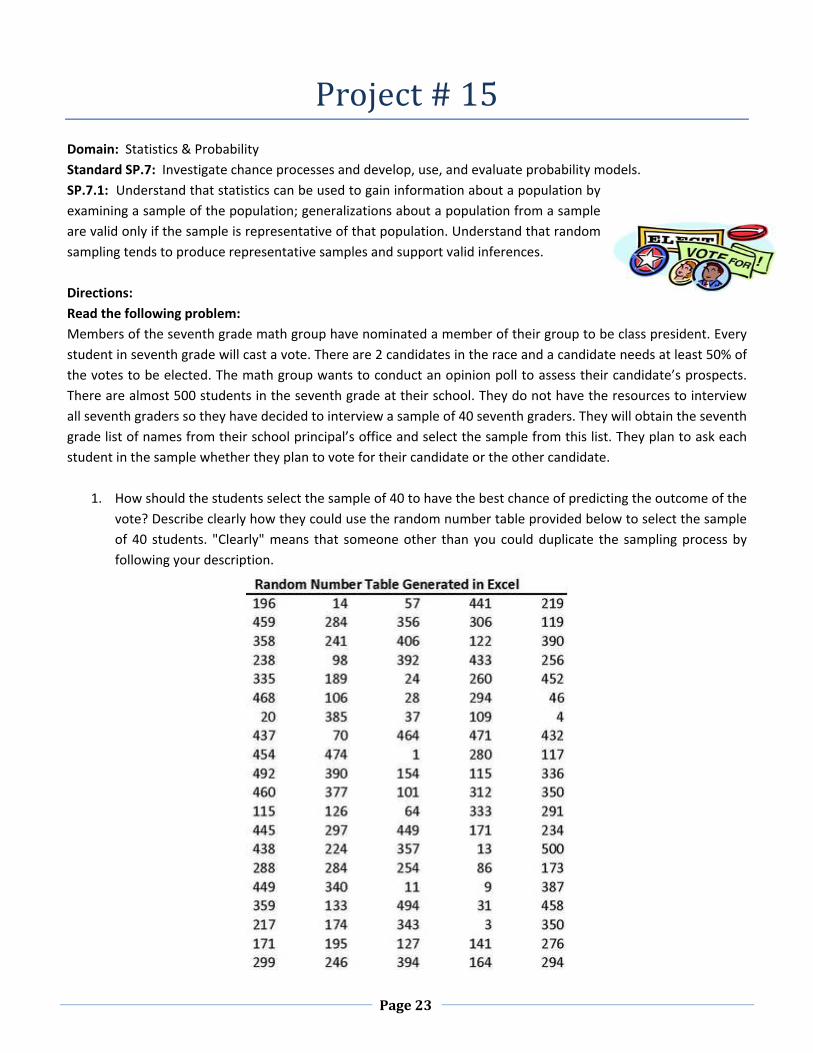
1. How should the students select the sample of 40 to have the best chance of predicting the outcome of the
vote? Describe clearly how they could use the random number table provided below to select the sample
of 40 students. "Clearly" means that someone other than you could duplicate the sampling process by
following your description.

Page24
Solution:
Step 1: First we need to specify the population
Step 2: Then observe if the result is reasonable.
Step 3: Draw conclusions based on the likelihood that
observed sample being “fair” enough to represent the total.
Think Aloud
1. The sample of 40 students should be selected randomly so that all groups of 40 students have an equal
chance of being selected. This is a fair way to do the sampling and, moreover, one that allows the
questions in part b to be answered. The randomization can be done by numbering the students and then
selecting 40 distinct random numbers over that range to be the sampled students.
2. Suppose that all 40 students selected from the list of seventh graders in the school respond to the survey,
and the results showed that 18 students would vote for the math group’s candidate. In order to get
elected, a candidate must receive at least 50% of the votes. Some members of the math group believe
that on the basis of this sample survey outcome it is unreasonable to think that their candidate can win.
Others in the group believe they should take another sample to check their initial results. Based on the
initial survey results, should the math group students be discouraged, or is it reasonable to think their
candidate might win? Justify your response statistically.
Solution:
Simulation provides a sound method for determining whether or not a sample proportion of 18/40 = 0.45 can
reasonably be obtained from a population with 50% (0.50) “successes.” One way to accomplish this is to randomly
sample 40 items, with replacement, from a group of items that have 50% marked as “success.” This can be done
mechanically by sampling from 5 red and 5 white chips in a bag, or electronically by sampling from a list of five 1’s
and five 0’s in a computer or graphing calculator. Each sample of 40 outcomes produces one simulated sample
proportion of “successes”; the process is then repeated many times to generate a distribution of sample
proportions.
Here is a simulation resulting in 100 sample proportions for samples of size 40 each. Notice that the observed
result of 0.45 is not very far out in the lower tail; this value or a smaller value occurs 30 times out of the 100 trials.
Thus, the students should not be discouraged; it is reasonable to think that 50% of the class might vote for their
candidate.
Standard 1 uses the term
“representative,” which we can
interpret as meaning fairness.

Page25
The plot below is the result for a similar simulation with 60% successes in the population. Here, the observed 0.45
is far out in the left tail, with only 3 of 100 trials being that small or smaller. Based on this survey result, it is not
reasonable to think that 60% of the students would vote for their candidate.

Page26
Project#16
Domain: Statistics & Probability
Standard SP7: Use random sampling to draw inferences about a population.
Directions:
Look at the following data set. It represents the height in centimeters of a group of students: Student Height in cm
Tim 145 Liz 136 Latoya 154 Paloma 178 Sean 173 Juan 164 Andrea 144 Allie 170 Tyrone 183 Juanita 144
1. Answer the following questions based on the data set above. Solution:
What is the mode of the set? The mode is the number shown most often 144 is shown twice and all the other numbers are only shown once, so 144 is the mode What is the range of the set? To find the range, we subtract the smallest number from the largest number 183 – 136 = 47 Whose height is closest to the median height for the set? First we find out the median, by putting all the numbers in order and finding the number in the middle. Think Aloud
136, 144, 145, 154, 164, 170, 173, 178, 183 The number 164 is in the middle, so it is the median.
Whose height is closest to the mean height for the set? Juan’s height is at the median and Allie is the closest with 170 which is 6 cm away.
2. Create another survey and create a set of data. Analyze the data in the same way: find the mode, median, range and mean.
Solution: Answers will vary Rubric: + Must have at least 10 sets of data + Must find all the data results (mean, median, mode and range)
There are 10 numbers,
but 144 is listed twice,
so we only need to
order 9 numbers

Page27
Project#17Domain: Statistics and Probability
Standard SP.7: Use random sampling to draw inferences about a population.
Directions:
1. This is an open‐ended data project in which you get to be the designer. Your job is to design an experiment
based on a question you would like to find the answer to by collecting responses and data.
2. Start with your question, and then come up with a hypothesis based on what seems reasonable. *Your
hypothesis should reflect your background understanding and knowledge (and any research you have done
related to the question you are trying to answer.
3. Develop an organized means of collecting data.
4. Evaluate, analyze and display your data.
5. Then formulate a conclusion.
*Include each of the above steps in a short written report. Be sure to include your hypothesis,
background research, rationale for the experiment and any tables, graphs and charts you used to
collect, organize or display your data, results and analysis.
Solution:
Answers will vary
Rubric:
+ Must have
1 Question (problem)
2 Rationale (purpose)
3 Background research on your topic
4 Hypothesis
5 Chart or Graph reflecting how data was collected
6 Results
7 Conclusion (analysis)
Page28
Project#18
Domain: Expressions and Equations
Standard EE.7: Solve real‐life and mathematical problems using numerical and algebraic expressions and
equations.
You have tried many ways to solve problems throughout this Math Challenge Packet. Already you know that when
one strategy does not lead you to a solution, you back up and try something else. Sometimes you can find a
smaller problem inside the larger one that must be solved first. Sometimes you need to think about the
information that is missing rather than what is there. Sometimes you need to read the problem again and look for
a different point of view. Sometimes you need to tell your brain to try to think about the problem in an entirely
different way – perhaps a way you have never used before. Looking for different ways to solve problems is like
brainstorming. Try to solve this problem. You may need to change your point of view.
Directions:
Fishing Adventures rents small fishing boats to tourists for day‐long fishing trips. Each boat can only carry 1200
pounds of people and gear for safety reasons. Assume the average weight of a person is 150 pounds. Each group
will require 200 lbs of gear for the boat plus 10 lbs of gear for each person.
1. Create an inequality describing the restrictions on the number of people possible in a rented boat. Graph
the solution set.
Question #1
Solution I: Using an equation
Let p be the number of people in a group that wishes to rent a boat. Then 150p represents the total weight of the
people in the boat, in pounds. Also, 10p represents the weight of the gear that is needed for each person on the
boat. So the total weight in the boat that is contributed solely by the people is
150p+10p=160p
Because each group requires 200 pounds of gear regardless of how many people there are, we add this to the
above amount. We also know that the total weight cannot exceed 1200 pounds. So we arrive at the following
inequality:
160p+200<1200
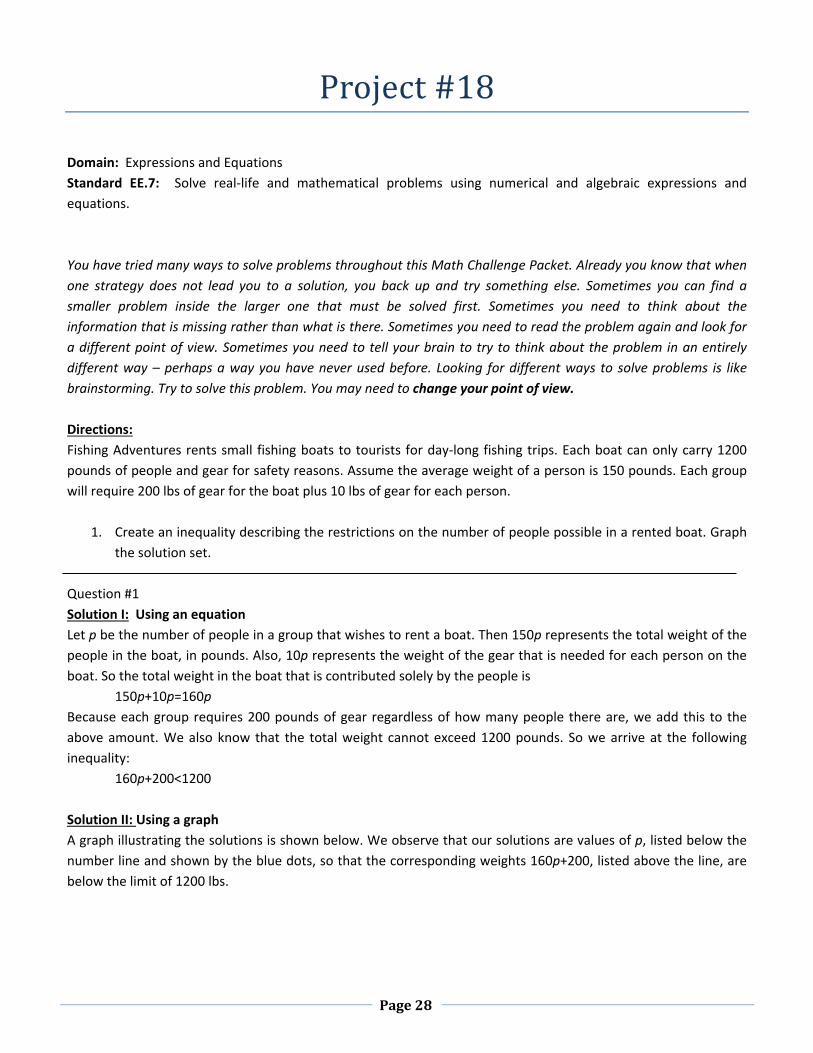
Solution II: Using a graph
A graph illustrating the solutions is shown below. We observe that our solutions are values of p, listed below the
number line and shown by the blue dots, so that the corresponding weights 160p+200, listed above the line, are
below the limit of 1200 lbs.

Page29
Question #2
2 Several groups of people wish to rent a boat. Group 1 has 4 people. Group 2 has 5 people. Group 3 has 8
people. Which of the groups, if any, can safely rent a boat? What is the maximum number of people that may
rent a boat?
Solution:
We can find out which of the groups, if any, can safely rent a boat by substituting the number of people in each
group for p in our inequality. We see that
For Group 1:160(4)+200=840<1200
For Group 2:160(5)+200=1000<1200
For Group 3:160(8)+200=1480/<1200
We find that both Group 1 and Group 2 can safely rent a boat, but that Group 3 exceeds the weight limit, and so
cannot rent a boat.
To find the maximum number of people that may rent a boat, we solve our inequality for p:
160p+200<1200
160p<100
p<6.25
As we cannot have .25 person, we see that 6 is the largest number of people that may rent a boat at once. This
also matches our graph; since only integer values of p make sense, 6 is the largest value of p whose corresponding
weight value lies below the limit of 1200 lbs.

Page30
ExtensionsThe following projects are based on standards you will learn in eighth grade. They should be challenging for you
at this point. Try them out and save your work along the way.
Project#19Strand: Number System Standard: NS.8: Work with radicals and integer exponents.
Directions:
1. Write out the following in words. For example, 1026 would be ten to the twenty‐sixth power.
Solution
1026 = ten to the twenty‐sixth power
‐2,900 = negative two thousand nine hundred
8.616 = Eight and Six Hundred Sixteen Thousandths
8 x 103 = Eight times ten to the third power
⅗ = Three Fifths
7:3 = Ratio of Seven to Three
23 ⅛ = Twenty three and one‐eighth
85% = Eighty five percent
0.006 = Six Thousandths
7,000,000,000 = Seven Billion
2. Solve the problem below.
The evil ruler, Gonglo has locked the beautiful, intelligent Princess Alexa in a loft high up in the castle. To be released, she must find the first perfect square number greater than 100 whose digits do not sum to a perfect square! Can you help her find the number?
Solution:
The perfect square number that is greater than 100 but whose digits do not add to a perfect square is 256. When
you add 2 + 5 + 6 = you get 13, which is not a perfect square.
3. Create a challenge problem of your own using the formula for finding a perfect square.
Solution:
Answers will vary
Rubric:
+ Must be about a perfect square
+ Could also include square root.

Page31
Project#20Domain: Functions
Standard F.8: Use functions to model relationships between quantities.
Directions:
1. Use the information below to answer the riddle. Amy, Connor, Jalia, Stella and Gonzo live in apartments A, B, C, D, and E in the same building. Their ages are 9, 10, 11, 13, and 14. They each get up at a different time each morning, either 6:00, 7:00, 7:30, 8:00, or 8:15. Using the clues below, determine the apartment, age and rising time for each student.
• Connor gets up at 6:00 and is older than the student in Apt. B. • Amy is 11 and gets up two hours later than the boy in Apt. A. • The ten‐year old girl lives in Apt. B and it isn't Stella. • The youngest student, a girl, doesn't live in Apt. E. • The person in Apt. B gets up later than everyone else. • Gonzo is younger than Connor and he lives in Apt. D. • The shades go up at 7:30 in Apt. C.
Solution: Guess and Check Strategy and Process of Elimination
1) Fill in the chart with the given information. a) Ages, Apt and times: Stella can’t be 10 b) Identify the girls: Stella, Amy, Jalia (so one of these can live in Apt. B) Amy is not the youngest (she is 11 and so she doesn’t live in Apt. E) c) Match other clues together: Apt. B goes with 8:15 (latest time) Apt. C gets up at 7:30 b) Now fill in the answers to which these clues are tied.
Name Apartment Age Time
Amy F 11 8:00
Connor A 14 6:00
Jalia B 10 8:15
Stella C 9 7:30
Gonzo D 13 7:00
2. Create your own riddle for a friend to solve.
Solution:
Answers will vary
Rubric:
+ Try to link clues
+ Have more than two variables