Embed Size (px)
Citation preview

Program Information: Montgomery County, Maryland Program Title: A GIS Platform for Emergency Management and Response:
Common Operational Pictures (COP) Program Category: # 14, Information Technology
1. Abstract
The Montgomery County, Maryland, Department of Technology Services - Geographic Information Systems (DTS-GIS) team developed an ArcGIS Server based map viewer that provides customized common operational pictures (COP) for enabling situational awareness associated with emergency management and planning. These web applications allow emergency managers to manage the assets, effectively share and manage mobile workforces, maintain operational awareness and foster communication across organizations.
2. The Problem / Need for the Program
Effective emergency management involves four key phases
mitigation, preparedness, response and recovery. Montgomery County s Emergency Operations Center (EOC) currently employs WebEOC for posting incident (real or exercise) related information and coordinating the emergency responses with other EOC s in the national capital region (NCR). However, the much needed map display capability is absent in the system. This hampers the emergency managers ability to quickly and effectively design and execute responses.
Prior efforts (such as Towson Center for GIS s EMMA and MEGIN) on developing mapping components for the emergency management application did not bring about much advances due partly to the quick advance of ESRI s web mapping to a newer (ArcGIS Server) platform and the dwindling funding sources for such endeavors.
A common operational picture (COP) can be described as a single display of relevant operational information that is shared by more than one level of command and facilitates collaborative planning. It pulls together a variety of data sources into a single dashboard to reveal patterns and trends in data that enable users to make critical business decisions.
A customized COP to support local emergency operations is much needed and will help public safety professionals easily communicate and justify response plans during emergency situations. It will answer critical emergency management questions such as:
What is the current traffic flow and camera view? How can I view my field observations through this dashboard? What incidents are occurring and where, how many people are affected and % of age group? How does each affect critical infrastructure? Where are my public safety resources? What is the current weather?
3. Description of the Program
2
A few COP applications have sprung up in the nation, including the VIPER (Virginia Interoperability Picture for Emergency Response). This recent wave of map viewers for emergency responses are all based on ESRI GIS technology. Specifically, they were based on the ArcGIS platform and the Adobe Flex graphics user interface.
Montgomery County s version of COP enhances situational awareness so that users can perform daily operations more effectively, coordinate response efforts and make mission-critical decisions. The system was built using ArcGIS 9.3, including ArcGIS Server and ArcGIS Desktop software. It leverages ArcGIS Server and ESRI s Sample Flex Viewer to provide relevant incident information, base maps, and operational layers from various sources so that incident status information is immediately available when users are conducting emergency response operations. The application provides base maps, navigations, analytical tools and operational live feeds (like weather and traffic).
Currently, the system consists of five major function groups
Map, Navigation, Tools, Local Map Layers, and Help.
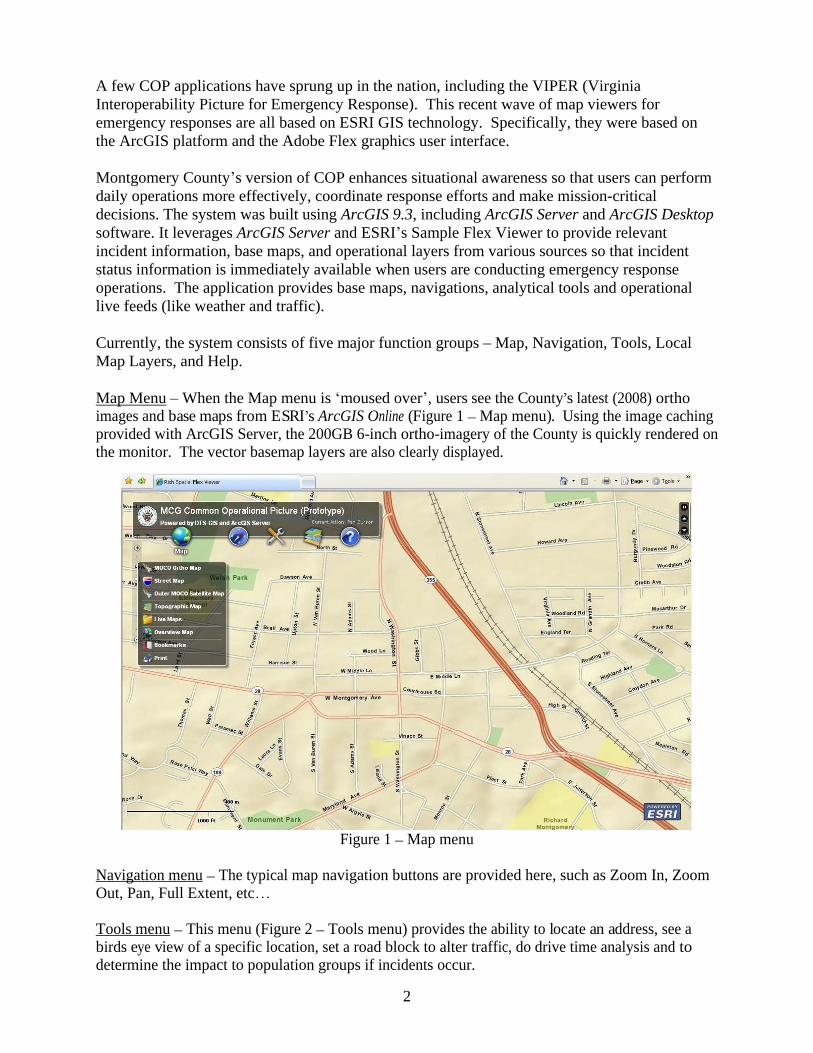
Map Menu
When the Map menu is moused over , users see the County s latest (2008) ortho images and base maps from ESRI s ArcGIS Online (Figure 1
Map menu). Using the image caching provided with ArcGIS Server, the 200GB 6-inch ortho-imagery of the County is quickly rendered on the monitor. The vector basemap layers are also clearly displayed.
Figure 1
Map menu
Navigation menu
The typical map navigation buttons are provided here, such as Zoom In, Zoom Out, Pan, Full Extent, etc
Tools menu
This menu (Figure 2
Tools menu) provides the ability to locate an address, see a birds eye view of a specific location, set a road block to alter traffic, do drive time analysis and to determine the impact to population groups if incidents occur.

3
Figure 2
Tools menu
Local Map Layers menu
- This menu (Figure 3
Local Map Layers) provides a wealth of local GIS data layers relevant for emergency managers. Data currently available includes Police facilities, fire stations, hospitals, high school locations, live traffic cameras, swimming pools (for fire-fighting or decontamination), senior centers, parking facilities, METRO stations, MARC train stations, Health and Human Services facilities, and fire stations within neighboring jurisdictions.

4
Local map layer
fire stations
Local map layer - hospitals
Local map layer
high school locations
Local map Layers
police facilities, fire stations, and hospitals
Figure 3
Local Map Layers
The lower right image of the above map shows police, fire, and hospital facility locations. Specific information about a moused over facility appears automatically.
Incorporating Operational Data and Live Feeds
- The power of this newer generation map viewer is the easiness to fetch live links of operational data from the Web and make them available in the single consolidated map viewer. This capability makes the concept of common operational pictures a reality. For example, users can quickly turn on the operational data layer of county s 193 traffic cameras that are posted by the Transportation Management Center (TMC) and view real time traffic for a specific intersection and its vicinity (Figure 4
Traffic Cameras).

5
Figure 4
Traffic Cameras
Figure 5 below (Video Feed) is TMC s map showing the locations of the 193 traffic cameras throughout the County. The right-hand image is a video feed of the real time traffic at the intersection of Maryland Route 28 (Jefferson Street) and Route 355 (Rockville Pike) as seen from the traffic camera mounted on the roof of the Executive Office Building on Monroe Street. The camera can be remotely controlled by staff at the TMC to view specific spots in the vicinity of the building.
Figure 5
Video Feed
6
Additional real time data that are important to EOC operations can be obtained on the web. This includes, for example, NOAA weather data or WeatherBug feeds (with proper licensing arrangement) for the local areas.
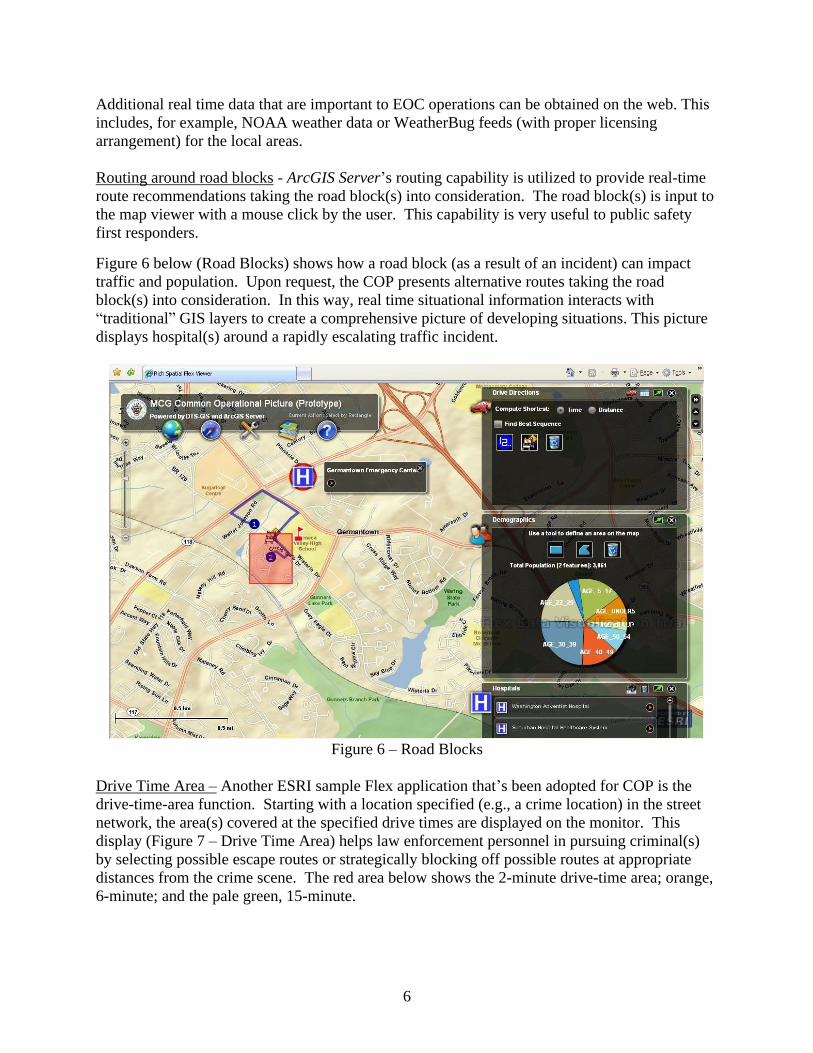
Routing around road blocks
- ArcGIS Server s routing capability is utilized to provide real-time
route recommendations taking the road block(s) into consideration. The road block(s) is input to the map viewer with a mouse click by the user. This capability is very useful to public safety first responders.
Figure 6 below (Road Blocks) shows how a road block (as a result of an incident) can impact traffic and population. Upon request, the COP presents alternative routes taking the road block(s) into consideration. In this way, real time situational information interacts with traditional GIS layers to create a comprehensive picture of developing situations. This picture
displays hospital(s) around a rapidly escalating traffic incident.
Figure 6
Road Blocks
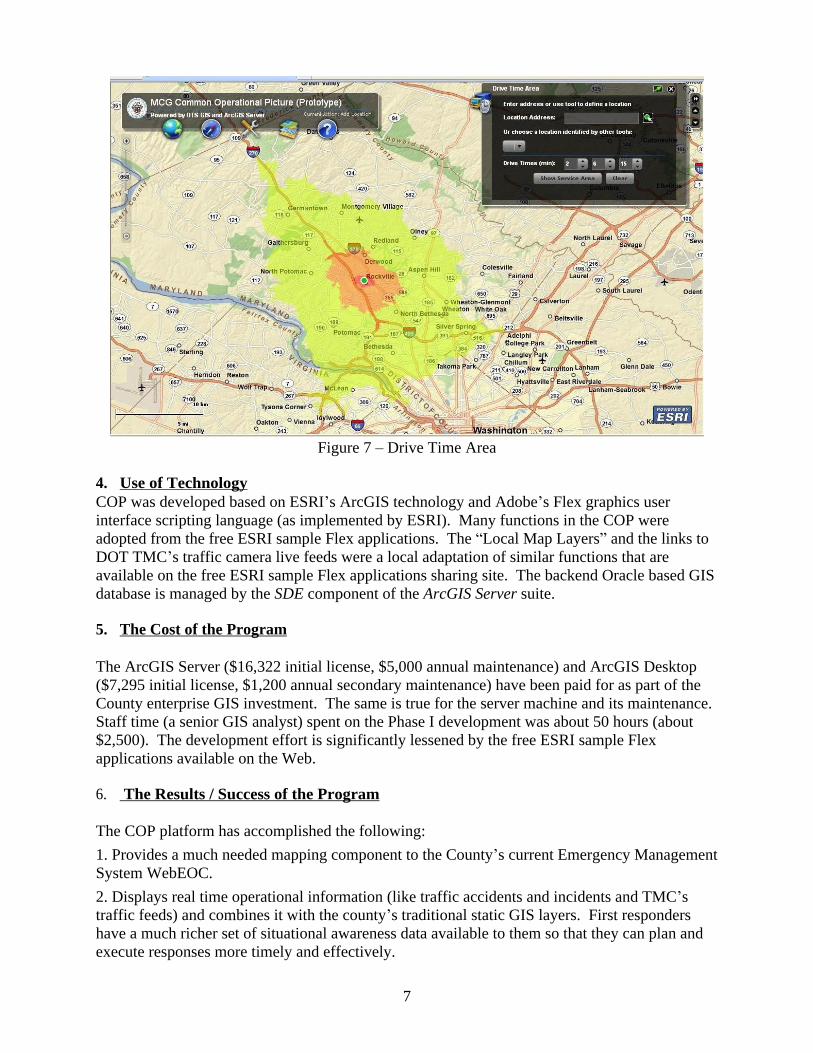
Drive Time Area
Another ESRI sample Flex application that s been adopted for COP is the drive-time-area function. Starting with a location specified (e.g., a crime location) in the street network, the area(s) covered at the specified drive times are displayed on the monitor. This display (Figure 7
Drive Time Area) helps law enforcement personnel in pursuing criminal(s) by selecting possible escape routes or strategically blocking off possible routes at appropriate distances from the crime scene. The red area below shows the 2-minute drive-time area; orange, 6-minute; and the pale green, 15-minute.
7
Figure 7
Drive Time Area
4. Use of Technology
COP was developed based on ESRI s ArcGIS technology and Adobe s Flex graphics user interface scripting language (as implemented by ESRI). Many functions in the COP were adopted from the free ESRI sample Flex applications. The Local Map Layers and the links to DOT TMC s traffic camera live feeds were a local adaptation of similar functions that are available on the free ESRI sample Flex applications sharing site. The backend Oracle based GIS database is managed by the SDE component of the ArcGIS Server suite.
5. The Cost of the Program
The ArcGIS Server ($16,322 initial license, $5,000 annual maintenance) and ArcGIS Desktop ($7,295 initial license, $1,200 annual secondary maintenance) have been paid for as part of the County enterprise GIS investment. The same is true for the server machine and its maintenance. Staff time (a senior GIS analyst) spent on the Phase I development was about 50 hours (about $2,500). The development effort is significantly lessened by the free ESRI sample Flex applications available on the Web.
6. The Results / Success of the Program
The COP platform has accomplished the following:
1. Provides a much needed mapping component to the County s current Emergency Management System WebEOC.
2. Displays real time operational information (like traffic accidents and incidents and TMC s traffic feeds) and combines it with the county s traditional static GIS layers. First responders have a much richer set of situational awareness data available to them so that they can plan and execute responses more timely and effectively.

8
3. Enables a one touch configuration to support specific event responses (police, fire, and hazard). A version of COP has been configured for the County Fire/Rescue Service (MCFRS). MCFRS personnel are using COP for CAD response analysis and service improvement planning.
4. Utilizes XML, KML, and GeoRSS data formats to share services across multiple-platforms. This allows the COP data to be accessed by different viewers so long as such viewers can access such data formats.
7. Worthiness of an Award
COP is a quick, low cost development of a versatile map viewer that provides a rich set of base map layers and common operational pictures for County first responders. COP has enabled the County to quickly catch up with the ESRI ArcGIS Server based web mapping technology. The relatively easy configuration of the application will allow DTS-GIS to provide additional special purpose map viewers for various County Departments. The approach of design, code, test, deploy and enhance
the application should serve as a model for other jurisdictions wishing to plunge into the web map arena. The County s success with utilizing free ESRI components
may encourage other jurisdictions to take the steps required to enhance their own emergency management capabilities.