Embed Size (px)
Citation preview
ImageCLEF 2018: Lesion-based TB-descriptorfor CT Image Analysis
Vitali Liauchuk1, Aleh Tarasau2, Eduard Snezhko1, and Vassili Kovalev1
1 United Institute of Informatics Problems, Minsk, [email protected]
2 Scientific and Practical Center for Pulmonology and Tuberculosis, Minsk, Belarus
Abstract. The paper presents image description and classification methodwhich was used by United Institute of Informatics Problems (UIIP BioMed)group for accomplishing the three subtasks of ImageCLEFtuberculosistask. The image description method employed is based on automateddetection of tuberculosis (TB) lesions of different types in 3D lung Com-puted Tomography (CT) scans. The lesion detection method is based onCoder-Decoder Convolutional Neural Network trained on a third-partydataset of 149 CT scans with lesions labeled by a qualified radiologist.It was shown that combination of lesion-based TB-descriptor and Ran-dom Forests classifier allows achieving the best performance in TB typeclassification and TB severity scoring subtasks.
Keywords: tuberculosis, TB-descriptor, lesions, CT, image analysis
1 Introduction
The tuberculosis task [3] of ImageCLEF 2018 Challenge [5] considers three sub-tasks all dealing with 3D CT images. The subtask #1 is dedicated to the problemof single image-based distinguishing between multi-drug resistant tuberculosis(MDR TB) cases and drug sensitive (DS) ones. The task remains very chal-lenging and so far has no solution with sufficient prediction accuracy. Recentanalysis of published evidences reports presence of statistically significant linksbetween drug resistance and multiple thick-walled caverns [12]. So far comput-erized methods demonstrate performance of image-based detection of MDR TBbarely beyond the level of statistical significance [4, 8, 9]. Compared to 2017data [2], datasets for MDR detection subtask were extended by means of addingseveral cases with extensively drug-resistant tuberculosis (XDR TB), which isa rare and more severe subtype of MDR TB. Thus, training data for the MDRdetection subtask included 259 CT images: 134 drug sensitive and 125 drug re-sistant cases. Test set consisted of 236 CT images: 101 drug sensitive and 135drug resistant cases.
The subtask #2 of ImageCLEFtuberculosis task is aimed at automatic cate-gorization of CT images into one of five types of tuberculosis: Infiltrative, Focal,Tuberculoma, Miliary and Fibro-cavernous. Compared to 2017, the datasets wereextended by adding new CT scans of the patients involved earlier, and also by

introducing CT images of some new patients. However, in this study only thefirst CT scan of each patient was used.
The newly represented subtask #3 was dedicated to assessment of severity ofTB based on a single CT image of a patient. The severity score has meaning of acumulative score of severity of TB case assigned by a medical doctor. Originally,the severity scores were assigned using natural numbers between 1 (”critical/verybad”) and 5 (”very good”). Additionally, for the case of binary classification thescores were converted to binary values where scores from 1 to 3 corresponded to”high severity” and the remaining 4 and 5 corresponded to ”low severity”. In theprocess of scoring, the medical doctors considered many factors like patterns oflung lesions, results of microbiological tests, duration of treatment, patient’s ageand some other. One of the goals of this subtask is to distinguish ”low severity”from ”high severity” based solely on the CT scan.
2 Detection of lung lesions in CT, TB-descriptor
In this section, a method for automated detection of lung lesions in 3D CT imagesis described. The method is based on training the Deep Convolutional NeuralNetwork (CNN) on a set of data derived from 3D CT images with manuallylabeled lesions of different types. The method utilizes slice-wise image segmen-tation technique previously described in [6]. This technique considers splittingthe original 3D image into a number of smaller 2D regions, processing the re-gions one-by-one and collecting the CNN output into a 3D probability map (seeFig. 1). Finally, a quantitative TB-descriptor is built based on the lesion proba-bility maps.
Fig. 1. General scheme of the slice-wise lesion segmentation method

2.1 Data preparation
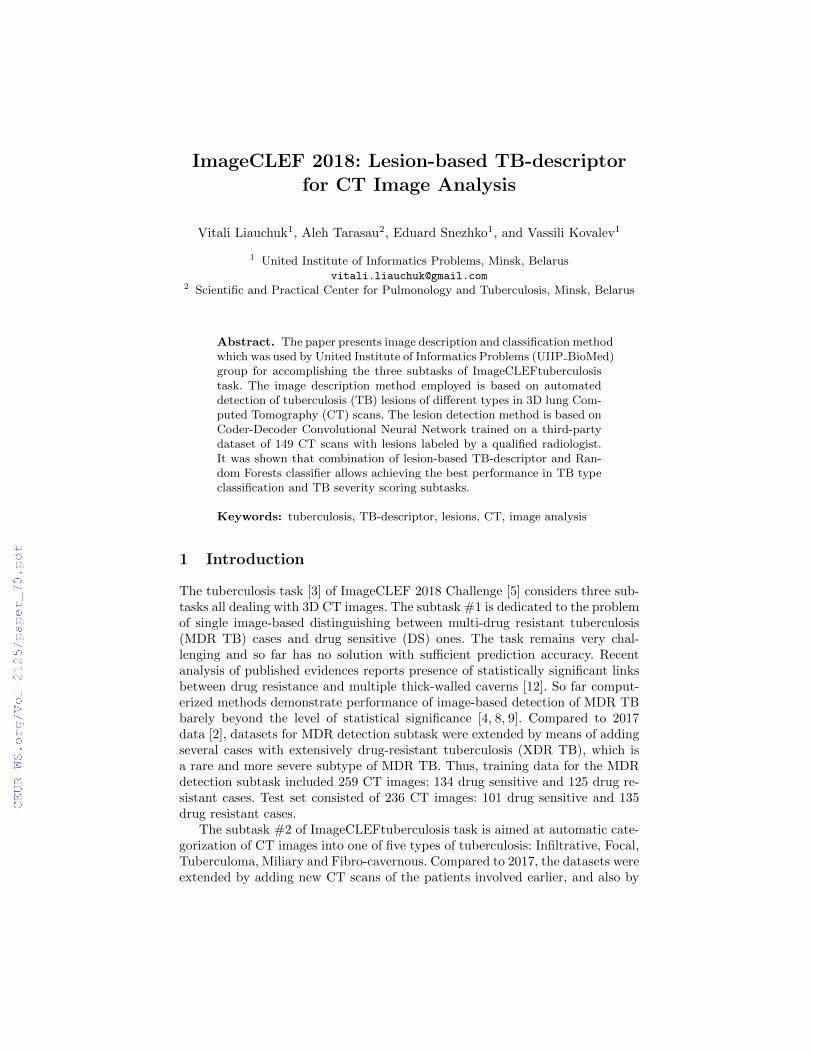
TB lesions were labeled manually on a total number of 198 3D CT scans. Thelabeling was performed in two stages. The first stage was performed by a qualifiedradiologist and was aimed at coarse localization of TB lesions of different type inlungs without the exact delineation. The second stage was aimed at correctionof initial lesion labeling and making more precise segmentation of lesions (seeFig. 2). Both stages of labeling were performed using an auxiliary software tooldesigned by the authors (see Fig. 3).
Fig. 2. Labeling stages, axial slices (top) and frontal projections (bottom):a) initial stage, rough labeling; b) second stage, more precise segmentation of lesions
The developed software tool allows labeling of 10 different types of TB le-sions. Some types of lesions were well represented in the dataset whilst lesionsof some other types (Plevritis, Atelectasis, Pneumathorax) were present only infew images in the dataset. List of lesion types and the corresponding frequenciesof occurrence in dataset images are shown in Table 1. In the result of labelingprocess, 3D masks with the corresponding lesion indexes were obtained.
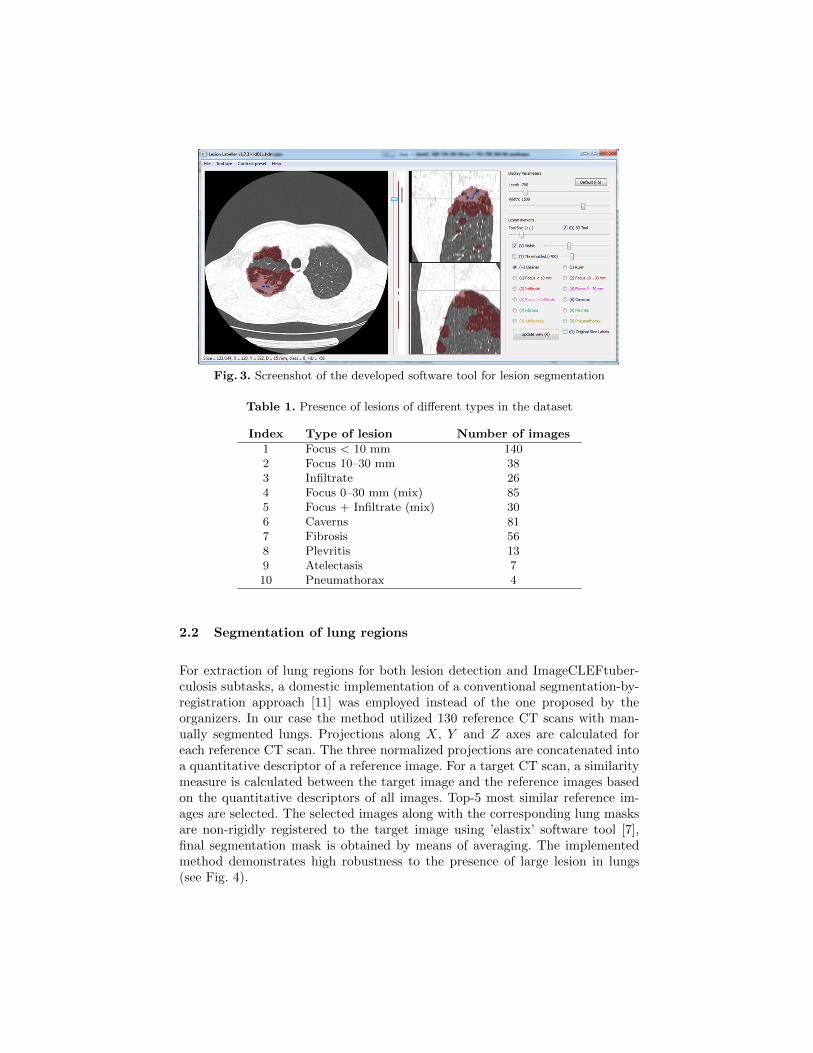
Fig. 3. Screenshot of the developed software tool for lesion segmentation
Table 1. Presence of lesions of different types in the dataset
Index Type of lesion Number of images
1 Focus < 10 mm 1402 Focus 10–30 mm 383 Infiltrate 264 Focus 0–30 mm (mix) 855 Focus + Infiltrate (mix) 306 Caverns 817 Fibrosis 568 Plevritis 139 Atelectasis 710 Pneumathorax 4
2.2 Segmentation of lung regions
For extraction of lung regions for both lesion detection and ImageCLEFtuber-culosis subtasks, a domestic implementation of a conventional segmentation-by-registration approach [11] was employed instead of the one proposed by theorganizers. In our case the method utilized 130 reference CT scans with man-ually segmented lungs. Projections along X, Y and Z axes are calculated foreach reference CT scan. The three normalized projections are concatenated intoa quantitative descriptor of a reference image. For a target CT scan, a similaritymeasure is calculated between the target image and the reference images basedon the quantitative descriptors of all images. Top-5 most similar reference im-ages are selected. The selected images along with the corresponding lung masksare non-rigidly registered to the target image using ’elastix’ software tool [7],final segmentation mask is obtained by means of averaging. The implementedmethod demonstrates high robustness to the presence of large lesion in lungs(see Fig. 4).

Fig. 4. Example slices of CT images with segmented lungs
2.3 Training the Convolutional Neural Network
One of the possible ways to employ Deep Learning algorithms for 3D image isto operate at slice level by representing each 3D CT image as a set of 2D slices.One of the advantages of such approach is relatively low usage of computermemory since the large 3D is processed slice-by-slice. In the current study, 2Dimage regions of size 128×128 pixels were extracted from slices of original CTimages with 64-pixels stride. Three neighboring slices were used to compose asingle RGB image in order to use spatial information along Z-axis of original CTimages. Finally, the image regions were up-sized using bicubic interpolation to256×256 pixels. The up-sizing was performed to improve the detection of smalllesions since the first convolutional layer of the network used which is AlexNethas 4-pixel stride, and some lesions present on the images have size of 2–3 pixels.
From the total amount of 198 labeled 3D scans, 149 were used for training thealgorithms and the rest 49 were used for validation. Lesion types with indexes1–5 were merged together into one class ”Foci” as having similar nature and/orbeing mixture of classes. From the 149 training CT images, 268,278 2D imagetiles were extracted. For each tile a corresponding label image was composedusing manually labeled lesion data (see Fig. 5). Image regions which lay beyondthe lung segmentation masks are marked with a special ”don’t care” label. Neuralnetwork omits these regions at both training and validation stages which allowsto better focus the available computational facilities on the actual regions ofinterest. On the label images such regions are marked with gray color.
For segmentation of lesions in 2D slice regions a Fully Convolutional Net-work Alexnet [10] was used. In order to increase convergence rate and overallaccuracy, a publicly available ILSVRC2012-trained model was used to initializethe networks weights. The net was set to recognize multiple lesion types at thesame time.
Fig. 5. Examples of 2D slice regions (top row) and the corresponding label images(bottom row)
Training was performed on a personal computer equipped with Intel i7-6700KCPU and dedicated GPU of Nvidia TITAN X type with 3072 CUDA Coresand 12 GB of GDDR5 onboard memory. NVIDIA DIGITS interface and Caffeeframework were used. The network training parameters were set to the followingvalues: Number of epochs=60, Activation function=ReLu, Batch size=64, Solvertype=SGD Caffe solver. Learning Rate was set to 0.001 for the first 20 epochs,0.0001 for the next 20 and 0.00001 for the last 20 ones.
2.4 Obtaining probability maps
Once the training process is finished, the trained network model can be usedfor detection of lesions in an arbitrary 3D CT scan. In this case the CT imageundergoes the same procedures as for the training images:
– segmentation of lung regions;– extraction of 2D tiles;– processing the tiles with the trained CNN and obtaining probability maps
for each lesion type considered;– collecting the obtained 2D probability maps into 3D probability maps for
each lesion type separately;
Additionally, probability maps can be smoothed to reduce the number offalsely detected lesions in images, or thresholded so that all probability valuesbelow minimum allowed value are zeroed. Fig. 6 demonstrates the detected le-sions on test CT scans. Lesion regions were obtained from the correspondingprobability maps by means of thresholding with Pthres = 0.5. The resultant le-sion regions are marked with colors with correspondence to the colormap fromFig. 5.
2.5 Building TB-descriptor
Once the probability maps are built, the TB-descriptor proposed with this studyis built as follows. The lungs region on CT image is divided into 6 parts as it is

Fig. 6. Detected lesions on test CT images: frontal projections (top row) and axialslices (bottom row)
shown on Fig. 7. Height of the parts along Z axis is taken equal. For every typeof lesion its presence in each of six parts is calculated as the sum of probabilitiesin the corresponding voxels divided by the number of lung voxels within theconsidered part. Since all the probabilities are ranged from 0 to 1, the lesionpresence score for each part is also a number from 0 to 1. Finally, the presencescores obtained for each lesion type and each lung part are concatenated into asingle TB-descriptor of size Nlesion types ×Nparts.
Thus, the proposed TB-descriptor indicates presence of lesions of certaintypes in different parts of lungs: upper left, middle right, etc. Portion of theaffected lung volume is considered as well. Such TB-descriptor was used forrecognition of drug resistance status, type and severity of tuberculosis in theImageCLEF challenge subtasks.
3 Submissions and results
For all the ImageCLEFtuberculosis subtasks the following prediction scheme wasused:
– segmentation of lung regions for each CT image;
– detection of lesions;
– calculation of TB-descriptors for each image;
– prediction of the desired values using a valid classifier.
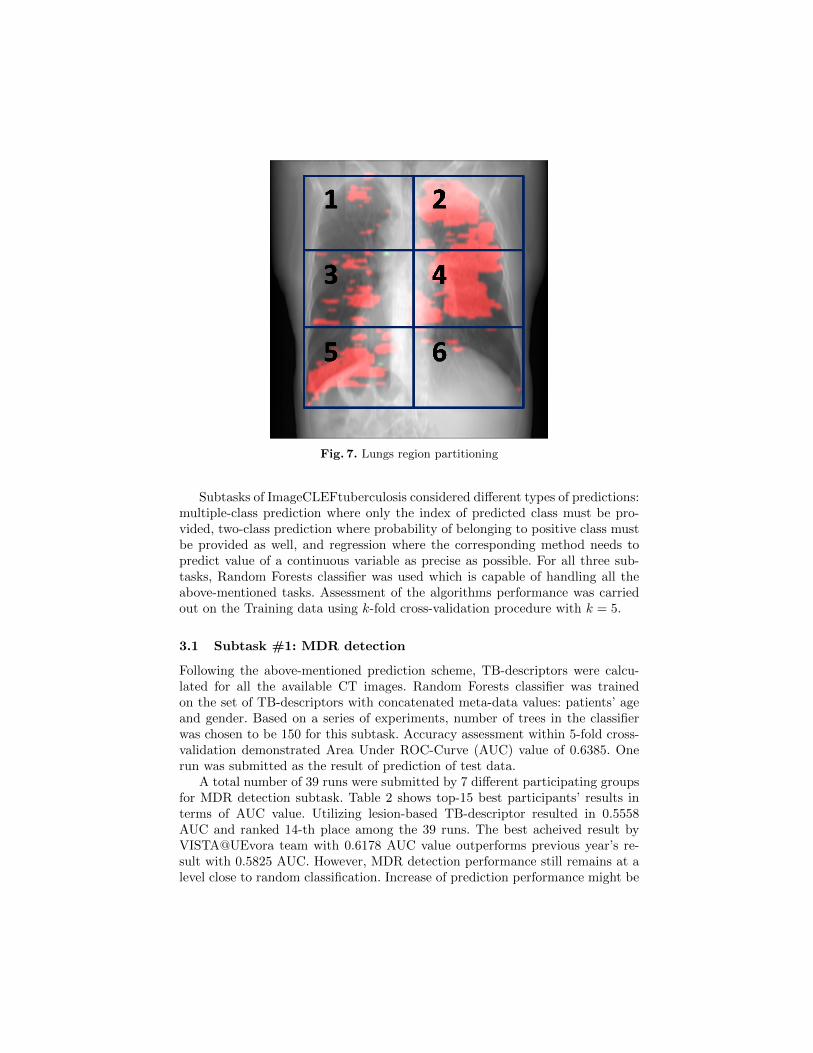
Fig. 7. Lungs region partitioning
Subtasks of ImageCLEFtuberculosis considered different types of predictions:multiple-class prediction where only the index of predicted class must be pro-vided, two-class prediction where probability of belonging to positive class mustbe provided as well, and regression where the corresponding method needs topredict value of a continuous variable as precise as possible. For all three sub-tasks, Random Forests classifier was used which is capable of handling all theabove-mentioned tasks. Assessment of the algorithms performance was carriedout on the Training data using k-fold cross-validation procedure with k = 5.
3.1 Subtask #1: MDR detection
Following the above-mentioned prediction scheme, TB-descriptors were calcu-lated for all the available CT images. Random Forests classifier was trainedon the set of TB-descriptors with concatenated meta-data values: patients’ ageand gender. Based on a series of experiments, number of trees in the classifierwas chosen to be 150 for this subtask. Accuracy assessment within 5-fold cross-validation demonstrated Area Under ROC-Curve (AUC) value of 0.6385. Onerun was submitted as the result of prediction of test data.
A total number of 39 runs were submitted by 7 different participating groupsfor MDR detection subtask. Table 2 shows top-15 best participants’ results interms of AUC value. Utilizing lesion-based TB-descriptor resulted in 0.5558AUC and ranked 14-th place among the 39 runs. The best acheived result byVISTA@UEvora team with 0.6178 AUC value outperforms previous year’s re-sult with 0.5825 AUC. However, MDR detection performance still remains at alevel close to random classification. Increase of prediction performance might be
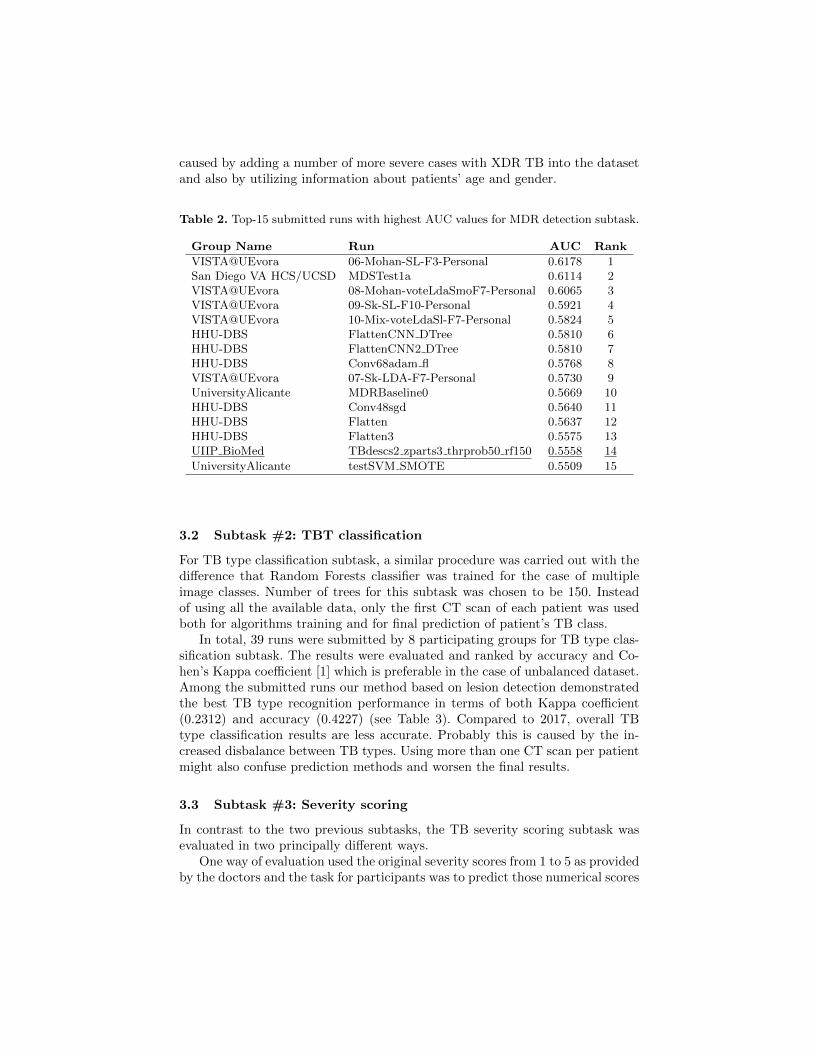
caused by adding a number of more severe cases with XDR TB into the datasetand also by utilizing information about patients’ age and gender.
Table 2. Top-15 submitted runs with highest AUC values for MDR detection subtask.
Group Name Run AUC Rank
VISTA@UEvora 06-Mohan-SL-F3-Personal 0.6178 1San Diego VA HCS/UCSD MDSTest1a 0.6114 2VISTA@UEvora 08-Mohan-voteLdaSmoF7-Personal 0.6065 3VISTA@UEvora 09-Sk-SL-F10-Personal 0.5921 4VISTA@UEvora 10-Mix-voteLdaSl-F7-Personal 0.5824 5HHU-DBS FlattenCNN DTree 0.5810 6HHU-DBS FlattenCNN2 DTree 0.5810 7HHU-DBS Conv68adam fl 0.5768 8VISTA@UEvora 07-Sk-LDA-F7-Personal 0.5730 9UniversityAlicante MDRBaseline0 0.5669 10HHU-DBS Conv48sgd 0.5640 11HHU-DBS Flatten 0.5637 12HHU-DBS Flatten3 0.5575 13UIIP BioMed TBdescs2 zparts3 thrprob50 rf150 0.5558 14
UniversityAlicante testSVM SMOTE 0.5509 15
3.2 Subtask #2: TBT classification
For TB type classification subtask, a similar procedure was carried out with thedifference that Random Forests classifier was trained for the case of multipleimage classes. Number of trees for this subtask was chosen to be 150. Insteadof using all the available data, only the first CT scan of each patient was usedboth for algorithms training and for final prediction of patient’s TB class.
In total, 39 runs were submitted by 8 participating groups for TB type clas-sification subtask. The results were evaluated and ranked by accuracy and Co-hen’s Kappa coefficient [1] which is preferable in the case of unbalanced dataset.Among the submitted runs our method based on lesion detection demonstratedthe best TB type recognition performance in terms of both Kappa coefficient(0.2312) and accuracy (0.4227) (see Table 3). Compared to 2017, overall TBtype classification results are less accurate. Probably this is caused by the in-creased disbalance between TB types. Using more than one CT scan per patientmight also confuse prediction methods and worsen the final results.
3.3 Subtask #3: Severity scoring
In contrast to the two previous subtasks, the TB severity scoring subtask wasevaluated in two principally different ways.
One way of evaluation used the original severity scores from 1 to 5 as providedby the doctors and the task for participants was to predict those numerical scores

Table 3. Top-15 submitted runs with highest Kappa values for TB type subtask.
Group Name Run Kappa Rank
UIIP BioMed TBdescs2 zparts3 thrprob50 rf150 0.2312 1
fau ml4cv m4 weighted 0.1736 2MedGIFT AllFeats std euclidean TST 0.1706 3MedGIFT Riesz AllCols euclidean TST 0.1674 4VISTA@UEvora 02-Mohan-RF-F20I1500S20-317 0.1664 5fau ml4cv m3 weighted 0.1655 6VISTA@UEvora 05-Mohan-RF-F20I2000S20 0.1621 7MedGIFT AllFeats AllCols correlation TST 0.1531 8MedGIFT AllFeats mean euclidean TST 0.1517 9MedGIFT Riesz std euclidean TST 0.1494 10San Diego VA HCS/UCSD Submission64a 0.1474 11San Diego VA HCS/UCSD TBTTask 2 128 0.1454 12MedGIFT AllFeats AllCols correlation TST 0.1356 13VISTA@UEvora 03-Mohan-RF-7FF20I1500S20-Age 0.1335 14San Diego VA HCS/UCSD TBTLast 0.1251 15
as precise as possible. Here, Root Mean Square Error (RMSE) was computedbetween ground truth and predicted severity scores provided by participants.The goal was to achieve lowest possible RMSE value.
The other way of evaluation considered binary classification problem. Theoriginal severity index was transformed into two class values: cases with scoresfrom 1 to 3 were labeled as ”high severity” cases and the other cases with scores 4and 5 corresponded to ”low severity” class. With this way of evaluation the par-ticipants were to provide probabilities of TB cases belonging to ”high severity”class. The results were ranked using AUC value. Top-10 runs for both evaluationmethods are shown in Tables 4 and 5.
Table 4. Top-10 submitted runs with lowest RMSE values for Severity scoring.
Group Name Run RMSE Rank
UIIP BioMed TBdescs2 zparts3 thrprob50 rf100 0.7840 1
MedGIFT HOG std euclidean TST 0.8513 2VISTA@UEvora 07-Mohan-MLP-6FTT100 0.8883 3MedGIFT AllFeats AllCols euclidean TST 0.8883 4MedGIFT AllFeats AllCols correlation TST 0.8934 5MedGIFT HOG mean euclidean TST 0.8985 6MedGIFT HOG mean correlation TST 0.9237 7MedGIFT HOG AllCols euclidean TST 0.9433 8MedGIFT HOG AllCols correlation TST 0.9433 9HHU-DBS RanFrst 0.9626 10
In total, 36 runs were submitted by 7 participants for this subtask. As it canbe seen from the tables, lesion-based TB-descriptor appeared to be extremely
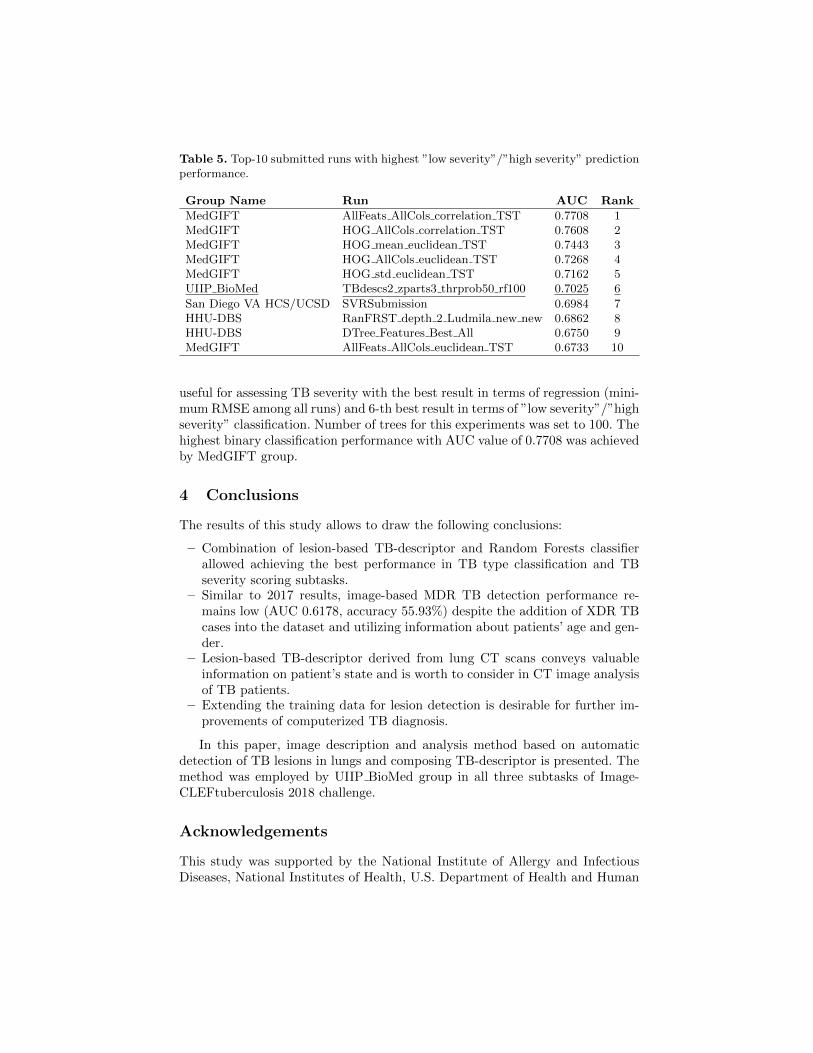
Table 5. Top-10 submitted runs with highest ”low severity”/”high severity” predictionperformance.
Group Name Run AUC Rank
MedGIFT AllFeats AllCols correlation TST 0.7708 1MedGIFT HOG AllCols correlation TST 0.7608 2MedGIFT HOG mean euclidean TST 0.7443 3MedGIFT HOG AllCols euclidean TST 0.7268 4MedGIFT HOG std euclidean TST 0.7162 5UIIP BioMed TBdescs2 zparts3 thrprob50 rf100 0.7025 6
San Diego VA HCS/UCSD SVRSubmission 0.6984 7HHU-DBS RanFRST depth 2 Ludmila new new 0.6862 8HHU-DBS DTree Features Best All 0.6750 9MedGIFT AllFeats AllCols euclidean TST 0.6733 10
useful for assessing TB severity with the best result in terms of regression (mini-mum RMSE among all runs) and 6-th best result in terms of ”low severity”/”highseverity” classification. Number of trees for this experiments was set to 100. Thehighest binary classification performance with AUC value of 0.7708 was achievedby MedGIFT group.
4 Conclusions
The results of this study allows to draw the following conclusions:
– Combination of lesion-based TB-descriptor and Random Forests classifierallowed achieving the best performance in TB type classification and TBseverity scoring subtasks.
– Similar to 2017 results, image-based MDR TB detection performance re-mains low (AUC 0.6178, accuracy 55.93%) despite the addition of XDR TBcases into the dataset and utilizing information about patients’ age and gen-der.
– Lesion-based TB-descriptor derived from lung CT scans conveys valuableinformation on patient’s state and is worth to consider in CT image analysisof TB patients.
– Extending the training data for lesion detection is desirable for further im-provements of computerized TB diagnosis.
In this paper, image description and analysis method based on automaticdetection of TB lesions in lungs and composing TB-descriptor is presented. Themethod was employed by UIIP BioMed group in all three subtasks of Image-CLEFtuberculosis 2018 challenge.
Acknowledgements
This study was supported by the National Institute of Allergy and InfectiousDiseases, National Institutes of Health, U.S. Department of Health and Human

Services, USA through the CRDF project DAA3-17-63599-1 ”Year 6: BelarusTB Database and TB Portals”.
References
1. Cohen, J.: A coefficient of agreement for nominal scales. Educational and Psycho-logical Measurement 20(1), 37–46 (1960)
2. Dicente Cid, Y., Kalinovsky, A., Liauchuk, V., Kovalev, V., , Muller, H.: Overviewof ImageCLEFtuberculosis 2017 - predicting tuberculosis type and drug resis-tances. In: CLEF2017 Working Notes. CEUR Workshop Proceedings, CEUR-WS.org <http://ceur-ws.org>, Dublin, Ireland (September 11-14 2017)
3. Dicente Cid, Y., Liauchuk, V., Kovalev, V., , Muller, H.: Overview of ImageCLEF-tuberculosis 2018 - detecting multi-drug resistance, classifying tuberculosis type,and assessing severity score. In: CLEF2018 Working Notes. CEUR Workshop Pro-ceedings, CEUR-WS.org <http://ceur-ws.org>, Avignon, France (September 10-14 2017)
4. Ionescu, B., Muller, H., Villegas, M., Arenas, H., Boato, G., Dang-Nguyen, D.T.,Dicente Cid, Y., Eickhoff, C., Garcia Seco de Herrera, A., Gurrin, C., Islam, B.,Kovalev, V., Liauchuk, V., Mothe, J., Piras, L., Riegler, M., Schwall, I.: Overview ofImageCLEF 2017: Information extraction from images. In: Experimental IR MeetsMultilinguality, Multimodality, and Interaction 8th International Conference of theCLEF Association, CLEF 2017. Lecture Notes in Computer Science, vol. 10456.Springer, Dublin, Ireland (September 11-14 2017)
5. Ionescu, B., Muller, H., Villegas, M., de Herrera, A.G.S., Eickhoff, C., Andrea-rczyk, V., Cid, Y.D., Liauchuk, V., Kovalev, V., Hasan, S.A., Ling, Y., Farri, O.,Liu, J., Lungren, M., Dang-Nguyen, D.T., Piras, L., Riegler, M., Zhou, L., Lux, M.,Gurrin, C.: Overview of ImageCLEF 2018: Challenges, datasets and evaluation. In:Experimental IR Meets Multilinguality, Multimodality, and Interaction. Proceed-ings of the Ninth International Conference of the CLEF Association (CLEF 2018),LNCS Lecture Notes in Computer Science, Springer, Avignon, France (September10-14 2018)
6. Kalinovsky, A., Liauchuk, V., Tarasau, A.: Lesion detection in CT images us-ing Deep Learning semantic segmentation technique. In: International Work-shop ”Photogrammetric and computer vision techniques for video surveillance,biometrics and biomedicine”. The International Archives of the Photogramme-try, Remote Sensing and Spatial Information Sciences, vol. XLII, pp. 13–17.Moscow, Russia (May 2017). https://doi.org/10.5194/isprs-archives-XLII-2-W4-13-2017, http://www.int-arch-photogramm-remote-sens-spatial-inf-sci.net/XLII-2-W4/13/2017/
7. Klein, S., Staring, M., Murphy, K., Viergever, M.A., Pluim, J.P.: Elastix: a tool-box for intensity–based medical image registration. IEEE Transactions on medicalimaging 29(1), 196–205 (2010)
8. Kovalev, V., Liauchuk, V., Kalinouski, A., Rosenthal, A., Gabrielian, A., Skrahina,A., Astrauko, A., Tarasau: Utilizing radiological images for predicting drug resis-tance of lung tuberculosis. In: Computer Assisted Radiology - 27th InternationalCongress and Exhibition (CARS-2015). vol. 10, pp. 129–130. Springer, Barcelona(2015)
9. Kovalev, V., Liauchuk, V., Safonau, I., Astrauko, A., Skrahina, A., Tarasau, A.:Is there any correlation between the drug resistance and structural features of

radiological images of lung tuberculosis patients? In: Computer Assisted Radiology- 27th International Congress and Exhibition (CARS-2013). vol. 8, pp. 18–20.Springer, Heidelberg (2013)
10. Shelhamer, E., Long, J., Darrell, T.: Fully convolutional networks for semanticsegmentation. IEEE Transactions on Pattern Analysis and Machine Intelligence39(4), 640–651 (April 2017). https://doi.org/10.1109/TPAMI.2016.2572683
11. Sluimer, I., Prokop, M., van Ginneken, B.: Toward automated segmentation of thepathological lung in ct. IEEE Transactions on Medical Imaging 24(8), 1025–1038(Aug 2005). https://doi.org/10.1109/TMI.2005.851757
12. Wang, Y.X.J., Chung, M.J., Skrahin, A., Rosenthal, A., Gabrielian, A., Tar-takovsky, M.: Radiological signs associated with pulmonary multi-drug resistanttuberculosis: an analysis of published evidences. Quantitative Imaging in Medicineand Surgery 8(2), 161–173 (2018)


![Overview of the ImageCLEF 2012 Flickr Photo Annotation and ...ceur-ws.org/Vol-1178/CLEF2012wn-ImageCLEF-ThomeeEt2012.pdf · tion [1,2]. The entire collection contains 1 million images](https://img.dokumen.tips/doc/110x75/6037c3ace190520e8c29aff6/overview-of-the-imageclef-2012-flickr-photo-annotation-and-ceur-wsorgvol-1178clef2012wn-imageclef-.jpg)