Embed Size (px)
Citation preview
GVS Raj Kumar et al/ International Journal of Engineering Science and Technology Vol. 2(4), 2010, 694-703
IMAGE SEGMENTATION BY USING FINITE BIVARIATE DOUBLY
TRUNCATED GAUSSIAN MIXTURE MODEL
GVS Raj Kumar* Srinivas Yarramalle** A.Tejaswi*
NaveenKumar K* Chandra Sekhar P* Chhajer Sunanda*
* Dept. of Information Technology, GITAM University, Visakhapatnam.
** Dept of Information Technology, VIIT, Visakhapatnam.
Abstract In this paper, we develop and analyze a segmentation method using Bivariate Finite doubly Truncated Gaussian Mixture Model and K-Means algorithm. Image Segmentation is used in many applications; with Image Retrieval it is possible to analyze the images in Geo-Information Systems, Medical Image Analysis, Film and Photo Analysis etc. It is customary to consider the pixel intensity only in many of the Image Retrieval methods; however it is highly important that another character of the pixel, namely, brightness plays a dominant role in Image Retrieval. It is also to be observed that the pixel intensity and brightness are correlated and follows a Bivariate Distribution and having finite range. Hence it is needed to develop an Image Retrieval method by considering that the pixel intensities and brightness in the image region follows a doubly truncated Bivariate Gaussian Distribution and the entire image is characterized by Finite Truncated Bivariate Guassian Mixture Model. In this paper, using the K-Means algorithm, the number of image regions is identified and the model parameters inside the image regions are estimated by using the EM- algorithm. The segmentation of the pixels is carried by maximizing the component likelihood. The performance of the developed method is demonstrated through SIX images namely, SUNSET, BULL, MAN, HILLS, WOMEN , LOTUS and obtaining the Image Quality Metrics like, Average Difference, Maximum Distance, Image Fidelity, Mean Square Error, Signal to Noise Ratio and Image Quality Index. It is observed that in all the above Image Quality Metrics this algorithm is superior to the existing Image Segmentation algorithms Keywords: EM algorithm, image segmentation, image quality metrics, doubly truncated Gaussian mixture model, MML criterion. 1. Introduction
Color image segmentation is widely used in many applications. With segmentation it is possible to identify the regions of interest and objects which are highly useful to subsequent image analysis or image animation. For example, many communication tasks require high comprehensive ratio to save network resources. One possible way to realize the higher comprehensive ratio is to discriminate the objects for the image and compress only the necessary objects for the user. This makes image segmentation extremely useful for providing the needed information and image retrieval.
Image segmentation is defined as the process of dividing an image into different regions such that each region is homogenous. For intensity image segmentation there exist three popular approaches, namely (i) histogram analysis technique (ii) region growing and (iii) edge detection[1]. There does not exist a single generic algorithm that works for all applications [8] With the progress in research on Gaussian mixture models, image segmentation based on Gaussian mixture models has also become very popular. In the image segmentation through Gaussian mixture distribution models, it was assumed that the pixel intensities inside the entire image follow a finite Gaussian mixture model distribution [9],[10],[11].
Most of the image segmentation algorithms considered that the pixel intensity in each image region followed a normal distribution, which assumed that pixel intensity in the image region has an infinite range. However, in any image the pixel intensities lie between two finite values and in some image regions the distribution may be
ISSN: 0975-5462 694

GVS Raj Kumar et al/ International Journal of Engineering Science and Technology Vol. 2(4), 2010, 694-703
asymmetric and skewed. The probability density function of the doubly truncated normal distribution is given by:
g(z,μ,σ) = with ZL < z < ZM
where ZL and ZM are the truncation points and f (z) is the probability density function of the normal distribution.
The value of 1- is significant based on the value of mean µ and Standard Deviation σ in the
interval (ZL, ZM). This distribution includes the skewed, asymmetric and finite range distributions as particular cases.
However Z (pixel intensity), below some value ZL and above some value ZM cannot exist. Then the resulting distribution of the pixel intensities is a doubly truncated normal distribution. The lower and upper truncation points ZL and ZM determine the degree of truncation. The case ZL = µ, ZM = ∞, produced a half normal distribution. Here it is assumed that the pixel intensity in the entire image follows a K-component finite mixture of doubly truncated Gaussian distribution such that each region must be homogenous.
As a result of this finite range in pixel intensity, it is necessary to consider that pixel intensities in the entire image follow a finite doubly truncated Gaussian mixture distribution. We have an efficient image segmentation algorithm assuming that the pixel intensities of the entire image follow a finite doubly truncated Gaussian mixture distribution. The number of image regions was determined by k-means clustering and the model parameters were estimated using Expectation Maximization (EM) algorithm [2].
In our proposed method, we use K-means algorithm to initialize the finite doubly truncated Gaussian mixture parameters and can successfully solve the initialization problem. The number of mixture components is automatically determined by implementing the Minimum Message Length (MML) criteria into the EM algorithm. Therefore, the method can integrate the parameter estimation. With the model parameters from the EM algorithm, the pixel clustering is carried out according to the Maximum likelihood (ML) estimation.
2. Flow Chart of the Proposed Method
Model Based Image Segmentation is one of the most efficient techniques adopted for image analysis and image retrievals. But for efficient analysis and image retrieval it is needed to consider the prime image features like brightness and color along with the pixel intensity. Hence analyzing the image with one feature alone will drastically affect the image quality. So we develop and analyze Image Segmentation techniques with the assumption that the feature vector of the image region follows a doubly truncated multivariate Gaussian distribution and the entire image is characterized by the finite doubly truncated Multivariate Gaussian mixture distribution. The flow chart of the proposed method is shown in the figure1.
ISSN: 0975-5462 695

GVS Raj Kumar et al/ International Journal of Engineering Science and Technology Vol. 2(4), 2010, 694-703
Figure1: Flow chart of the doubly truncated Gaussian Mixture Model
3. Gaussian Mixture Model
Image is a matrix in which each element is a pixel. The value of the pixel is a number that shows intensity or color of the image. Let X is a random variable that takes these values. Consider a mixture model with K > 1 components in Rn for n≥1.
For a probability model determination, we can suppose to have mixture of doubly truncated Gaussian distribution as the following form.
P(x│θ) = N(x│μi, )
where k is the number of regions and pi>0 are weights such that The probability density function
of K-component finite mixture of doubly truncated Gaussian distribution is expanded as follows.
N(μi, ) = exp
where µi , are mean, standard deviation of class i. and N(x│μi, ) is a doubly truncated Gaussian distribution
with mean µ and standard deviation σ[4]. This truncated probability density function is applied to each segment obtained from k-means algorithm. For a given image X, the lattice data are the values of pixels, µ and σ are the values which is the result of k-means algorithm for each segment and GMM is our pixel based model.
For the Gaussian mixtures, each component density p(x| ) is a normal probability distribution[1]:
ISSN: 0975-5462 696

GVS Raj Kumar et al/ International Journal of Engineering Science and Technology Vol. 2(4), 2010, 694-703
P(x│θm) = *
exp - (x- )}
Based on the probability values of µ, σ and the pixel intensities of their corresponding segments, we can
segment the image based on GMM. The resultant will be taken as input to the EM algorithm to get the maximized parameters.
4. EM Algorithm
The commonly used approach for determining the parameters of a finite doubly truncated Gaussian mixture model from a given dataset is to use the maximum-likelihood estimation [1]. The EM algorithm is a general iterative technique for computing maximum-likelihood when the observed data can be regarded as incomplete. The usual EM algorithm consists of an Expectation step (E-step) and Maximization step (M-step).
The color image segmentation problem is formalized in the framework of the EM algorithm. yj = ( , ,
) (j=1,..., N) is the j-th element in a color image observed in the RGB color space, where yj X is a scalar value
observed on the X plane. yj is supposed to be drawn from a mixture of normal density functions whose parameters (mean vectors and covariance matrices) are unknown. Here, the number of densities is assumed to be M and the form of a mixture of normal density functions is
P(yj)= ( ; , )
where pi (yj; i, Si) denotes the i-th bivariate normal density with a mean vector mi and a covariance matrix Σi, ai
is the proportion of the i-th normal density in the mixture. Let y=(y1,..., yN) denote the incomplete-data set consisting of N independent and identically distributed
(i.i.d.) observations. We associate with yj an unobservable M-dimensional indicator vector xj= ( ,..., ),
whose entries are all zero except for the k-th entry, that is, yj has actually been generated by the k-th normal density of the mixture. Thus, z=(xj, yj) (j=1,..., N) denote the complete-data set[3]. Suppose that (t) denotes the
estimation of obtained after the tth iteration of the algorithm. Then at the (t+1)th iteration, the E-step computes
the expected complete data log-likelihood function.
Q ( , ) = | )}p(m| ; )
where p(m is a posterior probability and is computed as
p(m| xk ; )=
The M-step finds the (t+1)th estimation of by maximizing Q(
= ; )
ISSN: 0975-5462 697

GVS Raj Kumar et al/ International Journal of Engineering Science and Technology Vol. 2(4), 2010, 694-703
EM algorithm is highly dependent on initialization. A common approach is using multiple random starts and choosing the final estimate with the highest likelihood [1]. This will greatly increase the computation burden. In our method, we initialize the mixture parameters by K-means algorithm.
Iterate both the E-step and the M-step until an specify error i.e. < .Another main issue of using
Gaussian mixture model in image segmentation is the difficulty to estimate the number of components. The number of segmentation region is determined by the user in advance.
In order to subjugate this problem, a model selection criterion, Minimum Message Length (MML) is introduced. For an M-components mixture, the parameters specifying each component are expressed as:
= arg min L(
with
L( ) + +
where N is the number of parameters specifying each component, n is the number of observed data, M is the number of components, and α, θ are the estimated Gaussian mixture parameters.
In order to get the best mixture components, the “EM+MML” algorithm is introduced in[1].With the input data, the EM algorithm was run iteratively from M max to M min, in each iteration, the mixture parameters are initialized by K-means and EM respectively. The EM algorithm is iteratively carried out with the initial estimates. The EM algorithm converges when difference of old estimates and new estimates are less than some threshold and the final estimates are obtained, where Mmax and Mmin are the maximum and minimum number of components. Then compute the value of Lm. If the value of Lm is less than initial message length, assign the value of Lm to the initial message length and bring out the best mixture model parameter. The number of components and mixture parameters are selected according to the minimum message length expressed in above equation.
5. Segmentation Algorithm
The segmentation consists of two steps. The first step is mixture estimation. The above “EM+MML" method is used to estimate the mixture parameters and determine the number of Gaussian components.
The second step is pixel clustering. The segmentation is carried out by assigning each pixel into a proper cluster according to the Maximum likelihood (ML) estimation. The j th element is labeled Lj according to the following equation,
=
where x is the input data, μEM, ΣEM are the estimated mixture parameters respectively. In the above equation, the constant factor is omitted and T denotes the transpose of a matrix [2].
6. EXPERIMENTAL RESULTS
In order to evaluate the developed segmentation model, consider the image segmentation algorithm with Finite Bivariate Doubly Truncated Gaussian Mixture Model with K-Means clustering and apply it to 6 images namely WOMEN, SUNSET, MAN, LOTUS, HILLS and BULL. We assume that the pixel intensities in each segment of the image follow a Bivariate Doubly Truncated Gaussian Distribution and intensities in each image follows a Finite Bivariate Doubly Truncated Gaussian Mixture Distribution. Using the Pixel grabber under JAVA environment the pixel intensities of the image are obtained. The K-Means algorithm is performed with pixel intensities of each image and the estimated value of ‘K’ for each image data is obtained and shown in Table-1.
IMAGE BULL WOMEN SUNSET LOTUS HILLS MAN.
Estimate of K 3 4 5 5 4 5
Table-1: Estimated value of K (By K-MEANS Clustering Algorithm)
From Table-1, we observe that for the images WOMEN and HILLS are having FOUR regions each, and the images SUNSET, LOTUS and MAN are having FIVE regions each and the image BULL has THREE regions. The initial values of the model parameters pi, µi ,σi , αi for i=1,2,..K for each image region of the images is computed by using the method proposed by Armando.J et al [12]. Using these initial estimates, the EM algorithm is performed for refining the estimates of the model parameters for each image data.
ISSN: 0975-5462 698
GVS Raj Kumar et al/ International Journal of Engineering Science and Technology Vol. 2(4), 2010, 694-703
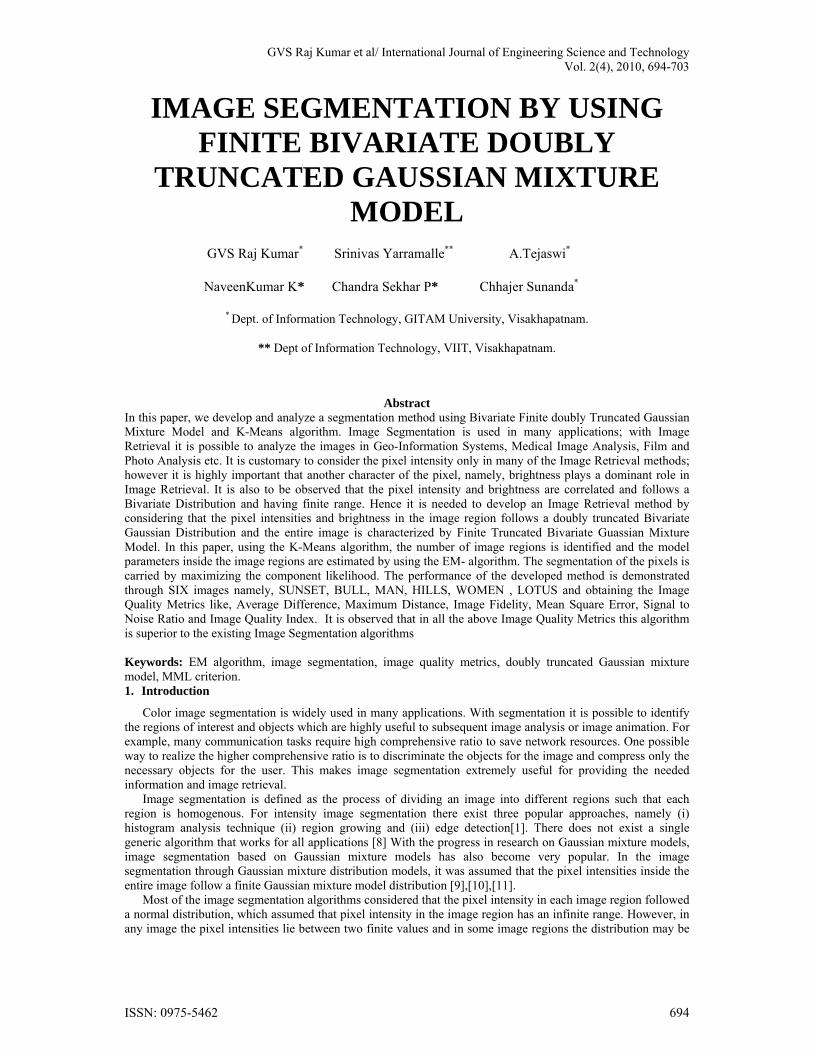
Substituting the estimates K, µi, σi and αi, in the above equations, we obtained the probability density function of each image. The original and the reconstructed images Finite Bivariate Doubly Truncated Gaussian Mixture Model with k-Means clustering algorithm is shown in Figure- 1
Figure-1: Original Image and Re-constructed image using finite Bivariate Doubly Truncated Gaussian Mixture Model
7. PERFORMANCE EVALUATION
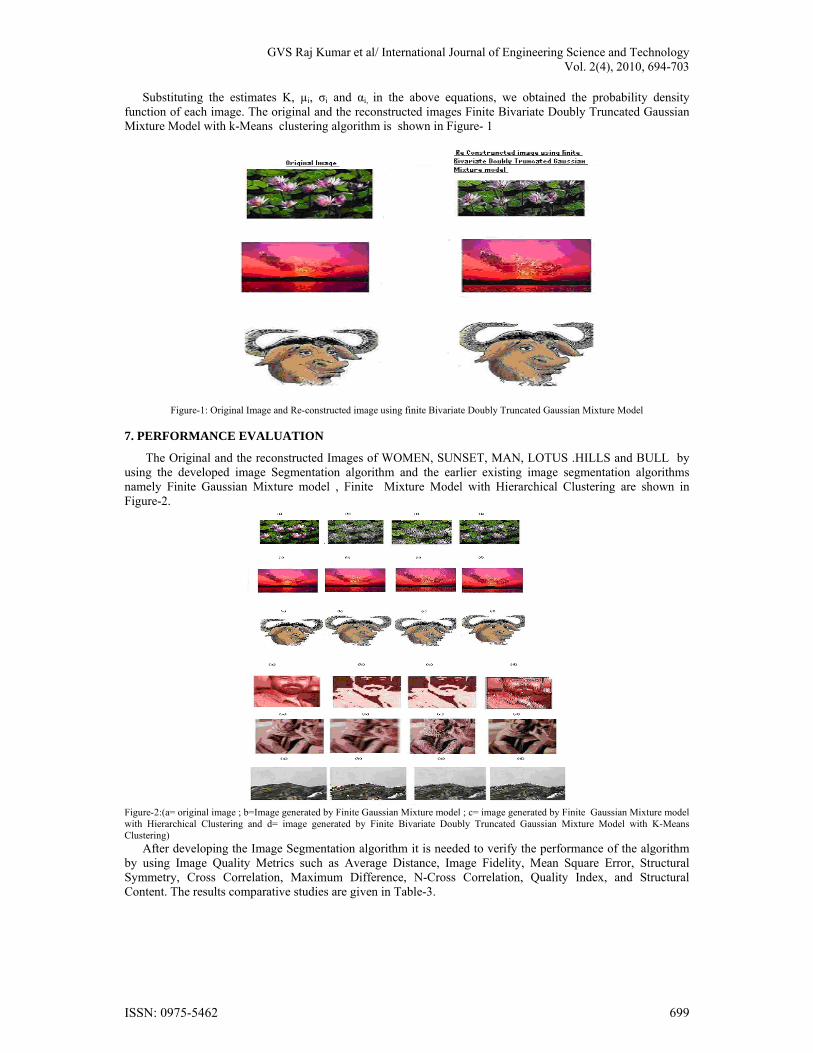
The Original and the reconstructed Images of WOMEN, SUNSET, MAN, LOTUS .HILLS and BULL by using the developed image Segmentation algorithm and the earlier existing image segmentation algorithms namely Finite Gaussian Mixture model , Finite Mixture Model with Hierarchical Clustering are shown in Figure-2.
Figure-2:(a= original image ; b=Image generated by Finite Gaussian Mixture model ; c= image generated by Finite Gaussian Mixture model with Hierarchical Clustering and d= image generated by Finite Bivariate Doubly Truncated Gaussian Mixture Model with K-Means Clustering)
After developing the Image Segmentation algorithm it is needed to verify the performance of the algorithm by using Image Quality Metrics such as Average Distance, Image Fidelity, Mean Square Error, Structural Symmetry, Cross Correlation, Maximum Difference, N-Cross Correlation, Quality Index, and Structural Content. The results comparative studies are given in Table-3.
ISSN: 0975-5462 699

GVS Raj Kumar et al/ International Journal of Engineering Science and Technology Vol. 2(4), 2010, 694-703
Table 1:Comparitive study of Image quality Metrics
IMAGE Quality Metric
Finite Gaussian Mixture Model With K-Means
Finite Gaussian Mixture Model With Hierarchical clustering algorithm
Finite Bivariate Doubly Truncated Gaussian Mixture Model using K-Means Algorithm
Standard Limits
Standard Criteria
BULL
Average Difference
0.6963 0.0863 0.45275 -1 to +1 Closest to 1
Maximum Distance
0.6708 0.9708 0.2287 -1 to +1 Closest to 1
Image Fidelity
1.22208 1.008 0.9001 0 to 1 Closest to 1
Mean Square Error
0.9982 08972 0.7813 0 to ∞ Closest to 0
Signal to Noise Ratio
23.454 32.454 65.759 0 to + ∞ As Big as Possible
Image Quality Index
-0.1254 0.2354 0.756 -1 to 1 Closest to 1
MAN
Average Difference
0.7863 0.3783 0.87817 -1 to +1 Closest to 1
Maximum Distance
-0.9708 1.3222 0.89467 -1 to +1 Closest to 1
Image Fidelity
0.989 0.8744 0.748 0 to 1 Closest to 1
Mean Square Error
0.9982 0.1232 0.1285 0 to ∞ Closest to 0
Signal to Noise Ratio
12.454 29.342 42.436 0 to + ∞ As Big as Possible
Image Quality Index
-0.2354 -0.023 0.723 -1 to 1 Closest to 1
SUNSET
Average Difference
0.0783 -0.3793 0.43808 -1 to +1 Closest to 1
Maximum Distance
-0.6708 -0.3452 0.8978 -1 to +1 Closest to 1
Image Fidelity
1.76208 1.2444 0.4544 0 to 1 Closest to 1
Mean Square Error
0.8982 0.7432 0.5998 0 to ∞ Closest to 0
Signal to Noise Ratio
24.454 29.342 39.734 0 to + ∞ As Big as Possible
Image Quality Index
-0.2354 -0.1733 0.980 -1 to 1 Closest to 1
ISSN: 0975-5462 700

GVS Raj Kumar et al/ International Journal of Engineering Science and Technology Vol. 2(4), 2010, 694-703
WOMEN
Average Difference
0.0543 -0.8383 0.91723 -1 to +1 Closest to 1
Maximum Distance
-0.4508 -0.3222 1.1461 -1 to +1 Closest to 1
Image Fidelity
1.5408 0.1124 0.678 0 to 1 Closest to 1
Mean Square Error
0.7682 0.1213 0.8546 0 to ∞ Closest to 0
Signal to Noise Ratio
36.476 35.122 47.737 0 to + ∞ As Big as Possible
Image Quality Index
-0.6354 1.023 0.5430 -1 to 1 Closest to 1
LOTUS
Average Difference
0.0563 0.4783 0.56322 -1 to +1 Closest to 1
Maximum Distance
-0.546 -0.142 1.145 -1 to +1 Closest to 1
Image Fidelity
1.8978 1.2444 0.618 0 to 1 Closest to 1
Mean Square Error
0.6482 0.1132 0.7058 0 to ∞ Closest to 0
Signal to Noise Ratio
32.454 35.342 49.876 0 to + ∞ As Big as Possible
Image Quality Index
-0.4354 -0.127 0.918 -1 to 1 Closest to 1
HILLS
Average Difference
0. 775 -0.6878 0.5621 -1 to +1 Closest to 1
Maximum Distance
-0.9543 -0.5222 1.1768 -1 to +1 Closest to 1
Image Fidelity
1.17608 0.5345 0.769 0 to 1 Closest to 1
Mean Square Error
0.4382 0.1132 0.2255 0 to ∞ Closest to 0
Signal to Noise Ratio
22.454 32.322 29.265 0 to + ∞ As Big as Possible
Image Quality Index
-0.3254 -0.893 1.0010 -1 to 1 Closest to 1
ISSN: 0975-5462 701

GVS Raj Kumar et al/ International Journal of Engineering Science and Technology Vol. 2(4), 2010, 694-703
From this Table-1 and Figure-2, it is observed that the developed algorithm performs much superior to existing algorithms with respect to the Image Quality Metrics.
The performance of the Image Segmentation algorithm is also studied through classifier accuracy by computing the misclassification rate (J.Han and M. Kamber (2004). The misclassification rates of the different images namely BULL, WOMEN, MAN, LOTUS, HILLS and SUNSET with reference to the developed segmentation algorithm and the Finite Bivariate Doubly Truncated Gaussian Mixture Model with Hierarchical clustering algorithm are computed and given in Table-2.
Table-2 CLASSIFIER ACCURACY
Name of the IMAGE
Finite Gaussian Mixture Model
Finite Gaussian Mixture model
With Hierarchical Clustering
Finite Bivariate Doubly Truncated Gaussian Mixture
model with K-Means algorithm
BULL 93.45 94.76 97.78
WOMEN 96.34 97.11 97.98
MAN 95.23 96.13 97.81
LOTUS 96.02 96.91 97.54
HILLS 96.34 97.12 98.17
SUNSET 95.12 96.87 98.43
From the Table-2, it is observed that the accuracy of the developed algorithm is superior to that of the existing algorithms. It is highly desirable to develop an Image Segmentation Algorithm based on Finite Generalized Multivariate Gaussian Mixture Model with Hierarchical Clustering which will serve as a generic algorithm for analyzing and retrieving several Images.
CONCLUSION
A segmentation algorithm for color images was proposed. In the algorithm the observed color image is considered as a mixture of multivariate normal densities and segmentation is carried out by the ML estimation. This paper demonstrated the color image segmentation algorithm with finite doubly truncated Gaussian mixture model with k-means clustering. After obtaining the number of components in the mixture model, the efficiency of the segmentation is based on the assignment of probability density function to the image regions. In this, the observed color image was considered as a mixture of multivariate normal densities. We assumed that the pixel intensities in each segment of the image follow a finite doubly truncated Gaussian distribution. Initialization of the parameters in each segment was done and the number of segments is estimated using k-means clustering. Using the EM algorithm with the MML criterion, the parameters of the mixture model were obtained. This segmentation algorithm was used to reconstruct the image. The performance of this reconstructed image could be verified by the image quality testing methods. There are several image quality measures available for performance evaluation of the image segmentation algorithm. The various image quality metrics given are average distance, image fidelity, mean square error, signal-to-noise ratio, maximum difference, image quality index. It is highly desirable to develop an image segmentation algorithm based on finite doubly truncated Gaussian mixture model with “EM+MML” algorithm segmented with k-means clustering, which will serve as a generic algorithm for analyzing and retrieving several images.
The segmentation is carried out by the ML estimation. The advantage of our method lies in two aspects. First, by using the K-means algorithm, we successfully circumvent the initialization problem of EM algorithm. Second advantage of the algorithm is that the number of segmentation region is automatically determined by the MML criterion. The algorithm has been extensively used to estimate the mixture parameters.
References
[1] Yiming Wu; Xiangyu Yang; Kap Luk Chan ,“Unsupervised Color Image Segmentation Based on Gaussian Mixture Model”, in Proceedings of 2003 Joint Conference at the 4th International Conference on Information, Communication and Signal Processing, December 2003, vol. 1, pp. 541–544.
[2] Srinivas Yarramalle and K.Srinivas Rao ,“Unsupervised image segmentation using finite doubly truncated Gaussian mixture model and hierarchical clustering”, CURRENT SCIENCE, Vol. 93, No. 4, 25 August 2007.
ISSN: 0975-5462 702
GVS Raj Kumar et al/ International Journal of Engineering Science and Technology Vol. 2(4), 2010, 694-703
[3] T. Yamazaki, “Introduction of EM Algorithm into Color Image Segmentation,” Proceedings of ICIRS'98, August 1998, pp.368-371, August 1998.
[4] Rahman Farnoosh, Gholamhossein Yari and Behnam Zarpak “Image Segmentation using Gaussian Mixture Models. [5] H. Caillol and W. pieczynski and A. Hillion, Estimation of Fuzzy Gaussian Mixture and Unsupervised Statistical Image
Processing," IEEE Transaction on Image Processing, Vol. 6, pp. 425-440, March 1997. [6] M. A. Figueiredo and A. K. Jain, Unsupervised Learning of Finite Mixture Models," IEEE Transaction on Pattern Analysis and
Machine Intelligence, Vol. 24, pp. 381-396, March 2002. [7] Rafel C. Gonzalez, Richard E. Woods, “Digital Image processing”, Second Edition, [8] S.K. Pal et al (1993), “ A Review of Image Segmentation Techniques” Pattern Recognition, Vol 9, pp 1277-1294 [9] T.Lie et al (1993) “Performance evaluation of Finite Normal Mixture Model based Image Segmentation, IEEE Trans on Image
processing, Vo1.12, issue-10, pp1153-1169 [10] Nasios.N, A.G.Bors, “Variational learning for Gaussian Mixtures”, IEEE Transactions on Systems, Man, and Cybernatics-Part
B: Cybernetics, Vol 36, no-4, pp 849-862. [11] Yiming WU et al, - (2003.) “Unsupervised Color Image Segmentation based on Gaussian Mixture Models” Proceedings of
2003 Joint Conference of the Fourth International Conference on Information, Communications and Signal Processing, Vol.1, pp 541-544.
[12] Armando Dominguez J et al (2003), “A Practical Procedure to Estimate the Shape Parameters in the Generalized Gaussian Distribution”, technique report I-01-18_eng.pdf, available through http://www.citmat.mx/reportes/enlinea/I-01-18_eng.pdf.
[13] J.Han and M.Kamber (2004) Text book on “Data Mining Concepts and Techniques” Elsevier publications.
ISSN: 0975-5462 703