Embed Size (px)
Citation preview

Image Reconstruction Software for
Near-Field Coded Mask Instruments
Diploma thesis
Dr. Remeis-Observatory Bamberg - Astronomical InstituteErlangen Centre for Astroparticle Physics
University of Erlangen-NurembergGermany
and
Chair for Computer Science 9 - Computer GraphicsUniversity of Erlangen-Nuremberg
Germany
and
Center for Astrophysics and Space SciencesUniversity of California, San Diego
United States of America
Written by: Daniel Michalikborn September 6 1984, Hirschau, Germany
Advisors: Prof. Dr. Jörn WilmsProf. Dr. Marc StammingerDr. Richard E. Rothschild
Begin: February 2, 2009End: September 30, 2009
ABSTRACT 2
Abstract
This diploma thesis is concerned with imaging of hard X-rays using coded maskcameras and the specialties of their use in near-�eld applications. It is focused onthe experimental detector setup of the University of California, San Diego which wasdeveloped for the detection of anti-personnel mines. A general introduction of theuse of coded mask cameras in far-�eld is followed by an analysis of the di�erencesfor near-�eld applications. This requires the adaption of the image reconstructionalgorithms.The second part of this thesis engages with the realization of near �eld algorithms
and their e�cient integration into a large scienti�c framework, the �FITS pipeline�developed by the universities of Tübingen and Erlangen-Nuremberg. Hence, a mod-ular data �ow is designed as well as some implementation work done. The thesisconcludes with a summary of further steps that need to be done.
Kurzzusammenfassung
Diese Diplomarbeit beschäftigt sich mit der Abbildung von harter Röntgenstrahlungdurch Coded-Mask Kameras und den Besonderheiten der Verwendung im Nahfeld-bereich. Dabei steht ein Versuchsaufbau der Universität von Kalifornien in SanDiego im Mittelpunkt, der zum Au�nden von Landminen benutzt werden soll. Nacheiner grundlegenden Einführung in die Verwendung von Coded-Mask Kameras fürdie Abbildung weit entfernter Objekte werden die Unterschiede zum Verhalten derKamera im Nahfeld aufgezeigt. Die für die Bildrekonstruktion notwendigen Algo-rithmen müssen dabei auf die neuen Bedürfnisse angepasst werden.Der zweite Teil der Arbeit beschäftigt sich mit der Umsetzung einer Nahfeld-
Bildrekonstruktion und der e�zienten Einbindung dieser Technik in ein gröÿereswissenschaftliches Framework. Dazu wird die �FITS pipeline� der UniversitätenTübingen und Erlangen-Nürnberg verwendet und die notwendigen Schritte zur Inte-gration der Bildrekonstruktionsalgorithmen untersucht. Eine Übersicht der erfolgtenImplementierungsarbeiten und eine Analyse weiterer notwendiger Schritte schlieÿendie Arbeit ab.
Contents
Abstract 2
Table of contents 3
List of Figures 5
List of abbreviations 6
Declaration 7
1 Introduction 8
2 Imaging X-rays in Astronomy 11
2.1 Introduction . . . . . . . . . . . . . . . . . . . . . . . . . . . . . . . . 112.2 The historical way from optical observations to multi-wavelength astronomy 112.3 Optical imaging . . . . . . . . . . . . . . . . . . . . . . . . . . . . . . 122.4 Imaging X-rays below 10 keV: Wolter telescope . . . . . . . . . . . . 13
2.4.1 Conditions of re�ection . . . . . . . . . . . . . . . . . . . . . . 142.4.2 Wolter telescope design . . . . . . . . . . . . . . . . . . . . . . 16
2.5 Imaging X-rays above 10 keV: Coded mask . . . . . . . . . . . . . . . 162.5.1 Introduction . . . . . . . . . . . . . . . . . . . . . . . . . . . . 162.5.2 From pinhole apertures to coded mask . . . . . . . . . . . . . 172.5.3 Image reconstruction . . . . . . . . . . . . . . . . . . . . . . . 202.5.4 Masks . . . . . . . . . . . . . . . . . . . . . . . . . . . . . . . 212.5.5 Image formation and reconstruction methods . . . . . . . . . . 21
2.5.5.1 Convolution using Fast Fourier Transform . . . . . . 222.5.5.2 Image reconstruction using back-projection . . . . . 22
3 Near-�eld X-ray imaging 26
3.1 Introduction . . . . . . . . . . . . . . . . . . . . . . . . . . . . . . . . 263.2 Magni�cation . . . . . . . . . . . . . . . . . . . . . . . . . . . . . . . 263.3 Fast Fourier Transform . . . . . . . . . . . . . . . . . . . . . . . . . . 263.4 Back-projection algorithm . . . . . . . . . . . . . . . . . . . . . . . . 273.5 Background subtraction . . . . . . . . . . . . . . . . . . . . . . . . . 29
4 Experimental setup - hardware 30
4.1 Introduction . . . . . . . . . . . . . . . . . . . . . . . . . . . . . . . . 304.2 Physical background of backscattering: Compton . . . . . . . . . . . 324.3 The detector system . . . . . . . . . . . . . . . . . . . . . . . . . . . 33
5 Experimental setup - data processing 35
5.1 Introduction . . . . . . . . . . . . . . . . . . . . . . . . . . . . . . . . 355.2 Existing image reconstruction software at UCSD . . . . . . . . . . . . 35
5.3 Flexible Image Transportation System (FITS) . . . . . . . . . . . . . 355.4 The fpipe project . . . . . . . . . . . . . . . . . . . . . . . . . . . . . 375.5 Data �ow . . . . . . . . . . . . . . . . . . . . . . . . . . . . . . . . . 385.6 Implementation . . . . . . . . . . . . . . . . . . . . . . . . . . . . . . 40
5.6.1 Overview . . . . . . . . . . . . . . . . . . . . . . . . . . . . . 405.6.2 getEvents: transform hits to events . . . . . . . . . . . . . . 405.6.3 FPPbBoxToEventlist: Convert data from lead box to eventlist 425.6.4 FPEventsToShadowgram: Accumulate the events to a shadow-
gram . . . . . . . . . . . . . . . . . . . . . . . . . . . . . . . . 435.6.5 FPCMSimulator: Coded mask Monte Carlo simulation . . . . 435.6.6 FPfftw: Reconstruction using FFT . . . . . . . . . . . . . . . 465.6.7 FPBackproject: Reconstruction using back-projection . . . . 485.6.8 FPCombineImages: Combine mask/anti-mask and background
images . . . . . . . . . . . . . . . . . . . . . . . . . . . . . . . 495.6.9 FPImage: 2D imager . . . . . . . . . . . . . . . . . . . . . . . 50
6 Summary and outlook 54
References 55
LIST OF FIGURES 5
List of Figures
1 Improved security by backscatter imaging . . . . . . . . . . . . . . . 92 Imaging transmitted and backscattered radiation . . . . . . . . . . . 93 Illustration of a refractor telescope . . . . . . . . . . . . . . . . . . . 124 Illustration of a Newtonian re�ector telescope . . . . . . . . . . . . . 135 Snell's law . . . . . . . . . . . . . . . . . . . . . . . . . . . . . . . . . 146 X-ray re�ectivity of gold . . . . . . . . . . . . . . . . . . . . . . . . . 157 Illustration of the light path in a Wolter telescope . . . . . . . . . . . 168 Wolter telescope used in the Chandra X-Ray Observatory . . . . . . . 179 Pinhole and multiple hole apertures . . . . . . . . . . . . . . . . . . . 1710 Illustration of a box camera . . . . . . . . . . . . . . . . . . . . . . . 1911 Illustration of a mosaic camera . . . . . . . . . . . . . . . . . . . . . 1912 Shadowgram formed by two sources . . . . . . . . . . . . . . . . . . . 2213 Widening caused by back-projection in far-�eld . . . . . . . . . . . . 2414 Coverage of multiple detector pixels and their area ratio . . . . . . . 2415 Parallel vs. radial emitted light . . . . . . . . . . . . . . . . . . . . . 2616 Illustration of back-projection in near-�eld . . . . . . . . . . . . . . . 2817 Complete hardware setup at UCSD . . . . . . . . . . . . . . . . . . . 3018 Top view: Detector and RENA modules . . . . . . . . . . . . . . . . 3019 Side view: Layered structure of the CZT detector . . . . . . . . . . . 3120 Front view: Mask and sources . . . . . . . . . . . . . . . . . . . . . . 3121 Illustration of the coded mask setup at UCSD . . . . . . . . . . . . . 3222 Compton e�ect: Interaction of a photon with a free electron . . . . . 3323 2× 2 MURA mask with N = 23 . . . . . . . . . . . . . . . . . . . . . 3424 Data �ow . . . . . . . . . . . . . . . . . . . . . . . . . . . . . . . . . 3925 The combination of images in the pipeline . . . . . . . . . . . . . . . 4026 Data �ow of photon processing . . . . . . . . . . . . . . . . . . . . . 4527 Shadowgram exposed with the HEXIS mask . . . . . . . . . . . . . . 4628 Mask displayed in black and white . . . . . . . . . . . . . . . . . . . 5329 Testimage, values transformed into a blue and red color scheme . . . 53

LIST OF ABBREVIATIONS 6
List of abbreviations
CASS Center for Astrophysics and Space Sciences
DRDC Defence Research and Development Canada
FOV Field of view
FCFOV Fully coded �eld of view
HEXIS Name of the coded mask detector built for MIRAX by UCSD
IAU International Astronomical Union
MIRAX Monitor e Imageador de Raios-X, planned Brazilian satellite mission
PCFOV Partially coded �eld of view

Declaration
This Diploma Thesis represents my own work and due acknowledgment is givenin footnotes whenever information is derived from other sources. No part of thisDiploma Thesis has been or is being concurrently submitted for any other quali�-cation at any other university.
Bamberg, September 30, 2009

1 INTRODUCTION 8
1 Introduction
X-ray examinations are a common part of everyone's daily life. A doctor will useX-ray technology for medical diagnosis of bones, weld seams of big ships and otherhuge metal vats are regularly checked by analyzing their X-ray images and air-port security scans the traveler's baggage to search for prohibited items. All theseprocedures of using X-ray technology have one thing in common: They are basedon a density-dependent transmission respectively absorption of the applied radia-tion. Hence the source will always be on one side of the examined object while aradiation-sensitive device on the opposite side is needed to detect the transmittedX-rays and their intensity.Obviously this technology can not �t all purposes since it always needs access to
two opposite sides of the object. This is not suitable for a number of tasks. Imaginea suspicious package in the corner of a room. The risk of moving it would be highsince that trigger a detonation. The area would have to be evacuated and heavyarmor would need to be used to ensure the safety of civilians and guards responsiblefor the defusing. An X-ray system working from one side only would be a goodsolution and improvement to current examination approaches since it would allowfurther inspection without moving the suspicious item. This system would have thesource and the detection device on the same side and would be based on some kindof re�ection.This idea could be especially useful in the cleaning of an area where anti-personnel
mines have been deployed. Most of the time the material wrapping the plastic explo-sives is made of plastics too. Hence common metal detectors will not be su�cient todetect them. The current approach for cleaning an area from anti-personnel minesis either to �nd them manually examining square-centimeter after square-centimeteror to use enforced bulldozers or heavy tanks to demolish buildings and plow up thesoil, making sure no mine remains. The disadvantages are obvious: The formermethod takes a lot of time, while the latter leads to much unnecessary destruction.Besides the relinquishment from deploying mines at all, it would be useful to de-velop an X-ray detector capable of distinguishing between the ground (dirt, stones,etc.) and the plastic explosives. This idea is the main purpose behind the detectorsystem1 used in this thesis.As mentioned above, regular two-sided X-ray systems are based on transmis-
sion respectively absorption, while one-sided X-ray technology has to be based onbackscattering of photons, caused by Compton scattering. Since Compton scatter-ing is dependent on the atomic number, it reveals material properties and returnsa clear, photographic image of the top layers of the examined object. This is one
1The terms �detector�, �camera� and �detector system� need to be distinguished since they areoften not used in the same sense. This document refers to �detector� as a radiation- or light-sensitive area. A detector itself is not capable of real-life imaging, since that needs additionaloptical equipment such as lenses, apertures or, in respect to the technology used in this thesis, amultiple-hole aperture called �mask�. Together they are called a �camera�. A �detector system�or �X-ray system� refers to the camera and the sources used for exposing the image.

1 INTRODUCTION 9
Figure 1: Improved security by backscatter imaging2
Figure 2: Imaging transmitted and backscattered radiation3
reason why airport security is currently testing backscattering technology as well,with astonishing results (see Figure 1).The backscattering technology of airport scanners uses a sweeping X-ray beam to
scan the baggage, illustrated in Figure 2. The object, e.g., a suitcase, is horizontallymoved forward on a conveyor belt while a rotating collimator causes a verticallysweeping X-ray beam. A combination of the position of the beam and the measuredintensity of both, the transmitted and the backscattered radiation is displayed andfurther analyzed. Information on backscatter imaging based on a rotating collimatorcan be found in Chalmers (2001), Chalmers (2005), Keshavmurthy et al. (1996), andDugan et al. (2002). While this technology performs great at airports where thescanner will not be moved during operation, it is less applicable as a generic movableone-sided detector system. Under the rough requirements of in-�eld operationsmechanical parts reduce the reliability dramatically. The time needed for the scanis another disadvantage.The idea developed by the Center for Astrophysics and Space Sciences (CASS),
a department of the University of California at San Diego (UCSD) in cooperation
2Courtesy American Science and Engineering Inc., http://www.as-e.com/products_
solutions/z_backscatter.asp3from Chalmers (2001).

1 INTRODUCTION 10
with the Defence Research and Development Canada (DRDC), namely Dr. AnthonyFaust, is to use a camera originally developed for imaging X-rays in space. It wasdeveloped for analyzing hard X-rays (above 10 keV) of celestial bodies and will �yon board of the Brazilian satellite mission �MIRAX�4
This camera is based on the coded mask technology and is capable of spatialresolution in hard X-rays. To use it for anti-personnel mine detection radioactivesources are distributed around the coded mask camera shining towards the object.Backscattered photons can be registered and reconstructed to an image. The �nalgoal of this thesis is the integration of the image reconstruction into a large scien-ti�c framework called the FITS pipeline, showing an image of the examined area asquickly and accurately as possible. To achieve the best results, di�erent deconvolu-tion algorithms are compared in e�ort of implementation, usage of resources, speed,and accuracy.
• To analyze the necessary steps, the physical properties of coded mask camerasneed to be understood. Section 2 explains the idea of coded mask technologyby giving an overview of the historical developments from optical imaging tomulti wavelength astronomy and the current technologies used for imaging inthe optical, soft, and hard X-raysbands. Afterwards the mathematical back-ground on coded mask cameras and the properties of masks are discussed. Thealgorithms for image reconstruction are introduced for far-�eld, hence showingthe existing work.
• Section 3 explains the di�erence between far-�eld and near-�eld setups. Nec-essary adaptions of the reconstruction algorithms are made and improvementsby background subtraction are discussed.
• Section 4 gives a quick overview of the hardware setup, followed by section 5analyzing the software development. After comparing existing software solu-tions with the requirements of large scienti�c frameworks the data �ow andintegration of image reconstruction into the FITS pipeline are shown.
• Finally, the second part of section 5 focuses on the design and implementationof the software modules. Feature requirements and speci�c implementationdetails are listed and the current status of the modules is given.
• Section 6 gives a critical analysis and a �nal conclusion of the thesis.
4 MIRAX (Monitor e Imageador de Raios-X) is a planned satellite mission supposed to monitortransient phenomena in the central galactic plane. It records events in soft and hard X-raywith a ∼ 1000 square degrees �eld of view and an angular resolution of ∼ 6 arcmin. Amongstits instruments are one soft X-ray (2�18keV) and two hard X-ray (10�200keV) coded maskcameras, with sensitivities of ∼ 5 respectively ∼ 2.6 mCrab/day. It will provide coverage offast X-ray novae as well as long-term, in a matter of months, variable phenomena. For furtherinformation refer to Braga et al. (2005).

2 IMAGING X-RAYS IN ASTRONOMY 11
2 Imaging X-rays in Astronomy
2.1 Introduction
To understand the X-ray detection technology and algorithms it is useful to under-stand the history behind it. Hence a quick overview over observational technologiesis given, with section 2.2 showing the historical development of the technology usedin astrophysics, section 2.3 describing optical instruments and section 2.4 introduc-ing the Wolter telescope for the observation of soft X-rays. Section 2.5 explainscoded mask technology and gives the mathematical background as well as the imagereconstruction methods.
2.2 The historical way from optical observations to multi-wavelength astronomy
This section o�ers a quick overview of the historical development. For more detailedinformation refer to Karttunen et al. (1987, pp. 47-82).The �rst solution for �nding out information about celestial bodies was, of course,
simply observing them with the human eye. Analyzing the motion of objects in re-lation to each other revealed many properties: This way planets were distinguishedfrom ��xed stars�. Astronomy based on position and proper motion of celestial ob-jects is called astrometry and was, up to 1860, the most important form of astronomy.Improvements of the accuracy of astrometry were made in the 17th century by thedevelopment of refractor and, some decades later, re�ector telescopes. To observeobjects with an apparent magnitude5 fainter than the limits of the human eye andto obtain an exact measurement of the visual movement of objects, photosensitiveplates were used for long exposures. Most of the collections were preserved and arestill used today, such as the plate archive of the Remeis Observatory in Bamberg(Germany) which contains over 40000 plates made between the 1920s and ∼1970.For further information on plate archives refer to Tsvetkov et al. (2005).Until 1860 the focus of observations was only the shape, brightness and position
of the object. In 1860 Kirchhof and other scientists discovered the relation betweenthe spectrum of electromagnetic waves and the material emitting the light. Fromnow on spectral analysis was performed in astrometrical observations to understandthe molecular structure of the objects. Since those analysis all based on opticallight, the telescope technology remained the same.Only 50 years ago astronomers started to analyze other wavelengths. They
quickly discovered that a complete understanding of celestial bodies requires a multi-
5The apparent magnitude m is an astronomical unit indicating the optical brightness of a celestialobject for an observer on earth as it would have be seen without the terrestrial atmosphere. Itdepends on the absolute magnitude M of the star, i.e., its intrinsic brightness, and the distanced to the observer in units of Parsec: The apparent magnitude m is M + 5(log d − 1). It isgiven in a logarithmic reversed scale which causes a brighter object to have a smaller apparentmagnitude.
2 IMAGING X-RAYS IN ASTRONOMY 12
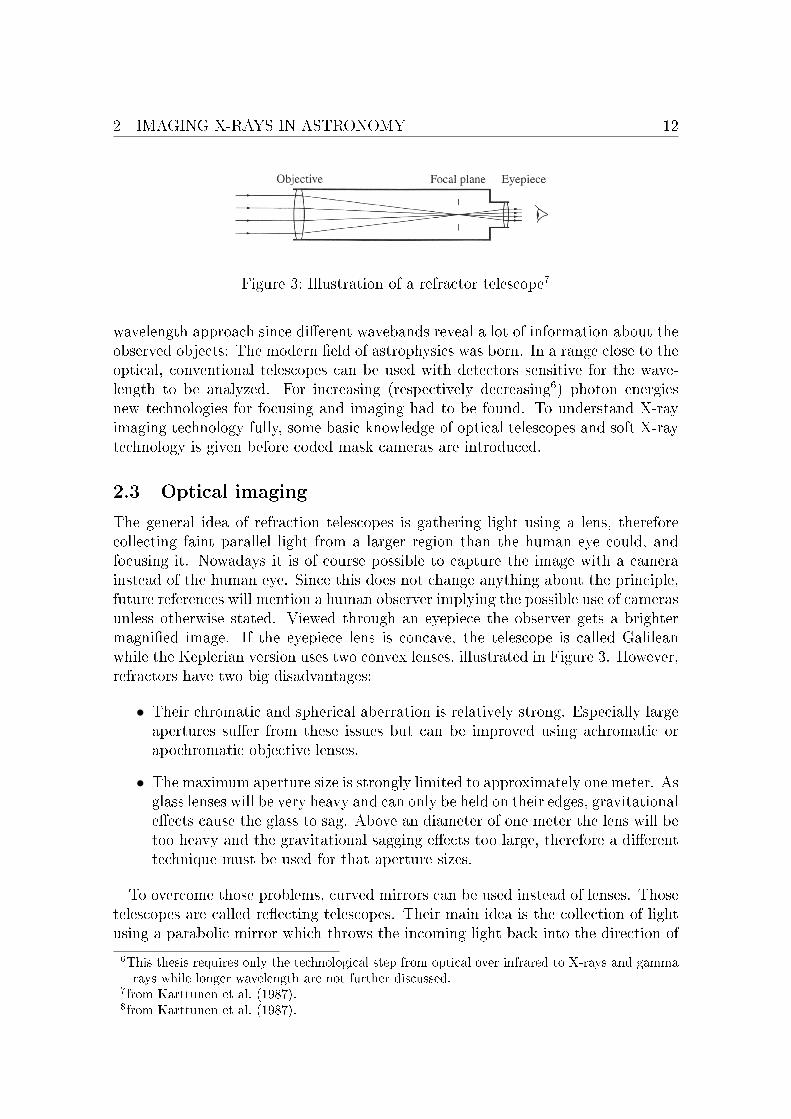
Figure 3: Illustration of a refractor telescope7
wavelength approach since di�erent wavebands reveal a lot of information about theobserved objects: The modern �eld of astrophysics was born. In a range close to theoptical, conventional telescopes can be used with detectors sensitive for the wave-length to be analyzed. For increasing (respectively decreasing6) photon energiesnew technologies for focusing and imaging had to be found. To understand X-rayimaging technology fully, some basic knowledge of optical telescopes and soft X-raytechnology is given before coded mask cameras are introduced.
2.3 Optical imaging
The general idea of refraction telescopes is gathering light using a lens, thereforecollecting faint parallel light from a larger region than the human eye could, andfocusing it. Nowadays it is of course possible to capture the image with a camerainstead of the human eye. Since this does not change anything about the principle,future references will mention a human observer implying the possible use of camerasunless otherwise stated. Viewed through an eyepiece the observer gets a brightermagni�ed image. If the eyepiece lens is concave, the telescope is called Galileanwhile the Keplerian version uses two convex lenses, illustrated in Figure 3. However,refractors have two big disadvantages:
• Their chromatic and spherical aberration is relatively strong. Especially largeapertures su�er from these issues but can be improved using achromatic orapochromatic objective lenses.
• The maximum aperture size is strongly limited to approximately one meter. Asglass lenses will be very heavy and can only be held on their edges, gravitationale�ects cause the glass to sag. Above an diameter of one meter the lens will betoo heavy and the gravitational sagging e�ects too large, therefore a di�erenttechnique must be used for that aperture sizes.
To overcome those problems, curved mirrors can be used instead of lenses. Thosetelescopes are called re�ecting telescopes. Their main idea is the collection of lightusing a parabolic mirror which throws the incoming light back into the direction of
6This thesis requires only the technological step from optical over infrared to X-rays and gammarays while longer wavelength are not further discussed.
7from Karttunen et al. (1987).8from Karttunen et al. (1987).

2 IMAGING X-RAYS IN ASTRONOMY 13
Figure 4: Illustration of a Netownian re�ector telescope8
their origin. This is called the �folding� of the light path. A secondary mirror isused to divert the beam out of the tube and into the eyepiece of the observer or ontothe detector. The shape and position of the secondary mirror as well as the exactoptical design varies with the many di�erent telescope types. Smaller telescopesfor amateurs are mostly simple Newtonian, illustrated in Figure 4, or Schmidt-Cassegrain types. Other variations are used in most of the bigger telescopes.Whatever the type of the re�ector telescope is, they all have several advantages
in comparison with refractor telescopes: The most obvious are structural issues.Mirrors can be held from their back and hence be very thin. Mirrors will be muchlighter than a lens of the same diameter. Therefore the gravitational limits do notapply and mirror telescopes can be built with much bigger apertures. The EuropeanSouthern Observatory uses mirrors with a diameter of eight meters.Holding a mirror from its back also allows the compensation of seeing e�ects9
A second advantage is the possibility of combining smaller mirrors to form a biggerone: The Keck telescopes in Hawaii, USA uses several segmented mirrors to builtup a mirror with a total diameter of ten meters.A last and minor advantage of mirrors is the production process. While a good
lens requires a completely homogeneous glass body and shaping of two surfaces, onlyone surface of a mirror needs to be perfect. This can be achieved by polishing it. Itneeds a high precession but is still much more e�cient than the manufacturing ofglas lenses.
2.4 Imaging X-rays below 10 keV: Wolter telescope
Mirrors are the state-of-the-art for optical imaging. If the photon energies are in-creased to a few keV11, however, mirrors will eventually come to their limits. Whilethe re�ection of optical light on metallic surfaces just works, this will not be the casefor shorter wavelengths. Still, re�ection can be used if the angle of incidence it smallenough for re�ection and the material for the mirrors is well chosen. This chapter
9Seeing is the optical aberration caused by the atmosphere between the celestial object and theobserver. It is caused by the movement of air of di�erent temperatures. To compensate theseeing terrestrial telescopes use adaptive optics10. Satellites do not su�er from seeing since they�y above the earth's atmosphere.

2 IMAGING X-RAYS IN ASTRONOMY 14
Figure 5: Snell's law
about the Wolter telescope and its physical background is based on Aschenbach(1985) unless otherwise stated.
2.4.1 Conditions of re�ection
To understand the limits based on the conditions of re�ection it is �rst necessaryto understand Snell's law. Figure 5 shows a beam of light making a transition froma medium with a higher optical density to a medium with a lower optical density.The incidence angle α1 in respect to the surface normal will be smaller than therefracting angle α2.
sinα1
sinα2
=n2
n1
= n (1)
If the incidence angle is above a certain limit, the refracting beam will �ip to theother side of the refracting surface and become a re�ecting beam. This phenomenonis called �total re�ection� and is only possible for n < 1. The limit of the incidenceangle θc can be derived by setting α2 = 90◦.
sinα1,c = n (2)
cos θc = n (3)
Note that cos−1 n is only solvable for −1 ≤ n ≤ 1.12.To eventually analyze the suitability of re�ecting surfaces for shorter wavelengths
it is necessary to understand the dependency of the index of refraction n fromthe wavelength λ which depends on the material. It is already clear that θc willbe rather small to accomplish total re�ection. To solve those equations and �ndthe dependencies of X-rays interacting with matter, the index of refraction of there�ecting medium has to be analyzed in its complex form:
n = 1− δ − iβ (4)
where δ is the phase change, β describes the absorption, and i =√−1. According
11An electron Volt (eV) is a physical unit describing an energy. It is de�ned as the energy anelectron gains while passing a current of one volt in vacuum, therefore causing an accelerationof the electron. (Soft) X-rays start at an energy of about 1000 eV = 1 keV.
12Figure 5 and derivation after Wilms (2008)

2 IMAGING X-RAYS IN ASTRONOMY 15
Figure 6: X-ray re�ectivity of gold13
to Aschenbach (1985) β being negligible and combined with equation 3 results in:
cos θc = 1− δ, where δ = N0reZ
2πAρλ2 (5)
where re is the classical electron radius, Z is the atomic number, A is the atomicweight and ρ is the density. From d� 1, cos θc simpli�ed using a Taylor series andwith Z/A ∼ 0.5 for heavy elements follows:
θc =√
2δ = 5.6λ√ρ (6)
For wavelengths of a few Ångström this results in a critical angle of about one de-gree. Equation 6 shows the dependency of the critical angle from ρ which meansthat elements with a high density, such as gold (used for the mirror coating on theXMM-Newton satellite) or iridium (used on the Chandra satellite), have better re-�ection properties than others. It also shows that the angle decreases with shorterwavelength. Figure 6 illustrates the re�ectivity of gold in dependency of the wave-length and the angle of incidence. It can be clearly seen that the re�ection onmetal surfaces such as gold works for small angles (called �grazing incidence angle�)for energies up to a certain limit. Hence a telescope design based on small angles isnecessary while the focal length has to be in a reasonable range.
13from Wilms (2008).

2 IMAGING X-RAYS IN ASTRONOMY 16
Figure 7: Illustration of the light path in a Wolter telescope14
2.4.2 Wolter telescope design
To achieve an imaging design for X-rays, Wolter showed that a set of hyperboloid,paraboloid or elliptical mirrors in a row can be used for focusing at a grazing inci-dence angle. Detailed information can be found in Kulinder Pal Singh (2005) whichis the basis of this section. All three di�erent types of Wolter telescopes use two dif-ferent mirror types - the �rst re�ection happens on a hyperboloid (type I and II) orparaboloid (type III) mirror, the second re�ections happens either on a paraboloid(type I and II) or elliptical mirror. The most common type I is shown in �gure 7. Itcan be clearly seen that although the re�ection angle is very small the focal lengthis still reasonable, caused by the dual re�ection technology. It is obvious that thelight collecting area of a Wolter telescope is very limited due to the angular limits.With multiple arrangements of Wolter mirrors within each other, the collecting areacan be gradually increased. This system of multiple mirrors combined to cover abigger area is called �nested mirrors�. The manufacture and assembly requires a highprecision, but the technology delivers great images and research knowledge. Henceit is the state-of-the-art for soft X-ray analysis and currently �ies on the ChandraX-ray Observatory satellite (see Figure 8).
2.5 Imaging X-rays above 10 keV: Coded mask
2.5.1 Introduction
Figure 6 shows that an grazing incidence angle of 0.4 degrees or smaller would benecessary for the re�ection of photons with higher energies than approximately 10keV. This would cause a very long focal length of the instrument and therefore betotally impracticable. Hence other approaches for imaging hard X-rays must befound. Three technologies are the topics of current research: Multilayer technology,collimators and apertures with an arbitrary number of holes.
14from Wilms (2008, slide 3-38).15Courtesy of NASA and the Chandra X-ray Center.
2 IMAGING X-RAYS IN ASTRONOMY 17
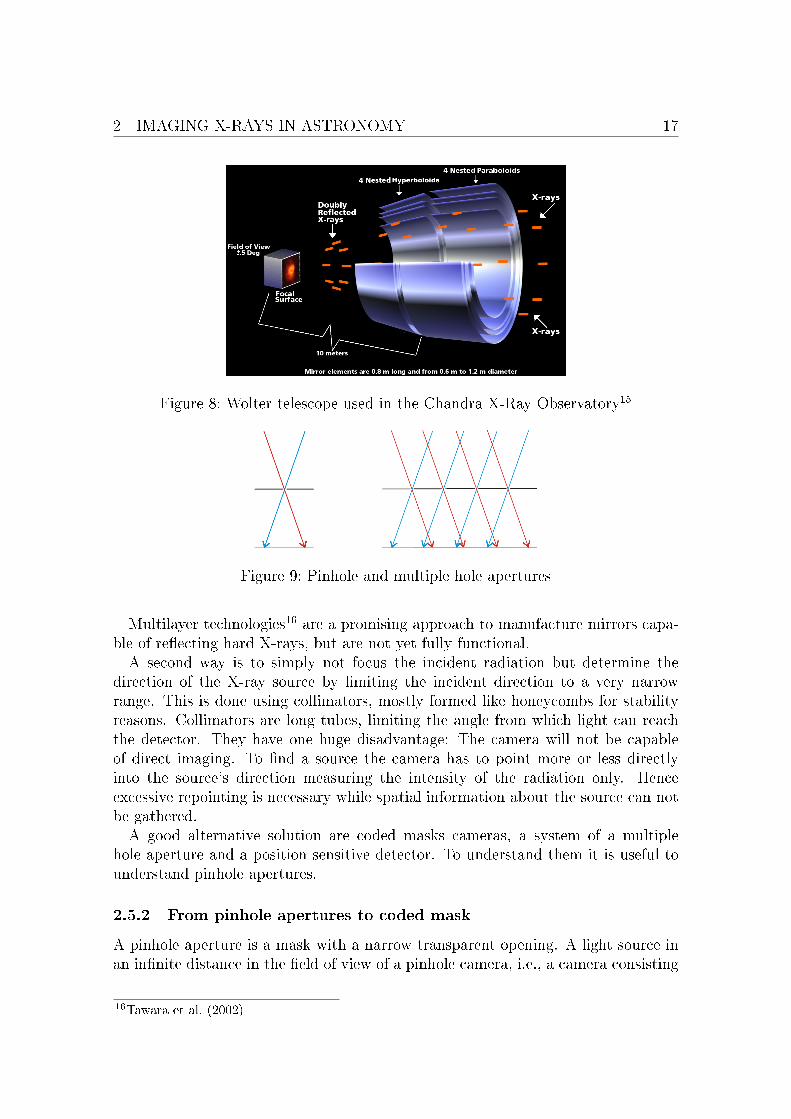
Figure 8: Wolter telescope used in the Chandra X-Ray Observatory15
Figure 9: Pinhole and multiple hole apertures
Multilayer technologies16 are a promising approach to manufacture mirrors capa-ble of re�ecting hard X-rays, but are not yet fully functional.A second way is to simply not focus the incident radiation but determine the
direction of the X-ray source by limiting the incident direction to a very narrowrange. This is done using collimators, mostly formed like honeycombs for stabilityreasons. Collimators are long tubes, limiting the angle from which light can reachthe detector. They have one huge disadvantage: The camera will not be capableof direct imaging. To �nd a source the camera has to point more or less directlyinto the source's direction measuring the intensity of the radiation only. Henceexcessive repointing is necessary while spatial information about the source can notbe gathered.A good alternative solution are coded masks cameras, a system of a multiple
hole aperture and a position sensitive detector. To understand them it is useful tounderstand pinhole apertures.
2.5.2 From pinhole apertures to coded mask
A pinhole aperture is a mask with a narrow transparent opening. A light source inan in�nite distance in the �eld of view of a pinhole camera, i.e., a camera consisting
16Tawara et al. (2002)

2 IMAGING X-RAYS IN ASTRONOMY 18
of a light-sensitive detector and a pinhole aperture, will project a faint spot onto thedetector. Knowing the location of the spot (i.e., the distance from the optical axis)and the distance between the aperture and the detector, it is trivial to specify thedirection of the source. The narrower the pinhole is, the sharper is the spot on thedetector. This makes a very accurate determination of the source's position possible,although narrowing the hole reduces the measured �ux. The procedure also worksfor an arbitrary number of sources (or any object re�ecting light). Since all photonshave to pass the single hole, a laterally reversed and upside down picture is projectedonto the detector, illustrated in Figure 9. Tracing them back to their origin worksexactly as described for only one source. This procedure is possible with light aswell as with X-rays, provided that the detector is sensitive in this waveband and thesize of the hole �ts the wavelength range.Of course there is one big disadvantage of a pinhole camera: Since the sharpness
of the image depends on the narrowness of the aperture hole, the intensity of theprojected spot will be very small. This results in a low signal to noise ratio and verylong exposure times. Furthermore only a very small part of the detector's surfaceis used if a single source is observed. To compensate for this problem, the aperturecan have more than one hole, shown in Figure 9. Such an aperture is called a �codedmask�, the whole mask-detector-system is called �coded mask camera�. A singlesource will then project one spot for each hole, therefore making a better use ofthe detector area. Still, the source can be located using the shift of the projectedpattern and the distance between the detector and the mask.If more than one source is present in a detector-mask system this will result in an
overlay of the projected pattern of each source on the detector. The combined pro-jected pattern recorded on the detector is called a �shadowgram�. It is also obviousthat tracing the projections back to the original source is non-trivial and requiresmathematical post-processing of the shadowgram. Hence coded mask cameras are apart of �computational photography�. Further information can be found in Andersonet al. (2006).The advantages of coded mask technology are obvious: Since (almost) the whole
detector area is used to form the shadowgram, single inaccuracies such as a hotpixelon the detector do not take much in�uence on the results. Also the �ux recordedfor each source is much higher compared to a single hole exposure. Some furtherinformation about the energy range of the source can be determined if the detectoris capable of recording the energy of single photons.Two di�erent forms of coded mask cameras are distinguished: Figure 10 shows a
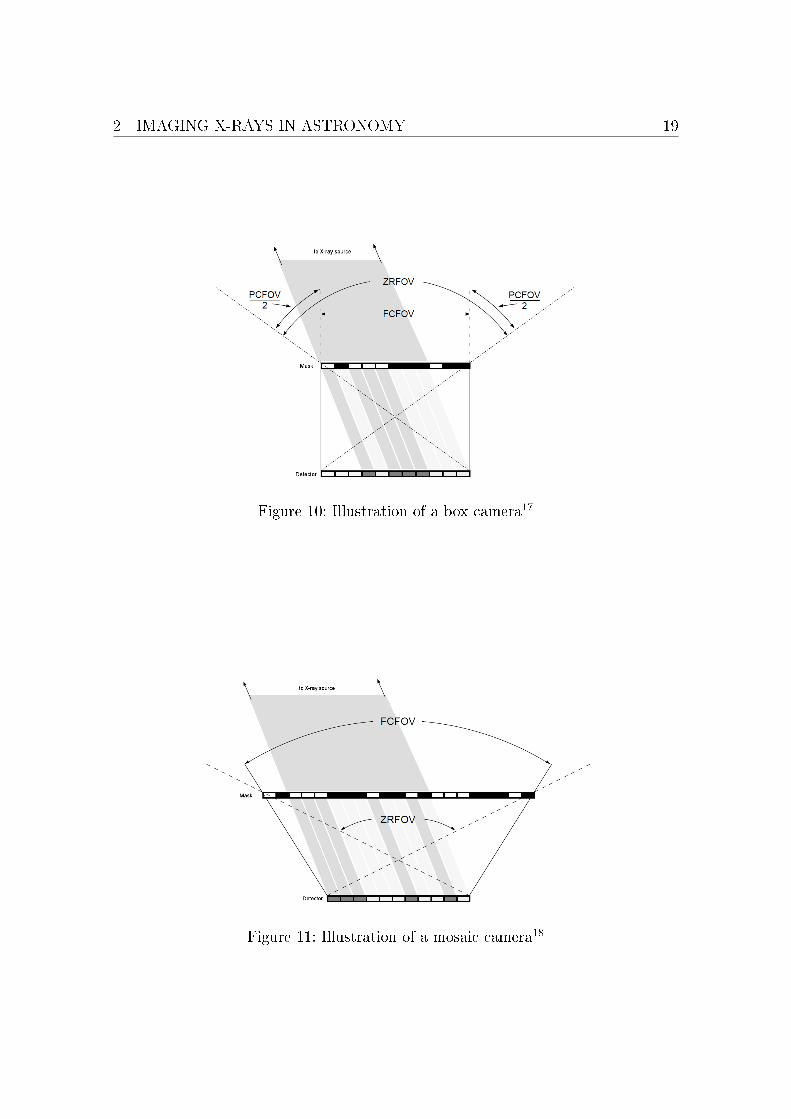
camera, where the mask area equals the detector area. This is called a �box camera�.Only sources in the direction of the optical axis will project the mask pattern ontothe whole detector surface (The region for sources ful�lling this statement is calledthe �fully coded �eld of view�, FCFOV). Sources that are o�-axis will project a partof the mask pattern that will cover the detector partially. (The region of sourcesis called the �partially coded �eld of view�, PCFOV). Reconstruction for sources in
17from Groeneveld (1999).18from Groeneveld (1999).
2 IMAGING X-RAYS IN ASTRONOMY 19
Figure 10: Illustration of a box camera17
Figure 11: Illustration of a mosaic camera18
2 IMAGING X-RAYS IN ASTRONOMY 20
the PCFOV performs less than reconstruction for sources in the FCFOV. Hence, formost coded mask cameras the mask covers a larger area than the detector, forminga layout as it is shown in Figure 11.
2.5.3 Image reconstruction
To understand the basic process of reconstructing the location and intensity ofsources some mathematical background is needed. This section is based on Groen-eveld (1999, pp.18�.) and Skinner et al. (1987) with some simpli�cations made.Let D(~x) represent the number of photons that hit the detector at the pixel
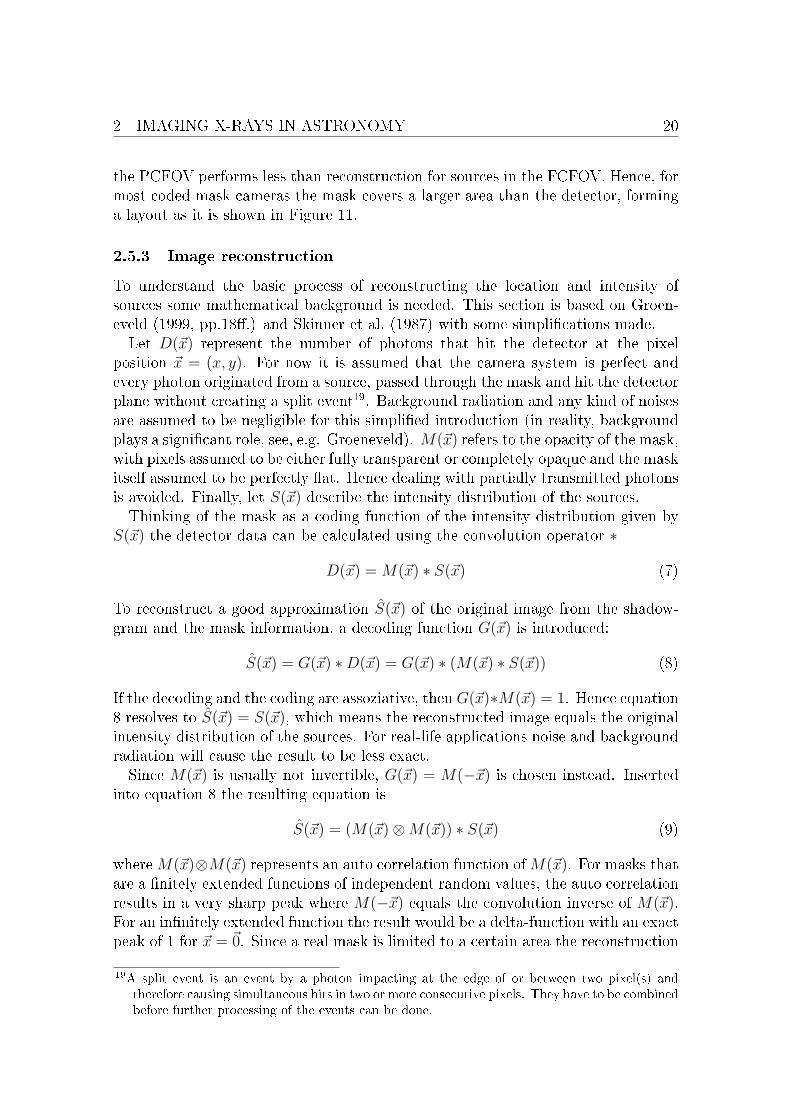
position ~x = (x, y). For now it is assumed that the camera system is perfect andevery photon originated from a source, passed through the mask and hit the detectorplane without creating a split event19. Background radiation and any kind of noisesare assumed to be negligible for this simpli�ed introduction (in reality, backgroundplays a signi�cant role, see, e.g. Groeneveld). M(~x) refers to the opacity of the mask,with pixels assumed to be either fully transparent or completely opaque and the maskitself assumed to be perfectly �at. Hence dealing with partially transmitted photonsis avoided. Finally, let S(~x) describe the intensity distribution of the sources.Thinking of the mask as a coding function of the intensity distribution given by
S(~x) the detector data can be calculated using the convolution operator ∗
D(~x) = M(~x) ∗ S(~x) (7)
To reconstruct a good approximation S(~x) of the original image from the shadow-gram and the mask information, a decoding function G(~x) is introduced:
S(~x) = G(~x) ∗D(~x) = G(~x) ∗ (M(~x) ∗ S(~x)) (8)
If the decoding and the coding are assoziative, thenG(~x)∗M(~x) = 1. Hence equation8 resolves to S(~x) = S(~x), which means the reconstructed image equals the originalintensity distribution of the sources. For real-life applications noise and backgroundradiation will cause the result to be less exact.Since M(~x) is usually not invertible, G(~x) = M(−~x) is chosen instead. Inserted
into equation 8 the resulting equation is
S(~x) = (M(~x)⊗M(~x)) ∗ S(~x) (9)
whereM(~x)⊗M(~x) represents an auto correlation function ofM(~x). For masks thatare a �nitely extended functions of independent random values, the auto correlationresults in a very sharp peak where M(−~x) equals the convolution inverse of M(~x).For an in�nitely extended function the result would be a delta-function with an exactpeak of 1 for ~x = ~0. Since a real mask is limited to a certain area the reconstruction
19A split event is an event by a photon impacting at the edge of or between two pixel(s) andtherefore causing simultaneous hits in two or more consecutive pixels. They have to be combinedbefore further processing of the events can be done.

2 IMAGING X-RAYS IN ASTRONOMY 21
has side lobes present at ~x 6= ~0. Therefore the auto correlation of a mask can beseen as the point spread function20 of the camera.
2.5.4 Masks
A mask is divided into pixels. Each pixel can be either open, i.e., fully transparentor closed, i.e., opaque. The ratio between open pixels and the complete number ofall pixels is called the �opening fraction� (OF). To allow e�cient post-processing itis important to know the exact size and shape of the mask pixels. Mostly they areeither square or hexagonal with typical sizes between a tenth of a millimeter up toa few centimeters.It is also important to understand that ideal masks only work for objects within
the FCFOV. Objects in the PCFOV will project an incomplete cut-out of the maskpattern, therefore causing more noise during reconstruction. Hence all commoncoded mask systems are mosaic cameras and might limit the �eld of view to theFCFOV by using additional collimators.In subsection 2.5.3 it was concluded that reconstructing the image from the
shadowgram created by an arbitrary mask using G(~x) = M(−~x) will result in amain peak and a number of side lobes. The ratio between those two is a good mea-surement for the quality of a mask pattern. Although the experiments of Skinner(1995) showed, that imaging with bad masks, e.g., shaped like a bicycle, is possible,it is useful to understand the creation of good patterns.A good mask pattern is given by a periodic aperture which aligns all side lobes
to an equal level, therefore making it easy to distinguish a sharp peak from an evenplateau. Therefore the aperiodic parts of a random mask need to be substitutedby a periodic pattern. Very good results are achieved using prim numbers, e.g.,Modi�ed Uniformly Redundant Array (MURA) masks, introduced by Gottesmanand Fenimore (1989). For various possible mask layouts and there quality measuredby the auto-correlation functions see Skinner and Rideout (1994).To improve the signal to noise ratio a combination of mask and anti-mask images
can be used. The anti-mask is the exact opposite of the mask: Wherever the maskhas an open pixel, the anti-mask has a solid one, and vice versa. If an exposure ofthe same object is done with the mask �rst and with the anti-mask afterwards, thecombination of both images lead to signi�cant improvements. The summation ofthe two images reduces noise and artifacts while doubling the strength of the signal.For further information about the physical background refer to Faust et al. (2003)and Accorsi (2001).
2.5.5 Image formation and reconstruction methods
Various methods for image reconstruction are possible. Most often Fast FourierTransformation or back projection is used. These two methods are described in this
20The �point spread function� describes how an imaging system responds to a point source. It isa measurement of the blurring of a perfect source in the captured image.
2 IMAGING X-RAYS IN ASTRONOMY 22
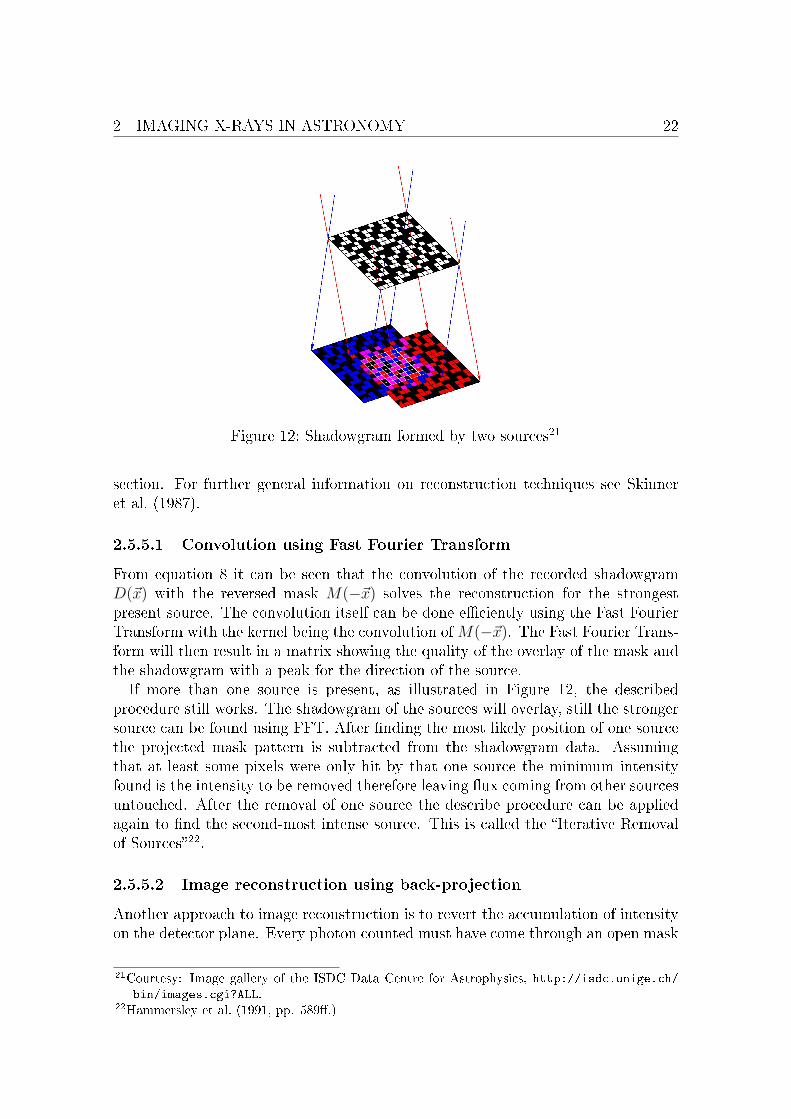
Figure 12: Shadowgram formed by two sources21
section. For further general information on reconstruction techniques see Skinneret al. (1987).
2.5.5.1 Convolution using Fast Fourier Transform
From equation 8 it can be seen that the convolution of the recorded shadowgramD(~x) with the reversed mask M(−~x) solves the reconstruction for the strongestpresent source. The convolution itself can be done e�ciently using the Fast FourierTransform with the kernel being the convolution ofM(−~x). The Fast Fourier Trans-form will then result in a matrix showing the quality of the overlay of the mask andthe shadowgram with a peak for the direction of the source.If more than one source is present, as illustrated in Figure 12, the described
procedure still works. The shadowgram of the sources will overlay, still the strongersource can be found using FFT. After �nding the most likely position of one sourcethe projected mask pattern is subtracted from the shadowgram data. Assumingthat at least some pixels were only hit by that one source the minimum intensityfound is the intensity to be removed therefore leaving �ux coming from other sourcesuntouched. After the removal of one source the describe procedure can be appliedagain to �nd the second-most intense source. This is called the �Iterative Removalof Sources�22.
2.5.5.2 Image reconstruction using back-projection
Another approach to image reconstruction is to revert the accumulation of intensityon the detector plane. Every photon counted must have come through an open mask
21Courtesy: Image gallery of the ISDC Data Centre for Astrophysics, http://isdc.unige.ch/bin/images.cgi?ALL.
22Hammersley et al. (1991, pp. 589�.)
2 IMAGING X-RAYS IN ASTRONOMY 23
pixel from a source far away. Therefore a virtual sky covering the FCFOV can beintroduced and rays originating from each detector pixel can be traced back ontothis plane. Obviously there is no information to determine which mask opening thephoton passed on its way to the detector. Hence it is useful to implement a sub-photon and throw it back through all mask openings. It is useful to set its initialintensity according to equation 10 to ensure that the total energy of the system willnot be increased through the reconstruction algorithm.
Isub-photon = Iphoton/number of(mask openings) (10)
(Side note: Another possible approach is to project the photons from the detectorthrough each mask opening using the full photon energy. After iterating throughall photons an even background is subtracted from the virtual sky.) Once the rayhits the virtual sky plane the struck sky plane pixel needs to be determined. Thiscan be simply done by intersecting the plane and the rays. The sky plane pixelaccumulates the energy, its value will be increased by the incident photon's energy.To obtain a satisfactory result a few more issues have to be considered:
• For most cameras, the detector will be smaller than the mask, usually abouthalf the size. This is necessary to obtain a larger FCFOV, otherwise evensources only slightly o� the optical axis will only partially expose the detec-tor. Since the virtual sky should cover at least the whole FCFOV and needs tobe much further away than the distance between mask and detector the planeshould be curved. This can be done by three steps: The ray is created asbefore using two points, the originating detector pixel and the mask opening.Then the three-dimensional Cartesian coordinate is calculated using the dis-tance of the spherical cutout depicting the virtual sky. These coordinates aretransformed by a spherical projection into a pixel position on an equidistantgrid.
• If a photon is always assigned to one detector pixel, information about theexact position of the hit is lost and cut down to integer accuracy. Especiallysplit events are not taken into account well enough. This requires the back-projection algorithm to either throw all photons back originating from thecenter of the pixel, hence neglecting particular possible source positions. Onthe other hand the area of the whole pixel could be projected through themask opening, causing a widening of the source position but giving a betterprobability to reach the correct source position on the virtual sky.
• The same problem applies to mask pixels as well. The exact transition pointwithin the mask pixel is not known. If the center is assumed the reconstructionmight miss the relevant portion of the virtual sky. Again the whole area canbe used for the projection with the same disadvantage: Sources are furtherwidened. An illustration is given in Figure 13. From this discussion it can beseen, that a large number of photon hits is needed to achieve satisfying resultswith coded mask imaging.

2 IMAGING X-RAYS IN ASTRONOMY 24
Figure 13: Widening caused by back-projection in far-�eld. The grey area illustratesthe segment wherein the source is located
Figure 14: Coverage of multiple detector pixels and their area ratio
2 IMAGING X-RAYS IN ASTRONOMY 25
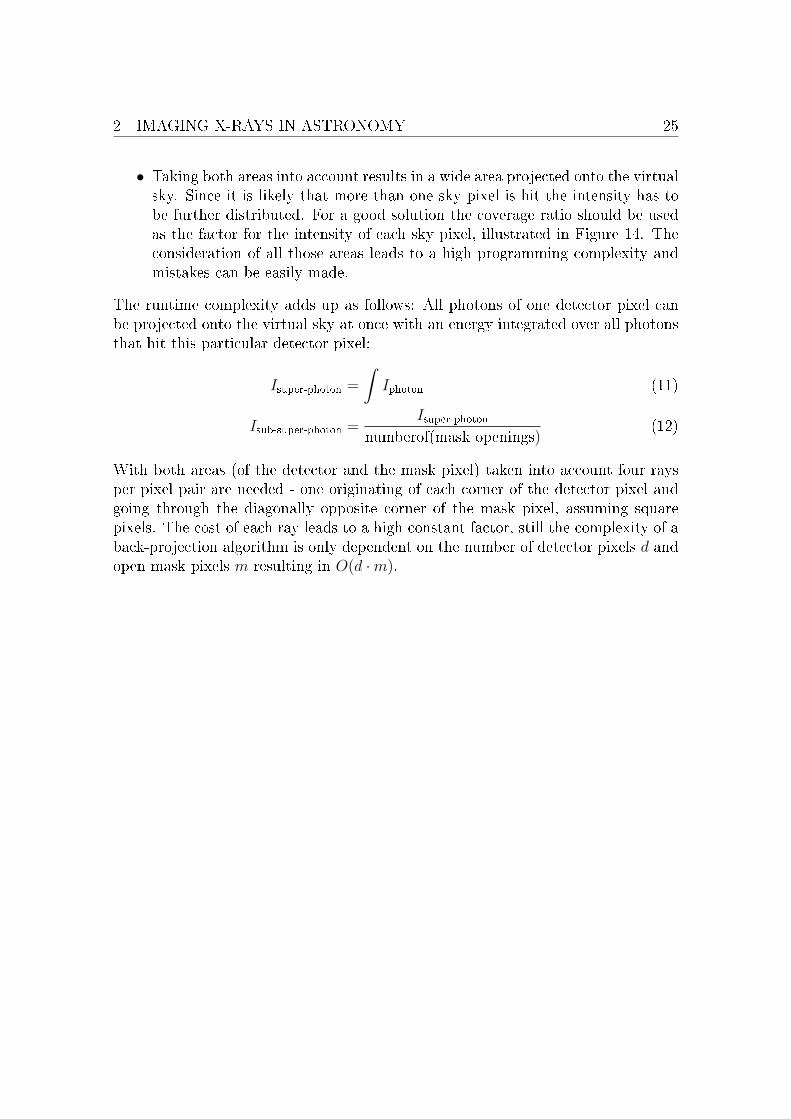
• Taking both areas into account results in a wide area projected onto the virtualsky. Since it is likely that more than one sky pixel is hit the intensity has tobe further distributed. For a good solution the coverage ratio should be usedas the factor for the intensity of each sky pixel, illustrated in Figure 14. Theconsideration of all those areas leads to a high programming complexity andmistakes can be easily made.
The runtime complexity adds up as follows: All photons of one detector pixel canbe projected onto the virtual sky at once with an energy integrated over all photonsthat hit this particular detector pixel:
Isuper-photon =
∫Iphoton (11)
Isub-super-photon =Isuper-photon
numberof(mask openings)(12)
With both areas (of the detector and the mask pixel) taken into account four raysper pixel pair are needed - one originating of each corner of the detector pixel andgoing through the diagonally opposite corner of the mask pixel, assuming squarepixels. The cost of each ray leads to a high constant factor, still the complexity of aback-projection algorithm is only dependent on the number of detector pixels d andopen mask pixels m resulting in O(d ·m).
3 NEAR-FIELD X-RAY IMAGING 26
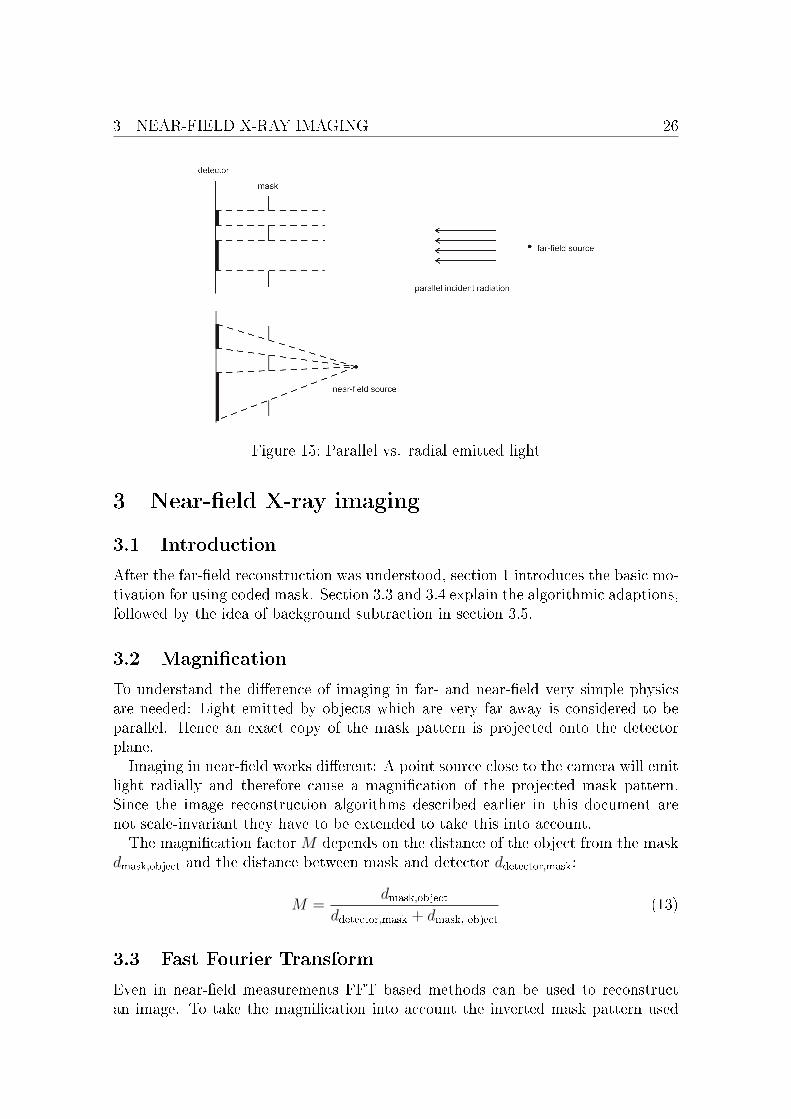
Figure 15: Parallel vs. radial emitted light
3 Near-�eld X-ray imaging
3.1 Introduction
After the far-�eld reconstruction was understood, section 1 introduces the basic mo-tivation for using coded mask. Section 3.3 and 3.4 explain the algorithmic adaptions,followed by the idea of background subtraction in section 3.5.
3.2 Magni�cation
To understand the di�erence of imaging in far- and near-�eld very simple physicsare needed: Light emitted by objects which are very far away is considered to beparallel. Hence an exact copy of the mask pattern is projected onto the detectorplane.Imaging in near-�eld works di�erent: A point source close to the camera will emit
light radially and therefore cause a magni�cation of the projected mask pattern.Since the image reconstruction algorithms described earlier in this document arenot scale-invariant they have to be extended to take this into account.The magni�cation factor M depends on the distance of the object from the mask
dmask,object and the distance between mask and detector ddetector,mask:
M =dmask,object
ddetector,mask + dmask, object
(13)
3.3 Fast Fourier Transform
Even in near-�eld measurements FFT based methods can be used to reconstructan image. To take the magni�cation into account the inverted mask pattern used

3 NEAR-FIELD X-RAY IMAGING 27
for the convolution has to be magni�ed. To determine the magni�cation factor it isnecessary to either know or guess the approximate distance of the object.The easiest solution is to just determine a valid range of distances, e.g, a minimum
distance of the object from the mask which can be increased up to in�nity and stepthrough the magni�cation factors between the limits. This requires three parameterto be set: The minimum distance of the object from the mask, the maximum distanceand the delta for one step in the magni�cation factors. For each magni�cation factorthe fourier transform has to be done and the best match is chosen. It is obvious thatthe usual complexity of a Fast Fourier Transform of O(n · log(n)) will be increasedby the number m of magni�cation factors to be taken into account. Hence thecomplexity increases to O(m · n · log(n)).The complexity issue can be solved by using binary search. Binary search is an
algorithm to locate an object in a sorted list. Further information can be foundin Cormen et al. (2001) and other algorithmic compendiums. Binary search startsby comparing the middle element of the list with the object to be searched. If theobject is smaller than the middle element, the search continues by doing the samestep again using only the bottom half of the list. Otherwise the recursion continueswith the upper half. This is done until the element is found or it is determined thatthe element does not exist. The complexity for binary search is O(log(m)) for theworst case scenario with m being the number of elements in the list.A similar idea can be used for �nding the optimal distance without calculating
FFT for all of them. The Fast Fourier Transform of the increasing distance betweenobject and mask is seen as the sorted list. The optimum is the Fast Fourier Trans-form for the one distance where the best match, e.g., the highest amount of onefrequency was found. This is equivalent to the determination of the contrast of theimage represented by the results of the convolution. For a description of contrastevaluation methods refer to Peli (1990).Since it is unclear whether the optimal result will be in the right or left half of the
search domain, binary search has to be adapted to use two middle elements instead.Finding out the direction in which the results improve tells which half needs to bepruned. The complexity of the whole algorithm including the Fast Fourier Transformadds up to O(n · log(m) · log(n)).
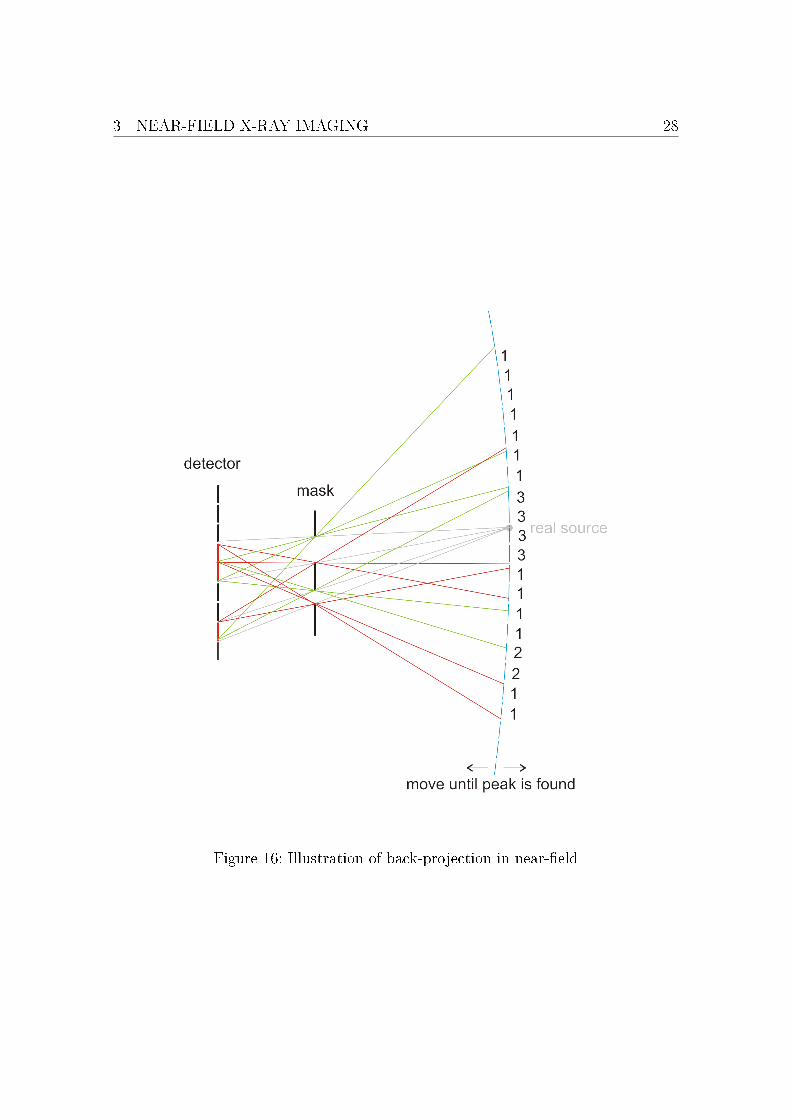
3.4 Back-projection algorithm
Another approach is the adaption of back-projection. The main idea is identicalto the back-projection reconstruction method for far-�eld coded mask imaging (seesection 2.5.5.2): Starting from every hit pixel's corner, rays are traced back throughthe diagonally opposite corners of each open mask pixel. At the intersection of eachray with the plane symbolizing the virtual sky, the intensity will be increased by anappropriate fraction dependent on the total number of open pixels in the mask.At �rst the magni�cation factor in near-�eld situations seems to be a big problem
for the back-projection algorithm. The radiation projected by a close-by sourcethrough a mask pixel is widened by the magni�cation factor of the system. Hence
3 NEAR-FIELD X-RAY IMAGING 28
Figure 16: Illustration of back-projection in near-�eld

3 NEAR-FIELD X-RAY IMAGING 29
the back-projected area will be even more widened. To understand that this issue hasno problematic e�ect, it has to be kept in mind that coded mask cameras only workif a large number of photons are captured by the detector. Therefore the overlay ofthe widened back-projected areas will still give a correct spot of the source withinthe limits of the coded mask cameras' resolution. A one-dimensional illustration fora mask with two holes is shown in Figure 16. This mask is su�cient to locate thesource to an area of four pixels.As a conclusion the back-projected algorithm can be mainly taken without any
changes except that additionally the distance of the virtual sky has to be determined.This can be done analogue to the possibilities described for the determination of thedistance of the virtual sky in the case of the FFT algorithm: The correct distancecan be set manually or chosen automatically by contrast detection.
3.5 Background subtraction
There was also the concern that near-�eld imaging su�ers from further artifactscaused by the surroundings of the detector setup. Photons are scattered on theshielding or might �re�ect� on more than one surface before hitting the detector.Two approaches are follow to minimize the in�uence of those e�ects:
1. The exposures can be done without the lead bricks in front of the detector.Photons that would normally be scattered back by the shielding bricks aredistributed into the air in front of the detector, therefore causing radiation inthe laboratory instead of adding noise to the �nal image.
2. A background could be recorded and subtracted from the image. Therefore atotal of four exposures is made: Two (mask and anti-mask) without an objectin front of the detector-system and two (mask and anti-mask) regular expo-sures of the object. After combining both background images and both objectimages the �nal image is composited by the subtraction of the backgroundfrom the image. This was not done so far, since the problem does not applyto space. This thesis proposes to take this idea into further research, henceconsidering this case in the software design.

4 EXPERIMENTAL SETUP - HARDWARE 30
Figure 17: Complete hardware setup at UCSD
Figure 18: Top view: Detector and RENA modules
4 Experimental setup - hardware
4.1 Introduction
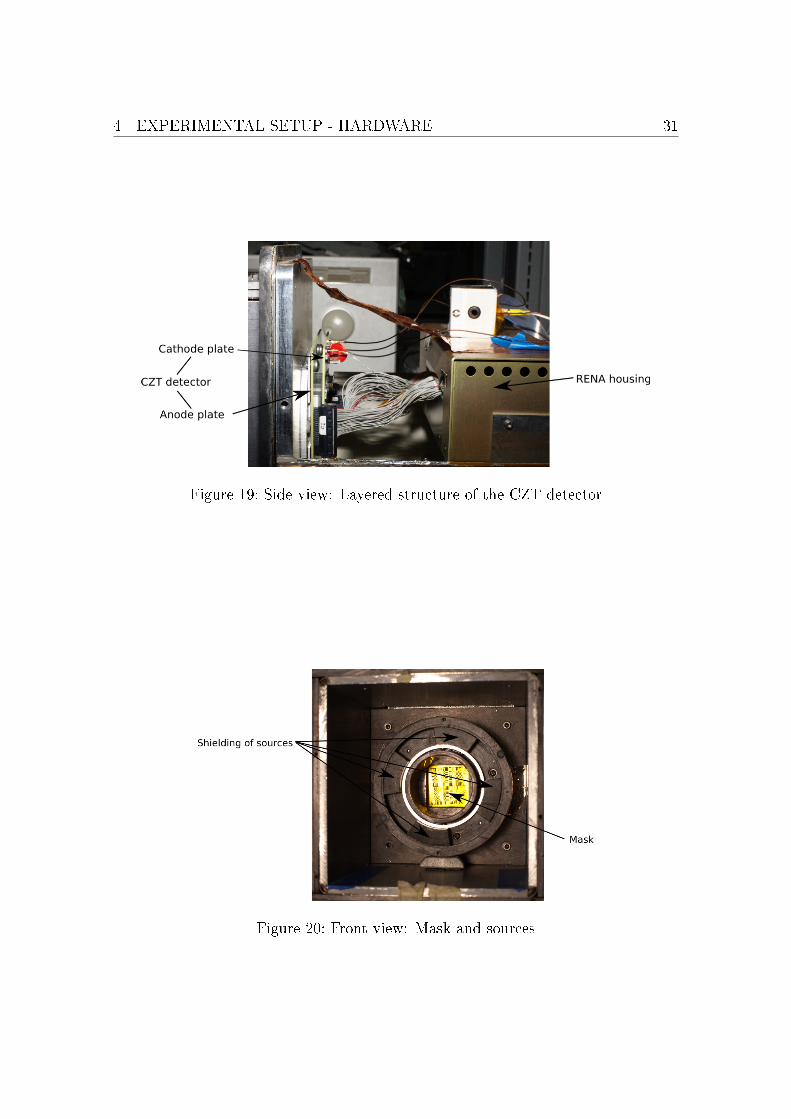
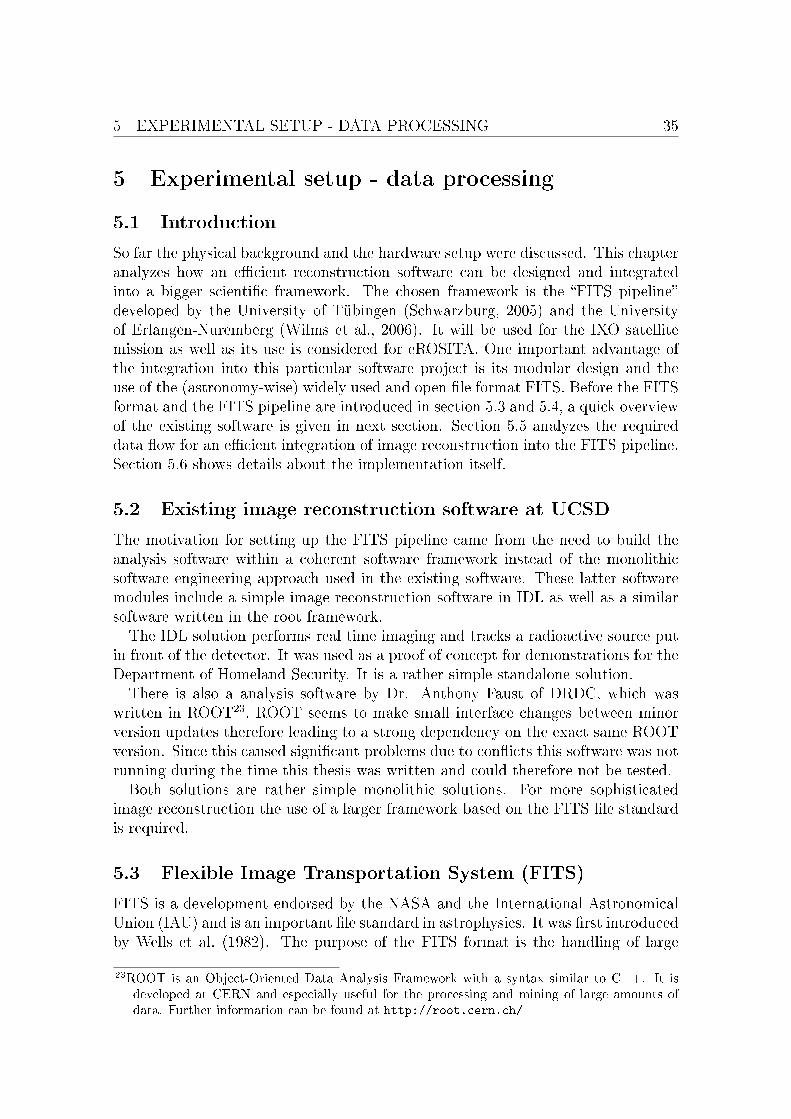
The laboratory setup at the UCSD consists of a lead box housing the radioactivesources, the mask, the detector and the RENA3 hardware to control and read-outthe detector. Figure 17 shows the complete hardware setup including an inertanti-personnel mine in front of it. The exposure is made with the object close to thedetector housing's opening with the shielding bricks removed. Figure 18 shows a topview of the detector and its power supply as well as its RENAmodules forwarding thegathered data to a computer for further processing. The side view shown in Figure19 gives an idea of the detector width of approximately 1/4 inch. The detectorused is a CZT detector capable of recording single photon hits and their energy.This is done using an anode-cathode-design. The mask can be seen in Figure 20,
4 EXPERIMENTAL SETUP - HARDWARE 31
Figure 19: Side view: Layered structure of the CZT detector
Figure 20: Front view: Mask and sources

4 EXPERIMENTAL SETUP - HARDWARE 32
Figure 21: Illustration of the coded mask setup at UCSD
with the two times four sources distributed around the mask and covered by lead.Radiation from those sources will hit an object in front of the camera. Three formsof the interaction of a high-energetic photon with matter are possible: Absorption,transmission and backscattering. The two former ones are trivial to understand.The third one can be understood as a kind of re�ection and is the one of interest forthe UCSD detector: Photons from the X-ray sources hit the object. Some of themare being backscatter in the direction of the camera. Those are recorded and usedto reconstruct an image of the object in front of the camera. A illustration of thestructure and the principal setup of hardware for backscatter imaging is shown inFigure 21.
4.2 Physical background of backscattering: Compton
The backscattering of photons is based on the Compton e�ect which is the is theinteraction between a free electron and a photon. It is useful to have a basic un-derstanding of it: Once a photon hits a free electron, the photon's energy Eph ispartially transfered into kinetic energy Ek of the electron. The photon changes itsdirection and continues with a lower energy. This is illustrated in Figure 22. Before

4 EXPERIMENTAL SETUP - HARDWARE 33
Figure 22: Compton e�ect: Interaction of a photon with a free electron
the photon and the electron collide, their energies Eph respectively Ee,0 are
Eph = hf,Ee,0 = mc2 (14)
(15)
where h is Planck's Constant, f is the frequency of the photon, m is the mass of theelectron and c is the speed of light. The impulses pph and pe are
pph =h
λ, pe = mv (16)
(17)
where v is the speed of the electron.The sum of all energies and the sum of all impulses are conserved in a perfect
system, resulting in
Eph0 = Eph,1 + Ee,cin, pph,0 = pph,1 + pe,1 (18)
(19)
where an index of 0 denotes the particle before the collision and an index of 1 denotesthe particle afterwards.The combination of the above equations shows that the wavelength change of the
backscattered photon depends on the backscattering angle ϕ only.
∆λ =h
mc(1− cos(ϕ)) (20)
4.3 The detector system
To complete the view on the hardware side of the UCSD setup, some facts about thedetector system are collected. They will be used as parameters for the simulationand reconstruction software.
• Detector:

4 EXPERIMENTAL SETUP - HARDWARE 34
Figure 23: 2× 2 MURA mask with N = 23.
� Number of cathode stripes: 32� Number of anode stripes: 32� Grid size of detector: 0.05 cm� Sources available: 4× Americium 241 and 4× Cobalt 57
• Mask:
� 2× 2 array of a MURA mask� N = 23 (see Figure 23)� Pitch: 0.0865 cm� Mask can be rotated to anti-mask
• Distance between mask and detector: 3.34 cm
• Distance between mask and end of lead box (object position A): 6.5 inch∼ 17cm
For further details on the detector system refer to Rothschild et al. (2006), Suchyet al. (2006), and Faust et al. (2003).
5 EXPERIMENTAL SETUP - DATA PROCESSING 35
5 Experimental setup - data processing
5.1 Introduction
So far the physical background and the hardware setup were discussed. This chapteranalyzes how an e�cient reconstruction software can be designed and integratedinto a bigger scienti�c framework. The chosen framework is the �FITS pipeline�developed by the University of Tübingen (Schwarzburg, 2005) and the Universityof Erlangen-Nuremberg (Wilms et al., 2006). It will be used for the IXO satellitemission as well as its use is considered for eROSITA. One important advantage ofthe integration into this particular software project is its modular design and theuse of the (astronomy-wise) widely used and open �le format FITS. Before the FITSformat and the FITS pipeline are introduced in section 5.3 and 5.4, a quick overviewof the existing software is given in next section. Section 5.5 analyzes the requireddata �ow for an e�cient integration of image reconstruction into the FITS pipeline.Section 5.6 shows details about the implementation itself.
5.2 Existing image reconstruction software at UCSD
The motivation for setting up the FITS pipeline came from the need to build theanalysis software within a coherent software framework instead of the monolithicsoftware engineering approach used in the existing software. These latter softwaremodules include a simple image reconstruction software in IDL as well as a similarsoftware written in the root framework.The IDL solution performs real time imaging and tracks a radioactive source put
in front of the detector. It was used as a proof of concept for demonstrations for theDepartment of Homeland Security. It is a rather simple standalone solution.There is also a analysis software by Dr. Anthony Faust of DRDC, which was
written in ROOT23. ROOT seems to make small interface changes between minorversion updates therefore leading to a strong dependency on the exact same ROOTversion. Since this caused signi�cant problems due to con�icts this software was notrunning during the time this thesis was written and could therefore not be tested.Both solutions are rather simple monolithic solutions. For more sophisticated
image reconstruction the use of a larger framework based on the FITS �le standardis required.
5.3 Flexible Image Transportation System (FITS)
FITS is a development endorsed by the NASA and the International AstronomicalUnion (IAU) and is an important �le standard in astrophysics. It was �rst introducedby Wells et al. (1982). The purpose of the FITS format is the handling of large
23ROOT is an Object-Oriented Data Analysis Framework with a syntax similar to C++. It isdeveloped at CERN and especially useful for the processing and mining of large amounts ofdata. Further information can be found at http://root.cern.ch/

5 EXPERIMENTAL SETUP - DATA PROCESSING 36
quantities of data in multiple dimensions, such as images, spectra or generic tablesrespectively data cubes of arbitrary values. It is the format of choice for data comingfrom all professional observatories, such as the European Southern Observatory inSouth America, the Hubble Space Telescope or the XMM-Newton satellite.Scienti�c data needs additional information for the correct interpretation, e.g.,
coordinate systems for recti�cation, calibration parameters or meta data describinghow the data were gathered. Most image formats, such as jpeg or png, do not o�erof combine image data and arbitrary additional information. FITS, on the otherhand, ful�lls this requirement and makes additional parameters in the header of theFITS �le possible. Each FITS �le consists of one or more header and data units(�HDUs�). The �rst HDU is called the �primary HDU� or �primary array�, while theadditional HDUs are called �extensions�.The header of each unit is formatted as ASCII. This has the advantage of being
human readable and editable without additional software. Each parameter is a pairof a keyword (up to 8 characters of uppercase letters, digits, hyphens and under-scores) and its value, separated by an equal sign and a single space. Due to historicalreasons of block size restrictions on tape devices the length of each keyword/valuepair including its comment must count exactly 80 characters and has to be paddedto ful�ll this requirement. There are few reserved and mandatory keywords (suchas the number of dimensions and the size of each dimension). Keywords for otherpurposes can be introduced by simply using them (and documenting there meaning)which is very useful for new developments.The header is followed by the data itself. It consists of arbitrary data in multiple
dimensions with the sizes and value type de�ned in the header.Standard extensions are �image�, �table� (�lled with ASCII characters) and �bintable�.
Furthermore various conformed extensions exist for standard tasks. User-de�ned ex-tensions are possible. Backwards compatibility is assured, hence every FITS �le thatwas valid once is granted to be valid in all further FITS versions. With these prop-erties FITS quali�es as the standard �le format for data in astrophysics. It is usedin almost all setups and a sophisticated library for accessing FITS �les as well as alarge collection of tools for FITS �le processing exists.The library is called �c�tsio� and is developed by NASA24. It o�ers e�cient rou-
tines for reading and changing data and accessing parts of FITS �les by providingthe �Extended Filename Syntax�25. This syntax extends �lenames by square brack-ets containing parameters giving the number of the HDU to read, the speci�cationof certain columns, or a range/region to read values from. This makes writing toolsfor the processing of FITS �les much easier.As mentioned before a large collection of utility tools exists, written for the cre-
ation, analysis and manipulation of FITS data. These tools form the core of the
24Information on the c�tsio library can be found at http://heasarc.gsfc.nasa.gov/fitsio/.25A complete list of �lter parameters is given on the webpage of c�tsio: http://heasarc.nasa.
gov/docs/software/fitsio/filters.html.

5 EXPERIMENTAL SETUP - DATA PROCESSING 37
HEASARC26 system for the reduction and analysis of astrophysical FITS data.27
5.4 The fpipe project
The following paragraphs give an overview why the FITS pipeline is a good choiceto serve as a framework for the image reconstruction of the HEXIS detector. Thedata processing software for most astrophysical detector projects in the past tendsto be specialized monolithic software. Still many projects use similar algorithmsand techniques. Therefore development resources are wasted and programming ordesign errors are more likely.A better solution would be a modular design aiming for reusability. Every project
should reuse the existing modules and contribute new ones that do not exist yet.This would lead to a collection of well tested and e�ciently coded modules andtherefore be a huge bene�t for astrophysical projects.Since the University of Tübingen was in need for a data processing software for
a laboratory detector project they decided to develop it under these criteria. Aframework to perform data processing with a combination of FITS tools as well as a�rst set of FITS tools for this project was designed and implemented. This projectis called the �FITS pipeline� or �fpipe� and bases, according to Wilms et al. (2006)and Schwarzburg (2005), on the following requirements:
• The steps of data processing are separated, each step is performed by one mod-ule specialized for this particular task. This is basically the UNIX philosophyof �one job - one tool�: Each software program should do exactly one thingand be good at doing that one. Therefore the bloating of software is avoidedand e�ciency is promoted.
• The pipeline itself is de�ned by a XML �le describing the data �ow throughthe pipeline and the way the modules should be connected to each other. Thisis done by the pipeline driver and can be controlled with a GUI. The driver isresponsible for triggering the individual modules once input data is availablefor them. Communication between the driver and the modules or between twomodules is done using XPAMessaging, �rst introduced by Mandel et al. (1995).Additional information about XPA can be found in Schwarzburg (2005).
• Data are read or written from respectively to FITS �les or streams. Exceptionsare the tools that convert input data into FITS �les or that export processeddata into other formats. For the data exchange between modules, the FITSformat is used exclusively in either regular �les or shared memory segments.
• Basic support for existing ftools is implemented, therefore not only ftools de-veloped speci�cally but all ftools within certain standards can be used withinthe pipeline.
26NASA's High Energy Astrophysics Science Archive Research Center27see http://heasarc.gsfc.nasa.gov/ftools/ftools_intro.html
5 EXPERIMENTAL SETUP - DATA PROCESSING 38
• The fpipe works near realtime. This is done by two properties: Firstly, everysingle module needs to use e�cient algorithms that can handle the incomingdata stream without causing further delays. Secondly, the pipeline driver isdesigned to continuously feed data from one module to the next one as soonas the predecessor o�ers it. It is not necessary that all data were alreadyprocessed.
This design enables us to reuse software. If a di�erent task is to be performed,it can be done by simply changing the pipeline description �le, aka the way ofcombining a certain choice of modules. Many projects will require a common subset,hence those projects can use the existing modules. The FITS pipeline quali�esfor its use in a lot of similar projects, for both, laboratory/o�ine analysis as wellas reallife/online usage. The fpipe is used in testing parts of the IXO setup inTübingen and at FAU Erlangen-Nuremberg and considered to be used in eROSITAdata processings as well. For further information on the properties of the FITSpipeline please refer to Schwarzburg (2005).
5.5 Data �ow
To use the fpipe for the image reconstruction of data from a near-�eld coded masksystem the necessary data �ow has to be analyzed. The following steps have to beperformed:
• Read the hits from the detector and transform them to events28. In this stage,calibration is performed and data can be dumped to �les for processing at afuture time.
• Image reconstruction is performed on the events. For FFT this happens aftera transformation step of the events into a shadowgram. Back-projection worksdirectly on the eventlist.
• Both ways of image reconstruction return a FITS �le with an image of thereconstructed virtual sky. A module is needed to display this image and exportit into other �le formats.
• To be independent from the detector system a module simulating a codedmask camera is required.
Figure 24 shows how the image reconstruction of data gathered from the detectorsystem is done in the pipeline. From section 2.5.4 it is known that signi�cantlyimprovements of the image quality can be made by combining mask and anti-mask
28The term �event� refers to a photon being registered by the detector. A �hit� refers to theoccurrence of energy transmitted by a photon in a detector pixel. One photon can causeseveral hits in adjacent detector pixels. They have to be combined by a cleaning stage to forman event.

5 EXPERIMENTAL SETUP - DATA PROCESSING 39
Figure 24: Data �ow

5 EXPERIMENTAL SETUP - DATA PROCESSING 40
Figure 25: The combination of images in the pipeline
images. Furthermore section 3.5 suggested the subtraction of the combined back-ground image. Hence the data �ow described above was extended to process up tofour image (represented by /4 in the data �ow diagram) respectively up to two im-age (represented by /2, applies for the simulation which is currently not designed tosimulate any noise) which are combined before being displayed or exported. The wayof combining the images in the pipeline is shown in Figure 25. Further explanationswhy this is done in the illustrated way can be found in section 5.6.8.
5.6 Implementation
5.6.1 Overview
The section describes the design of the modules listed in the data �ow diagram.The parameters, feature requirements, implementation and status is given for eachof the modules.
5.6.2 getEvents: transform hits to events
Purpose
The hits read by the detector system and forwarded to this module by a socketneed to be cleaned and calibration needs to be performed. The �nal set of events isstreamed into the fpipe through another socket.

5 EXPERIMENTAL SETUP - DATA PROCESSING 41
Parameters
• hits: list of �lenames to read the hits from (optional, only in the o�ineversion of the software)
• host:port the socket where the hits are received (optional, only in the onlineversion of the software)
• calibration: �lename of calibration information (mandatory)
Features
Two versions of this module exist: One works directly on live detector data. In thiscase, data are read from a socket connection to the windows machine controlling thedetector system. After transforming the hits to events and calibrating them (thisstep is called pre-processing) the events are stored in a ringbu�er and streamed tothe fpipe as soon as a connection is established. The o�ine version consists of twoparts: Part A receives the hits from the detector through the formerly describedsocket and dumps the data into (a) �le(s). These �les can be parsed at a futuretime by part B. Part B is responsible for reading the hits from �le, performing thesame pre-processing as the online version and streaming the events to the fpipe asdescribed before.
Details about the implementation
Hits are cleaned by the following criteria: The hits of split events are de�ned by anidentical timestamp and up to three adjacent cathode and anode hits. This meansa maximum of nine hits can be combined to one event. If more than three or non-adjacent hits occur at the same time, they are removed from the list as invalid hits.The event position is truncated down to integers representing the pixel number in(x, y) direction. Afterwards a detector calibration matrix is applied. The cleanedevents are stored in a bu�er for streaming them to the fpipe. The modules listenson a socket and provides the data as soon as a connection was established.The protocol for the stream needs to separate up to four di�erent sets of events:1. Background recorded with mask2. Object recorded with mask3. Object recorded with anti-mask4. Background recorded with anti-mask
The assumption is made that putting the object in front of the camera and removingit again does not change the background while a change from mask to anti-maskback to mask could cause little inaccuracies in the mask alignment. Hence thisorder is a good pick and therefore a mandatory property of this protocol. The setsof events are separated by special events, therefore empty sets can be used if someof the four exposures were not made. For the o�ine version the implementation ofthis feature is easy, in case of an omitted �lename or an empty �le only the specialevent is sent. For streaming with the online version further con�guration is needed
5 EXPERIMENTAL SETUP - DATA PROCESSING 42
to determine which of the sets the Windows machine controlling the detector systemsends in which order.Each event is a quadruple of values: Two integers describing the (x, y) position in
terms of the anode- and cathode-index, a �oat representing the energy of the eventand an integer giving a timestamp. Since (x, y) can not be negative for valid events,the special event sets x = −1, y = −1 thus indicating the end of the set of events.
Status
This module works as described and credits for help with the implementation go toTom Gasaway of UCSD. Improvements could be made by interpolating split eventsinto �oating point numbers therefore getting a better resolution than the detectorpixels would allow, assuming that most events will in�uence adjacent pixels, too.
5.6.3 FPPbBoxToEventlist: Convert data from lead box to eventlist
Purpose
This module is the �rst stage in the FITS pipeline. It reads data and dumps themin FITS �les. This process is called �tsifying.
Parameters
• host:port speci�es the server delivering the event data. (mandatory)
• background-mask: �lename output (mandatory)
• object-mask: �lename output (mandatory)
• object-antimask: �lename output (mandatory)
• background-antimask: �lename output (mandatory)
Features and implementation details
This module connects to the server socket. The output �les are opened in any caseand the events are written into them. If not all four sets of events are provided bythe server, the corresponding output eventlists will be empty. This gives subsequentmodules in the data �ow the chance to detect this and handle it appropriately.
Current status
Module is in draft status. If �ltering is needed, e.g., considering only certain timeframe or energy band, this should be done after this step. Modules for �lteringeventlists are already part of the FITS pipeline project.

5 EXPERIMENTAL SETUP - DATA PROCESSING 43
5.6.4 FPEventsToShadowgram: Accumulate the events to a shadowgram
Purpose
This module reads an eventlist and transfers it to a shadowgram.
Parameters
• inputfile: �lename of the FITS �le containing the eventlist (mandatory)
• outputfile: �lename of the FITS �le to write the �nal shadowgram to(mandatory)
• x-size: size of the shadowgram/number of detector pixels in x (mandatory)
• y-size: size of the shadowgram/number of detector pixels in y (mandatory)
Features and implementation details
First, memory of the given size is allocated and all pixel values are initialized to 0.For each event in the list the corresponding pixel's value is incremented. It is obviousthat the timestamp can be discarded. Because further processing algorithms, thatbase on the shadowgram as an greyscale image, have no need for it, this applies forthe energy as well.
Current status
Module is in draft status. Improvements considered are the automatic detection ofthe (x, y) size. This could be either done by adding the detector pixel number to theheader of the eventlist �les (which requires adding them to the socket protocol aswell) or by an additional pass through the eventlist before accumulating the values.
5.6.5 FPCMSimulator: Coded mask Monte Carlo simulation
Purpose
To simulate an coded mask camera used in near-�eld a Monte Carlo simulation waswritten. This has the advantage that real-life properties such as calibration issues,noise, artifacts and background scattering do not occur. The image reconstructioncan be evaluated in a perfect environment and results of the real-life setup andthe simulation can be compared. Furthermore the simulator makes an examinationof detector failures possible: Broken pixels or stripes can be simulated in software(instead of manipulating the laboratory setup) and their in�uence on the imagereconstruction can be evaluated.For a Monte Carlo simulation in far-�eld applications refer to Vadawale et al.
(2005).

5 EXPERIMENTAL SETUP - DATA PROCESSING 44
Parameters
• source-position: Determines the three-dimensional Cartesian coordinate ofa source (one mandatory, more than one optional)
• source-intensity: If more than one source is present, this value is used todetermine a ratio between the sources (optional, defaults to 1)
• det-pixel-num: Number of pixels in x- and y-direction, assuming a squaredetector (mandatory)
• det-pixel-size: Length of the edge of one detector pixel (mandatory)
• distmaskdet: Distance between mask and detector (mandatory)
• mask: FITS �le specifying the mask design (mandatory)
• mask-pixel-size: Length of the edge of one mask pixel (mandatory)
• photons: number of photons for the Monte Carlo simulation. (optional, de-faults to 1 000 000)
• shadowgram-mask: �lename to write the shadowgram of the mask simulationinto (mandatory)
• shadowgram-antimask: �lename to write the shadowgram of the anti-masksimulation into (mandatory)
Features
To simulate the detector a Monte Carlo simulation is used. This means that a largenumber of random photons are created. Those photons are traced and a virtualdetector pixel is incremented if the photon reaches it. This way of simulating requiresthe number of photons to be very large.The described procedure is performed for both, mask and antimask. After all
photons were simulated, the shadowgram of the mask exposure and the shadowgramof the anti-mask exposure is saved in a FITS �le.
Details about the implementation
Before the simulation process itself starts, the source intensities are normalized.They are required to add up to 1, therefore the normalized intensity is transformedto a value between 0 and 1 giving the likelihood that a photon originates from thissource. These values are used for the photon distribution. The next step is therandomized generation of moving photons according to the calculated distribution.These photons are then traced onto the coded mask camera.

5 EXPERIMENTAL SETUP - DATA PROCESSING 45
Figure 26: Data �ow of photon processing
Current status
The camera is de�ned in the following way: The optical axis equals the x-axis, withthe mask in the origin of the coordinate system and the detector being at x = −1.If the randomized photon is moving perpendicular to or away from the camera(x ≥ 0) it is discarded. Otherwise the intersection between the photon path and themask plane is calculated using simple geometry. If the intersection point is out ofthe mask bounds, the photon is discarded. Otherwise the intersection between thephoton and the detector plane is calculated. Again the photon is discarded if it doesnot hit the detector area. At this point only photons remain that passed through thearea of the mask and hit a detector pixel. To calculate both, mask and anti-maskshadowgrams, at once a knack is used: If the photon passed the mask at a openpixel, the hit detector pixel of the mask shadowgram is incremented. On the otherhand the corresponding anti-mask shadowgram pixel is incremented if the photonpassed the mask at a close pixel. Since all open anti-mask pixels are close maskpixels and vice versa this is a good strategy to simulate both exposure at the sametime. For a better understanding the processing of each photon has been illustratedin Figure 26.
Current status
The basic functionality was implemented as described above. The implementationis considered to be at a alpha state since many details could be solved in a moresophisticated way, e.g. an arbitrary number of sources should be allowed. Animportant improvement and additional feature should make photons originating
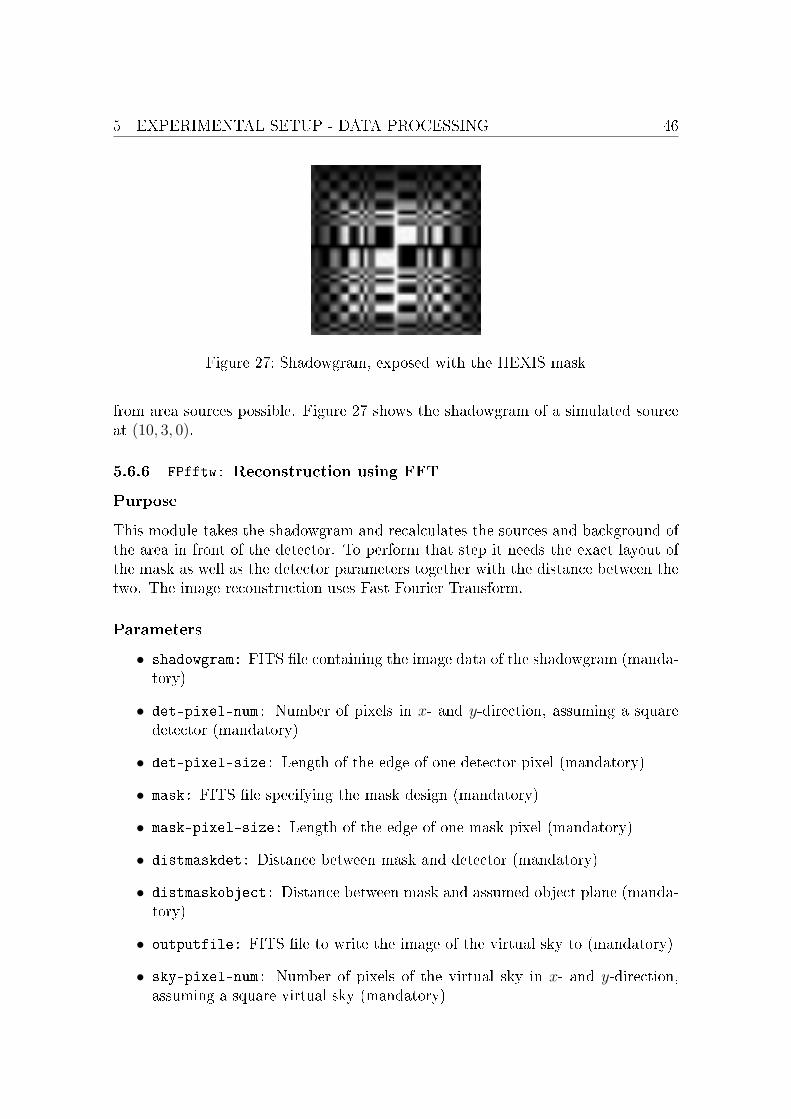
5 EXPERIMENTAL SETUP - DATA PROCESSING 46
Figure 27: Shadowgram, exposed with the HEXIS mask
from area sources possible. Figure 27 shows the shadowgram of a simulated sourceat (10, 3, 0).
5.6.6 FPfftw: Reconstruction using FFT
Purpose
This module takes the shadowgram and recalculates the sources and background ofthe area in front of the detector. To perform that step it needs the exact layout ofthe mask as well as the detector parameters together with the distance between thetwo. The image reconstruction uses Fast Fourier Transform.
Parameters
• shadowgram: FITS �le containing the image data of the shadowgram (manda-tory)
• det-pixel-num: Number of pixels in x- and y-direction, assuming a squaredetector (mandatory)
• det-pixel-size: Length of the edge of one detector pixel (mandatory)
• mask: FITS �le specifying the mask design (mandatory)
• mask-pixel-size: Length of the edge of one mask pixel (mandatory)
• distmaskdet: Distance between mask and detector (mandatory)
• distmaskobject: Distance between mask and assumed object plane (manda-tory)
• outputfile: FITS �le to write the image of the virtual sky to (mandatory)
• sky-pixel-num: Number of pixels of the virtual sky in x- and y-direction,assuming a square virtual sky (mandatory)
5 EXPERIMENTAL SETUP - DATA PROCESSING 47
• sky-pixel-size: Length of the edge of one virtual sky pixel (mandatory)
• sampling-factor: Number of subpixels forming one regular pixel (manda-tory)
Features
This module performs a Fast Fourier Transform, following the algorithm that wasdescribed in section 3.3. Di�erent mask and detector pixels sizes and number haveto be treated. This is done using a sampling factor which increases the resolutionand therefore the runtime complexity of the algorithm.
Details about the implementation
First, shadowgram and mask are read from the given FITS �les. The FFT is per-formed by the �tw3 library29. This approach requires both images to have the samepixel size and number. For most setups, the size of projected mask pixels (whichare magni�ed in near-�eld setups) and detector pixels di�ers, hence subsampling isused. The following steps are performed (assuming that the mask area is bigger orequal the detector area):
• Memory for the subsampled mask image and the subsampled shadowgram isallocated with a dimension of mask-pixel-num * sampling-factor valuesfor each direction.
• The mask image values are copied into the subsampled mask image, each reg-ular pixel is represented by sampling-factor × sampling-factor subpixels.
• The corrected sampling-factor for detector-pixels is calculated by
sampling-factor
mask-pixel-size· det-pixel-size (21)
• The shadowgram values are copied into the subsampled shadowgram usingthe corrected sampling-factor. Since the shadowgram will be smaller than theavailable area, it is centered. Unde�ned values surrounding the subsampledshadowgram are �lled with zero (this is done by initializing the array withzeros at the time of creation).
Afterwards, a FFT plan is calculated for the shadowgram and the projected maskpattern and FFT is performed on both planes. In the next step, the correspondingvalues of the two complex results are multiplied. The multiplied values are thentransformed by the Inverse Fast Fourier Transform. The result is interpreted as thevirtual sky and written to the FITS output �le.
29A comprehensive documentation on the �tw3 library can be found on the �tw3 webpage: http://www.fftw.org/fftw3_doc/.
5 EXPERIMENTAL SETUP - DATA PROCESSING 48
Current status
This module is in alpha state. It is currently limited to perform Fast Fourier Trans-form on equally sized detector and mask image. Furthermore, the distance to theobject is not automatically determined as suggested in section 3.3.
5.6.7 FPBackproject: Reconstruction using back-projection
Purpose
This module takes the eventlist of the detector and recalculates the sources andbackground of the area in front of the detector using the back-projection algorithmdescribed in section 3.4. The back-projection algorithm takes the energy of thephotons into account. Therefore please note that this module di�ers from the FPfftwinterface by using the eventlist instead of the shadowgram as its input.
Parameters
• eventlist: FITS �le containing the list of the photon events (mandatory)
• det-pixel-num: Number of pixels in x- and y-direction, assuming a squaredetector (mandatory)
• det-pixel-size: Length of the edge of one detector pixel (mandatory)
• mask: FITS �le specifying the mask design (mandatory)
• mask-pixel-size: Length of the edge of one mask pixel (mandatory)
• distmaskdet: Distance between mask and detector (mandatory)
• distmaskobject: Distance between mask and assumed object plane (manda-tory)
• outputfile: FITS �le to write the image of the virtual sky to (mandatory)
• sky-pixel-num: Number of pixels of the virtual sky in x- and y-direction,assuming a square virtual sky (mandatory)
• sky-pixel-size: Length of the edge of one virtual sky pixel (mandatory)
Features and Implementation
The module needs to iterate through all detector pixels. If a pixel had at least onephoton event, basic geometry is used to calculate four rays for each open mask pixel,originating from the four corners of the pixel. To determine the origin of each ray,the (x, y) coordinate has to be transformed into a Cartesian coordinate by takingthe size of the detector pixels into account. Rays are de�ned by the corner of thepixel and

5 EXPERIMENTAL SETUP - DATA PROCESSING 49
1. the bottom left corner of the mask pixel for rays originating from the upperright corner of the detector pixel.
2. the bottom right corner of the mask pixel for rays originating from the upperleft corner of the detector pixel.
3. the upper right corner of the mask pixel for rays originating from the bottomleft corner of the detector pixel.
4. the upper left corner of the mask pixel for rays originating from the bottomright corner of the detector pixel.
Each ray is then intersected with the plane representing the virtual sky. The Carte-sian intersection point has to be transformed back into a pixel coordinate of thevirtual sky array. If the four rays of one detector pixel do not hit the same virtualsky pixel, a double nested loop is used to increment all pixels in between the fourcorners on the virtual sky.In all steps the photon energy needs to be distributed according to the number of
possibilities: The energy of all photons in one detector pixel is added up and thendivided by the number of open mask pixels multiplied with the number of hit virtualsky pixels.
Current status
This module is in draft state. Improvements can be made by the automatic deter-mination of the distance between mask and object. Furthermore, the accuracy canbe improved by distributing the energy by the area ratio of the virtual sky pixelsthat have been hit.
5.6.8 FPCombineImages: Combine mask/anti-mask and background im-ages
Purpose
This module opens two images of the same size and combines the values of corres-ponding pixels according to the given mathematical operation.
Parameters
• infile1: �lename of FITS �le containing source image one (mandatory)
• infile2: �lename of FITS �le containing source image two (mandatory)
• outfile: �lename of FITS �le to write the resulting image to (mandatory)
• operator: string specifying the mathematical operation �add�, �sub�, �mul�or �div� (mandatory)

5 EXPERIMENTAL SETUP - DATA PROCESSING 50
Features and Implementation
Before the actual implementation is discussed, the interface and idea should beclari�ed. First approaches of implementing this modules combined all four imagesin one run with a �xed order of operations. This has the advantage of producingless overhead for reading and writing �les but is less �exible. Since the overheadshould not be to high for the image sizes used in this setup, a decision for a more�exible solution was made. Therefore this module o�ers the combination of twoimages with an arbitrary operation which makes the pipeline driver responsible toapply this module in the correct way.The combination works as follows: The two FITS input �les have to be opened
and read. The �rst step is to ensure that both image planes have the same size.Otherwise this module terminates with an error message and an negative exit code.An image plane for the resulting image is allocated. Afterwards the values of thetwo input images are traversed and each two corresponding pixels are combinedaccording to the operator. As a �nal step the resulting image is written to theoutput �le.The data �ow for coded mask image reconstruction in near-�eld requires addition
and subtraction only � still, multiplication and division are o�ered for further use inother projects. While addition and multiplication are commutative, subtraction anddivision require to take the order into account. The �rst input �le is taken as thesubtrahend respectively the dividend, the second input �le represents the minuendrespectively divisor. Note that pixel values of the divisor could equal zero. In thatcase the result of the division is not de�ned. The corresponding output pixel is setto NaN.
Current status
Works as described above.
5.6.9 FPImage: 2D imager
Purpose
This ftool reads a two-dimensional image from a FITS �le and displays it. The GUIgives the user the ability to interact with the view or export the image to another�le format. There are some reasons to write a new image viewer instead of usingexisting work: Only a few of the widely spread image viewers are capable of readingFITS �les. Those that are are usually bloated and/or can not be easily integrate intothe pipeline. Furthermore, none of the available FITS viewers would have ensuredthe tight interoperability with fpipe required.30
30The only option of a third-party reader considered for this project was the astronomical datavisualization application �SAOImage DS9� (http://hea-www.harvard.edu/RD/ds9/). It iscapable of reading FITS �les and supports XPA, hence it could have been integrated into fpipe.It is a rather big and powerful application. We decided for a small and lightweight imager andtherefore discarded DS9.
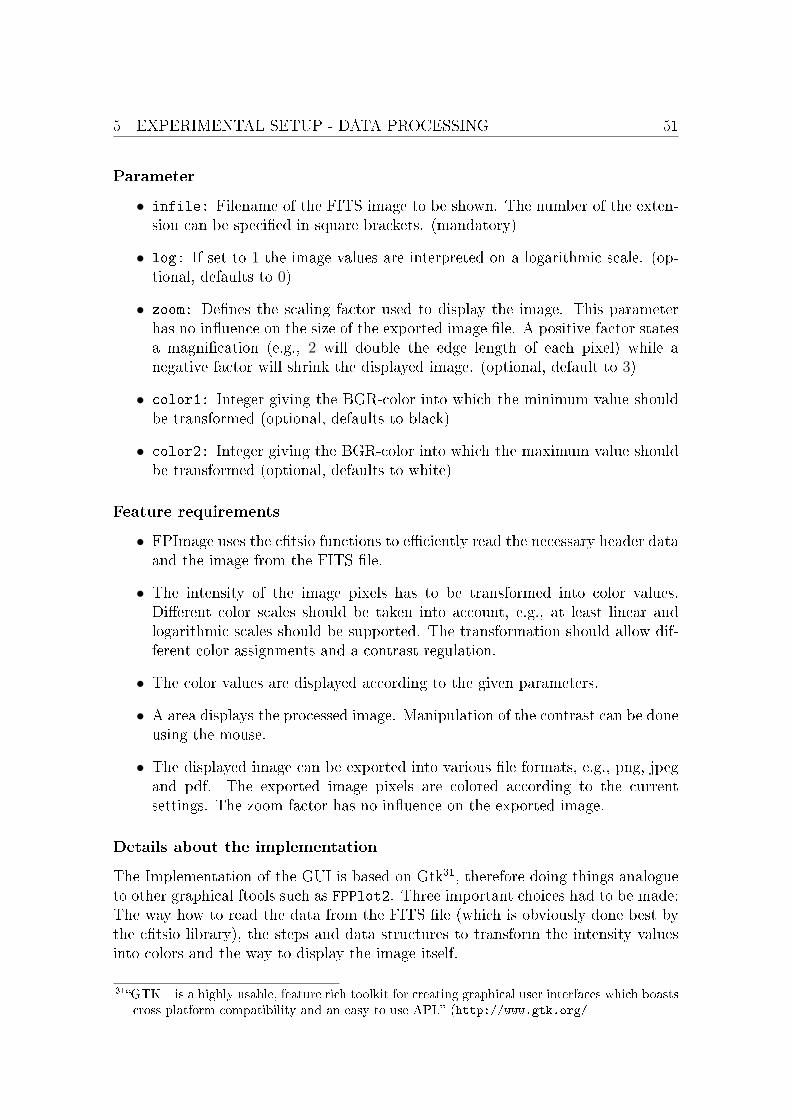
5 EXPERIMENTAL SETUP - DATA PROCESSING 51
Parameter
• infile: Filename of the FITS image to be shown. The number of the exten-sion can be speci�ed in square brackets. (mandatory)
• log: If set to 1 the image values are interpreted on a logarithmic scale. (op-tional, defaults to 0)
• zoom: De�nes the scaling factor used to display the image. This parameterhas no in�uence on the size of the exported image �le. A positive factor statesa magni�cation (e.g., 2 will double the edge length of each pixel) while anegative factor will shrink the displayed image. (optional, default to 3)
• color1: Integer giving the BGR-color into which the minimum value shouldbe transformed (optional, defaults to black)
• color2: Integer giving the BGR-color into which the maximum value shouldbe transformed (optional, defaults to white)
Feature requirements
• FPImage uses the c�tsio functions to e�ciently read the necessary header dataand the image from the FITS �le.
• The intensity of the image pixels has to be transformed into color values.Di�erent color scales should be taken into account, e.g., at least linear andlogarithmic scales should be supported. The transformation should allow dif-ferent color assignments and a contrast regulation.
• The color values are displayed according to the given parameters.
• A area displays the processed image. Manipulation of the contrast can be doneusing the mouse.
• The displayed image can be exported into various �le formats, e.g., png, jpegand pdf. The exported image pixels are colored according to the currentsettings. The zoom factor has no in�uence on the exported image.
Details about the implementation
The Implementation of the GUI is based on Gtk31, therefore doing things analogueto other graphical ftools such as FPPlot2. Three important choices had to be made:The way how to read the data from the FITS �le (which is obviously done best bythe c�tsio library), the steps and data structures to transform the intensity valuesinto colors and the way to display the image itself.
31�GTK+ is a highly usable, feature rich toolkit for creating graphical user interfaces which boastscross platform compatibility and an easy to use API.� (http://www.gtk.org/

5 EXPERIMENTAL SETUP - DATA PROCESSING 52
The intensity values are �rst cropped to the region of interest determined bycontrast-width and contrast-offset. The initial values for these settings are:
contrast-width = max(pixels) - min(pixels);
contrast-offset = min(pixels)}
Afterwards the values are transformed to a double between 0 and 1 using a linearor logarithmic scale. An additional scale can be applied to the transformed valuesin future versions. Since two color values can be set for the minimum and maximumvalue to be displayed, the resulting double array is linear transformed into colorvalues and saved in a GdkPixbuf.This GdkPixbuf then needs to be display according to certain parameters. In
the �rst version of the implementation this was done manually: An own widget,inheriting from GdkDrawingArea, was written. It �rst magni�ed the value arrayaccording to the zoom factor and painted it into the DrawingArea using cairo.Export was done using a cairo surface inherited as PDF, PS, or SVG surface.Once the implementation started to take interpolation methods for arbitrary
zooming into account it was decided that this implements a lot functionality al-ready done by existing GtkWidgets. After further research it was decided thatGtkImageView32 should be used. It is available in most modern distributions andits code appears to be in a good stable state. GtkImageView takes a GdkPixbuf anddisplays it according to a zoom parameter and callbacks that can be used to extendthe functionality of GtkImageView. Callbacks are currently used to grab the mousemovement and status to use it for contrast detection.
Current status
The basic functionality was implemented with most of described features. Twoscreenshots showing two images with di�erent color scales are shown in Figure 28and 29. Many details need to be improved and some advanced features added:Callbacks should read the pointer position and display the corresponding value ofthe pixel. Furthermore a 3×3 pixel block should be added, showing the surroundingsof the current pointer position.
32For further information please refer to http://trac.bjourne.webfactional.com/chrome/
common/gtkimageview-docs/ or to the documentation of GtkImageView provided by yourdistribution. Note that there is another GtkWidget named GtkImageViewer. Both were com-pared during the development of the imager and the decision for GtkImageView was based onthe code basis, interface, features and popularity. Hence GtkImageViewer was not used.
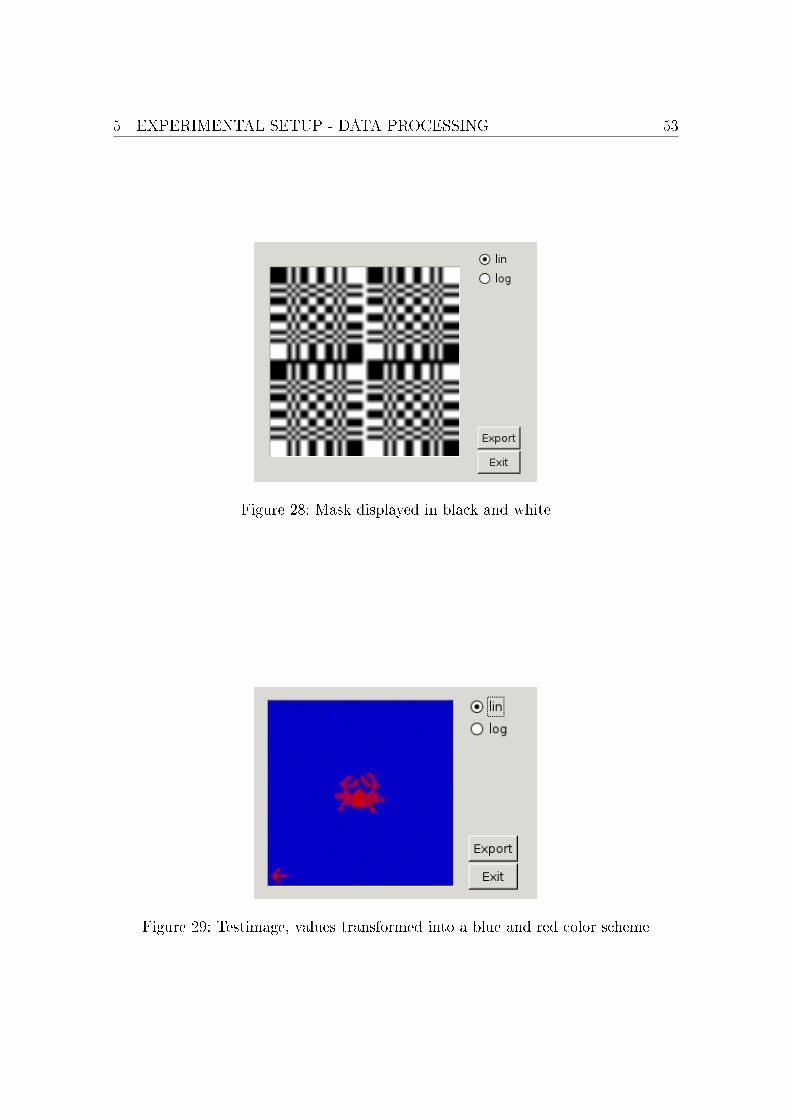
5 EXPERIMENTAL SETUP - DATA PROCESSING 53
Figure 28: Mask displayed in black and white
Figure 29: Testimage, values transformed into a blue and red color scheme
6 SUMMARY AND OUTLOOK 54
6 Summary and outlook
This document describes how the author analyzed the integration of image recon-struction software for coded mask cameras in near-�eld use into a scienti�c softwareframework. A major part of this work was understanding the physics behind codedmask cameras.Only two algorithms for image reconstruction were discussed: Fast Fourier Trans-
form and the back-projection of photons. They are the most commonly used algo-rithms so far. Both have been analyzed in far-�eld setups, followed by the theoreticaldiscussion of necessary adaptions for using the algorithms in near-�eld applications.A third possibility of an algorithm performing in near- and far-�eld, not discussed
here for time reasons, is the �Pixon algorithm� introduced by Piña and Puetter(1993). It is a sophisticated approach for distinguishing between hits caused byphotons from the source and background/noise, hence, cleaning the image. Thealgorithm can be considered to be a image restoration method and works, withsome pre-processing, for coded mask image reconstruction as well. Also, Pixonlooks promising on retrieving three-dimensional properties of the object exposed,e.g. the distance between object and camera. Future work improving the e�ortsmade in this thesis should have a closer look into this matter. A good start isPuetter (2005) as well as the Pixon webpage http://www.pixon.com.For further improvements of the two conventional algorithms (FFT and back-
projection), an additional idea was introduced, following other imaging problems:Two exposures are made, one including the object, the other one taking an imageof the noise caused by the detector's surroundings. This is similar to taking andsubtracting a darkframe with conventional (optical) cameras. This �background�can be subtracted from the object exposure and is expected to eliminate noise andartifacts. As soon as the whole image reconstruction process works as intended, thebackground subtraction for coded mask cameras should be evaluated.Some software progress has been made: The integration into the �ts pipeline
was designed and a list of modules was created. Each module description brings adetailed list of the basic parameters, the basic feature requirements and implemen-tation details. The status of each module is given and improvements are suggested.Still, many modules remain in draft status or in a un�nished alpha stadium due totime reasons. Hence, much implementation work has to be done to �nish the imagereconstruction pipeline. Since it was not possible to perform a real-time evaluationof the adapted algorithms this thesis should be seen as the basis for further workdone in this area.

References 55
References
Accorsi, R. (2001). Design of a near-�eld coded aperture cameras for high-resolution
medical and industrial gamma-ray imaging. PhD thesis, Massachusetts Instituteof Technology. Dept. of Nuclear Engineering.
Anderson, D. N. et al. (2006). Detection and location of gamma-ray sources with amodulating coded mask. Technometrics, 48(2):252�261.
Aschenbach, B. (1985). X-ray telescopes. Rep. Prog. Phys, vol. 48, pages 579�629.
Braga, J. et al. (2005). The MIRAX X-ray Transient Mission: Recent Developments.In The X-ray Universe 2005, page 245 et. sqq. ESA Publications Division.
Chalmers, A. (2001). Transmission Enhanced Backscatter X-ray Images. Hard X-
Ray and Gamma-Ray Detector Physics III, Proceedings of SPIE, 4507:125�131.
Chalmers, A. (2005). Three applications of backscatter x-ray imaging technologyto Homeland Defense. Sensors, and C3I Technologies for Homeland Security and
Homeland Defense IV, 5778:989�993.
Cormen, T. H., Leiserson, C. E., Rivest, R. L., and Stein, C. (2001). Introductionto Algorithms, Second Edition. The MIT Press, Cambridge.
Dugan, E. T., Jacobs, A. M., Su, Z., Houssay, L., Ekdahl, D., and Brygoo, S. (2002).Development and �eld testing of a mobile backscatter x-ray lateral migrationradiography land mine detection system. Detection and Remediation Technologies
for Mines and Minelike Targets VII, Proceedings of SPIE, 4742:120�131.
Faust, A. A., Rothschild, R. E., and Heindl, W. A. (2003). Development of aCoded Aperture Backscatter Imager using the UC San Diego HEXIS detector.In Detection and Remediation Technologies for Mines and Minelike Targets VIII,
Proceedings of SPIE, volume 5089, pages 95�106.
Gottesman, S. R. and Fenimore, E. E. (1989). New family of binary arrays for codedaperture imaging. Appl. Opt., 28(20):4344�4352.
Groeneveld, H. A. (1999). Design, Simulation und Optimierung kodierter Aperturen.PhD thesis, Eberhard-Karls-Universität, Tübingen, Germany.
Hammersley, A. et al. (1991). Reconstruction of images from a coded-aperture boxcamera. Nuclear Instruments and Methods in Physics Research A311, pages 585�594.
Karttunen, H., Kröger, P., Oja, H., Poutanen, M., and Donner, K. J., editors (1987).Fundamental Astronomy. Springer, Berlin, Heidelberg.

References 56
Keshavmurthy, S. P., Dugan, E. T., Wehlburg, J. C., and Jacobs, A. M. (1996).Analytical studies of a backscatter x-ray imaging landmine detection system. Pro-ceedings of SPIE, 2765:512�523.
Kulinder Pal Singh (2005). Techniques in X-ray Astronomy Part 1 and 2. In Reso-
nance Vol. 10 No. 6 and 7, pages 15�23, 8�20. Springer India.
Mandel, E., Swick, R., and Tody, D. (1995). The X Public Access Mechanism.Proceedings of the 9th X Technical Conference.
Peli, E. (1990). Contrast in complex images. Journal of the Optical Sociecty of
America, 7(10):2032�2040.
Piña, R. and Puetter, R. (1993). Bayesian image reconstruction: The pixon andoptimal image modeling. Publications of the Astronomical Society of the Paci�c,105:630�637.
Puetter, R. (2005). Investigation into the utility of Pixon image reconstructiontechnique for the DRDC Coded Aperture X-ray Backscatter Imager. Contractreport.
Rothschild, R. E., Tomsick, J. A., Matteson, J. L., Pelling, M. R., and Suchy, S.(2006). CZT Detector and HXI Development at CASS/UCSD. In F. d'Amico,J. Braga, R. R., editor, The Transient Milky Way, pages 107�111. AIP Conf.Proc. 840.
Schwarzburg, S. (2005). Eine Software zur Echtzeitanalyse von experimentellenDaten im Flexible Image Transport System (FITS). Master's thesis, EberhardKarls Universität, Tübingen, Germany.
Skinner, G. (1995). Coding (and decoding) coded mask telescopes. In Bassani, L.and Cocco, G. D., editors, Imaging in high energy astronomy. Kluwer AcademicPublishers.
Skinner, G. and Rideout, R. M. (1994). A compendium of coded mask designs. InBassani, L. and Cocco, G. D., editors, Imaging in high energy astronomy. KluwerAcademic Publishers.
Skinner, G. K., Ponman, T. J., Hammersley, A. P., and Eyles, C. J. (1987). Tech-niques for the analysis of data from coded-mask X-ray telescopes. Astrophysics
and Space Science, 136:337�349.
Suchy, S., Pelling, M. R., Tomsick, J. A., Matteson, J. L., and Rothschild, R. E.(2006). Laboratory testing of the HEXIS Hard X-Ray Imager Balloon Telescope.In Space Telescopes and Instrumentation II: Ultraviolet to Gamma Ray, Proceed-
ings of SPIE, volume 6266, page 626628 et sqq.
References 57
Tawara, Y. et al. (2002). A hard x-ray telescope with multilayered supermirrorsfor balloon observations of cosmic x-ray sources. Advances in Space Research,30(5):1313�1319.
Tsvetkov, M., Tsvetkova, K., Borisova, A., Kalaglarsky, D., Bogdanovski, R., Heber,U., Bues, I., Drechsel, H., and Knigge, R. (2005). Bamberg southern photographicpatrol survey: Incorporation in the WFPDB. Proc. IV Serbian-Bulgarian Astro-
nomical Conference, pages 303�308.
Vadawale, S. V., Hong, J., Grindlay, J. E., and Skinner, G. (2005). Monte-Carlosimulations of the expected imaging performance of the EXIST high-energy tele-scope. Optics for EUV, X-Ray, and Gamma-Ray Astronomy II, Proceedings of
SPIE, 5900:590014 et. sqq.
Wells, D. C., Greisen, E. W., and Harten, R. H. (1982). FITS: A Flexible ImageTransport System. Astronomy and Astrophysics Supplement Series 44, pages363�370.
Wilms, J. (2008). Galactic x-ray astronomy. Class at University ofErlangen-Nuremberg: http://pulsar.sternwarte.uni-erlangen.de/wilms/
teach/xray1/.
Wilms, J., Schwarzburg, S., Remillard, R., et al. (2006). MIRAX Software Aspects.In F. d'Amico, J. Braga, R. R., editor, The Transient Milky Way, AIP Conf. Proc.
840, pages 122�126.