Embed Size (px)
Citation preview

AAPM 56th Annual Meeting ‐ Austin, TexasImage Quality for the Radiation Oncology Physicist: Review of the Fundamentals and Implementation
Image Quality Review II: g Q yImplementation of Image Quality
AssuranceAssuranceTH‐A‐16A‐3
Paul J. Imbergamo, M.S., FACRSouthern New England Cancer Center – Woonsocket, RI
South County Radiation Therapy – Wakefield, RIRoger Williams Radiation Therapy – Providence, RI

Funding Support, Disclosures, and Conflict of Interest:Conflict of Interest:
None

Implementation of Image Quality Assurance
• Image Guide Radiation Therapy (IGRT) has b h d d f f ibecome the standard of care for patient setup and target localization for external beam htherapy.

Implementation of Image Quality Assurancep g Q y
Th i d i t ti f di tiThe expansion and integration of diagnostic imaging technologies such as On Board I i (OBI) d C B C t dImaging (OBI) and Cone Beam Computed Tomography (CBCT) into radiation oncology h i d di ti l h i i t thas required radiation oncology physicists to be responsible for and become familiar with
i i litassessing image quality.

AAPM Reports
• 2001 TG‐58 Clinical Use of Electronic Portal Imaging
• 2009 TG‐104 The Role of In‐Room kV X‐Ray Imaging for Patient Setup and Target Localization
• 2009 TG‐142 Quality Assurance of Medical Accelerators
• 2012 TG‐179 Quality Assurance for Image‐Guided Q y gRadiation Therapy Utilizing CT‐based Technologies
• 2014 MPG 2.a Commissioning and Quality Assurance of X‐ray based Image‐Guided Radiotherapy Systems

TG‐142 Table VI Imaging QATG 142 Table VI Imaging QA
Daily Monthly Annual
(kVp / HVL)(output ‐mR/mAs)
(CTDI or TG‐111)
Daily QA TherapistDaily QA – Therapist
Monthly QA – Physicist
Annual QA – Physicist

Implementation of Image Quality Assurance
• TG‐142 and other task group reports listsTG 142 and other task group reports lists recommended QA tests but do not describe their implementationtheir implementation.
• Radiation oncology physicists may not beRadiation oncology physicists may not be familiar or have experience with imaging QA tests and measures that are common fortests and measures that are common for diagnostic physicists.

Implementation of Image Quality Assurance
• The implementation of an image qualityThe implementation of an image quality program in accordance with Task Group recommendations can be done relativelyrecommendations can be done relatively easily and simply with readily available phantomsphantoms.
• Automated image analysis software and phantoms may offer advantages and advanced capabilities, but come with caveats.

EPID Monthly QA

EPID Monthly QAEPID Monthly QA
I Collision InterlocksI. Collision InterlocksII. MV Detector Positioning & Reproducibility
i &III. EPID Imaging & Treatment Isocenter Coincidence
IV. ScalingV. EPID CalibrationVI. Image Quality (Resolution/Contrast & Noise)
EPID Monthly QA


III. EPID Imaging & Treatment Isocenter Coincidence
Image at all four cardinal angles
TG 142 tolerance < 2 mm non SRS/SBRT
Image at all four cardinal angles
< 1 mm SRS/SBRT

EPID Monthly QA
TG 142 toleranceTG 142 tolerance < 2 mm
measured at SSD typically used for imaging

IV. Scaling
TG 142 toleranceTG 142 tolerance < 2 mm
measured at SSD typically used for imaging

EPID Monthly QA

V. EPID Calibration
Dark Fields Flood FieldsDark Fields

V. EPID Calibration
Dosimetry Calibration

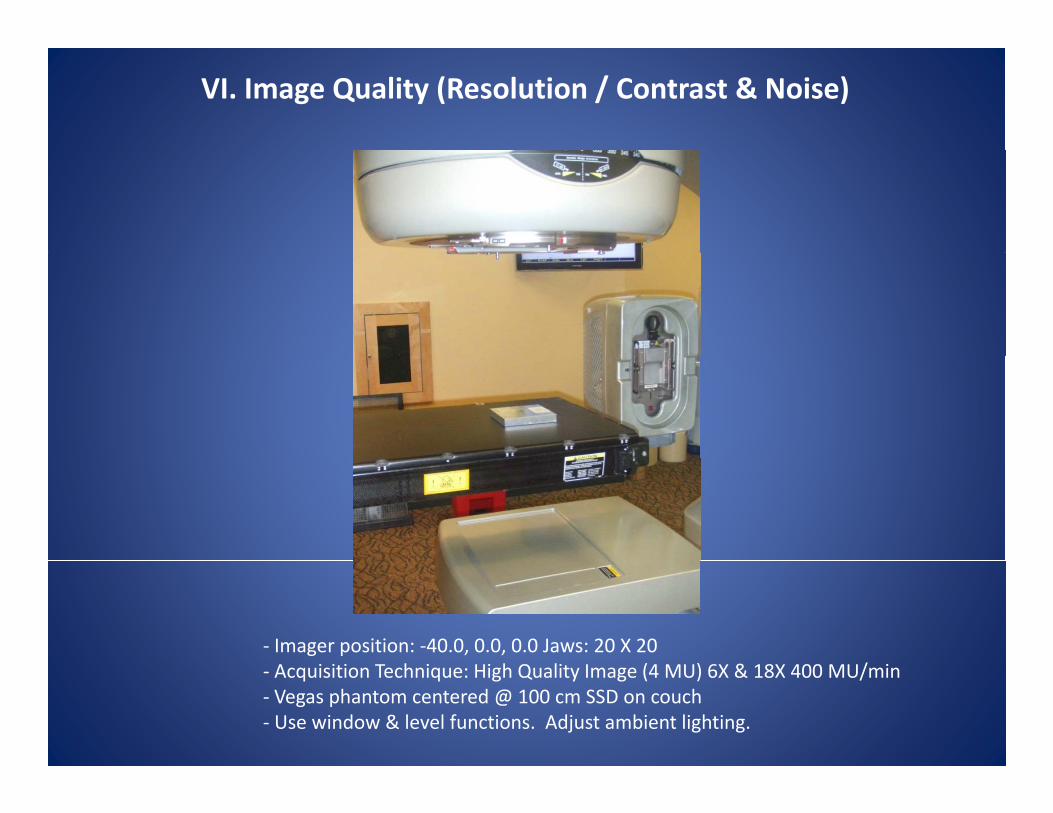
VI. Image Quality (Resolution / Contrast & Noise)
• Aluminum block with Vegas Phantom
columns of circles machined to different depthsdifferent depths – less depth equates to less contrast
• Rows of circles with decreasing diameters g– the smaller the diameter equates to greater detailto greater detail
Note: phantom above is flipped over to show holes normally placed hole side down on the table for imaging

Contrast = Difference
VI. Image Quality (Resolution / Contrast & Noise)
Contrast = Difference• Contrast is the most fundamental characteristic of an image.
Radiographic image contrast is the difference in the shades of grey. g y
Stages of Contrast Development in Radiographyadapted from Sprawls ,“Physical Principles of Medical Imaging”

VI. Image Quality (Resolution / Contrast & Noise)
• The Vegas phantom is a contrast–detail phantom.
• Selection of the least bl l lvisible circle along a
column (y‐axis) provides a measure of contrast.
from AAPM TG‐58
• Selection of the smallest visible diameter along a
( i ) idrow (x‐axis) provides a measure of detail (object size).

VI. Image Quality (Resolution / Contrast & Noise)Contrast‐Detail Curve
• The image of the Vegas phantomVegas phantom produces a contrast–detail curve.
co
high
• The y‐axis corresponds to
ntr corresponds to
contrast.
• The x axis
ast
l • The x‐axis corresponds to detail. detail
lowlargesmall

VI. Image Quality (Resolution / Contrast & Noise)Contrast‐Detail Curve
• As the holes get ll d l ismaller and less in
depth they become more difficult to
co
high
more difficult to visualize due to decreased contrast.
ntr
• The curve on the image is analogous to
ast
l image is analogous to a visibility threshold.
detaillow
largesmall

6 MV 18 MV
VI. Image Quality (Resolution / Contrast & Noise)
6 MV 18 MV
con
con
tra
tra
st
detail
st
detail
6 MV: less penetration of the holes to that of the background
18 MV: greater penetration of the holes to that of the background
Increased Contrast Decreased Contrast
VI. Image Quality (Resolution / Contrast & Noise)
‐ Imager position: ‐40.0, 0.0, 0.0 Jaws: 20 X 20( ) /‐ Acquisition Technique: High Quality Image (4 MU) 6X & 18X 400 MU/min
‐ Vegas phantom centered @ 100 cm SSD on couch‐ Use window & level functions. Adjust ambient lighting.

VI. Image Quality (Resolution / Contrast & Noise)
TG 142 tolerance Baseline
TG‐142: Baseline means that the measured dataTG 142: Baseline means that the measured data are consistent with or better than ATP data.

OBI Monthly QA

OBI Monthly QAOBI Monthly QA
I. Collision InterlocksII. kV Detector Positioning & ReproducibilityIII kV Source PositioningIII. kV Source PositioningIV. Imager Alignment & ScalingV. OBI Imaging & Treatment Isocenter CoincidenceVI. Image Quality – Leeds Test Tool
1. High Contrast Resolution (spatial resolution)2. Low Contrast Resolution

OBI Monthly QA

IV. Imager Alignment & Scaling
TG 142 tolerance < 2 mm non SRS/SBRT
Calibration plate should be accurately aligned
< 2 mm non SRS/SBRT< 1 mm SRS/SBRT
to isocenter so the image may be used for the alignment test

kV Imager Alignment

kV Imager Alignment


V. OBI Imaging & Treatment Isocenter Coincidence
Image at all four cardinal angles
TG 142 tolerance < 2 mm non SRS/SBRT< 1 SRS/SBRT
g g
< 1 mm SRS/SBRT

OBI Monthly QA
VI Image Quality Leeds Test ToolVI. Image Quality ‐ Leeds Test Tool1. High Contrast Resolution2. Low Contrast Resolution

VI. Image Quality ‐ Leeds Test Tool
• 18 circular discs of 8 mm Leeds TOR 18FG Phantomdiameter with decreasing contrast used to assess low contrast resolution.
Leeds TOR 18FG Phantom
• Line pair test pattern centered in phantom to
hi hassess high contrast resolution.
• Measurement of low and• Measurement of low and high contrast resolution require different imaging techniquestechniques.

VI. Image Quality ‐ Leeds Test Tool1. High Contrast Resolution1. High Contrast Resolution
• High Contrast or Spatial Resolution describes the ability of an imaging system to seperate (resolve) objects that are close together.

VI. Image Quality ‐ Leeds Test Tool1. High Contrast Resolution1. High Contrast Resolution
• High Contrast Resolution is measured by a line pair test pattern, a series of open spaces and Pb bars that repeat with increasing frequency.

VI. Image Quality ‐ Leeds Test Tool1. High Contrast Resolution1. High Contrast Resolution
• The higher the spatial frequency (lp/mm) observed the greater the resolution.
Line pair (lp) = open space + Pb bar = 2 lines

VI. Image Quality ‐ Leeds Test Tool1. High Contrast Resolution1. High Contrast Resolution
• Spatial frequency is analogous to object size or l i i bresolution as given by:
F = 1/(2Δ) or Δ = 1/(2F) = 1/[2(lp/mmobs)]( ) ( ) [ ( p obs)]where: Δ = object size resolved (mm)
F = spatial frequency or# of lp/mm observed# of lp/mm observed

VI. Image Quality ‐ Leeds Test Tool1. High Contrast Resolution1. High Contrast Resolution
• As spatial frequency increases the ability of the
from Christensen’s Physics of Diagnostic Radiology
As spatial frequency increases the ability of the imaging system to record it decreases due to decreased image contrast between the objects.decreased image contrast between the objects.

High Contrast Resolution & Aliasing
aliasingaliasing artifact
• Digital images can exhibit aliasing due to undersampling of higher frequencies per the Nyquist limit.g q p yq
• Aliasing results in the frequency wrapping back onto the image at a lower frequency appearing as a blurring or moire pattern.

VI. Image Quality ‐ Leeds Test Tool1. High Contrast Resolution1. High Contrast Resolution
Leeds Test Tool
kV Detector
• Measurement of high contrast resolution requires the test pattern to be imaged under conditions of high contrast (low kVp) and low noise (increased exposure)contrast (low kVp) and low noise (increased exposure).
• Place the phantom at a diagonal to avoid interference with line rastering.g

VI. Image Quality ‐ Leeds Test Tool1. High Contrast Resolution
• Magnify the
1. High Contrast Resolution
• Magnify theresolution pattern
• Adjust window and level for the sharpest di ldisplay.
• Adjust ambientlighting.lighting.
• Select highest lp/mm
l dresolved.TG 142 tolerance Baseline

VI. Image Quality ‐ Leeds Test Tool2. Low Contrast Resolution
Leeds TOR 18FG Phantom
2. Low Contrast Resolution
• 18 circular discs of 8 mm diameter with decreasing contrast used to assess low
t t l ti
Leeds TOR 18FG Phantom
contrast resolution.
• Low contrast resolution is the ability to discern objects in an y jimage that only slightly differ from each other (object & background).
• In other words, it is the abilityto visualize grey on grey.li i l l th bilit diclinical example: the ability discern liver mets from normal liver on CT

VI. Image Quality ‐ Leeds Test Tool2. Low Contrast Resolution2. Low Contrast Resolution
• The ability to visualize low contrast objects is limited by the noiselimited by the noise present in the image.
• Low contrast resolution is noise limited and Signal to Noise RatioSignal to Noise Ratio (SNR) dependent.

VI. Image Quality ‐ Leeds Test Tool2. Low Contrast Resolution2. Low Contrast Resolution
• 1 mm Cu filter at the x‐ray tube and a higher kVp are used to create conditions of d d t t/ i ldecreased contrast/signal from the phantom and increased noise.
• Resulting in a reduced SNRand a noisier image to assess low contrast resolution.
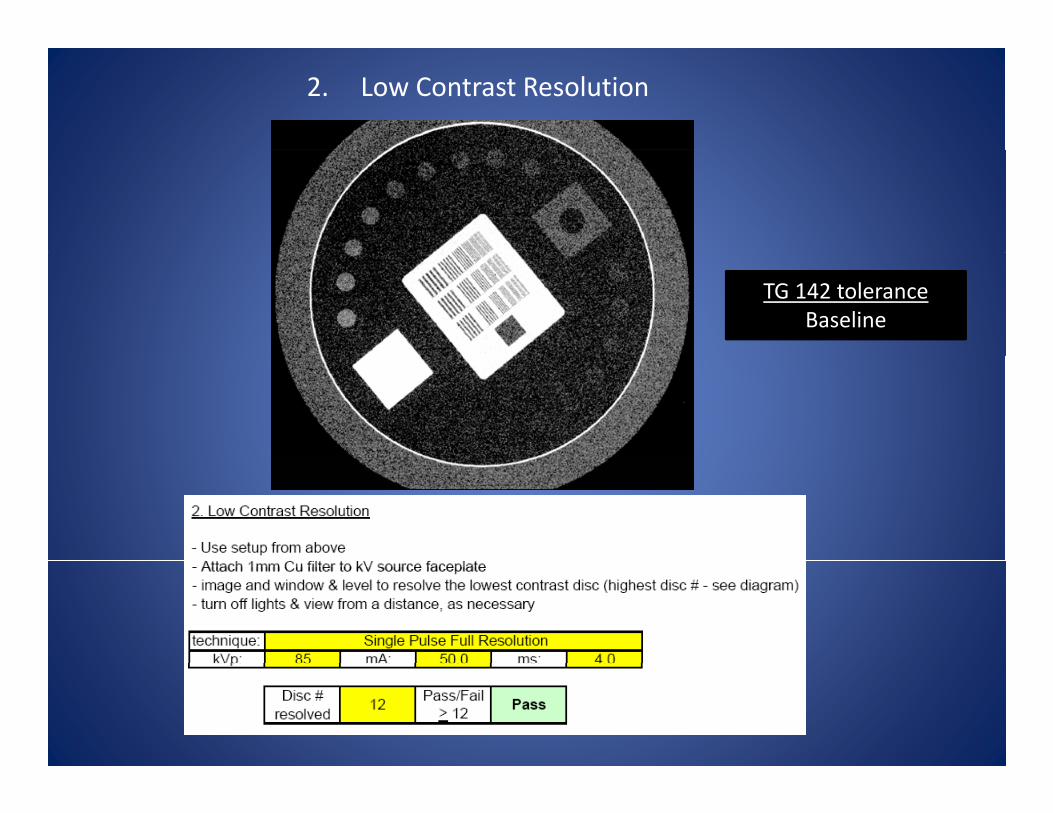
2. Low Contrast Resolution
TG 142 tolerance Baseline

CBCT Monthly QA

CBCT Monthly QA
I. High Contrast Resolution
II. Low Contrast Resolution (pelvis scan only)
III. Uniformity and Noise
IV. CT# Constancy, Linearity, & Contrast Scale
V S ti l Li it AV. Spatial Linearity Accuracy

Cone Beam Computed Tomography
• Elekta and Varian both offer gantry mounted CBCT systems comprisedElekta and Varian both offer gantry mounted CBCT systems comprised of a kV x‐ray source and flat panel detector that share a common isocenter with the MV beam.
• Both systems utilize full (360o) rotation and partial angle scans.
• Bow tie filters are used to attenuate the edges of the kV beam.
from D. E. Hyer and D. E. Hintenlang, “ Estimation of CBCT organ doses,” Med. Phys. 37 (9), Sept 2010

CBCT Monthly QA ‐ Catphan
Diagrams taken from Catphan manuals, which are all available
lionline.
Catphan Phantom FamilyCatphan M1 M2 M3 M4 M5503 404 528 486 Elekta503 404 528 486 Elekta504 528 404 515 486‐2 Varian600 404 591 528 515 486 Siemens
Module InsertsSlide provided by Mark Wiesmeyer of Standard Imaging

CBCT Monthly QA
Phantom composed of diff d l
Catphan 504different test modules• CTP528: High Contrast
ResolutionResolution• CTP404: CT# Constancy &
Linearity, Contrast Scale, & S i l Li i& Spatial Linearity Accuracy
• CTP515: Low Contrast Resolution
• CPT486‐2: Uniformity and NoiseNoise

CBCT Monthly QA
• Setup and center the phantom at isocenter.• All imaging qa may be acquired in one scan if
the longitudinal FOV covers the phantomthe longitudinal FOV covers the phantom.

CBCT Monthly QA• One scan at pelvis technique & bow tie filter
• One scan at standard dose head technique & bow tie filter

CBCT Monthly QA
I. High Contrast Resolution
• CTP528: High Contrast Resolution module
• Array of increasing lp/cm test patterns (1 ‐21 lp/cm)
• Select “bone window” and adjust for sharpest displaydisplay
• Magnify as necessay and select highest l / l dlp/cm resolved
lp/cm

CBCT Monthly QA
I. High Contrast Resolution
• Image analysis is the same for CBCT highsame for CBCT high contrast resolution as that of the OBI.
Δ = 1/(2F) = 1/[2(lp/cmobs)]where: Δ x 10 = object size resolved (mm)
F = spatial frequency or# of lp/cm observed
lp/cm

CBCT High Contrast Resolution
Head vs Pelvis Scan
lp/cm lp/cm
Standard‐Dose Head Pelvis

CBCT High Contrast Resolution
Head vs Pelvis Scan
• High contrast or spatial resolution is greater for the headHigh contrast or spatial resolution is greater for the head scan due to pixel size
• Varian uses a default matrix of 384 x 384
• Axial Field of View• Standard Head: 250 mm
P l i 450• Pelvis: 450 mm
• Varian acceptance specification• Standard Head: > 6 lp/cm• Standard Head: > 6 lp/cm• Pelvis: > 4 lp/cm
TG 142 toleranceTG 142 tolerance Baseline

CBCT Monthly QA
II. Low Contrast Resolution
• CTP515: Low Contrast Resolution module
• Array of discs with decreasing diameters at different contrast levelsdifferent contrast levels (Supra‐slice)
• Disc diameters decrease f 15 2from 15 mm to 2 mm

CBCT Monthly QA
II. Low Contrast Resolution
• The same conditions for lowThe same conditions for lowcontrast resolutiondiscussed for the OBI apply.
• Low contrast resolution is noise limited and SNR dependent.
• Since the Standard Head scan is a low dose (mAs) technique this test does not qapply.
• Pelvis scan only.Pelvis Scan Techique

CBCT Monthly QA
II. Low Contrast Resolution
• Dim or turn off room• Dim or turn off room lights and view from a distance as necessary.
15 mm9 mm
8 mm
7 mm
1.0 %
• Use a low contrast window setting such as liver or abdomen, and
6 mm
,adjust as needed.
• Select smallest disc i iblvisible.
TG 142 tolerance Baseline

CBCT Monthly QA
III. Uniformity & Noise
• CTP486‐2: Image Uniformity moduleUniformity module
• Uniform material designed to bedesigned to be within 2% (20 HU) of water’s density.

CBCT Monthly QA
III. Uniformity & Noise
CTP486‐2: Image Uniformity module

CBCT Monthly QA
III. Uniformity & Noise
‐ Record the mean CT # & std dev for center & peripheal locations
‐ Use suitably sized ROI (20x20)
‐ Use center slice of moduleUse center slice of module
‐ Avoid crescent shape artifact on head scans

CBCT Monthly QA
III. Uniformity & Noise
• % Spatial Uniformity is an expression of of the maximum contrast of the a u co t ast o t eROI’s measured.
• % SU = (CT#max‐ CT#min)/10
• Should be < 3%
• Varian spec: range +/‐ 40 HUVarian spec: range +/ 40 HU from the center ROI HU
TG 142 tolerance Baseline

CBCT Monthly QA
III. Uniformity & Noise
• As stated previously noise limits the visiblity of low contrast detail.
• Noise in CT is the standard deviation of CT# (σ)expressed as a % of the linear attenuation coefficient of H20 (µw) corrected for contrast scale (CS)(CS).
• % Noise ≈ (σ ∙ CS ∙ 100)/ µw

CBCT Monthly QA
III. Uniformity & Noise
• Contrast Scale (CS) is the change in linear attenuation coefficient per CT# relative to that of H20.
• CS ≈ 1.9 x 10‐4 CT#/cm‐1 &µw ≈ 0.19 cm‐1 for CT kVp ≈ 120 so,
• % N (σ CS 100)/ µ• % N ≈ (σ ∙ CS ∙ 100)/ µw % N ≈ σ /10
• % Noise should be ≈ 1.0 % for the l i d 3 0 % f th h dpelvis scan and ≈ 3.0 % for the head
scan due to lower mAs used.
TG 142 tolerance Baseline

CBCT Monthly QA
IV. CT# Constancy, Linearity, & Contrast Scale
• CTP404 moduleS it t i• Seven sensitometric targets used to assess:1 CT# Constancy &1. CT# Constancy &
Linearity2. Contrast Scale

VI. CT# Constancy, Linearity, & Contrast Scale1 CT# C t & Li it1. CT# Constancy & Linearity
• Use center of the module to avoid partial volume effect. (4 wire ramps centered symmetrically in image)
airpmp teflon
(4 wire ramps centered symmetrically in image)
• Window & level to visualize targets
hldpe delrin
• Draw ROI within target
• Measure CT# of the ROI of each targetg
poly acrylic

VI. CT# Constancy, Linearity, & Contrast Scale1 CT# C t & Li it1. CT# Constancy & Linearity
• Varian spec: measured and expected CT#’s should be within + 40 HU
• Plot of CT# vs. µ should be linear with an R2 value of close to 1.0
TG 142 tolerance Baseline

VI. CT# Constancy, Linearity, & Contrast Scale2 C t t S l2. Contrast Scale
• Contrast Scale (CS) is theair
pmp teflon
• Contrast Scale (CS) is the change in linear attenuation coefficient per CT# relative to that of H20.
ldpe delrin
2
• CS ≈ (µm ‐ µw)/(CT#m ‐ CT#w)
• CStheoretical = 1.9 x 10‐4theoretical assuming: µw = 0.19 cm‐1 CT#w = 0 HU
µm = 0.0 cm‐1 CT#m = ‐1000 HU(w = H20 & m = air)
poly acrylic

CBCT Monthly QA
V. Spatial Linearity Accuracy
TG 142 tolerance < 2 mm non SRS/SBRT< 1 SRS/SBRT< 1 mm SRS/SBRT

Comments on Automated Image Analysis
• Automated image analysis software and phantoms can be a useful tool in the pcollection, analysis, and trending of image qa data.
• They can eliminate viewer bias and provideThey can eliminate viewer bias and provide calculation of advanced imaging metrics if proper and consistent techniques are used.
A ith t l th t d t d it• As with any tool the user must understand its use and limitations, the expected results and how to interpret them.
• Without this understanding the process can become unnecessarily complicated and the results obtained may be confusing and meaninglessmeaningless.
Images provided by Mac Clements of RIT & Mark Wiesmeyer of Standard Imaging

Comments on Automated Image Analysis
• Automated image analysis software is not an essential tool to implement a TG compliant p pimaging QA program.
• I recommend that before investing in an automated system a physicist first becomeautomated system a physicist first become familiar with image qa testing and understand the interpretation of the results by manual methods.
• This will allow you to become familiar with the tests, results, problems and pitfalls, as well as the strengths and weaknesses of the
i h d ltesting methodology.• Thereby allowing you to better assess the
utility and value of an automated system for your clinical application.
Images provided by Mac Clements of RIT & Mark Wiesmeyer of Standard Imaging

Acknowledgements
• Anita Corrao, 21st Century Oncology
• Bryon Murray ZapIT Medical• Bryon Murray, ZapIT Medical
• Christine Gnaster, Mobius Medical Systems
• Mac Clements, RIT Inc.
• Mark Wiesmeyer, Standard Imaging