Embed Size (px)
DESCRIPTION
Image Denoising Using Scale Mixtures of Gaussians in the Wavelet Domain. Portilla , J . ( Universidad de Granada ); Strela , V. (Drexel University); Wainwright , M.J . ( University of California, Berkeley ); Simoncelli , E.P . ( New York University ); - PowerPoint PPT Presentation
Citation preview

Image Denoising Using Scale Mixtures of Gaussians in the Wavelet Domain
Portilla, J.(Universidad de Granada); Strela, V.(Drexel University); Wainwright, M.J.(University of California, Berkeley); Simoncelli, E.P.(New York University);
Transactions on: Image Processing, IEEE Journals

Outline• Introduction• Image probability model
– Gaussian scale mixtures– GSM model for wavelet coefficients– Prior density for multiplier
• Image denoising– Bayes least squares estimator– Local Wiener estimate– Posterior distribution of the multiplier
• Results– Implementation– Denoising digital camera images

Introduction
• Survey of image denoising techniques:

Hard thresholding: if (coef[i] <= thresh) coef[i] = 0.0;Soft thresholding: if (coef[i] <= thresh) coef[i] = 0.0; else coef[i] = coef[i] - thresh;

Image probability model
• An image decomposed into oriented subbands at multiple scales by wavelet transform.
• We assume the coefficients within each local neighborhood are characterized by a Gaussian scale mixture (GSM) [3] model.
• The neighborhood may include coefficients from nearby scales and orientations.
[3] D Andrews and C Mallows, “Scale mixtures of normal distributions,” J. Royal Stat. Soc., vol. 36, pp. 99–, 1974.

-Gaussian scale mixtures
• We denote as xc the center coefficient.
• We denote as x the vector of coefficient xc and its neighborhood coefficients (scales and orientations).
• The vector x characterized by a Gaussian scale mixture (GSM) model:
– u: zero-mean Gaussian vector.– z: independent positive scalar random variable.

-Gaussian scale mixtures• The vector x is thus an infinite mixture of Gaussian
vectors, whose density is:
– Cu: the covariance matrix of u– N: the dimensionality of x and u (in our case, the size
of the neighborhood).• Without loss of generality, one can assume E{z}= 1,
which implies Cu= Cx.Neighbors(Cx & N)? p(z)?

-GSM model for wavelet coefficients
• GSM model can account for both the marginals of wavelet coefficient and the correlation between amplitudes of neighbor coefficients by the neighborhood boundaries[4, 2].– The marginal model for the multipliers: treating
them as independent variables [33],– The joint density over the full set of multipliers [2].
[2] M J Wainwright, E P Simoncelli, and A S Willsky, “Random cascades on wavelet trees and their use in modeling and analyzing natural imagery,” Applied and Computational Harmonic Analysis, vol. 11, no. 1, pp. 89–123, July 2001.[4] M J Wainwright and E P Simoncelli, “Scale mixtures of Gaussians and the statistics of natural images,” in Adv. Neural Information Processing Systems, S. A. Solla, T. K. Leen, and K.-R. M¨uller, Eds., Cambridge, MA, May 2000, vol. 12, pp. 855–861, MIT Press.[33] V Strela, “Denoising via block Wiener filtering in wavelet domain,” in 3rd European Congress of Mathematics, Barcelona, July 2000, Birkh¨auser Verlag.
-GSM model for wavelet coefficients
• An alternative approach is to use a GSM as a local description.
• The model implicitly defines a local Markov model, described by the conditional density of a coefficient of its surrounding neighborhood.
• The choice of neighborhood is described in section “Implementation”.
Get Neighbors(Cx & N).

-Prior density for multiplier
• The maximum likelihood (ML) approach for estimating a nonparametric pz(z):
• m: the index of neighborhoods– Computing this solution numerically.– Advantage: it is easily extended for use with the noisy
observations. (xm → noisy observation)– Drawback: heavily computational cost.

-Prior density for multiplier– Results:

-Prior density for multiplier• Noninformative prior (Jeffrey’s prior) [36] :
– Jeffrey’s prior:– Advantage: it does not require the fitting of any
parameters to the noisy observation.• Better denoising performance in image domain.
[36] G E P Box and C Tiao, Bayesian Inference in Statistical Analysis, Addison-Wesley, Reading, MA, 1992.Get p(z). Model completed.

Image denoising
(1) Decompose the image into pyramid subbandsat different scales and orientations;
(2) Denoise each subband;(3) Invert transform, obtaining the denoised
image.• We assume the image is corrupted by
independent additive Gaussian noise of known covariance.
• The noise and image contents are independent.

Image denoising
• A vector y corresponding to a neighborhood of N observed coefficients can be expressed as:
– Both u and w are zero-mean Gaussian vectors, with covariance matrices Cu and Cw.
• The density of y conditioned on z is a zero-mean Gaussian, with covariance Cy|z = zCu + Cw:

Image denoising• Since w is derived from the image through the
(linear) pyramid transformation, it is easily to compute the noise covariance matrix Cw.
• Taking the expectation of Cy|z over z yields:
• Choose E{z} = 1, resulting in:
• Ensure that Cu is positive semidefinite.(By performing an eigenvector decomposition and setting any negative eigenvalues to zero.)

-Bayes least squares estimator
• For each neighborhood, we wish to estimate xc (the center of reference coefficient) from y.
• The Bayes least squares (BLS) estimate is just the conditional mean:

-Local Wiener estimate( )
• By GSM, simply a local linear (Wiener) estimate:
• Which
• The diagonalizing (for zCu + Cw) does not depend on z, thus it’s only computed once for each subband.
(Square root)

• We can now simplify (9):
• Finally: – mij: element(i-th row, j-th column) of matrix M– λn: the diagonal elements of Λ– vn: the elements of v -̶̶ c: the index of reference
-Local Wiener estimate( )

-Posterior distribution of the multiplier
• The other component of (8) (by Bayes rule):
• Whichp(y)

Summarizing our denoising algorithm

Results• Implementation:
– Decompose the image: The steerable pyramid[14]5 scales, 8 oriented highpass residual subbands, and one lowpass (non-oriented) residual band.
– Hand-optimized the neighborhood structure:A 3 × 3 region surrounding xc , together with the coefficient at the same location and orientation at the next coarser scale [19].
– Test on a set of 8-bit grayscale test images with additive Gaussian white noise at 10 different variances.
[14] E P Simoncelli,WT Freeman, E H Adelson, and D J Heeger, “Shiftable multi-scale transforms,” IEEE Trans Information Theory, vol. 38, no. 2, pp. 587–607, March 1992, Special Issue on Wavelets.[19] R W Buccigrossi and E P Simoncelli, “Image compression via joint statistical characterization in the wavelet domain,” IEEE Trans Image Proc, vol. 8, no. 12, pp. 1688–1701, December 1999.

Results


Results
[30] Xin Li and Michael T. Orchard, “Spatially adaptive image denoising under overcomplete expansion,” in IEEE Int’l Conf on Image Proc, Vancouver, September 2000.

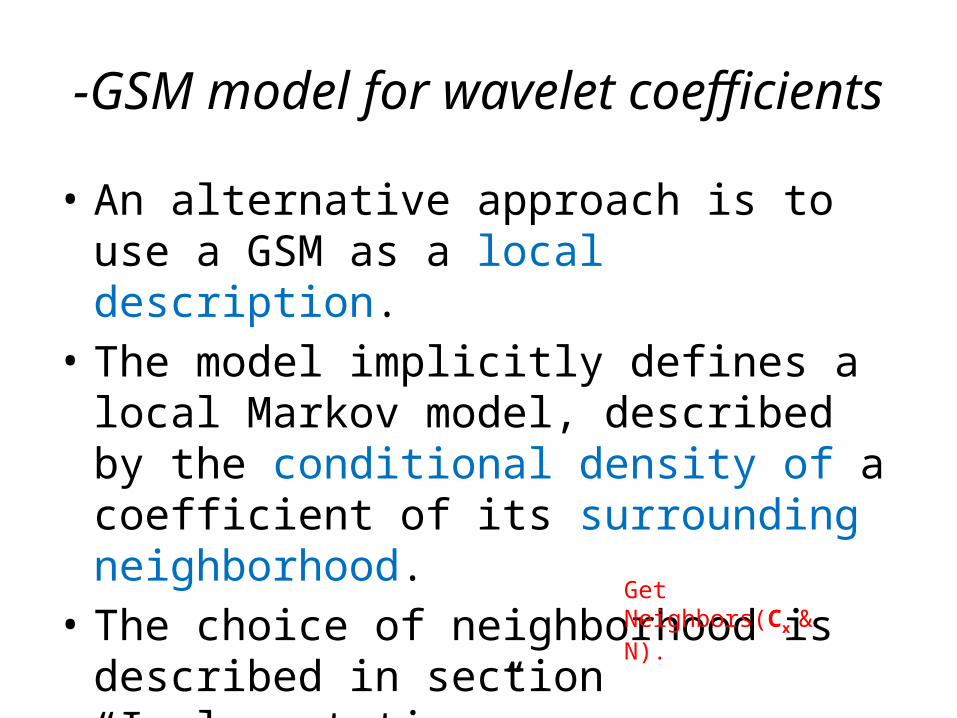
-Denoising digital camera images
• We obtain images from a Canon G1 digital camera (2160×1440 CCD quantized to 10 bits).
• The noise is strongly dependent on the signal:

-Denoising digital camera images
• In the subband domain, we assumed the following noise model:
– αx: the secondary multiplier of local noise variance. where E{αx} = 1 and it depends on pixel variance over a spatial neighborhood (see Appendix C).
• Once the values αx have been computed, then replace (z λn+1) in (14) and (12) with (z λn+αx).
-Denoising digital camera images

-Denoising digital camera images