Embed Size (px)
Citation preview
Image analysis of novel biomaterials effectiveness at inhibiting bacterial colonization with uniquepolymer coatings andor the controlled release of ciprofloxacinby Sara Kirsten Hendricks
A thesis submitted in partial fulfillment of the requirements for the degree of Master of Science inChemical EngineeringMontana State Universitycopy Copyright by Sara Kirsten Hendricks (1998)
AbstractMillions of dollars are spent every year in the US on biomedical implants ranging from commonplaceuses such as contact lenses to applications as rare as total artificial hearts One of the main stumblingblocks in the long term usage of these devices is bacterial infection which can only be rectified by theremoval of the implant resulting in increased costs and trauma to the patient Consequently fourdifferent polymer formulations were studied for their efficacy at preventing bacterial colonization Thepolymer under investigation was placed in a parallel plate flow cell challenged with fluid containingPseudomonas aeruginosa for six hours and then exposed to a fluid of nutrients only for the remainderof a twenty four hour run Two different sets of test polymers subjected to this protocol were examinedby image analysis One set consisted of a BioSpantrade polyletherurethane (PEU) base matrix (BP)coated with triethylene glycol dimethyl ether (triglyme) while the other set had an additional coatingof poly(butyl methyacrylate) polyBMA Each set also had one formulation to which a known amountof the antibiotic ciprofloxacintrade had been added The coatings of triglyme and triglyme+BMA cutbacterial colonization in half when compared to the control BP material While the additional factor ofthe controlled release of ciprofloxacintrade from the materials resulted in more than a two fold reductionin bacterial colonization when compared to the control BP material These polymers therefore holdpromise in decreasing the risk of infection encountered during the use of biomedical implants
IMAGE ANALYSIS OF NOVEL BIOMATERIALS EFFECTIVENESS AT
INHIBITING BACTERIAL COLONIZATION WITH UNIQUE POLYMER
COATINGS ANDOR THE CONTROLLED RELEASE OF CIPROFLOXACIN
by
Sara Kirsten Hendricks
A thesis submitted in partial fulfillment o f the requirements for the degree
of
Master o f Science
in
Chemical Engineering
MONTANA STATE UNIVERSITY-BOZEMAN Bozeman Montana
April 1998
HsiiWitS1X
11
APPROVAL
of a thesis submitted by
Sara Kirsten Hendricks
This thesis has been read by each member o f the thesis committee and has been found
to be satisfactory regarding content English usage format citations bibliographic style and
consistency and is ready for submission to the College of Graduate Studies
James D Bryers Chair
John T Sears Dept Head
Approved for the Department of Chemical Engineering
Date
Graduate Dean
Ill
STATEMENT OF PERMISSION TO USE
In presenting this thesis in partial fulfillment o f the requirements for a masterrsquos
degree at Montana State University-B ozeman I agree that the Library shall make it available
to borrowers under rules o f the Library
I f I have indicated my intention to copyright this thesis by including a copyright
notice page copying is allowable only for scholarly purposes cosistent with ldquofair userdquo as
prescribed in the US Copyright Law Requests for permission for extended quotation from
or reproduction o f this thesis in whole or in parts may be granted only by the copyright
holder
Signature
Date
TABLE OF CONTENTS
Page
INTRODUCTION I
LITERATURE REVIEW 3
Background and Significance3Processes Governing Biofilm Formation 4Surface Modification 6
Modifications Host Cell Adhesion6Modifications Bacterial Cell Adhesion 7
Controlled Release 8Controlled Release Systems9
Ciprofloxacin14
MATERIALS AND METHODS 16
Bacteria and CulturesSolutions
MediumCytological StainsCiprofloxacin
Reactors and Flow Cell SystemsContinuously-stirred Tank Reactor (CSTR)Flow Cell
Microscope Setup and TechniquesPolymer Analylsis
Susceptibility and Adhesion Effect StudiesCiprofloxacinHoechst Stain (33342)FasteetliRHoecsht Stain Effects on P aeruginosa Adhesion
TubingBiomaterial Fabrication t
BP Control Polym erTest Polym ers
161616171718 18 18 21 21 242425 252526 26 26 27
RESULTS AND DISCUSSION 28
Pseudomonas aeruginosa Growth Experiments28Batch Studies28
Flow Cell Experimental Protocol 29Flow Cell Experiments 29
Ciprofloxacin release41
TABLE OF CONTENTS
SUMMARY 43
BIBLIOGRAPHY 45
APPENDICES 50
APPENDIX A - Growth Rate Experiments 51APPENDIX B - FasteethregSusceptibility59APPENDIX C - Hoechst 33342 61APPENDIX D - Ciprofloxacin 65APPENDIX E - Flow Cell Experiments Image Analysis69
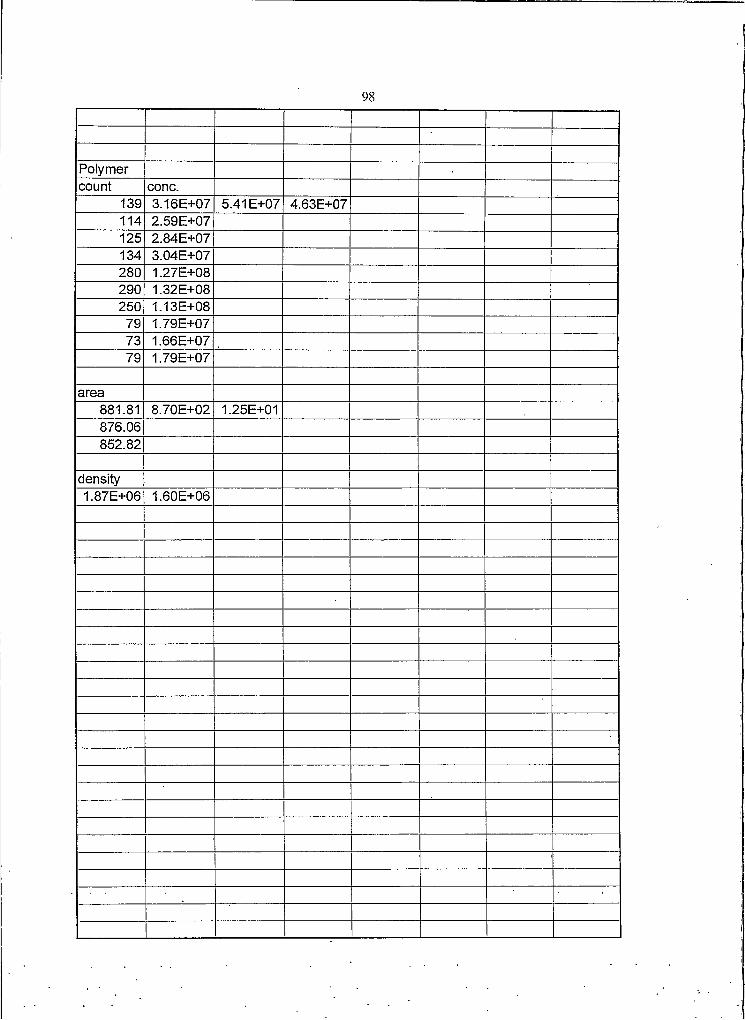
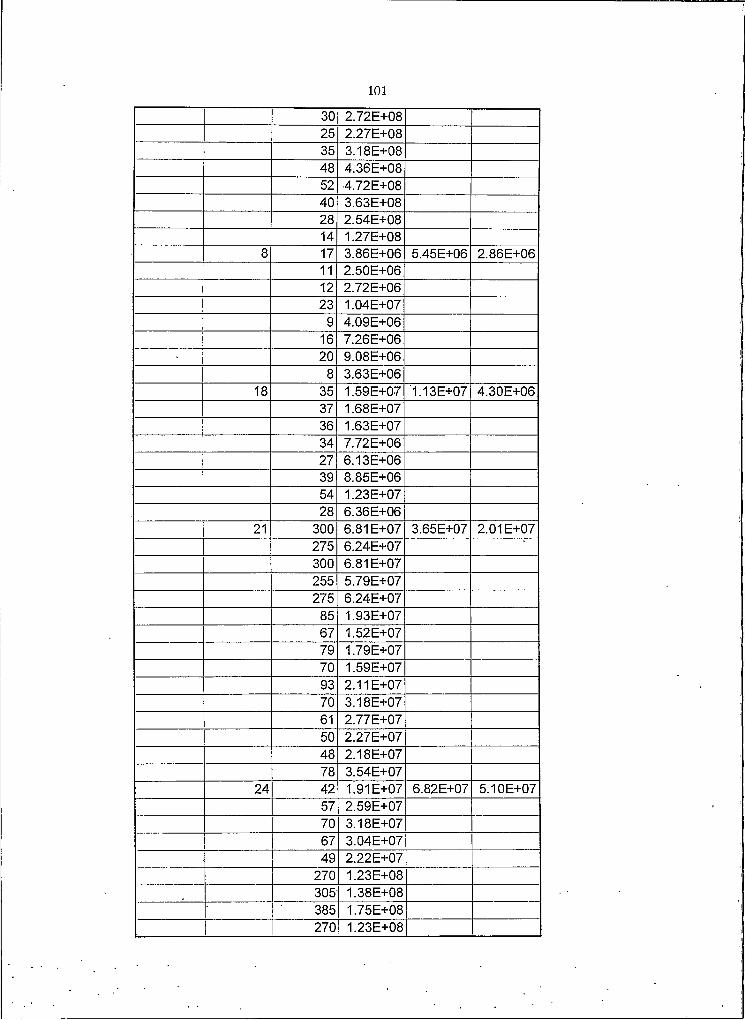
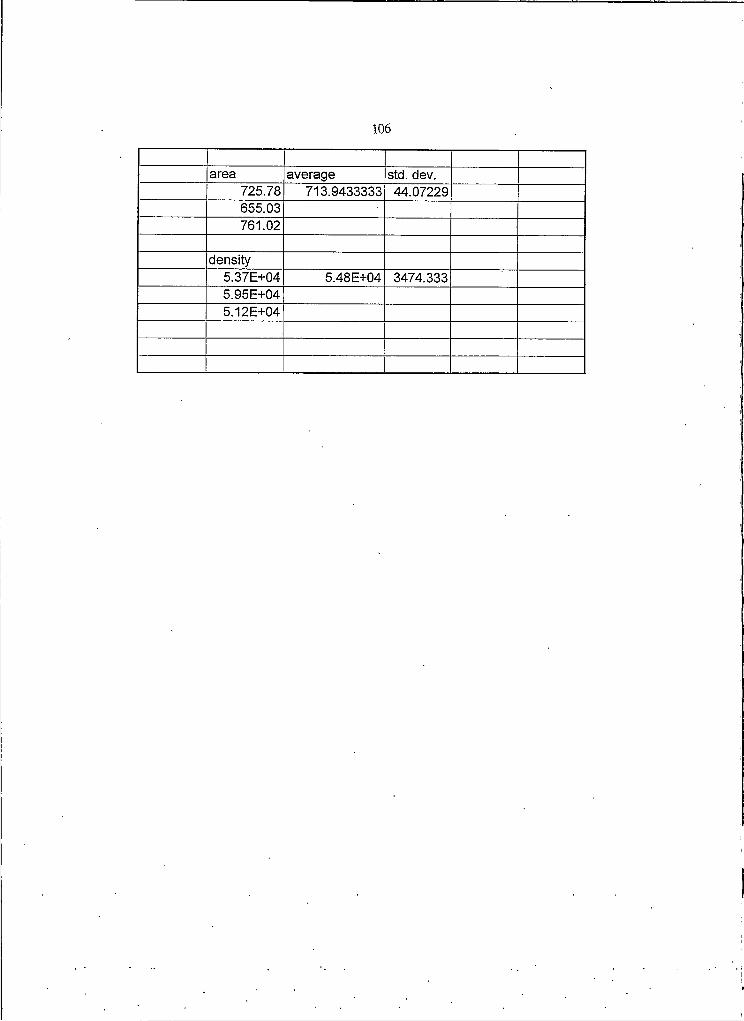
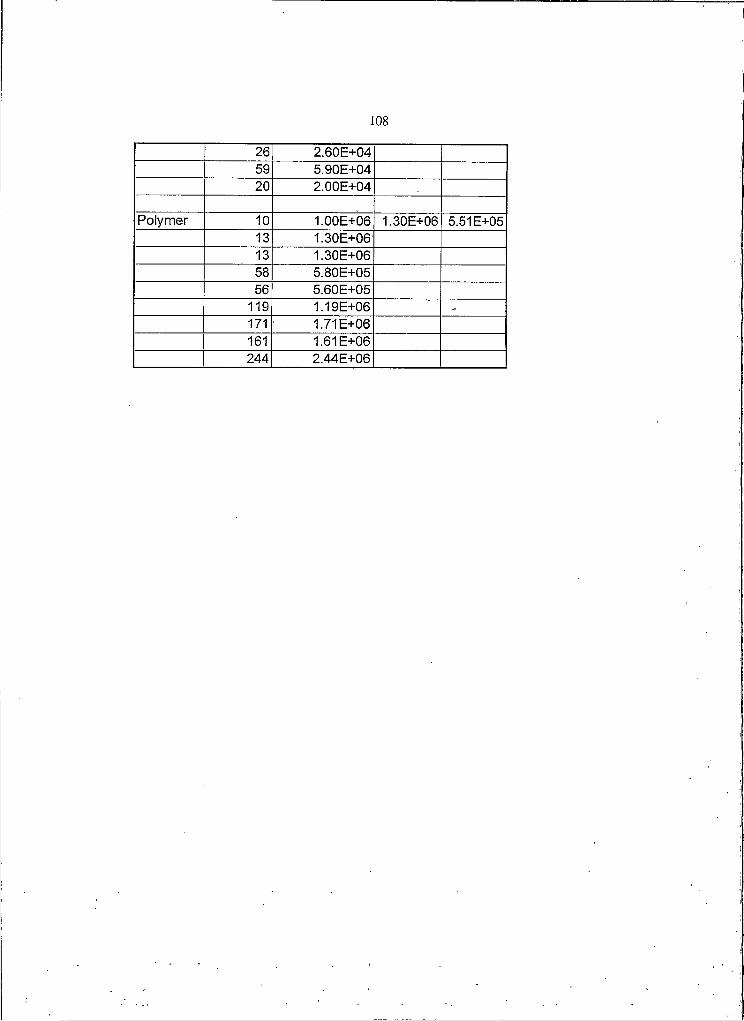
Image Analysis 70APPENDIX F - Flow Cell Experiments Total CountsAO 72APPENDIX G - Flow Cell Experiments Viable CountsPlate Counts 103APPENDIX H - Mathematical Theory 127
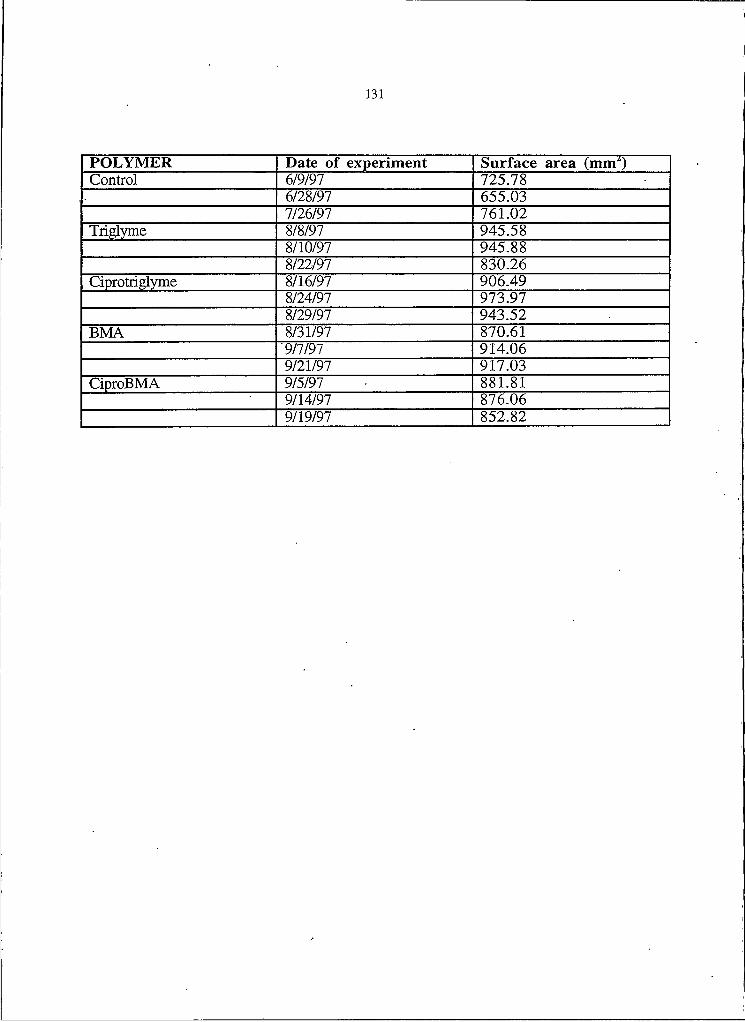
Mathematical Theory128APPENDIX I - Polymer Surface Area Measurements130
Page
LIST OF TABLES
1 Parameters used for sizing of biologic reactor18
2 Flow channel dimensions and hydraulic parameters 20
3 Specific growth rate for P aeruginosa grown at room temperature with 500 ppmglucose fully aerated 28
4 Summary of Hoechst 33342 studies28
5 Description of polymers used in flow cell experiments 30
6 Ciprofloxacin concentrations in effluent 42
Table Page
vii
LIST OF FIGURES
Figure Page
1 Biofiltn formation 5
2 Zero-order first-order and square-root of time release patterns fromcontrolled-release devices 10
3 CSTR setup used to grow P aeruginosa continuously 19
4 Flow cell schematic 20
5 Experimental setup 22
6 BiospaiVConlrol time course of cell adhesion31
7 ControlBiospan polymer bacterial colonization 32
8 Comparison of the extent of colonization of different polymers at 1=24 hours33
9 Direct counts of cell density on the polymer surface after 24 hours34
10 Time course cell colonization curve of control lriglyme ciprolriglymeobtained from image analysis 35
11 Attachment rate differences are evident within the first 6 hours of theflow cell experiments 36
12 Total counts made with Acridine Orange 37
13 Calculated cell density on the ldquolestrdquo polymers using total cell count(acridine orange) data38
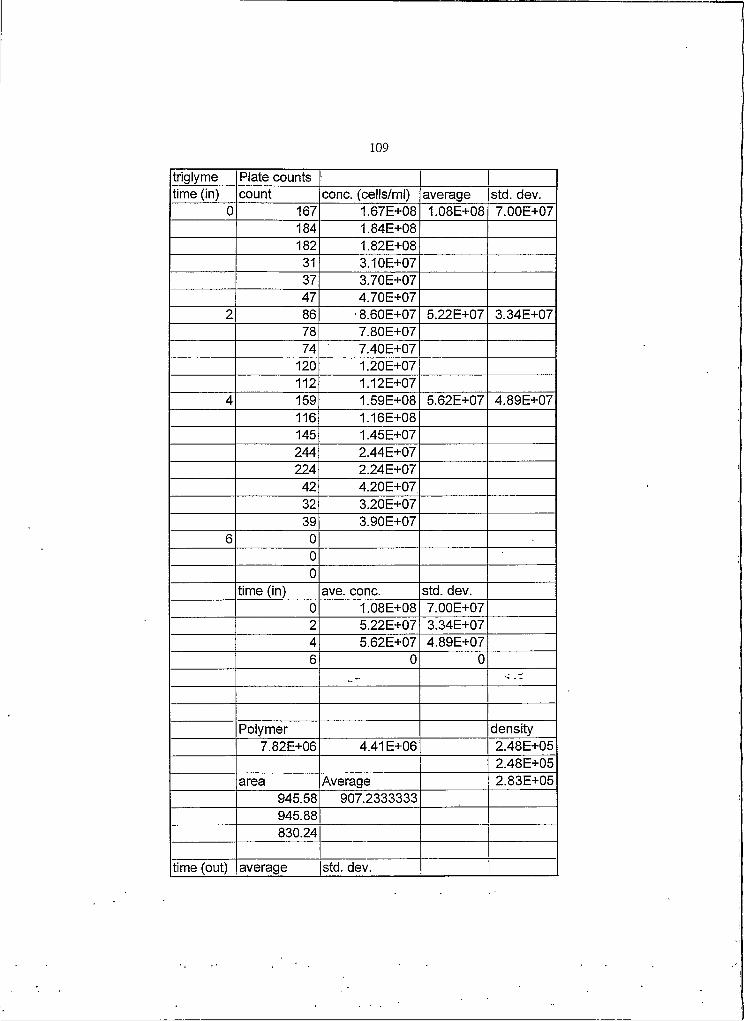
14 Plate count data from effluent samples taken from the polymer flowcells during the course of the experiments shows that viable cells are going throughthe flow cell39
15 Cell densities on polymers calculated from plate count data 40
16 Demonstrates the variations in bacterial density on the lriglyme polymerafter twenty four hours using image analysis (IA) acridine orange staining of the effluent and plate counts of the effluent 4f
vm
ABSTRACT
Millions of dollars are spent every year in the US on biomedical implants ranging from commonplace uses such as contact lenses to applications as rare as total artificial hearts One of the main stumbling blocks in the long term usage of these devices is bacterial infection which can only be rectified by the removal of the implant resulting in increased costs and trauma to the patient Consequently four different polymer formulations were studied for their efficacy at preventing bacterial colonization The polymer under investigation was placed in a parallel plate flow cell challenged with fluid containing Pseudomonas aeruginosa for six hours and then exposed to a fluid of nutrients only for the remainder of a twenty four hour run Two different sets
examined by image analysis One set consisted of latrix (BP) coated with triethylene glycol dimethyl
ether (triglyme) while the other set had an additional coating of poly(butyl methy aery late) polyBMA Each set also had one formulation to which a known amount of the antibiotic ciprofloxacintrade had been added The coatings of triglyme and triglyme+BMA cut bacterial colonization in half when compared to the control BP material Wliile the additional factor of the controlled release of ciprofloxacintrade from the materials resulted in more than a two fold reduction in bacterial colonization when compared to the control BP material These polymers therefore hold promise in decreasing the risk of infection encountered during the use of biomedical implants
of test polymers subjected to this protocol were a BioSpaiitrade polyletherurethane (PEU) base n
i
I
IN TR O D U C TIO N
The National Institutes of Health have defined a biomaterial ldquoas any substance
(other than a drug) or combination of substances synthetic or natural in origin which can
be used for any period of time as a whole or as a part of a system which treats augments
or replaces any tissue organ or function of the bodyrdquo Thus biomaterials will have an
impact on virtually everyone at some point in their life
Biomaterials may be used for long term applications such as central nervous
system shunts extended wear contact lenses or hemodialysis systems They may be
employed in short term applications like contact lenses needles for phlebotomy or
vaccination cardiopulmonary bypass systems or wound healing devices Or biomaterials
may be utilized in permanent implants such as heart valves periodental restorative devices
intraocular lenses or orthopedic devices(NIH Consens 1982)
AU biomedical implants are susceptible to bacterial colonization and subsequent
biofilm formation Biofilms are three dimensional gelatinous structures consisting of
adherent bacteria and insoluble polysaccharides secreted by the bacterial cells Bacteria use
the biomaterial as a substratum to which they attach and adhere resulting in a biomaterial
centered infection Biofilm infections are extremely difficult to eradicate The biofilm gel
matrix cannot only keep the host defense mechanisms from reaching andor recognizing the
adherent bacteria but biofilms can also lower the efficacy of antibiotics Usually the only
way to deal with a device-centered infection is to remove the infected implant which is
costly as well as traumatic to the patient Therefore it is desirable to develop a material that
wiU inhibit bacterial colonization
The objective of the research presented in this thesis was to ascertain the
effectiveness of four different formulations of a biomedical grade polyurethane Biospantrade
at inhibiting bacterial colonization under flow conditions The scope of this work
2
included (I) evaluation of four Biospantradepolyethylene glycol (PEG) matrix biomaterials
two of which contained the antibiotic ciprofloxacin (2) development of a flow cell system
to evaluate the potential for bacterial adhesion and biofilm formation and (3) development
of a novel staining technique to allow for the visualization of bacteria against an opaque
surface without interfering with normal cell behavior
3
LITERA TU RE REVIEW
Background and Significance
Biomaterials have been used in the human body since the early 1900s when bone
plates were introduced to stabilize fractures and speed healing By the 1950s
experimentation into the replacement of blood vessels had begun and by the 1960s
artificial hip joints and heart valves were under development As science and engineering
has advanced so has the clinical use of biomaterials(Blanchard 1996 NIH Consens
1982)
Biomedical implants are no longer used just in life-threatening situations They are
now utilized in every major body system for three general purposes (I) to preserve life or
limb (2) to restore or improve function and (3) to restore or improve shape The first
category includes most neurosurgical and cardiovascular implants such as pacemakers
and hydrocephalus shunts Dental implants and joint replacements are included in the
second category while biomaterials used in reconstructive surgeries are placed in the last
class(NIH Consens 1982)
Estimates in 1982 placed biomaterial implant use in the United States for that year at
several million The demand for biomaterials is said to grow by 5 to 15 percent a year and
will only increase as the population ages and the expectations of maintaining a good quality
of life increase What was a multi-million dollar per year industry in the US now exceeds
$10 billion a year This figure is especially remarkable given that the US only represents
about 10 percent of world demand (Blanchard 1996 NIH Consens 1982 Brictannica
Online 1997)
One of the major risks encountered in the extended use of implants is the
susceptibility of biomaterials to bacterial attachment and adhesion resulting in biomaterial-
4
centered infections The three most common bacterial species implicated in these infections
are Pseudomonas aeruginosa Staphylococcus epidermidis and Staphylococcus aureus
Esherichia coli Proteus mirabilis and beta hemolytic Streptococcus spp have also been
isolated from contaminated implants (Gristina 1987 Gristina 1994)
Once bacteria begin adhering to implant material they can form a biofilm that is
extremely difficult to eradicate The biofilm can not only prevent the host defense
mechanisms from reaching andor recognizing the bacteria but it can also lower the
efficacy of antibiotics Usually the only way to deal with biofilm infections is by removal
of the implant which can be costly as well as traumatic to the patient (Blanchard 1996
Gristina 1987 Gristina et al 1993) Tlierefore it is desirable to develop a biomaterial
that will inhibit bacterial colonization
There are two common approaches to preventing bacterial colonization The first is
to modify the substratumrsquos surface chemistry rendering it non-adhesive and the second is
to design a material which will slowly release an antibacterial agent killing the bacteria
before they reach the surface (Bryers 1997)
Processes G overning Biofilm Form ation
The establishment of a biofilm (figure I) involves many steps (I) preshy
conditioning of the surface by adsorption of organic molecules (eg protein) from the fluid
phase (2) cell transport to the substratum (3) cell adsorptiondesorption (4) permanent
adhesion to the surface (5) cellular metabolism (growth replication death) and (6)
biofilm removal (detachment and sloughing) Pre-conditioning involves coating the
surface with host- derived proteins such as fibronectin human serum albumin and
platelets (Tebbs Sawyer and Elliot 1994 Carballo Ferreiros and Criado 1991 and
Yu et al 1995) Cell transport to the surface may occur through passive processes such
5
as diffusion or fluid flow or active processes such as flagellar movement Reversible
adsorption (adsorptiondesorption) of cells to the substratum can be explained in terms of
the laws of colloid chemistry such as the Derjaguin-Landau and Verwey-Overbeek
Figure I Biofilm formation (I) pre-conditioning (2) cell transport to surface (3) cell adsorptiondesorption (4) permanent adhesion (5) proliferation and (6) removal
(DLVO) theory Electrostatic forces and London-van der Waals forces combine to bring
particles andor cells to a surface by helping to overcome energy barriers allowing the cells
to form a loose attachment with the substratum (Eginton 1995 Characklis and Marshall
1990 Weber and DiGiano 1996) Within a certain distance of the substratum permanent
adhesion becomes possible through such mechanisms as specific binding to proteins in the
conditioning film or hydrogen bonding Once at the surface colonization can begin Cells
begin to produce exopolysaccharides (EPS) literally gluing themselves to the surface
6
Within this EPS matrix the cells continue to grow divide and die Occasionally chunks
of the biofilm will detach as a result of either shear forces or weaken of the bonds holding
them to the substratum (Characklis 1990)
Surface M odification
Eveiy natural and synthetic surface has unique physical and chemical properties that
can influence cellular adhesion By modifying the biomaterial surface the fundamental
processes governing biofilm formation can be altered Several review articles discuss these
processes in detail (Cristina et al 1994 Cristina Naylor and Myrvik 1992 Bryers
1988 Characklis 1990 Dankeit Hogt and Feijen 1986) and acknowledge the similarities
between bacterial colonization and tissue integration In many situations host cells are
actually competing with bacteria to colonize the biomaterial surface Thus many surface
modifications are aimed at intentionally promoting natural tissue adhesion while others are
directed at preventing bacterial adhesion
M odifications Host Cell A dhesion
Techniques focused on promoting tissue integration range from endothelial cell
sodding to glow plasma discharge modification (Williams et al 1992 Massia and
Hubbell 1991) The coating of silicone rubber membranes with poly (2-hydroxy ethyl
methacrylate) (poly HEMA) by glow plasma discharge has shown encouraging results in
vitro with regard to the attachment and growth of corneal epithelial cells bringing the
development of an artificial cornea one step closer to reality (Lee et at 1996)
7
Hydroxylapatite (HA) coatings of bone implants have already proven effective at promoting
faster and greater bone adaptation and improving implant fixation Better techniques of
applying the calcium phosphate to the implant are being examined including plasma spray
heat-treated plasma spray and magnetron-sputter (Hulshoff et al 1996) Carbon
deposition excimer laser ablation and photochemical coatings are being examined as ways
of promoting and controlling endothelial cell proliferation (Kaibara et al 1996 Doi
Nakayama and Matsuda 1996) Surface modifications may also decrease the binding of
host proteins such as thrombin and anti thrombin III thereby lowering the potential to form
blood clots which can promote bacterial adhesion A common method of accomplishing
this is by immobilizing heparin on the surface (Byun Jacobs and Kim 1996 Paulsson
Gouda Larm and Ljungh 1994 Lindhout et al 1995)
M odifications Bacterial Cell A dhesion
Methods for inhibiting bacterial colonization range from antithrombogenic coatings
to the incorporation of antimicrobial substances such as silver or quaternary amine salts (
Wang Anderson and Marchant 1993 Ryu et al 1994 Jansen and Kohnen 1995)
Heparin is only one of the substances used to coat surfaces which have been shown to
decrease bacterial adhesion due to protein-mediated adhesion Poly(vinyl pyrrolidone)
(PVP) coatings which inhibit the adsorption of fibrinogen to the surface have also exhibited
decreased bacterial adhesion (Francois et al 1996) Reductions in bacterial adhesion to
silastic catheters coated with salicylic acid a nonsteroidal anti-inflammatory drug have
been demonstrated in vitro (Farber and Wolff 1993) Coatings of hydrophilic polymers
such as polyethylene glycol (PEG) have shown potential for inhibiting implant-related
infections (Portoles Refojo and Leong 1994) Latex catheters coated with
8
glycomethacrylate gel another hydrophilic polymer have also demonstrated the ability to
reduce infection The reduction was enhanced by the incorporation cephalothin an
antibiotic (Lazarus et al 1971) The elution of an antimicrobial from the implant is one
of the most popular and oldest methods of dealing with biomaterial-centered infections
illustrated by the use of antibiotic impregnated bone cement (Strachan 1995 Seyral et al
1994) As already seen however the incorporation of antibiotics and other antimicrobials
has also been studied with regard to various polymer systems (Rushton et al 1989
Ackart et al 1975 Golomb and Shplgelman 1991 Greenfeld et al 1995) As
knowledge about the immune system increases so does the potential for developing new
substances that can coat biomaterials or be released from them to provide protection against
bacterial colonization as witnessed by development of passive local immunotherapy
(Gristina 1997)
Controlled Release
Controlled release of antibiotics at the site of implantation is one of the more
common approaches to preventing infection and is being used successfully in orthopedic
surgery A recent US survey showed that 27 of responding hospitals commonly use
antibiotic impregnated bone cement for joint replacement surgery (Strachan 1995)
However the use of bone cement is not recommended in younger active people
Consequently the controlled release of antibiotics from coated implants is under
investigation (Price et al 1995) Thus it can be seen that there are several different types
of controlled release systems
9
Controlled Release System s
Controlled release devices are classified by the method that controls the release of
the substance of concern The most common classifications are diffusion controlled
systems chemical reaction systems and solvent activated systems There are several
excellent books and articles that cover this subject in depth (Langer and Wise 1984 Kost
and Langer 1984 Fan and Singh 1989 Baker 1987 Lohmann 1995 Kydonieus 1992
Robinson and Lee 1987) so only a brief overview will be given here
Controlled release systems can be designed to produce release rate profiles that
enhance the efficacy of the desired agent This is in contrast to sustained release devices
which allow the substance of concern to be effective longer but are dependent on
environmental factors when it comes to the amount and the rate of release
The three most common release profiles achieved by controlled release devices are
(I) zero-order release (2) first-order release and (3) t 12 release shown graphically in
figure 2 Zero-order release is the most desired release rate and is most easily obtained
by using diffusion controlled release systems (Kost and Langer 1984 Lohmann 1995)_
D iffusion Controlled D ev ices There are two general types of diffusion
controlled systems (I) matrix or monolithic and (2) reservoir The rate limiting step in
both systems is the diffusion of the drug through the polymer matrix which may be
described by (l)F ickrsquos first law of diffusion and (2) Pickrsquos second law of diffusion also
called the diffusion equation (Bird Stewart and Lightfooi 1960) For a one dimensional
system they may be written as
10
Release rate kinetic
^ first-order release
square-root of time release
zero-order release
Figure 2 Zero-order first-order and square-root of time release patterns from contolled-release devices
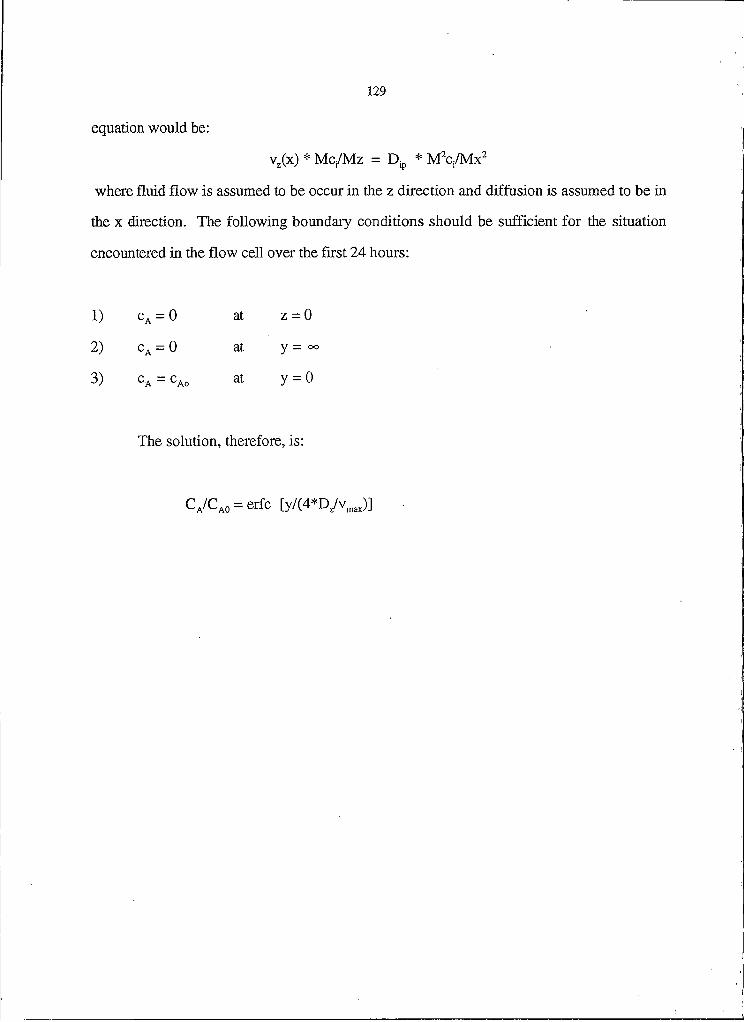
( 1 ) Ji = - D ip raquo d c d x
(2) bCjbt = Djp trcb2
Ji - mass flux of solute (drug) i
Ci - concentration of solute i
x - position of release
t - time
Djp - solute diffusion coefficient through the polymer
11
Equation (I) is commonly used to simulate the release rates from reservoir devices
The diffusion coefficient is a measure of the mobility of the individual solute molecules
through the reservoir membrane and is considered concentration independent The
concentration gradient in the membrane is represented by dCdx The negative sign reflects
the movement of solute down the concentration gradient toward more dilute regions If the
membrane is saturated with solute a burst effect may be seen which causes an initial spike
of solute A lag effect occurs when the solute must first permeate the membrane before it is
released (Baker 1987 Langer and Peppas 1981)
Equation (2) is obtained by combining equation (I) with the continuity equation for
mass transfer assuming no reaction and zero velocity Equation (2) describes transient
diffusion in membranes The diffusion coefficient is considered to be concentration
dependent It results in the square root of time release rate for simple geometries such as a
one-dimensional slab (Baker 1987 Langer and Peppas 1981) Detailed discussions on
the applications assumptions and solutions of both these equations can be found in the
literature (Langer and Wise 1984 Kost and Langer 1984 Fan and Singh 1989 Baker
1987 Lohmann 1995 Kydonieus 1992 Robinson and Lee 1987 Langer and Peppas
1981)
Monolithic devices are made by mixing the substance of concern with the polymeric
material to form a solution from which the finished product is manufactured The drug to
be released may be dissolved or dispersed (supersaturated) in the resulting polymer
depending on how much is ldquoloadedrdquo into the carrier polymer Examples of monolithic
devices include flea collars and antibiotic loaded bone cement
Examples of reservoir systems include nitroglycerin skin patches Norplanttrade a
subcutaneous birth control device and Ocusertrx1 a contact lens like device used to neat
glaucoma In these types of systems the substance of interest is surrounded by an inert
12
membrane which may be either porous or non-porous If the membrane is porous the
drug simply diffuses through the pores but if the membrane is non-porous the drug must
first dissolve in the membrane structure before it can diffuse along and between the
segments of the membrane Reservoir systems are known for the ease with which they can
be designed to achieve zero-order release rates
Both monolithic and reservoir diffusion controlled systems are rate limited by the
diffusion of the drug through the polymer Tlie choice of polymer and the resulting effect
on the diffusion and partition coefficient of the substance of concern as well as the
geometry of the device will influence drug release rates (Kost and Langer 1984 Lohmann
1995)
Chem ically Controlled S ystem s When the substance of concern is encased
in a biodegradable non-diffusive polymer the resulting reservoir device is classified as a
chemical reaction system As seen in the diffusion controlled devices there are two basic
types of biodegradable devices (I) reservoir and (2) monolithic The release rates of these
systems are strongly influenced by the erosion of the polymer In the ideal case surface
erosion would be the only factor affecting the release rate however this system has yet to
be designed (Kost and Langer 1984 Lohmann 1995)
A second category of chemical reaction controlled release is chemical
immobilization In this type of system the substance of concern may be chemically bound
to the polymer carrier backbone or it may he part of the backbone The release rate is then
influenced by the enzymatic or hydrolytic cleavage of the appropriate bonds (Kost and
Langer 1984 Lohmann 1995)
13
Solvent Activated S y s te m s The last class of controlled release devices to
be mentioned here are the solvent controlled systems These fall into two categories (I)
swelling controlled and (2) osmotically regulated In both types the substance of concern
is either dissolved or dispersed within the polymer but it is unable to diffuse through the
polymer matrix until activated In the case of the swelling controlled system the solvent is
absorbed by the matrix causing the polymer to swell and allowing the active agent to
diffuse out In the osmotic system the solvent permeates the polymer-drug system due to
osmotic pressure which promotes release Release may occur by either simple Fickian
diffusion or by non-Fickian diffusion Detailed analysis of these and other controlled
release systems can be found in the references cited previously
A dvantages Controlled release systems offers several advantages over
conventional drug delivery systems The major advantage when dealing with biomaterial
centered infections is increased efficacy of the drug The drug can be administered at the
biomaterial site thereby allowing the therapeutic levels to be maintained locally while
decreasing the systemic drug level This will minimize side effects and improve
pharmokinetics In addition the effective drug level can be sustained for an extended
period of time (Kost and Danger 1984 Lohmann 1995)
The use in joint replacement surgery of antibiotic impregnated bone cement
combined with a polymer coating such as poly-L-lactic acid polymer (PLLA) has proven
popular for its ability to prevent infections as well as aid in joint fixation (Strachan 1995)
Controlled release of antibiotics from biomaterials is less common however in operations
involving other types of implants Nonetheless research in being done into this method of
inhibiting bacterial colonization A British study showed that antibiotic impregnated
silicone rubber coatings of implanted stimulator devices significantly decreased
14
postoperative infection when compared with systemic antibiotic prophylaxis (Rushton e t
al 1989) One of the newer antibiotics receiving attention as a treatment for biomaterial-
centered infections is ciprofloxacin
C iprofloxacin
Ciprofloxacin is a Iluorinated quinolone antimicrobial agent It is active against a
broad range of bacteria ranging from aerobic gram-negative bacteria to aerobic gramshy
positive bacteria Anaerobic bacteria however are not affected by ciprofloxacin It was
approved by the Food and Drug Administration in October 1987 (Wolfson and Hooper
1989 cponline 1997)
Like other quinolone agents ciprofloxacin is a synthetic antimicrobial which mainly
effects DNA gyrase the bacterial topoisomerase II The gyrase is a two subunit enzyme
responsible for regulating the supercoiling of DNA during replication and transcription
The A subunit of the gyrase introduces nicks in the DNA that allow the B subunit to twist
the single stranded DNA (ssDNA) around its complementary strand of DNA The A
subunit of the gyrase then seals the nicks It is believed that ciprofloxacin and the other
quinolones interfere with the A subunit preventing it from sealing the nicks Bactericidal
levels of quinolones do not affect mammalian topoisomerase enzymes The exact bacterial
killing mechanism is not known but detailed discussions about the mechanisms of
quinolones action can be found in WolfSon and Hooper (1989) It is known that both slow
growing and fast growing organisms are inhibited by ciprofloxacin and that a prolonged
post-antibiotic effect is exhibited by fluoroquinolones (Wolfson and Hooper 1989
cponline 1997 Craig and Ebert 1991 Cam pa Bendinelli and Friedman 1993)
15
Ciprofloxacin has the lowest minimum inhibitory concentration (MIC) of the
quinolones The MIC90 for P aeruginosa in vitro is between 025 (igml and I jigml
Thus ninety percent of the P aeruginosa strains will be inhibited at these low
concentrations (Craig and Ebert 1991 Campa Bendinelli and Friedman 1993) Due to
its wide antimicrobial range and low MIC ciprofloxacin was chosen as a model antibiotic
for incorporation into the test PEU polymers
16
MATERIALS AND METHODS
Bacteria and Cultures
Pseudomonas aeruginosa (ERC-I) was obtained from the National Science
Foundation Engineering Research Center for Biofilm Engineering Montana State
University Bozeman MT Cultures of P aeruginosa were stored as frozen stocks
maintained in a solution of 2 peptone and 20 glycerol at -70degC
Solutions
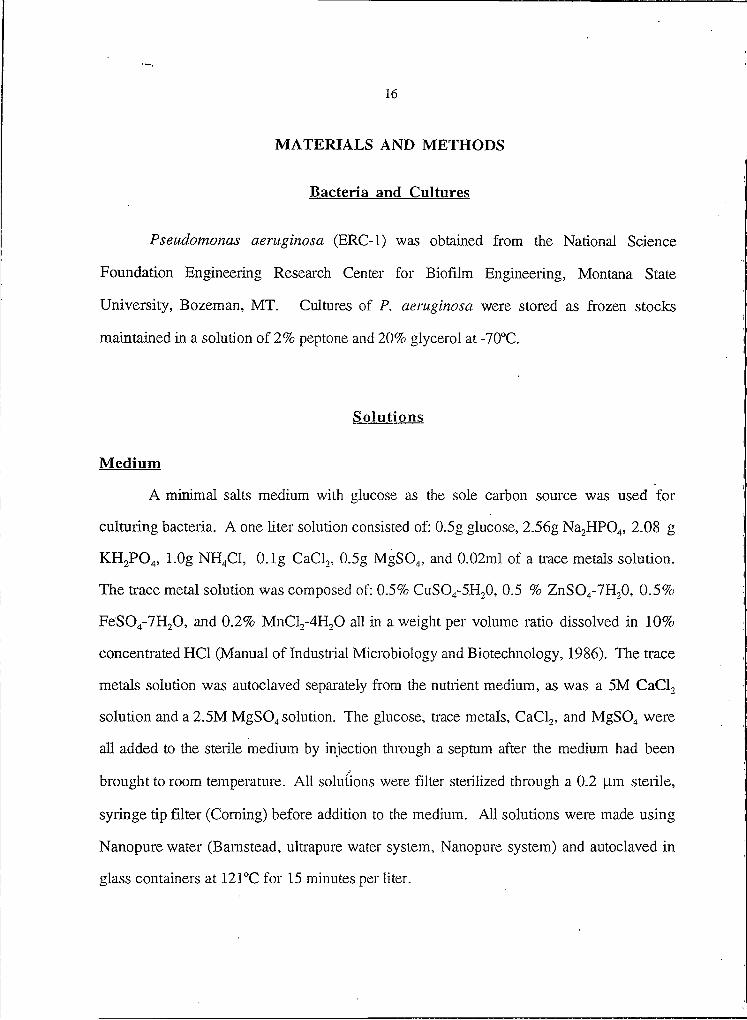
M edium
A minimal salts medium with glucose as the sole carbon source was used for
culturing bacteria A one liter solution consisted of 05g glucose 256g Na2HPO4 208 g
KH2PO 4 IOg NH4Cl Olg CaCl2 05g MgSO4 and 002ml of a trace metals solution
The trace metal solution was composed of 05 CuSO4-SH2O 05 ZnSO4-VH2O 05
FeSO4-VH2O and 02 MnCl2-4H20 all in a weight per volume ratio dissolved in 10
concentrated HCl (Manual of Industrial Microbiology and Biotechnology 1986) The trace
metals solution was autoclaved separately from the nutrient medium as was a 5M CaCl2
solution and a 2SM MgSO4 solution The glucose trace metals CaCl2 and MgSO4 were
all added to the sterile medium by injection through a septum after the medium had been
brought to room temperature All solutions were filler sterilized through a 02 |im sterile
syringe tip filter (Coming) before addition to the medium AU solutions were made using
Nanopure water (Bamstead ultrapure water system Nanopure system) and autoclaved in
glass containers at 121degC for 15 minutes per liter
17
CvtologicaI Stains
A 005 solution of Acridine Orange used for epifluorescent total cell counts was
filter sterilized using an autoclaved filter apparatus Hoechst 33342 (Sigma) was obtained
in IOOmg quantities and stored in a O0C freezer until a fresh solution was needed Then
IOml of sterile nanopure water were added through a 02 jam sterile syringe tip filter to
dissolve the powder Once the Hoechst solution was made it was kept in the refrigerator
All stains were stored in light sensitive bottles and made at fresh at least once a month
C iprofloxacin
Ciprofloxacin hydrochloride was obtained from Miles Inc as 867 fag
ciprofloxacinmg A 10000 fagml stock solution was made by dissolving 1153 mg of
powder in 10 ml of sterile nanopure water Tlte stock solution was stored in a light
sensitive glass container in the refrigerator for up to one year as per the supplierrsquos
recommendations
D etection A Milton Roy Spectronic 1201 spectrophotometer was used to
determine the proper wavelength for detecting ciprofloxacin Effluent samples were
collected from the flow cell filtered through a 02 (am sterile syringe tip filter (Corning)
and stored in amber microcentrifuge tubes kept in a 0degC freezer until analysis A Milton
Roy Spectronic 601 set at 339 nm was used to determine the concentration of ciprofloxacin
in the effluent from the flow cell_
18
Reactors and Flow Cell Systems
Continuouslvrstirred Tank Reactor (CSTR)
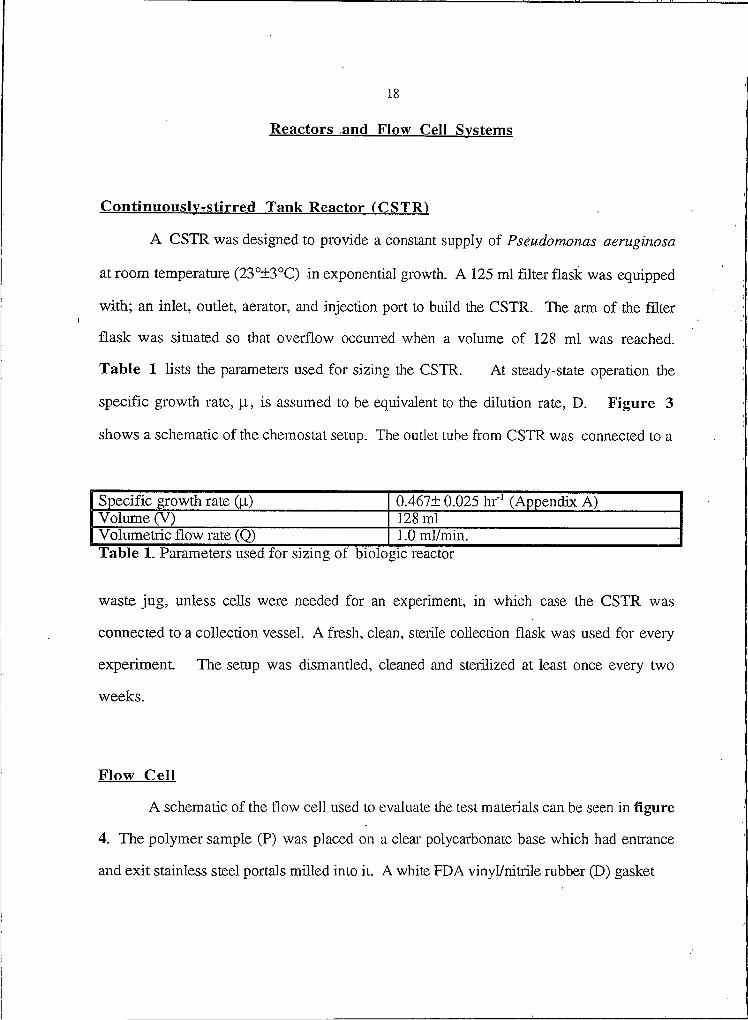
A CSTR was designed to provide a constant supply of Pseudomonas aeruginosa
at room temperature (230+3degC) in exponential growth A 125 ml filter flask was equipped
with an inlet outlet aerator and injection port to build the CSTR The arm of the filter
flask was situated so that overflow occurred when a volume of 128 ml was reached
Table I lists the parameters used for sizing the CSTR At steady-state operation tire
specific growth rate p is assumed to be equivalent to the dilution rate D Figure 3
shows a schematic of the chemostat setup The outlet lube from CSTR was connected to a
Specific growth rate (|_t) 0467+ 0025 hr1 (Appendix A)Volume (V) 128 mlVolumetric flow rate (Q) 10 mlminTable I Parameters used for sizing of biologic reactor
waste jug unless cells were needed for an experiment in which case the CSTR was
connected to a collection vessel A fresh clean sterile collection flask was used for every
experiment The setup was dismantled cleaned and sterilized at least once every two
weeks
Flow C ell
A schematic of the flow cell used to evaluate the test materials can be seen in figure
4 The polymer sample (P) was placed on a clear polycarbonate base which had entrance
and exit stainless steel portals milled into it A white FDA vinylnitrile rubber (D) gasket
19
Collectionvessel
CSTR
Figure 3 CSTR setup used to grow P aeruginosa continuously
was used to equalize sealing pressure around the polymer sample as the assembly was
screwed together A thin gauge natural latex rubber (C) gasket was clamped between the
test sample and coverglass (B) to form the flow channel The coverglass was glued over a
hole in the clear polycarbonate cover using the denture adhesive Fasteethreg Table 2
lists the dimensions of the flow channel and various hydrodynamic parameters AU of
the materials used in the flow cell were sterilized by dipping the components in 70 ethyl
20
Figure 4 Flow cell schematic (A) clear polycarbonate cover with hole through center for viewing (B) 2 glass coverslip (C) thin gauge natural latex gasket (D) white FDA vinylnitrile rubber sealing gasket (E) clear polycarbonate base (P) test
polymer
alcohol rinsing with sterile nanopure water and exposing to UV light for at least 15
minutes The test polymers were not exposed to UV The How cell was assembled
under a laminar flow hood to ensure sterility
Table 2 Flow channel dimensions and hydraulic parameters
width (w) 16 mmlength (I) 44 mmdepth (d) 08 mmarea (A) 128 mmwetted perimeter (P) 336 mmhydraulic radius (Rh) 04 mmReynolds number (Rp) 2 1entrance length (Lp) 01 mmwall shear stress (Jfl) 203 dynecnri
21
Microscope Setup and Techniques
Polym er A nalysis
The polymer samples were tested for bacterial adhesion and growth using an image
analysis system seen in figure 5 For the first six hours of the experiment approximately
5 x IO8 cellsml of stained Pseudomonas aeruginosa were flowed over the test polymer at
a rate of 10 mlmin For the remainder of the experiment complete medium without
bacteria was pumped through the flow cell
Hoechst 33342 Staining Procedure P aeruginosa in log growth were
collected and stained with lOpgml of Hoechst 33342 Once the stain was added to the
cells the flask containing the mixture was wrapped in foil and put on an insulated stir plate
for three hours After three hours the suspension was poured into a sterile centrifuge bottle
and centrifuged at 10000 xg for 15 minutes in a 20degC centrifuge (Sorvall Instruments
Dupont model RC5C GSA rotor) The liquid was then poured off and the cells were
resuspended in sterile complete medium minus the glucose The cells were washed twice
more before placing them in a sterile 125 ml Erienmeyer flask with a stir bar at a
concentration of approximately 5 x 10s cellsml This procedure was repeated every two
hours until the flow cell feed was switched to complete medium only at hour six
Cell V isualization At t=0 the flow cell was place on the stage of an
Olympus BH-2 Epi-Illumination UV upright microscope equipped with Olympus filter
combinations encompassing the ultra-violet violet blue and green regions of the
spectrum A 40x Nikon water immersion objective was used since the flow channel was
22
greater than 0100 mm in depth A minimum of three fields was captured by an Optronics
OPDEI-470OT cooled color CCD camera The resulting image was processed by a Targa
64+ analog digital converter (ADC) card and stored on computer until the image could be
analyzed using Image Pro Plustrade Images were taken every two hours until t=6 hours
when the feed was switched from the cell suspension to sterile complete medium The
remaining four time points captured were (I) t=7 or 8 hours (2) t=16 or 18 hours (3)
t=20 or 21 hours and (4) t=24 hours
Waste
Figure 5 Experimental setup Feed container = cell suspension t=0-6 hrs after t=6 hrs feed = complete medium Flow rate through flow cell 10 mlmin
23
Cell density calculations Tlie software system Image Pro Plus was used to
determine the density of cells on the polymer surface At the beginning each experiment an
image of a micrometer was taken to allow for the calibration of cell size and image area
Actual cell counts could be obtained at the early time points Cell density calculations were
then simply a matter of dividing cell count by the viewing area At time points greater than
8 hours the area occupied by cells was used to give a range for the cellular density This
was accomplished by dividing the area covered by the high and low published values for P
aeruginosa cell area (Holt 1994) to calculate cell numbers This method proved to be valid
as the cells numbers obtained at the early time points fell within the high and low range of
cell numbers calculated using area covered
In addition samples from both the inlet and outlet of the flow cell were collected for
total cell counts and viable cell counts Total counts and viable counts were also conducted
on a sample of the solution in which the polymer was placed at the end of the experiment
Before any sample was removed for these tests the polymer was sonicated for 30 seconds
to remove adherent bacteria This allowed for the calculation of cell density on the polymer
using total cell counts and viable cell counts
Total Cell C ounts A portion of each sample collected from the inlet outlet
and sonicated polymer solution was used to determine total cell counts One milliliter of
005 Acridine orange was combined with one milliliter of 2 glutaraldehyde and the
appropriate dilution of sample This solution was poured over a black polycarbonate
membrane (pore size 022 pm and 25 mm diameter Fisher Scientific) placed in a cell free
glass Millipore filter apparatus Suction was applied to trap the cells on the membrane
The membrane was mounted on a slide by putting a drop of oil (non-drying immersion oil
type FF) on a microscope slide placing the membrane cell side up on top of the oil drop
24
followed by a second drop of oil and covering with a glass cover slip The slide was
examined under fluorescent microscopy Bacteria were counted using an Reichert-Jung
Microstar IV model UV microscope with a mercury lamp and a Reicheit IOOx oil
immersion objective Total counts ( cellsgrid) were then converted to total cellsml using
the following conversion
total cells (cell count) (dilution) (conversion factor) ml ~ sample volume
where the conversion factor was 227 x 10
Viable Counts A part of the cell suspension sample was used to make serial
dilution for plating onto plate count agar (Difco Laboratories) plates A I(K) pl multipipetor
(Rainin epd 2) was used to dispense ten 10 pi drops of properly diluted cell suspension
onto a plate This procedure was performed in triplicate for each dilution plated Plates
were incubated at room temperature for 24 hours Drops that contained between 3 and 30
colonies were counted and converted to colony forming units (cfu)ml by taking into
account the dilution factor (Miles etal 1938)
Susceptibility and Adhesion Effect Studies
C iprofloxacin
Growth curves carried out in batch were used to determine the susceptibility of
increasing concentrations of ciprofloxacin on P aeruginosa These tests were not carried
out as most traditional MIC assays Studies here were performed as per the procedures of
25
Nodine and Siegler 1964 Lennette et al 1985 starting with a cell concentration of IO6
cellsml P aeruginosa was grown in separate batch cultures which contained various
concentrations of ciprofloxacin At time points ranging from t=0 to t=24 hours samples
were taken for viable counts
Hoechst Stain 1333421
Susceptibility studies were also conducted on Hoechst 33342 to ensure that the
stain did not interfere with normal cell growth The studies were conducted in the same
manner as the ciprofloxacin tests Concentrations of Hoechst stain examined ranged from
Ojagml (control) to 50|igml
Fasteethreg
Studies were also carried out to ensure that the denture adhesive Fasteethreg used
to glue the coverglass to the polycarbonate cover of the flow cell had no negative effect on
the growth of bacteria These studies were conducted in the same manner as those for
ciprofloxacin and the Hoechst stain
Hoechst Stain Effects on P a e r u g in o s a Adhesion
Tests were performed to determine whether the Hoechst stain interferes with the
normal adherence of the cells to a surface The flow cell was assembled without a polymer
sample and an untreated cell suspension was run through the cell for four hours Since the
base of the flow cell is a clear polycarbonate light microscopy could be used to monitor
cell adhesion using video recording Experiments were also carried out using stained cells
still in the staining liquid and stained cells that had been washed and resuspended in
ldquocleanrdquo medium
2 6
The possibility of ciprofloxacin and Hoechst interfering with each other was also
investigated Plate counts were used as in the susceptibility studies Microscope slides
were also made and any change in staining ability was noted
Tubing
All of the tubing used was FDA approved MasterFlex (Cole Palmer) for use with
either pharmaceuticals or food Tubing used included Pharmedreg size 1314 and 16
Norprenereg Food size 13 and 14 and Tygonreg Food size 14 Before each use it was
sterilized by autoclaving at 121degC for 15 minutes
Biom aterial Fabrication
BP Control Polym er
A poly (ether) urethane (Biospantrade) poly ethylene glycol (PEG) film (BP) was
prepared for use as a control The method of fabrication was as follows (I) 20 ml of
deionized water was used to dissolve 2 g of PEG (Polyscience) (2) the resulting solution
was lyophilized and the powder was sieved to obtain 90 pm or smaller particles (3) this
powder was mixed with a 24 Biospantrade solution (Polymer Technology Group Inc) (4)
the polymer solution was degassed transferred to a Teflon mold (Chemware) and
incubated at 60degC for one day and finally (5) the film was dried completely in a vacuum
chamber
27
Test Polym ers
The test polymers were manufactured by the same procedure except the
ciprofloxacin containing films also had an equal amount of ciprofloxacin added in step (I)
In addition the test polymers were coated with either triethylene glycol dimethyl ether
(triglyme) or tiiglyme plus n-butylmethacrylate (BMA) by glow discharge plasma
deposition (GDPD)
Note All test materials were fabricated at the University of Washington by Connie
Kwok
2 8
RESULTS AND DISCUSSION
Pseudomonas aerueinosa Growth Experiments
Batch S tud ies
Growth Rate Studies were conducted to determine the growth rate of P
aeruginosa under experimental conditions Table 3 (Appendix A) The specific growth
rate (I was found to be 0467 hr1
Experiment specific growth rate (h r1)I 04802 05023 04444 04436Average 0467plusmn0025Table 3 Specific growth rate for P a eru g in osa grown at room temperature with SOOppm
glucose fully aerated
Susceptibility S tu d ies In addition susceptibility studies were done on
ciprofloxacin Hoechst 33342 and Fas teethreg (Appendices BC and D) The
ciprofloxacin tests confirmed the published M IC90 of l(igml The Hoechst stain (33342)
were shown not to inhibit growth at 10 |_igml Table 4 summarizes the results of the
Hoechst 33342 susceptibility tests Results from the Fasteethreg susceptibility studies show
no negative effects on P a eru g in o sa
Hoechst 33342 concentration (pgml) Growth inhibited0 No5 No10 No50 YesTable 4 Summary of Hoechst 33342 studies
29
Flow Cell Experimental Protocol
The concentration of resuspended bacteria used to challenge the test polymers was
roughly 5 x IO8 cellsml The flow rate to the parallel plate flow cell was maintained at
approximately 10 mlmin for the duration of each experiment Samples were taken for
total counts and viable counts from both the system influent and the effluent at t = 0 2 4
and 6 hours for every experiment Only effluent samples were collected after t = 6 hours
Effluent samples were also used to determine if any ciprofloxacin eluted from the test
polymers containing the antibiotic All the experiments were earned out at room
temperature in the medium previously described
Flow Cell Experiments
The ability of a polymer to affect bacterial adherence and colonization was examined
in flow cell experiments run on four different formulations of a poly (ether) urethane (PEU)
base material The control material (BP) was a PEU base matrix (Biospantrade) containing
poly (ethylene glycol) (PEG) as a pore forming agent
The materials tested included (I) triglym e BP coated with triethylene glycol
dimethyl ether (triglyme) (2) ciprotriglym e BP made up of equal parts PEG and
ciprofloxacin coated with triglyme (3) BM A BP coated with a layer of n-
butylmethacrylate (BMA) underneath the triglyme coating and (4) ciproBM A BP made
up of equal parts PEG and ciprofloxacin coated with BMA followed by triglyme (Table
5) The triglyme coating was used to control the release rates of the model antibiotic
ciprofloxacin
30
Polym er FormulationBPControl BiospanlivV PEG (poly ethylene glycol)triglyme Triethylene glycol dimethyl ether coated BPciprotriglyme BP made with equal parts PEG and ciprofloxacin coated with triglymeBMA BP coated with n-butylmethacrylate followed by a coating of tryiglmeCiproBMA BP made with equal parts PEG and ciprofloxacin coated with BMA
followed by a coating of triglyme
Table 5 Description of polymers used in flow cell experiments
Three samples of each polymer were tested A good representation of the events at
the polymer surface is provided by image analysis (IA) as it is obtained from pictures of
the stained cells on the surface Figures 6 and 7 illustrate the attachment and growth of
P aeruginosa on the control polymer over the course of an experiment Figure 8
displays the differences in cell density on three different polymers after 24 hours in the
flow cell A significant decrease in bacterial adhesion and colonization was evident when
the test polymers were compared to the BP polymer at the end of the experiments and over
the entire run using pictures taken for TA (figures 6 7 and 8)
The graphs generated from the image analysis data (figures 9 10 and 11) were
obtained from a single run for each polymer Each experiment was however replicated
three times The error bars were obtained because at least three different fields of view
were taken for each time point from which the average cell density and the standard
deviation were calculated (Appendix E)
Figure 6 BiospanControl time course of cell adhesion
t=0 hours t=2 hours
t=4 hours t=6 hours
Figure 7 ControlBiospan polymer bacterial colonization
t=24 hours
Figure 8 Comparison of the extent of colonization of different polymers at t=24 hours
triglyme Cipro-triglyme
34
CNlt
EE
0)O
pound(AC0)O
100E+06
100E+05
100E+04
100E+03
100E+02
100E+01
100E+00 J -
I III bullbullbullbullbullbullbullbullbull Ce -
Control STrigIyme 0 ciproAriglyme S BMA S ciproBMA
Polymers
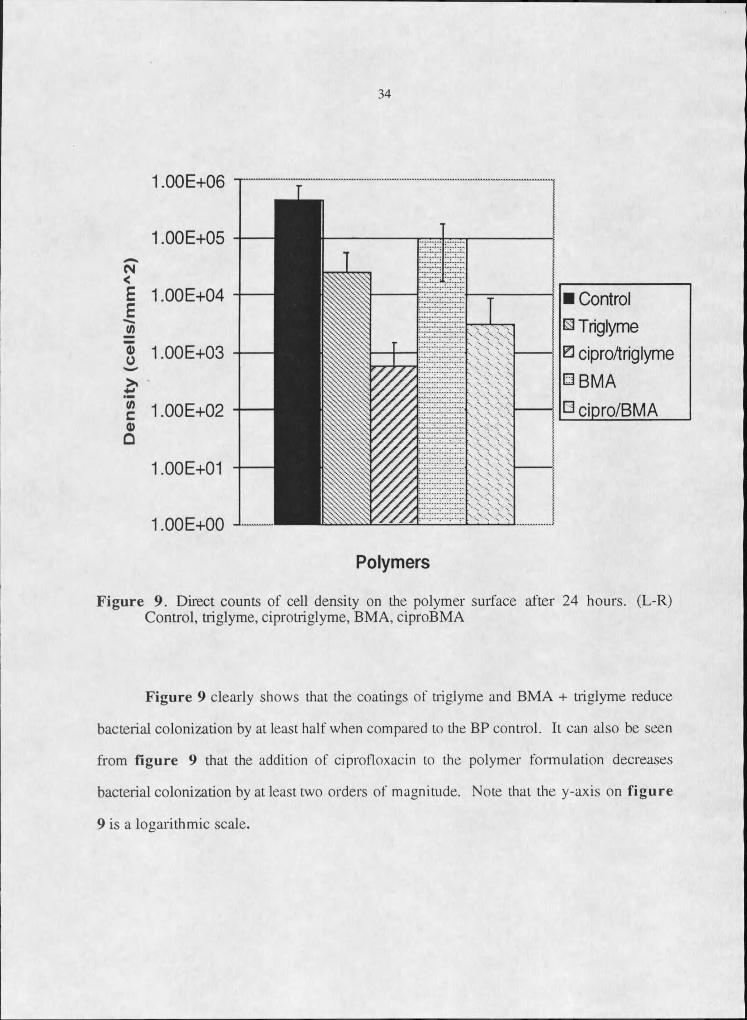
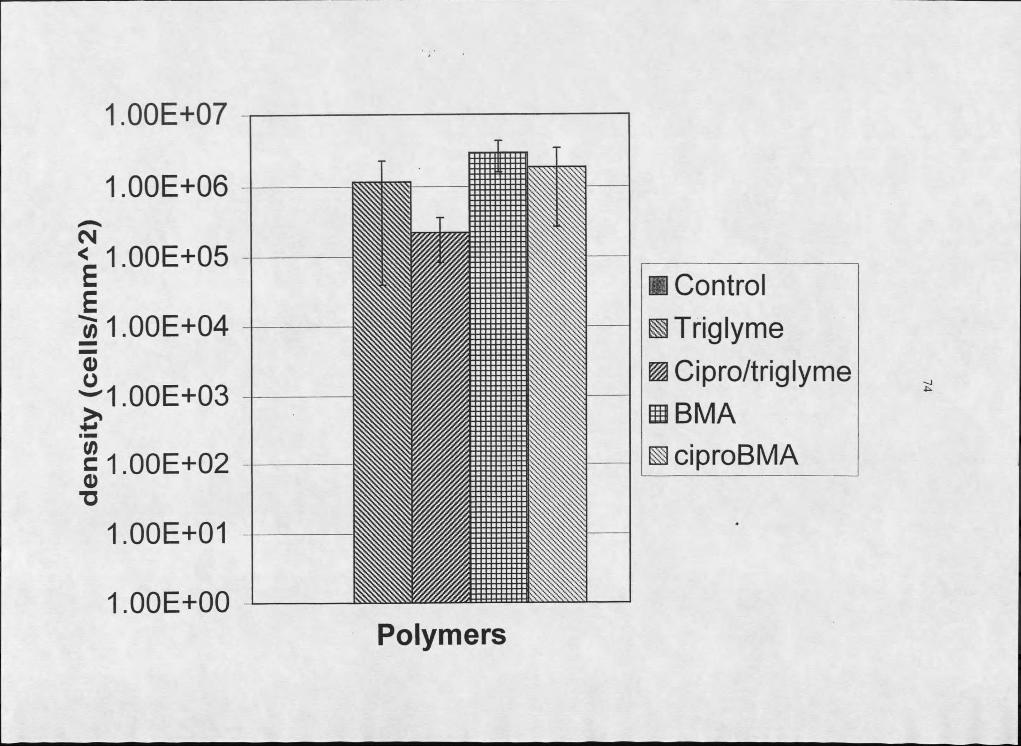
Figure 9 Dhiect counts of cell density on the polymer surface after 24 hours (L-R) Control triglyme ciprotriglyme BMA ciproBMA
Figure 9 clearly shows that the coatings of triglyme and BMA + triglyme reduce
bacterial colonization by at least half when compared to the BP control It can also be seen
from Figure 9 that the addition of ciprofloxacin to the polymer formulation decreases
bacterial colonization by at least two orders of magnitude Note that the y-axis on figure
9 is a logarithmic scale
35
60E+05
50E+05
40E+05
30E+05
20E+05
10E+05
OOE+OO I r
-10E+05
tim e (hrs
mdash Control
-laquo~-trigiyme
A ciprotriqlyme
FigurelO Time course cell colonization curve of control triglyme ciprotriglyme obtained from image analysis
Figure 10 shows that bacterial attachment and colonization to the control polymer is much
greater than to either the triglyme or ciprotriglyme polymer Analysis of the data in
Appendix E will show the same trend for BMA and ciproBMA At t = 6 hours the feed
was switched from a medium containing ~5 x IO8 cellsml with no glucose to a sterile feed
of complete medium plus 500 ppm glucose Therefore any increase in cell density can be
attributed to growth Slightly more growth can be seen on the triglyme than on the
ciprotriglyme over the course of the experiment however neither of these polymers
exhibits the growth found on the control polymer
36
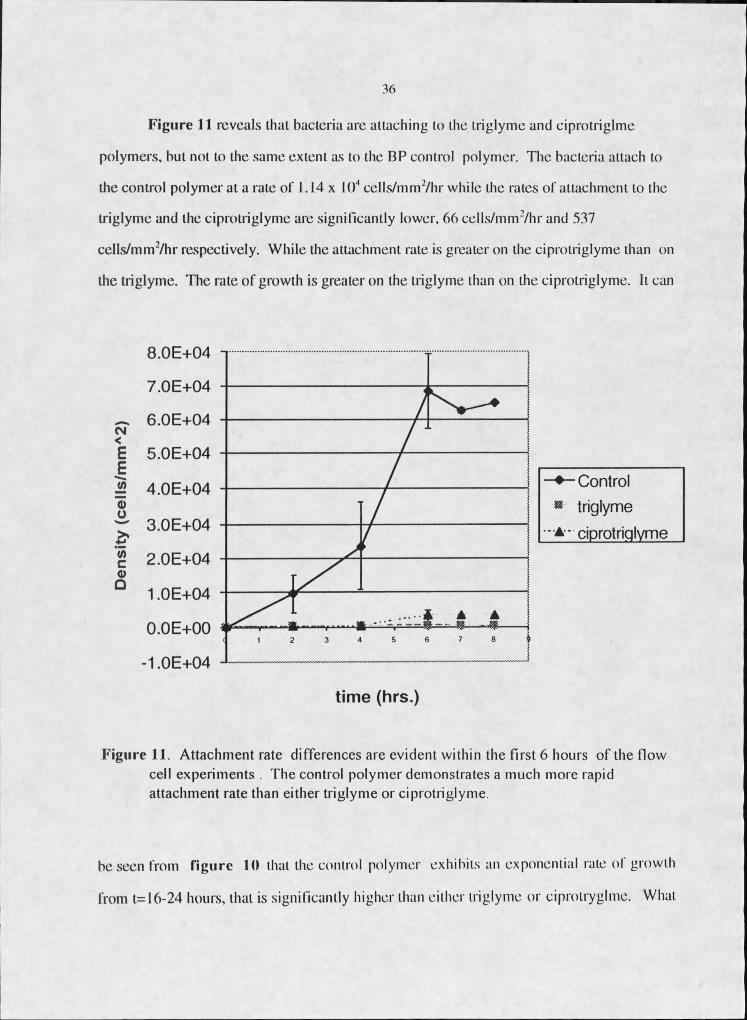
Figure 11 reveals that bacteria are attaching to the triglyme and ciprotiiglmc
polymers but not to the same extent as to the BP control polymer The bacteria attach to
the control polymer at a rale ol 114 x IO4 ccllsmnrhr while the rates of attachment to the
triglyme and the ciprolriglymc are significantly lower 66 cel I smm 2Zhr and 537
C ellsZm m 2Zhr respectively While the attachment rate is greater on the ciprolriglymc than on
the triglyme The rale of growth is greater on the triglyme than on the ciprolriglymc It can
80E+04
70E+04
60E+04
E 50E+04
40E+04
30E+04
20E+04
10E+04
00E+00
-10E+04
time (hrs)
Control
triglyme
A ciprotriqlyme
Figure 11 Attachment rate differences are evident within the first 6 hours of the flow cell experiments The control polymer demonstrates a much more rapid attachment rate than either triglyme or ciprotriglyme
be seen from figure 10 that the control polymer exhibits an exponential rale of growth
from 1=16-24 hours that is significantly higher than either triglyme or ciprolryglmc Whal
37
is not readily seen is the fact that triglyme exhibits a faster growth rate than the
ciprotriglyme 181 x IO3 cellsmm2hr versus 27 cellsmm2hr
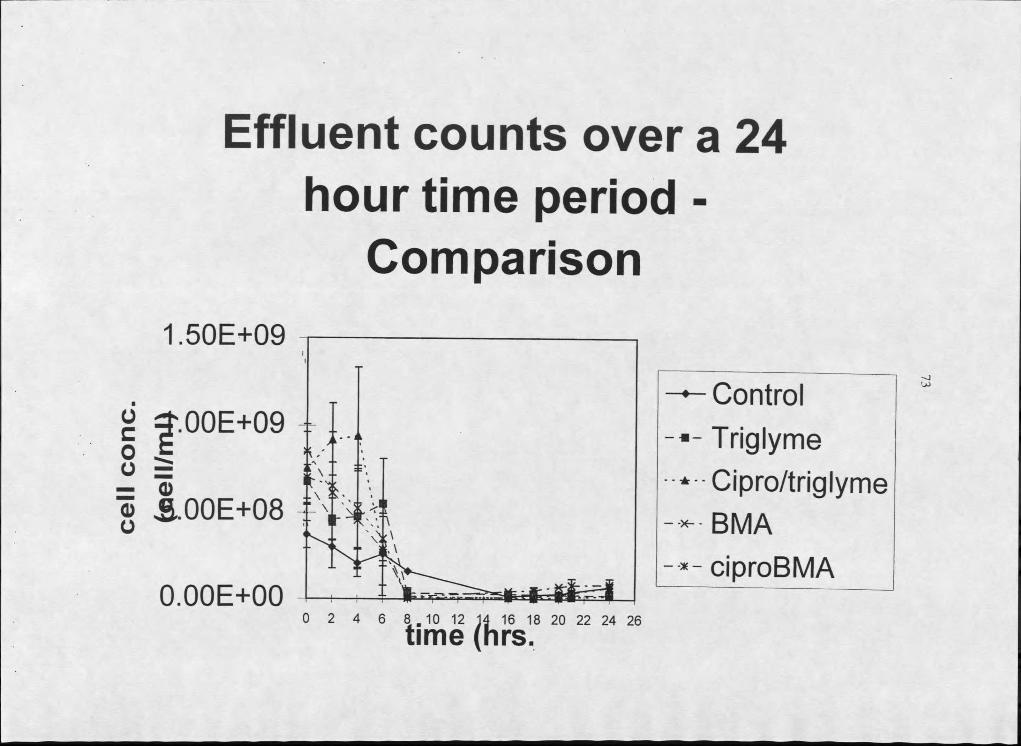
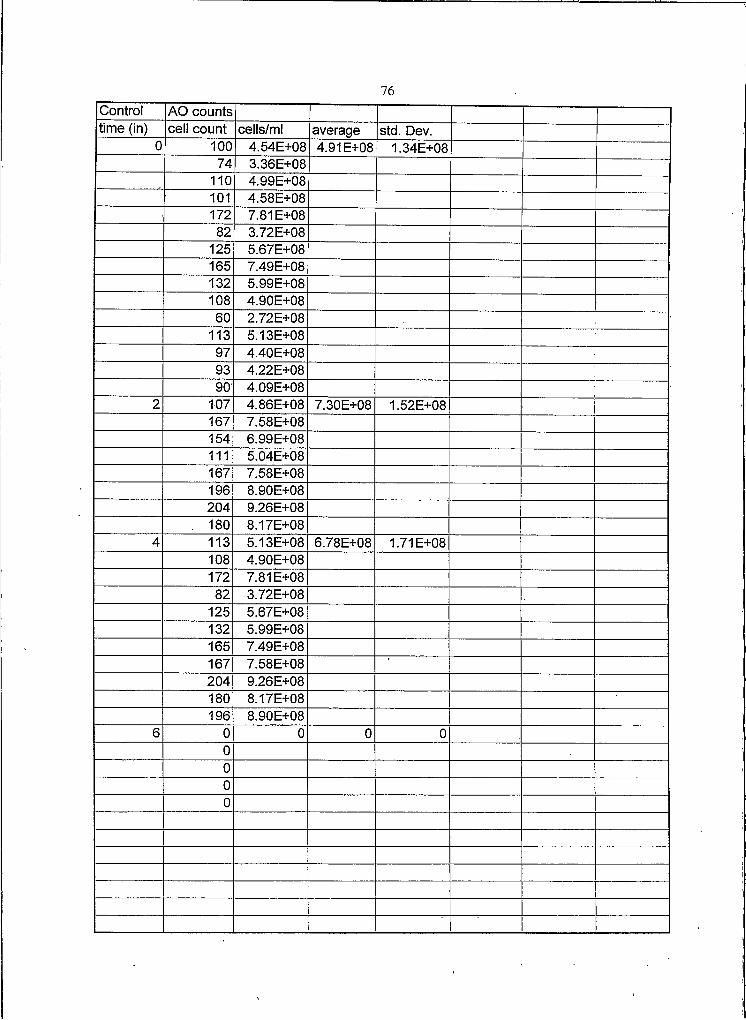
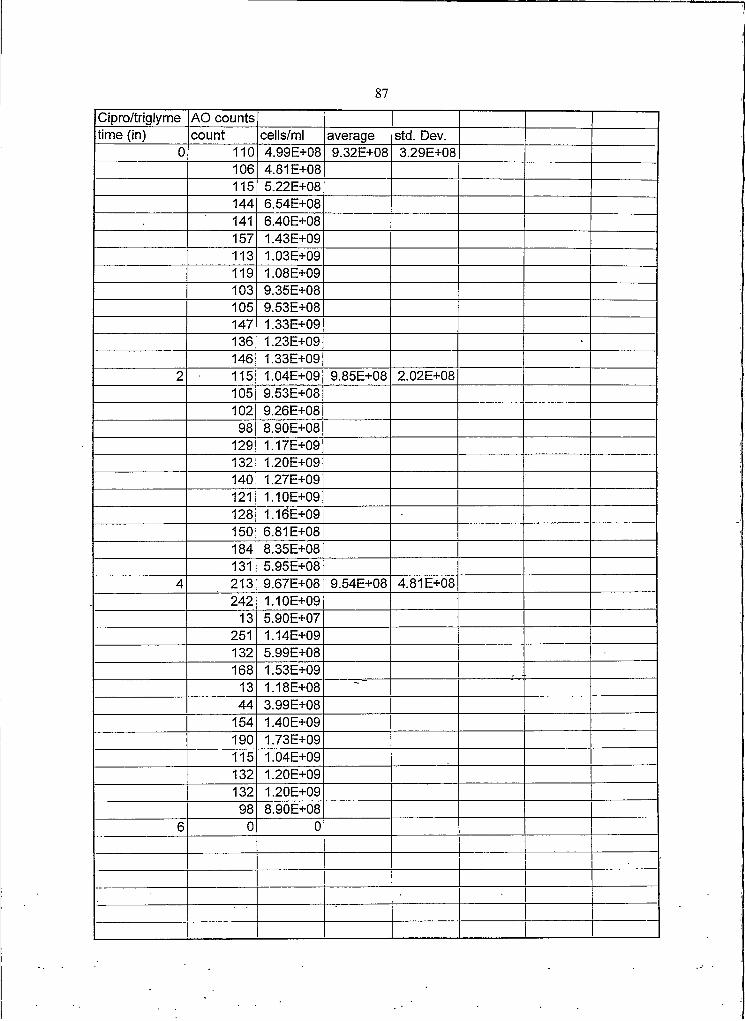
Total counts of the effluent found in Appendix F back up the imagae analysis
results ( figures 1213) F igure 12 shows that for the first six hours ~5xlO8 cellsml
are being pumped through the flow cell Once the supply of cells is cut off at t=6 hours
cells can still be seen in the effluent implying that growth of new cells is taking place in the
flow cell system
140E+09
120E+09
T=100E+09
S800E+08
S600E+08
agt400E+08
200E+08
000E+000 2 4 6 8 1012 141 6 1 8 20 22 24 26
mdash Control Triglyme
Ciprotriglyme- -x- - BMA
ciproBMA
time (hrsF igure 12 Total counts made with Acridine Orange From t=0-6 hours a feed
composed of a bacterial suspension in medium without a carbon source was pumped through the flow cell after t=6 hous the feed was switched to sterile complete medium
Figure 13 obtained from total cell counts displays the same trend with regard to
the amount of cell density on the polymer surface after 24 hours as figure 9 which was
made from direct count data The control polymer exhibits the highest cell density after
24 hours The effluent data does not demonstrate as much of a difference between
polymers as the image analysis data which may be explained by the growth and sloughing
of bacteria in the effluent tubing It is to be expected that the samples collected from the
Den
sity
(ce
lls
mm
A2)
38
effluent would have higher cell counts since there is more surface area available for cell
growth
100E+08 T
100E+07
100E+06
100E+05
100E+04
100E+03
100E+02
100E+01
100E+00Polym ers
I n Control | s Triglyme | ^Ciprotriglyme I SBMA I sciproBMA
Figure 13 Calculated cell density on the ldquotestrdquo polymers using total cell count (acridine orange) data Note that it follows the same trend as the image analysis data
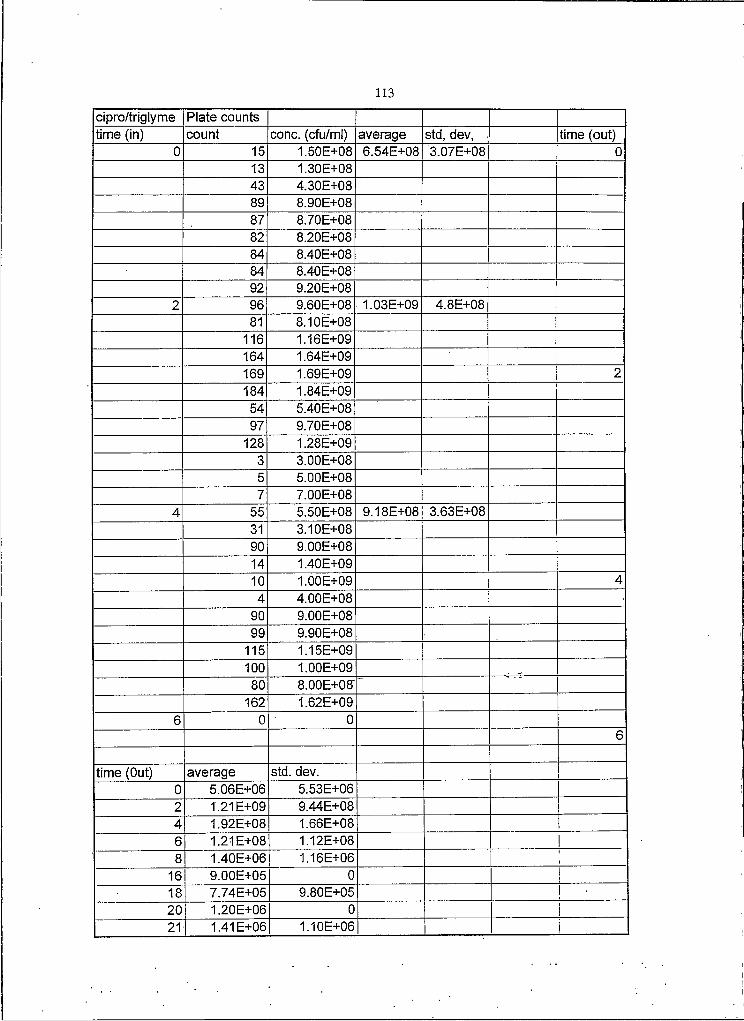
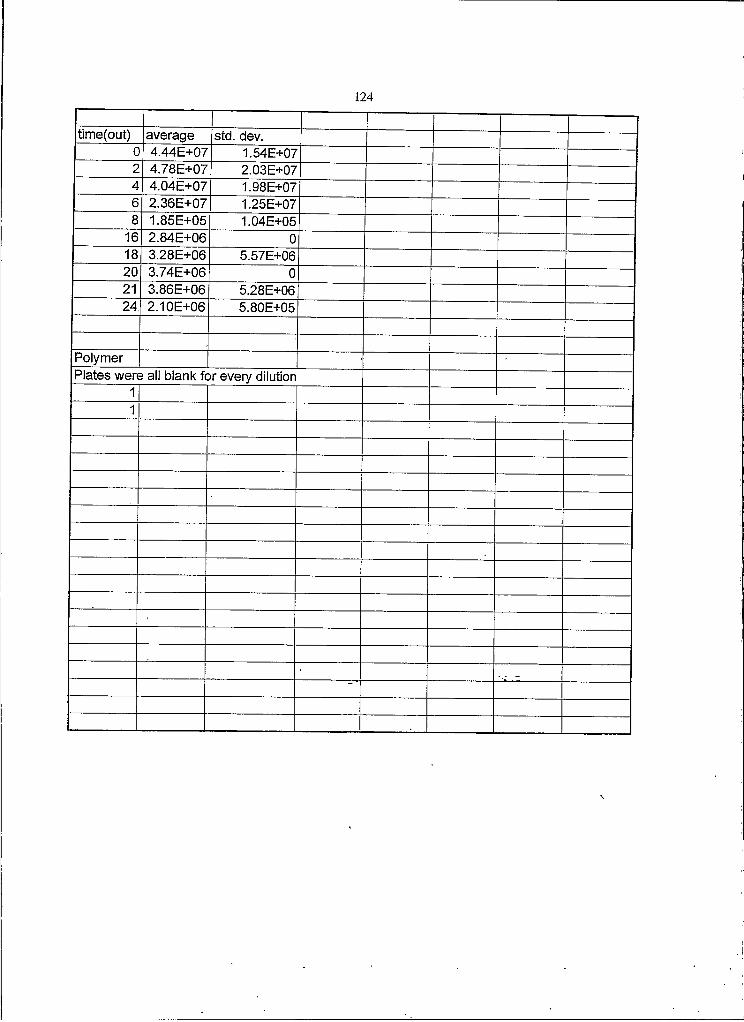
Figure 14 shows that viable cells are being pumped through the flow cell while
figure 15 demonstrates that the concentration of ciprofloxacin at the polymer surface is
high enough to have a noticable effect on the density of bacteria on the polymer (Appendix
G - Plate Count Data)
39
Effluent viability data from t = 0-24hours
100E+10
100E+09
100E+08
j 100E+07 -
100E+06 -
100E+05
100E+04
time (hrs)
mdashmdash Control triglyme
bull-c ip ro tr ig ly m eBMA
-bull- ciproBMA
Figure 14 Plate count data from effluent samples taken from the polymer flow cells during the course of the experiments shows that viable cells are going through the flow cell
As stated previously total counts and viable counts are not considered to be as
accurate as direct counts The effect of the extra surface area available for cell adhesion and
growth provided by the tubing was not factored into the results Subsequent sloughing
andor entrapment of cells in this region of the flow cell setup could affect the cell
concentration data collected Figure 16 demonstrates the variation obtained from the
den
sity
(cf
um
mA2
)40
concentration data collected Figure 16 demonstrates the variation obtained from the
100E+06
SxltltSSSxgtxv-v
mm
I B
reg Control reg triglyme 0 ciprotriglyme 0 BMA Q ciproBMA
Polymers
Figure 15 Cell densities on polymers calculated from plate count data No colonies were found on any of the plates made for the ciproBMA polymer (L-R) Control triglyme ciprotriglyme BMA ciproBMA
same polymer using different techniques As stated previously the results obtained from IA
are considered to he the most accurate since they are taken from the polymer surface and
not the effluent
cell
dens
ity (c
ells
or c
fum
m2)
41
100E+07
100E+06
100E+05
100E+04
100E+03
100E+02
100E+01
100E+00 Plate counts Total counts IA
I
Figure 16 demonstrates the variations in bacterial density on the triglyme polymer after twenty four hours using image analysis (IA) acridine orange staining of the effluent and plate counts of the effluent
C iprofloxacin re lease
The extra surface area could also factor into the amount of ciprofloxacin detected in
the effluent (table 6) of the polymers incorporating ciprofloxacin In one millileter of
effluent roughly 3 ug of ciprofloxacin should be detected It should be noted that all of
the polymers containing ciprofloxacin still retained significant amounts of ciprofloxacin
This is to be expected given that the initial loading of ciprofloxacin was 04g Additionally
42
an earlier study found that these polymers continue to elute ciprofloxacin for up to 128
hours in a well stirred flask (Kwok CS et al 997) The erratic release of ciprofloxacin
seen in table 6 may be due to the interaction of the antibiotic with cells growing in the
effluent tubing ciprofloxacin degradation resulting
Experiment Time (hours) Cipro cone (figml) of points above detectionCiprotriglym e
O 35 plusmn21 2
2 17 I4 5 I6 4 I8 ND O18 ND O21 18 I24 5 + 5 2
CiproBM A O 6 plusmn 5 32 I I4 ND O6 ND O8 29 I18 2 I21 ND O24 ND O
Table 6 Ciprofloxacin concentrations in effluent ND = not detectable
from light exposure pulsating flow unforeseen release behavior or damage to polymer
coating Appendix H expands on the mathematical theory behind the controlled-release
of a drug from a one-dimensional slab under flow conditions
Overall the flow cells experiments showed that ciprofloxacin could successfully be
incorporated into BiospantradePEG polymers and still maintain its efficacy In addition
they demonstrated that cell adhesion and colonization of opaque materials could be
monitored continuously for up to 24 hours under Jlow conditions The results involving
the triglyme and BMA coatings were also encouraging
43
SUMMARY
The research conducted for this study involved exposing planktonic Pseudomonas
aeruginosa to 10 |igml of the DNA stain Hoechst 33342 for 3 hours The cell
suspension was then washed and resuspended in fresh complete medium minus glucose
the carbon source Every two hours for six hours a fresh batch of resuspended cells was
pumped over a ldquotestrdquo polymer in a flow cell being monitored microscopically for bacterial
attachment After six hours the flow was switch from the cell suspension to complete
medium plus glucose in order to observe cell adhesion and growth over the 24 hour run
Pictures were taken periodically over the course of the experiment and examined by image
analysis to detect changes in bacteria cell density on the surface of the ldquotestrdquo polymer The
results obtained from image analysis were for the most part confirmed by total and viable
cell counts performed on effluent samples Within the limitations and scope of this work
the results show that
1) Both the BMA coating and the triglyme coating can cut bacterial adhesion and
colonization in half
2) The addition of the ciprofloxacin to the polymer matrix decreases bacterial adhesion and
colonization by at least two orders of magnitude when compared with the control
3) Hoechst 33342 can be used at lOugml without interfering with P aeruginosa growth
patterns
4) Hoechst 33342 enables bacterial adhesion and biofilm formation on an opaque surface
to be monitored in a flow cell system for up to 24 hours
The results of this research indicate that it would be worthwhile to pursue
development of the ldquotestrdquo polymers for use as biomedical materials Further investigation
into how well image analysis correlates with actual bacterial cell adhesion and colonization
44
is also suggested from these results It would be interesting to run a set of experiments on
a substratum comparing image analysis and destructive sampling in which the flow cell is
broken down and the substratum is removed at every time point In addition a better
indication of the long-term performance of these materials could be gained by conducting
tests over a longer period of time a week or more Likewise the exposure of the material
to proteins before andor during bacterial challenge would provide more realistic test
conditions Dealings with industry have shown that the types of adhesion and colonization
experiments conducted in this study are among the initial steps in gaining approval from the
FDA
45
BIBLIOGRAPHY
Ackart WB Camp RL Wheelwright WL and JS Byck A n tim ic r o b ia l P o ly m e r s Journal of Biomedical Materials Research V 9 p 55 - 68 1975)
Baker RW Controlled Release of Biologically Active A gents John Wiley amp Sons New York NY 1987
Bellido F and REW Hancock S u s c e p t ib i l i ty a n d R e s is ta n c e o f P s e u d o m o n a s a e ru g in o sa to A n tim ic r o b ia l A g e n ts P s e u d o m a n a s a e r u g i n o s a as an Opportunistic Pathogen eds M Campa M Bendinelli and H Friedman Plenum Press New York NY p 321- 348 1993
Bird RB Stewart WE and EN Lightfoot Transport Phenomena John Wiley amp Sons New York NY p 495 - 625 I960
Blanchard CR B io m a te r ia ls B o d y P a r ts o f the F u tu re lthttpwwwswiiorg3pubsttodayfallimplanthtmgt June 4 1996
Bondi A B a s ic P h a m a c o lo g ic T ec h n iq u es f o r E va lu a tin g A n tim ic r o b ia l A g e n ts I Animal and Clinical Pharm acologic Techniques in Drug Evaluation eds JH Nodine and PE Siegler Year Book Medical Chicago IL p 440 - 450 1964
Bryers JD M o d e lin g b io ftlm a cc u m u la tio n Physiological Models in Microbiology V o l rsquol l ed Brazin MJ and Prossser JL CRC Press Boca Raton FE p1091
1988
Byun Y Jacobs HA and Sung Wan Kim M ec h a n ism o f th ro m b in in a c tiv a tio n b y im m o b il iz e d h e p a r in Journal of Biomedical Materials Research V 30 p 423 - 427 1996
Carballo J CM Ferreiros and MT Criado Im p o r ta n c e o f experim en ta l d e s ig n in th e e v a lu a tio n o f th e in flu en ce o f p r o te in s in b a c te r ia l a d h e re n c e to p o ly m e r s Medical Microbiology and Immunology V 180 p 149-155 1991
Characklis WG and KC Marshall eds Biofilms J Wiley amp Sons New York NY 1990
Ciprofloxacin Ciproreg Ciproreg IV C loxanreg Clinical Pharmacology Online lthttpwwwcponlinegsmcomscriplsfullmonoshowmonopl7mononum=I 12gtMay 19 1997
Clinical Applications of Biomalerials NIH Consens Statement 1982 Nov 1-3 [cited 1997 August 21] 4(5)1-19 httptextnlmnihgovnihcdcwww34txthtml
46
May 27 1996
Craig and Ebert Pseudomonas aeruginosa Infections amp Treatment p 467-491
Dankert J Hogt AH and J Feijen Biomedical Polymers Bacterial Adhesion Colonization and Infection CRC Critical Reviews in B iocom patibility V 2 p 219-301 1986
Doi K Nakayama Y and T Matsuda Novel compliant and tissue-permeable microporous polyurethane vascular prosthesis fabrication using an excimer laser ablation technique Journal o f Biomedical M aterials Research V 31 p 27 - 33 1996
Eginton PJ et al The influence o f substratum properties on the attachment o f bacterial cells Colloids and Surfaces B B io in terfaces V 5 p 153-159 1995
Farber BF and AG Wolff Salicylic acid prevents the adherence of bacteria and yeast to silastic catheters Journal o f Biomedical Materials Research V 2 7 p 5 9 9 - 6021993
Fan LT and SK Singh Controlled Release a Quantitative Treatments Springer-Verlag New York NY 1989
Francois P et al Physical and biological effects o f a surface coating procedure on polyurethane catheters Biom aterials V 17 p 667 - 678 1996
Golomb G and A Shplgelman Prevention o f bacterial colonization on polyurethane in vitro incorporated antibacterial agent Journal o f Biomedical Materials Research V 25 p 937 - 952 1991
Greenfeld et al Decreased bacterial adherence and biofilm formation on chlorhexidince and silver sulfadiazine-impregnated central venous catheters implanted in swine Critical Care Medicine V 23 p 894 - 900 1995
Gristina AG Biomaterial-Centered Infection Microbial Adhesion Versus Tissue Integration Science V237 p1588-1595 Sept 1987
Gristina AG Implant Failure and the Immuno-Incompentent Fibro-InflammatoryZone
Clinical Orthopaedics And Related Research V298 p106-118 1994
Gristina AG et al Cell biology and molecular mechanisms in artificial device infections The International Journal of Artificial Organs V16 p755- 764 1993
Gristina AG et al The Glycocalyx Biofilm Microbes and Resistant Infection Seminars in Arthroplasty V5 p160-170 October 1994
47
Gristina AG Naylor PT and Q Myrvik The Race for the Surface Microbes Tissue Cells and Biomaterials Molecular M echanisms o f M icrobial Adhesion eds Switalski L Hook M and E Beachey Springer-Verlag New York NY 1989
Gristina AG Passive Local Immunotherapy ldquoPLIrdquo to Prevent Biomaterial and Wound Infection Frank N Nelson Lecture Nov 11 1997
Hanker JS and BL Giammara Biomaterials and Biomedical Devices S cien ce V 242 p885-892 Nov 11 1988
Holt JG et al B ergeyrsquos Manual of Determinative B acterio logy 9th ed Williams amp Wilkins Baltimore MD p 93 - 941994
Hulshoff JEG et al Evaluation of plasma-spray and magnetron-sputter Ca-P- coated implants An in vivo experiment using rabbits Journal o fBiomedical Materials Research V 31 p 329 - 337 1996
Jansen B and W Kohnen Prevention o f biofilm formation by polymer modificationJournal of Industrial Microbiology V 15 p391-396 1995
Kaibara et al Promotion and control o f selective adhesion and proliferation o f endothelial cells on polymer surface by carbon deposition Journals o fBiomedical Material Research V 31 p 429 - 435 1996
Kost J and R Danger Controlled release of bioactive agents Trends in B iotechnology V2 p47-51 1984
Kwok CS et al Design of Infection-resistant Polymers I Fabrication and Formulation in the process of submitting 1997
Kydonieus A ed Treatise on Controlled Drug Delivery Fundam entals Optimization Applications M arcelDekker Inc New York NY 1992
Danger RS and DL Wise eds Medical Applications of Controlled R e lea se Volume I CRC Press Inc Boca Raton PD 1984
Danger RS and DL Wise eds Medical Applications of Controlled R e lea se Volume II Applications and Evaluation CRC Press Inc Boca Raton PD 1984
Danger RS and N A Peppas Present and future application of biomaterials in controlled drug delivery systems Biomaterials V 2 p 244 -246 1981
Lazarus SM et al A Hydrophilic Polymer-Coated Antimicrobial Urethral CatheterJournal of Biomedical Materials Research V 5 p 129 - 138 1971
Lee S-D et al Artificial cornea surface modification o f silicone rubber membrane by graft polymerization o f pHEMA via glow discharge B iom aterials V 17 p
4 8
587 - 5951996
Lindhout T etal Antithrombinactivity o f surface-bound heparin studied underflow conditions Journal of Biom edical Materials Research V 29 p 1255 - 1266 1995
Lohmann D Controlled Release-recent progress in polymeric drug delivery systems M acromol Symp V 100 p25-30 1995
Manual of Industrial M icrobiology and Biotechnology p30 1986
Massia SP and JA Hubbell Human endothelial cell interactions with surface- coupled adhesion peptides on a nonadhesive glass substrate and two polymeric biomaterials Journal of Biom edical Materials R esearch V 25 p 223- 242 1991
Materials Science Materials for medicine Britanica Onlinelthttpwwwebcom 180cgi-bingDocF=macro5004232htmgt [Accessed Nov 20 1997]
Miles AA Misra SS and JO Irwin The Estimation o f the Bactericidal Power o f the Blood Journal of Hygiene V 38 p 732-749 1938
Paulsson M Gouda I Larm O and A Ljungh Adherence o f coagulase-negative staphylococci to heparin and other glycosaminoslycans immobilized on polymer surfaces Journal of Biomedical M aterials Research V 28 p 311 - 317 1994
Portoles M Refojo MF and F-L Leong Poloxamer 407 as a bacterial abhesive for hydrogel contact lenses Journal o f Biomedical M aterials Research V 28 p 303 - 309 1994
Price JS Tencer AF Arm DM and GA Bohach Controlled release o f antibiotics from coated orthopedic implants Journal o f Biom edical Materials Research V 30 p281-286 1996
Robinson JR and VHL Lee Controlled Drug Delivery Fundamentals and Applications 2nd ed Marcel Dekker Inc New York NY 1987
Rushton DN Brindley GS Polkey CE and GV Browning Implant infections and antibiotic-impregnated silicone rubber coating Journal of N eu ro lo g y Neurosurgery and Psychiatry V 52 p 223-229 1989
Ryu GH et al Antithrombogenicity o f lumbrokinase-immobilized polyurethane Journal of Biomedical M aterials Research V 28 p 1069-1077 1994
Schlichting H Boundary-Layer T heory translated by J Kestin 7 ed McGraw- Hill New York NY p 596-615 1979
49
Seyral P Zannier A JN Argenson and D Raoult The r e le a s e in v itro o f v a n c o m y c in a n d to b ra n y c in f r o m a c ry lic b o n e cem en t Journal o fAntimicrobial Chemotherapy V 33 p 337 - 339 1994
Strachan CJL The p r e v e n tio n o f o r th o p a e d ic im p la n t a n d v a sc u la r g ra ft in f e c t io n s Journal o f Hospital Infection V 30 (Supplement) p 54-63 1995
Suljak JP e t a l B a c te r ia l a d h e s io n to d en ta l am algam a n d th re e res in c o m p o s i te s Journal of Dentistry V23 p171-176 1995
Sullam PM Payan DG Dazin PF and FH Valone B in d in g o f V irid a n s G rou p S tr e p to c o c c i to H u m a n P la te le ts a Q u a n tita tiv e A n a ly s is Infection and Immunity V 58 p 3802-3806 Nov 1990
Tebbs SE Sawyer A and TSJ Elliot In flu en ce o f su rfa ce m o rp h o lo g y on in v i t r o b a c te r ia l a d h e re n c e to c e n tra l ven o u s c a th e te r s British Journal o f Anaesthesia V 72 p 587-591 1994
Thomsberry C and JC Sherris Section XI Laboratory Tests in Chemotherapy General Considerations Manual of Clinical Microbiology eds EH Lennette A Balows W J Hausler and HJ Shadomy 4th ed American Society for Microbiology Washington DC p 959 -977
Wang I Anderson JM and RE Marchant P la te le t -m e d ia te d a d h e s io n o f S ta p h y lo c o c c u s e p id e r m id is to h yd ro p h o b ic N H L B I re fe ren ce p o ly e th y le n e Journal o f Biomedical Materials Research V 27 p 1119-1128 1993
Weber W J and F A DiiGiano Process Dynamics in Environmental S ystem s John Wiley amp Sons Inc p 390 - 398 1996
William SK e t al F o rm a tio n o f a m u ltila y e r ce llu la r lin ing on a p o ly u r e th a n e v a s c u la r g r a f t f o l lo w in g en d o th e lia l ce ll s o d d in g Journal of B iom edical M aterials Research V 26 p 103-117 1992
Wolfson JS and DC Hooper eds Quinolone Antimicrobial A gents American Society for Microbiology Washington DC 1989
Yu Jian-Lin et al F ib ro n e c tin on the S urface o f B ilia ry D ra in M a te r ia ls - A R o le in B a c te r ia l A d h e r e n c e Journal of Surgical Research V 59 p 596-600 1995
APPENDICES
51
APPENDIX A
Growth Rate Experiments
52Growth Curves (500 ppm Glucose) Room Temperaturetime count cone (cellsml) average std dev Specific growth rate
0 28 159E+06 711E+06 687E+06 048046690552 295E+06
296 168E+071 40 227E+06 785E+06 408E+06
210 119E+07165 936E+06
2 28 159E+06 204E+06 766E+0525 142E+0655 312E+06
3 281 159E+07 138E+07 156E+06216 123E+07233 132E+07
45 98 556E+07 550E+07 212E+06
101 573E+0792 522E+07
6 177 100E+08 736E+07 206E+0789 505E+07
123 698E+077 290 165E+08 122E+08 318E+07
198 112E+08156 885E+07
8 56 318E+08 210E+08 820E+0721 119E+0834 193E+08
9 114 647E+08 522E+08 779E+0782 465E+0893 528E+0879 448E+08
10 141 800E+08 749E+08 930E+07109 619E+08146 828E+08
11 282 160E+09 115E+09 284E+08206 117E+09172 976E+08150 851 E+08
12 200 113E+09 110E+09 329E+07186 106E+09195 111E+09
13 76 216E+09 277E+09 107E+0975 213E+09
163 462E+0976 216E+09
14 127 360E+09 340E+09 356E+08102 289E+09130 369E+09
53
15 273 775E+09 817E+09 318E+08300 851 E+09291 826E+09
16 287 163E+10 155E+10 765E+08278 158E+10255 145E+10
17 295 167E+10 145E+10 191 E+09213 121E+10260 148E+10
18 313 178E+10 163E+10 120E+09- --------
261 148E+10 - -------- -------286 162E+10
54
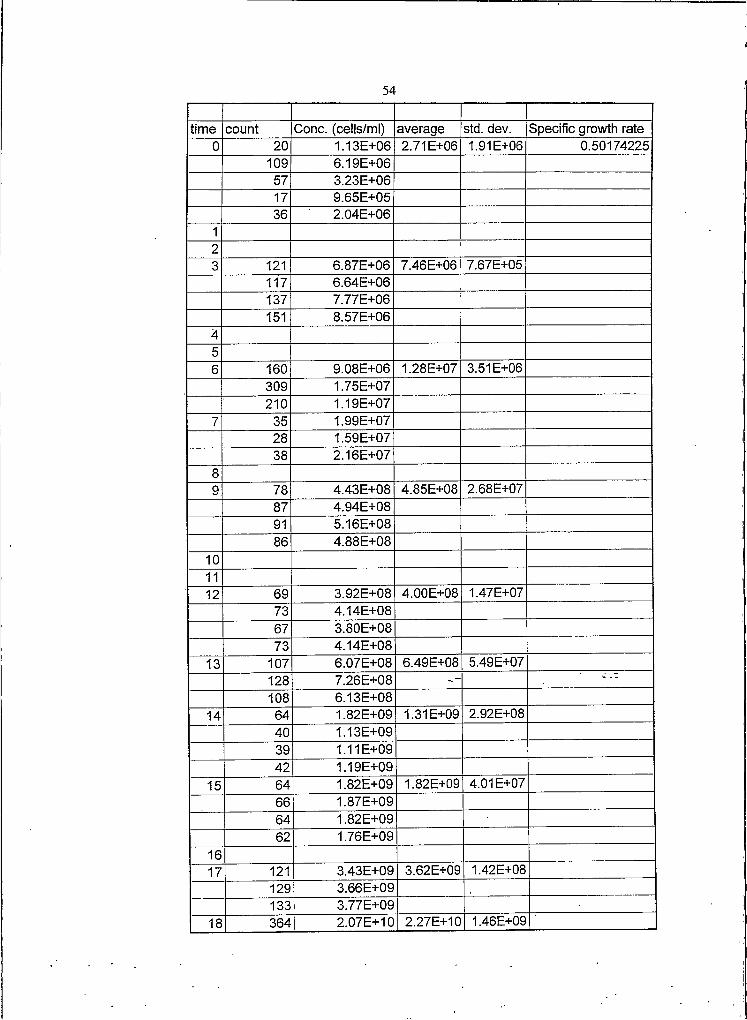
time count Cone (cellsml) average std dev Specific growth rateO 20 113E+06 271 E+06 191 E+06 050174225
109 619E+0657 323E+0617 965E+0536 204E+06
123 121 687E+06 746E+06 767E+05
117 664E+06137 777E+06151 857E+06
456 160 908E+06 128E+07 351 E+06
309 175E+07210 119E+07
7 35 199E+0728 159E+0738 216E+07
89 78 443E+08 485E+08 268E+07
87 494E+0891 516E+0886 488E+08
101112 69 392E+08 400E+08 147E+07
73 414E+0867 380E+0873 414E+08
13 107 607E+08 649E+08 549E+07128 726E+08 --108 613E+08
14 64 182E+09 131E+09 292E+0840 113E+0939 111E+0942 119E+09
15 64 182E+09 182E+09 401 E+0766 187E+0964 182E+0962 176E+09
1617 121 343E+09 362E+09 142E+08
129 366E+09133 377E+09
18 364 207E+10 227E+10 146E+091
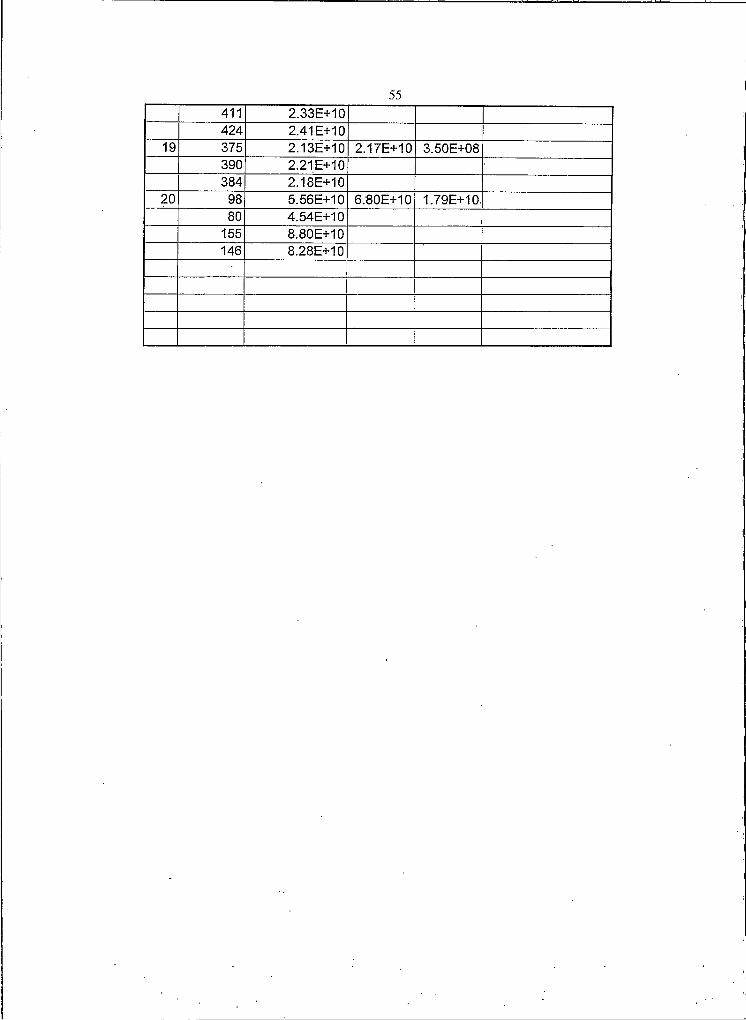
55411 233E+10424 241 E+10
19 375 213E+10 217E+10 350E+08390 221 E+10384 218E+10
20 98 556E+10 680E+10 179E+1080 454E+10
155 880E+10146 828E+10
56
time count Cone (cellsml) average std dev Specific growth rateO 23 522E+06 639E+06 114E+06 0443703052
27 613E+0637 840E+0630 681 E+0622 499E+0630 681 E+06
11 119 135E+10 119E+10 165E+09119 135E+1090 102E+1090 102E+10
12 45 102E+10 934E+09 231E+0926 590E+0932 726E+0938 863E+0954 123E+1052 118E+10
13 49 111E+10 126E+10 131E+0948 109E+1059 134E+1061 138E+1054 123E+1063 143E+10
14 135 306E+10 302E+10 250E+09128 291 E+10150 340E+10120 272E+10
15 167 379E+10 368E+10 166E+09168 381 E+10152 345E+10 J Z
16 239 542E+10 495E+10 619E+09201 456E+10250 567E+10183 415E+10
17 57 647E+10 726E+10 960E+0977 874E+1056 636E+1066 749E+10
18 86 976E+10 102E+11 804E+0982 931 E+10
101 115E+11 -90 102E+11
19 121 137E+11 121 E+11 182E+10124 141 E+11
57
92 104E+1189 101E+11
20 89 101E+11 107E+11 830E+0996 109E+11
105 119E+1186 976E+10
21 101 115E+11 124E+11 104E+10122 138E+11114 129E+11100 113E+11
22 67 760E+10 111E+11 216E+10115 131E+1197 110E+11
112 127E+11
58
time count Cone (cellsmi) average std dev Specific growth rate averageO 25 142E+06 127E+06 434E+05 0443600055 0467378
22 125E+0632 182E+06 std dev
9 511E+05 00248917 965E+0529 165E+06
12 62 281 E+07 421 E+07 779E+0693 422E+0786 390E+07
116 527E+07108 490E+0791 413E+07
14 33 150E+08 156E+08 339E+0737 168E+0826 118E+0833 150E+0828 127E+0849 222E+08
155 39 177E+08 239E+08 810E+0731 141E+0888 399E+0854 245E+0851 232E+0853 241 E+08
175 61 277E+08 261 E+08 657E+0745 204E+0851 232E+0849 222E+08 - - Z
88 399E+0851 232E+08
225 136 309E+10 274E+10 247E+09114 259E+10112 254E+10
59
APPENDIX B
FASTEETHreg SUSCEPTIBILITY
6 0
time 01g260E+04
005280E+04 240E+04
Glucose Abs0008
640E+04 140E+05 170E+04 0016370E+05 770E+05 220E+04 0033
125 198E+06 310E+06 220E+05 0071145 890E+06 194E+06 330E+05 0146245 160E+08 200E+08 160E+07 0266
110E+08 180E+08 160E+07 100 0405275 170E+08 170E+08 190E+07 200 0408
time 0 05g 0025g217E+04 330E+04 110E+05
Fasteeth MIC Study I518E+05 760E+05 230E+05
125 194E+06 185E+06 410E+05314E+06 147E+06 816E+05
165 660E+06 100E+07 178E+06195 192E+07 880E+06 242E+06225 430E+07 140E+07 180E+07255 119E+09 292E+07 130E+07
time 157E-02
200E+08
150E+08
I 100E+08U
500E+07
000E+00
7 X
V
I I
01g
005
C ~
233E+04 133E+0510 15 20 25 30time (hours)
194E+06 566E+06880E+06 746E+06226E+07 120E+07125E+08 120E+08133E+08 703E+08
time Control 450E-02121E+05 152E+05140E+05 264E+06197E+06 246E+06
185 362E+06 919E+06457E+06 211E+07461E+07 234E+08
IhU 200E+07
100E+07
000E+00
250E+08
200E+08
150E+08
1 00E+08
500E+07
OOOE+OO
I
I
Z1
Control
450E-02
500E+07
400E+07
300E+07
F a s te e th MIC Il
I
y -
Jlt3
0 05g
0025g
C
10 15 20 25timefhrs)
Fasteeth MIC III
157E-02
C
time (hrs)
APP ENDlX C
Hoechst 33342
me control s1 S2 S3O 162E+05 149E+05 118E+05 139E+05
195 477E+06 443E+07 317E+07 883E+04OOOE+OO
O 134E+04 159E+04 280E+04 194E+0414 210E+06 520E+05 380E+05 945E+0416 228E+06 313E+06 604E+06 294E+0519 763E+06 980E+06 169E+07 207E+0523 263E+07 133E+08 883E+07 967E+04
5ugml10ugmlSOugml
Hoechst 33342 MIC no wash
-control
-5ugml
-10ugml -50ugml
time (hrs)
time control s1 S2 S3O 162E+05 149E+05 118E+05 139E+05
195 477E+06 443E+07 317E+07 883E+04OOOE+OO
O 134E+04 159E+04 280E+04 194E+0414 210E+06 520E+05 380E+05 945E+0416 228E+06 313E+06 604E+06 294E+0519 763E+06 980E+06 169E+07 207E+0523 263E+07 133E+08 883E+07 967E+04
5ugmllOugml50ugml
Hoechst 33342 MIC no wash
control -5ugml bull10ugml 50ugml
time control A B3 129E+05 129E+05 139E+05
15 104E+06 100E+05 169E+0616 645E+06 227E+05 122E+062022
423E+06 113E+05 254E+06106E+07 160E+06 158E+07
24 707E+07 109E+07 175E+07
Hoescht MIC - incubate in stain for 3 hrs then wash
800E+07700E+07600E+07500E+07400E+07300E+07200E+07100E+07OOOE+OO
MIC w wash
DLO
800E+07
600E+07
400E+07
200E+07
000E+00
- controlbullA
-B
O 10 20 30
time(hrs)
200E+07180E+07160E+07140E+07120E+07100E+07800E+06600E+06400E+06200E+06000E+00
65
APPENDIX D
C iprofloxacin
66
Ciprofloxacin MIC study Plate countstime count (1ugml) cfuml average std dev count (1 ugml) cfuml
0 96 960E+04 962E+04 530E+03 21 210E+0496 960E+04 28 280E+04
105 105E+05 22 220E+0410 100E+059 900E+049 900E+04
155 67 670E+04 865E+04 266E+04 3 300E+0385 850E+04 2 200E+0377 770E+04 2 200E+03
5 500E+0411 110E+0513 130E+05
17 76 760E+04 687E+04 220E+04 20 200E+0465 650E+04 27 270E+0441 410E+04 20 200E+0411 110E+055 500E+047 700E+04
20 31 310E+04 230E+04 128E+04 13 130E+0433 330E+04 0 000E+00
5 500E+03 0 000E+0022 0 ND 0
0 00 0
24 0 ND 00 00 0
time 1 ugml std dev 01 ugml std dev control std dev0 720E+04 345E+04 566E+04 263E+04 593E+04 170E+03
155 584E+04 452E+04 510E+06 168E+06 903E+06 419E+0517 532E+04 283E+04 380E+06 221E+06 153E+07 963E+0520 137E+04 137E+04 670E+06 381 E+06 963E+07 741 E+0622 0 0 254E+07 587E+06 377E+07 450E+0624 0 0 920E+06 440E+06 377E+07 450E+06
67
average std dev count (01 ugml) cfuml average std dev count (01 ugml)237E+04 309E+03 75 750E+04 783E+04 340E+03 20
83 830E+04 2077 770E+04 14
8 800E+048 800E+046 600E+04
233E+03 471 E+02 66 660E+06 3677 770E+06 3056 560E+06 41
223E+04 330E+03 56 560E+06 587E+06 602E+05 15153 530E+06 17167 670E+06 155
17 13
14433E+03 613E+03 TNTC 119
TNTC 53TNTC 29
215 215E+07 232E+07 362E+06 253189 189E+07 256247 247E+07 235
19 190E+07 2127 270E+07 2828 280E+07 42
Bad plate 60Bad plate 110Bad plate 17
5- - 7
68
cfum average std dev count (control) cfuml average std dev200E+04 180E+04 283E+03 61 610E+04 593E+04 170E+03200E+04 60 600E+04140E+04 57 570E+04
360E+06 357E+06 450E+05 96 960E+06 903E+06 419E+05300E+06 89 890E+06410E+06 86 860E+06
151E+06 153E+06 148E+05 166 166E+07 153E+07 963E+05171E+06 150 150E+07155E+06 143 143E+07170E+06130E+06140E+06119E+07 670E+06 381 E+06 86 860E+07 670E+07 300E+07530E+06 103 103E+08290E+06 100 100E+08253E+07 276E+07 680E+06 34 340E+07 X256E+07 35 350E+07235E+07 44 440E+07210E+07280E+07420E+07600E+06 920E+06 440E+06 34 340E+07 377E+07 450E+06110E+07 35 350E+07170E+07 44 440E+07500E+06700E+06
I
I
69
APPENDIX F
Flow Cell Experiments Image Analysis
70
IMAGE ANALYSIS
Images of the polymers were taken using a CCD camera They were then analyzed
using Image Pro Plus The analysis of each image was automatically saved as an Excel
file generating 48 Excel sheets per experiment Since a hard copy of this information
would be too bulking to include in the Appendices a disk with all of the data will be kept
with a copy of this thesis at the Chemical Engineering Department and at the Center for
Biofilm Engineering
The spreadsheet are labeled with the time at which the image was taken die field of
view (eg A b c etc) parameters measured (eg Area ave dia width length) For
every field of view taken two spreadsheets were generated One consisted of the
parameters measured and the other gave the dimensions of the field of view (length x
width)
At the beginning of each experiment an image of a micrometer was taken in order to
calibrate all of the measurements for the experiment Cell numbers were calculated by
summing the area values of one field of view and dividing by 075 for a high end value or
50 for a low end value These values were than averaged to get the average values and
standard deviations The above values were obtained from B ergey rsquos Manual o f
Determinative Microbiology which gave the width of P aeruginosa at 05-1Ojim and
the length as 15-50pm This method for calculating cell numbers was found to be
accurate as actual cell numbers could be counted for the early time points They fell within
the range calculated by the above method
The files are listed as
Control
Triglyme
71
Ciprotriglyme
BMA
CiproBMA
The graphs found in the thesis text were made from the above files and then
converted into data which was easier to handle The files from which the graphs were
made are
Endpoint
Curves
APPENDIX F
Flow Cell Experiments Total CountsAO
cell
con
e(o
ellm
iEffluent counts over a 24
hour time period - Comparison
150E+09
000E+00
mdash- Control
Triglyme bull Ciprotriglyme
- BMA -bull- ciproBMA
CU
den
sity
(ce
lls
mm
A2)
100E+07
100E+06
100E+05
100E+04
100E+03
100E+02
100E+01
H ControlHTrigIyme^CiprotriglymeHBMAHciproBMA
Polymers100E+00
cell
con
e (
cell
sm
l)Effluent data t=0-8 Total counts
140E+09
120E+09
100E+09
800E+08
600E+08
400E+08
200E+08
000E+00
mdash Control Triglyme
-Ciprotriglyme - x~ BMA -^c ip roB M A
time (hrs)
76Control AO countstime (in) cell count cellsml average std Dev
0 100 454E+08 491 E+08 134E+0874 336E+08
110 499E+08101 458E+08172 781 E+0882 372E+08
125 567E+08165 749E+08132 599E+08108 490E+0860 272E+08
113 513E+0897 440E+0893 422E+0890 409E+08
2 107 486E+08 730E+08 152E+08167 758E+08154 699E+08111 504E+08167 758E+08196 890E+08204 926E+08
180 817E+084 113 513E+08 678E+08 171E+08
108 490E+08172 781 E+08
82 372E+08125 567E+08132 599E+08165 749E+08167 758E+08204 926E+08180 817E+08196 890E+08
6 0 0 0 00000
77
area (mmA2)72578 714E+02 441 E+016550376102
Polymercount cone
33 150E+08 201 E+08 660E+0750 227E+0841 186E+0847 213E+08
455 103E+08430 976E+07450 102E+08
62 281 E+0854 245E+0859 268E+0848 218E+0865 295E+0851 232E+08
density845E+06 277E+06
78
time (out) cell count cellsml average std Dev time (out) average std Dev0 65 295E+08 373E+08 780E+07 0 373E+08 780E+07
74 336E+08 2 303E+08 123E+08111 504E+08 4 209E+08 800E+0777 350E+08 6 262E+08 698E+07
109 495E+08 8 162E+08 088 399E+08 16 159E+07 116E+0653 241 E+08 18 232E+07 089 404E+08 20 304E+07 901E+0673 331 E+08 21 407E+07 082 372E+08 24 714E+07 213E+07
2 101 458E+08 303E+08 123E+08103 468E+08 Control101 458E+0830 136 E+08 0 491 E+08 134E+0835 159E+08 2 730E+08 152E+0844 200E+08 4 678E+08 171 E+0860 272E+08 6 0 068 309E+08 8 0 058 263E+08 16 0 0
4 30 136E+08 209E+08 800E+07 18 0 035 159E+08 20 0 028 127E+08 21 0 044 200E+08 24 0 019 863E+0744 200E+0869 313E+0872 327E+08 time in-out66 300E+08 0 000E+0054 245E+08 2 000E+00
6 39 177E+08 262E+08 698E+07 4 -262E+0860 272E+08 6 226E+0856 254E+08 8 162E+0867 304E+08 16 159E+0738 173E+08 18 232E+07
46 209E+08 20 304E+0744 200E+08 21 407E+0772 327E+08 24 714E+0788 399E+0867 304E+08
16 62 141E+07 159E+07 116E+0669 157E+0766 150E+0776 173E+0769 157E+0770 159E+0773 166E+07
79
ff l 184E+0768 154E+0767 152E+07
20 161 365E+07 304E+07 901 E+06158 359E+07196 445E+0798 222E+0791 207E+07
100 227E+0724 206 468E+07 714E+07 213E+07
121 275E+07219 497E+07217 493E+07360 817E+07270 613E+07420 953E+07280 636E+07430 976E+07390 885E+07320 726E+07360 817E+07430 976E+07380 863E+07
80
Triglyme AO countstime (in) count cellsml average std Dev
0 77 350E+08 517E+08 224E+0883 377E+0878 354E+0867 304E+0888 399E+08
115 522E+0896 436E+0888 399E+0883 377E+08
195 885E+08208 944E+08188 853E+08
2 99 449E+08 765E+08 251 E+08120 545E+08102 463E+08130 590E+08138 626E+08136 617E+08133 604E+08232 105E+09265 120E+09260 118E+09197 894E+08190 863E+08190 863E+08
4 238 108E+09 708E+08 307E+08225 102E+09215 976E+08100 454E+0864 291 E+0899 449E+08
124 563E+0898 445E+08
194 881 E+08188 853E+08151 685E+08176 799E+08
6 0 0 0 00 00 00 00 00 00 0
81
Polymercount cone
35 794E+07 353E+07 341 E+0741 931 E+0737 840E+0734 772E+0736 817E+0744 200E+0734 154E+0725 113E+0729 132E+0732 145E+0712 545E+0627 123E+0719 863E+0615 681 E+0614 636E+06
density117E+06 113E+06
area94558 907E+02 544E+019458883024
82
time (out) average std Dev time in-out0 676E+08 970E+07 0 500E+082 463E+08 118E+08 2 302E+084 477E+08 294E+08 4 231 E+086 550E+08 262E+08 6 550E+088 349E+07 302E+07 8 349E+07
16 284E+07 0 16 284E+0718 268E+07 238E+07 18 268E+0720 241 E+07 0 20 241 E+0721 228E+07 116E+07 21 228E+0724 223E+07 196E+07 24 223E+07
triglyme
time (in)0 517E+08 224E+082 765E+08 251 E+084 708E+08 307E+086 0 08 0 0
16 0 018 0 020 0 021 0 024 0 0
83
time (out) count cellsml average std Dev0 130 590E+08 678E+08 970E+07
136 617E+08157 713E+08150 681 E+08123 558E+08148 672E+08128 581 E+08140 636E+08172 781 E+08152 690E+08205 931 E+08152 690E+08
2 150 681 E+08 463E+08 118E+0867 304E+08
101 458E+08100 454E+0863 286E+0896 436E+0899 449E+08
100 454E+08110 499E+0871 322E+08
130 590E+08136 617E+08157 713E+08150 681 E+08
4 28 127E+08 477E+08 294E+0818 817E+0738 173E+0823 104E+0826 11ampE+08
127 577E+08134 608E+08115 522E+08128 581 E+08150 681 E+08120 545E+08205 931 E+08145 658E+08215 976E+08
6 47 213E+08 550E+08 262E+0849 222E+0849 222E+0859 268E+0858 263E+08
164 744E+08
84
219 994E+08180 817E+08175 794E+08191 867E+08127 577E+08134 608E+08115 522E+08128 581 E+08
8 16 726E+07 349E+07 302E+0710 454E+0718 817E+0720 908E+0716 726E+072 908E+064 182E+074 182E+075 227E+074 182E+07
18 9 204E+07 268E+07 238E+071 227E+067 159E+070 000E+000 000E+00
99 449E+07142 645E+07128 581 E+07108 490E+07165 749E+0727 123E+0730 136E+0733 150E+0737 168E+0730 136E+07
21 8 182E+07 228E+07 116E+0720 454E+0710 227E+0712 272E+0719 431E+0727 123E+0730 136E+0733 150E+0737 168E+0730 136E+07
24 25 113E+07 223E+07 196E+0711 499E+0622 999E+0623 104E+0716 726E+06
85
19 863E+0626 118E+0723 104E+0725 113E+0718 817E+0614 318E+0722 499E+0727 613E+0716 363E+0727 613E+07
Cel
l con
e (
cells
ml)
Acridine Orange effluent counts t= 8-24hours
180E+08 160E+08 140E+08 120E+08 100E+08 800E+07 600E+07 400E+07 200E+07 000E+00
8 12 16 20 24
mdash diamsmdash Control
- Ciprotriglyme - -x- -B MA - X - ciproBMA
time (hours)
87
Ciprotriglyme AO countstime (in) count cellsml average std Dev
0 110 499E+08 932E+08 329E+08106 481 E+08115 522E+08144 654E+08141 640E+08157 143E+09113 103E+09119 108E+09103 935E+08105 953E+08147 133E+09136 123E+09 bull146 133E+09
2 115 104E+09 985E+08 202E+08105 953E+08102 926E+0898 890E+08
129 117E+09132 120E+09140 127E+09121 110E+09128 116E+09150 681 E+08184 835E+08131 595E+08
4 213 967E+08 954E+08 481 E+08242 110E+09
13 590E+07251 114E+09132 599E+08168 153E+09
13 118E+0844 399E+08
154 140E+09190 173E+09115 104E+09132 120E+09132 120E+0998 890E+08
6 0 0
88
Polymercount cone
84 953E+06 701 E+06 441 E+0650 567E+0655 624E+0642 477E+0667 760E+06
140 159E+0799 112E+0796 109E+0797 110E+07
107 121E+079 204E+068 182E+06
10 227E+0610 227E+068 182E+06
area94352 941E+02 276E+019064997397
density 223E+05 141 E+05
89
time (out) average std Dev0 754E+08 210E+082 919E+08 207E+084 942E+08 388E+086 292E+08 273E+088 128E+07 216E+06
16 705E+06 bull 018 561 E+06 406E+0620 947E+06 021 114E+07 573E+0624 184E+07 774E+06
Ciprotriglyme
time (in)0 932E+08 329E+082 985E+08 202E+084 954E+08 481 E+086 0 08 0 0
16 0 018 0 020 0 021 0 024 0 0
90
time (out) count cellsml average std Dev0 120 545E+08 754E+08 210E+08
130 590E+08153 695E+08156 708E+0852 472E+0851 463E+0889 808E+08
118 107E+0981 735E+08
111 101E+0996 872E+08
119 108E+092 92 835E+08 919E+08 207E+08
78 708E+0869 626E+0883 754E+0890 817E+08
103 935E+08135 123E+09143 130E+09134 122E+09117 106E+09191 867E+08167 758E+08Ig 844E+08
4 186 844E+08 942E+08 388E+08241 109E+09289 131E+09243 110E+09159 144E+09177 161E+0931 281 E+0820 182E+08
102 926E+08103 935E+0880 726E+0899 899E+0899 899E+08
6 92 835E+08 292E+08 273E+0865 590E+0882 744E+0865 590E+0854 490E+08
21 191 E+0826 236E+0817 154E+08
91
25 227E+0820 182E+08
133 302E+07113 256E+0793 211E+07
114 259E+07134 304E+07
8 68 154E+07 128E+07 216E+0652 118E+0744 999E+0675 170E+0748 109E+0757 129E+0766 150E+0750 113E+0752 118E+0751 116E+07
18 44 999E+06 561 E+06 406E+0657 129E+0734 772E+0637 840E+0635 794E+06
8 182E+066 136E+065 113E+068 182E+06
13 295E+0621 71 161E+07 114E+07 573E+06
94 213E+0779 179E+0777 175E+0729 658E+0631 704E+0628 636E+0625 567E+0630 681 E+0661 138E+0761 138E+0752 118E+0764 145E+07
3 681E+0524 35 794E+06 184E+07 774E+06
45 102E+0756 127E+0738 863E+06
53 120E+07182 207E+07205 233E+07
92
235 267E+07240 272E+07220 250E+0771 806E+06
200 227E+07195 221E+07265 301 E+07
93BMA total counts Acric ine Orange BMAtime(in) count cone (cellsml) average std dev time (in) ave std dev
0 134 122E+09 826E+08 249E+08 0 826E+08 249E+08146 133E+09 2 610E+08 276E+08130 118E+09 4 731 E+08 382E+0869 626E+08 6 0 069 626E+0891 826E+0872 654E+08 time (out)66 599E+08 0 853E+08 155E+0872 654E+08 2 612E+08 177E+0883 754E+08 4 456E+08 282E+0878 708E+08 6 288E+08 208E+0882 744E+08 8 137E+07 934E+06
2 12 109E+08 610E+08 276E+08 16 445E+07 049 445E+08 18 523E+07 175E+0738 345E+08 20 720E+07 062 563E+08 21 818E+07 379E+0760 545E+08 24 853E+07 340E+07
115 104E+09109 990E+08122 111E+0964 581 E+0876 690E+0849 445E+0852 472E+0866 599E+08
4 73 663E+08 731 E+08 382E+0881 735E+0898 890E+0870 636E+0873 663E+08
131 119E+09115 104E+09141 128E+09147 133E+0929 263E+0829 263E+0838 345E+0821 191E+08
6 00000000
94
0
Polymercount cone
125 567E+07 895E+07 418E+07140 636E+07100 454E+07115 522E+07137 622E+07139 631 E+07150 681 E+07270 123E+08380 173E+08360 163E+08 density250 113E+08 298E+06 139E+06200 908E+07
area87061 901 E+02 21217235669140691703
95
time(out) count cone (cellsml) average std devC 82 754E+0E 853E+08 155E+08
7E 708E+0E86 781 E+0893 844E+0881 735E+0882 744E+0877 699E+0892 835E+08
121 110E+09116 105E+09125 113E+09
2 92 835E+08 612E+08 177E+0876 690E+08
109 990E+0892 835E+0860 545E+0855 499E+0863 572E+0872 654E+0847 427E+0843 390E+0844 399E+0867 608E+0856 508E+08
4 47 427E+08 456E+08 282E+0852 472E+0859 536E+0860 545E+0836 327E+0897 881 E+0830 272E+0850 454E+08
115 104E+09104 944E+08
19 173E+0814 127E+0828 254E+0822 200E+0821 191 E+08
6 16 145E+08 288E+08 201 E+0815 136E+0813 118E+0821 191 E+0816 145E+0855 499E+0840 363E+0845 409E+08
96
85 772E+0873 663E+0820 182E+0820 182E+0820 182E+0820 182E+0817 154E+08
8 6 136E+07 137E+07 934E+060 000E+005 113E+074 908E+061 227E+06
27 245E+0728 254E+0726 236E+07
18 77 699E+07 523E+07 175E+0773 663E+0783 754E+0773 663E+0772 654E+0768 617E+0717 386E+0719 431 E+0715 340E+0712 272E+0712 272E+07
21 310 704E+07 818E+07 379E+07300 681 E+07140 318E+07230 522E+07210 477E+07285 129E+08290 132E+08340 154E+08 - -
250 113E+08123 558E+07136 617E+07144 654E+07
24 107 486E+07 853E+07 340E+07108 490E+07112 508E+07270 123E+08250 113E+08320 145E+08260 118E+08148 672E+07153 695E+07150 681 E+07
97
ciproBMA AO counts
time (in) count cone average std dev0 74 672E+08 673E+08 19E+08
100 908E+0880 726E+08
112 102E+0956 508E+0869 626E+08
108 981 E+0871 645E+0886 781 E+0876 69E+0838 345E+0852 472E+0856 508E+0860 545E+08
2 44 399E+08 897E+08 61 E+0851 463E+0825 227E+0832 291 E+0841 372E+08
103 935E+0893 844E+0899 899E+08
219 199E+09192 174E+09188 171E+09
4 92 835E+08 726E+08 178E+0878 708E+08
102 926E+0897 881 E+08
102 926E+0884 763E+0886 781 E+0879 717E+08
106 962E+0856 508E+0848 436E+0854 49E+0856 508E+08
_
i
98
Polymercount cone
139 316E+07 541 E+07 463E+07114 259E+07125 284E+07134 304E+07280 127E+08290 132E+08250 113E+08
79 179E+0773 166E+0779 179E+07
area88181 870E+02 125E+018760685282
density187E+06 160E+06
99
time (in) ave std devO 673E+08 190E+082 897E+08 610E+084 726E+08 128E+086 0 0
time (out)0 700E+08 146E+082 652E+08 311E+084 524E+08 227E+086 350E+08 127E+088 545E+06 286E+06
16 101E+07 018 113E+07 430E+0620 281 E+07 0
21 365E+07 201 E+0724 682E+07 510E+07
100
time (out) count cone average std dev0 71 645E+08 7E+08 146E+08
71 645E+0876 69E+0899 899E+08
103 935E+0884 763E+0891 826E+0865 59E+0860 545E+0851 463E+08
2 30 272E+08 652E+08 311 E+0842 381 E+0824 218E+0831 281 E+0823 209E+08
130 118E+0966 599E+0866 599E+0890 817E+0897 881 E+0867 608E+0888 799E+08
113 103E+09104 944E+08107 971 E+08
4 83 754E+08 524E+08 227E+0872 654E+0884 763E+0890 817E+0866 599E+0857 518E+0889 808E+0867 608E+0830 272E+0820 182E+0834 309E+0828 254E+08
mdash30 272E+08
6 39 354E+08 35E+08 123E+0846 418E+0854 49E+0859 536E+0852 472E+0818 163E+08
101
30 272E+0825 227E+0835 318E+0848 436E+0852 472E+0840 363E+0828 254E+0814 127E+08
8 17 386E+06 545E+06 286E+0611 250E+0612 272E+0623 104E+07
9 409E+0616 726E+0620 908E+06
8 363E+0618 35 159E+07 113E+07 430E+06
37 168E+0736 163E+0734 772E+0627 613E+0639 885E+0654 123E+0728 636E+06
21 300 681 E+07 365E+07 201 E+07275 624E+07300 681 E+07255 579E+07275 624E+07
85 193E+0767 152E+0779 179E+0770 159E+0793 211 E+0770 318E+0761 277E+0750 227E+0748 218E+0778 354E+07
24 42 191 E+07 682E+07 510E+0757 259E+0770 318E+0767 304E+0749 222E+07
270 123E+08305 138E+08385 175E+08270 123E+08
102
74 336E+07124 563E+0775 340E+07
165 749E+07
103
APPENDIX G
Flow Cell Experiments Viable CountsPlate Counts
104
Plate counts were conducted by placing ten 10 microliter drops of properly diluted
effluent and influent on plate count agar plates and incubating overnight at room
temperature before counting Several serial dilutions were made for each sample to ensure
that countable plates 3 to 300 colonies were obtained Only viable cells would develop
into colonies on the plates therefore the counts performed in this manner are classified as
viable counts or plate counts
105
Control Plate counttime (in) count cone (cellsml) average std dev
0 159 159E+07 936E+06 628E+06193 193E+07188 188E+0768 680E+0664 640E+0658 580E+0632 320E+0648 480E+0632 320E+06
2 298 298E+07 374E+07 852E+06289 289E+07329 329E+07
54 540E+0739 390E+0740 400E+07
4 79 790E+06 330E+07 328E+07111 111E+0798 980E+0692 920E+0786 860E+0723 230E+0721 210E+0713 130E+07
6 0
time (in) ave cone std dev time (out) ave cone std dev0 936E+06 628E+06 0 249E+06 222E+062 374E+07 852E+06 2 993E+06 293E+064 330E+07 328E+07 4 208E+07 922E+066 0 0 6 111E+07 0
8 147E+07 016 113E+05 235E+0418 281E+05 020 449E+05 417E+0521 371 E+05 024 138E+05 109E+05
Polymer | 130E+06
106
area average std dev72578 7139433333 44072296550376102
density537E+04 548E+04 3474333595E+04512E+04
107
time(out) count cone (cellsml) average std dev0 49 490E+06 249E+06 222E+06
50 500E+0667 670E+06
7 700E+056 600E+05
9 900E+0517 170E+068 800E+05
11 110E+062 125 125E+07 993E+06 293E+06
122 122E+07119 119E+07
9 900E+0610 100E+074 400E+06
4 30 300E+07 208E+07 922E+0633 330E+0731 310E+07
104 104E+0794 940E+06
106 106E+0721 210E+0721 210E+0713 130E+07
6 no data
16 71 710E+04 113E+05 235E+04105 105E+05120 120E+05
15 150E+0511 110E+0512 120E+05
20 24 240E+04 449E+05 417E+0526 260E+0453 530E+0477 770E+0589 890E+0593 930E+05
24 17 170E+05 138E+05 109E+0526 260E+05
I 29 290E+05
108
26 260E+0459 590E+0420 200E+04
Polymer 10 100E+06 130E+06 551 E+0513 130E+0613 130E+0658 580E+0556 560E+05
119 119E+06 -
171 171E+06161 161 E+06244 244E+06
109
triglyme Plate countstime (in) count cone (cellsml) average std dev
0 167 167E+08 108E+08 700E+07184 184E+08182 182E+0831 310E+0737 370E+0747 470E+07
2 86 bull 860E+07 522E+07 334E+0778 780E+0774 740E+07
120 120E+07112 112E+07
4 159 159E+08 562E+07 489E+07116 116E+08145 145E+07244 244E+07224 224E+07
42 420E+0732 320E+0739 390E+07
6 000
time (in) ave cone std dev0 108E+08 700E+072 522E+07 334E+074 562E+07 489E+076 0 0
lt Z
Polymer density782E+06 441 E+06 248E+05
248E+05area Average 283E+05
94558 90723333339458883024
time (out) average std dev
no
O 882E+07 714E+072 336E+07 125E+074 821E+07 139E+076 214E+07 439E+078 223E+06 125E+05
16 326E+06 018 352E+06 246E+0620 773E+06 021 984E+06 105E+0724 299E+06 101 E+06
Polymer 50 500E+06 782E+0661 610E+0662 620E+06
108 108E+0747 470E+0615 150E+0716 160E+0713 130E+07
331 331 E+06281 281 E+06301 301 E+06
97 970E+0660 600E+06
I l l
time (out) count cone (cellsml) average std dev0 167 167E+08 882E+07 714E+07
136 136E+08173 173E+08176 176E+07186 186E+07168 168E+07
2 51 510E+07 336E+07 125E+0747 470E+0746 460E+0740 400E+0752 520E+0734 340E+07
177 177E+07188 188E+07213 213E+07
24 240E+0725 250E+0726 260E+07
4 77 770E+07 821 E+07 139E+0797 970E+07
104 104E+0860 600E+0767 670E+0791 910E+0778 780E+0783 830E+07
6 48 480E+06 214E+07 439E+07-34 340E+06 r
35 350E+0630 300E+06
ave 28 280E+06260E+05 34 340E+06
stddev 129 129E+081626657 8 22 220E+06 223E+06 125E+05
24 240E+0621 210E+06
18 153 153E+06 352E+06 246E+06225 225E+06198 198E+06
112
22 220E+0615 150E+0616 160E+0662 620E+0660 600E+0684 840E+06
21 179 179 E+06 984E+06 105E+07275 275E+06247 247E+0622 220E+07
3 300E+0627 270E+07
441 E+06 24 254 254E+06 299E+06 101 E+06240 240E+06264 264E+06
30 300E+0637 370E+0658 580E+0620 200E+0631 310E+0616 160E+06
279 279E+06338 338E+06297 297E+06
113
ciprotriglyme Plate countstime (in) count cone (cfuml) average std dev time (out)
0 15 150E+08 654E+08 307E+08 013 130E+0843 430E+0889 890E+0887 870E+0882 820E+0884 840E+0884 840E+0892 920E+08
2 96 960E+08 103E+09 48E+0881 810E+08
116 116E+09164 164E+09169 169E+09 2184 184E+0954 540E+0897 970E+08
128 128E+093 300E+085 500E+087 700E+08
4 55 550E+08 918E+08 363E+0831 310E+0890 900E+0814 140E+0910 100E+09 44 400E+08
90 900E+0899 990E+08
115 115E+09100 100E+0980 800E+08
162 162E+096 0 0
6
time (Out) average std dev0 506E+06 553E+062 121E+09 944E+084 192E+08 166E+086 121E+08 112E+08 I8 140E+06 116E+06
16 900E+05 0 I18 774E+05 980E+05 I
20 120E+06 0 |21 141E+06 110E+06 i
114
24 1642+06 1902+06 8
density773698491 7761707346 2284489805303975749509738
18area
94352 9412+02 2762+019064997397
21
Polymercount cone (cfuml) average std dev
23 2302+03 2432+03 9982+0236 3602+0330 3002+03
2 2002+034 4002+033 3002+032 2002+031 1002+031 1002+03
24
115
count cone (cfuml) average std dev23 2302+04 5062+06 5532+0621 2102+0420 2002+04
114 1142+07103 1032+07120 1202+07
10 1002+0713 1302+079 9002+060 0002+000 0002+000 0002+000 0002+00
87 8702+08 1212+09 9442+0892 9202+08
190 1902+09102 1022+0975 7502+0896 9602+0872 7202+0891 9102+08
167 1672+096 6002+082 2002+08
40 4002+0957 5702+08 1922+08 1662+0825 2502+0836 3602+08
128 1282+0893 9302+07
168 1682+0856 5602+0748 4802+0755 5502+0748 4802+07 1212+08 1132+0851 5102+0790 9002+07
149 1492+08180 1802+08162 1622+08261 260E+0812 i 1202+0839 3902+0870 7002+0539 3902+0565 6502+05
116
3 300E+05 140E+06 116E+0615 150E+0645 450E+0689 890E+05
127 127E+06127 127E+0610 100E+0614 140E+065 500E+058 800E+05 774E+05 918E+05
19 190E+0629 290E+06
199 199E+05225 225E+05213 213E+0523 230E+0525 250E+0525 250E+0536 360E+05 141 E+06 110E+0692 920E+0594 940E+0553 530E+0582 820E+0567 670E+05
8 800E+058 800E+05
10 100E+06169 169E+06142 142E+0624 240E+0645 450E+0629 290E+0625 250E+04 164E+06 190E+0629 290E+0452 520E+046 600E+048 800E+041 100E+04
139 139E+0610 100E+0638 380E+0662 620E+0632 320E+0621 210E+0634 340E+06
117
BMA Plate counts
time (in) count cone (cfuml) average std devO 53 530E+07 974E+07 377E+07
59 590E+0759 590E+0784 840E+07
123 123E+08139 - 139E+08
9 900E+0717 170E+0810 100E+08
2 23 230E+07 357E+07 441 E+0723 230E+0720 200E+07
165 165E+0838 380E+0673 730E+06
231 231 E+0724 240E+0739 390E+0729 290E+07
4 17 170E+07 171 E+07 575E+0619 190E+0711 110E+07
220 220E+07213 213E+07228 228E+07
21 210E+0716 160E+0726 260E+07
6 600E+0612 120E+0711 110E+07
6 0 0
118
time(out) average std dev0 499E+07 154E+072 413E+07 179E+074 577E+07 526E+076 129E+07 496E+068 149E+06 912E+05
16 428E+06 018 498E+06 414E+0620 635E+06 021 704E+06 394E+0624 106E+07 225E+06
=
119
Polymercount cone average std dev
27 270E+06 117E+07 13381334127 127E+0732 320E+0743 430E+0739 390E+0640 400E+0636 360E+06 density41 41 OEf 06 404E+05 391 E+0559 590E+06 385E+0554 540E+06 384E+05
area average std dev87061 900566667 21217235669140691703
120
time (out) count cone (cfuml) average std dev0 40 400E+07 499E+07 154E+07
35 350E+0750 500E+0781 810E+0770 700E+0757 570E+07
408 408E+07386 386E+07367 367E+07
2 37 370E+07 413E+07 179E+0725 250E+0736 360E+0765 650E+0777 770E+0734 340E+0725 250E+0731 310E+07
4 46 460E+07 577E+07 526E+0733 330E+0732 320E+07
158 158E+0892 920E+07
130 130E+0813 130E+079 900E+066 600E+06
6 92 920E+06 129E+07 496E+0672 720E+0688 880E+06
9 900E+067 700E+067 700E+06 - -
169 169E+07192 192E+07191 191E+0720 200E+0714 140E+0724 240E+07
101 101E+07119 119E+07149 149E+07
10 100E+0712 120E+07
11 110E+078 46 460E+05 149E+06 912E+05
13 bull130E+05|
121
13 130E+05191 191E+06217 217E+06244 244E+06
18 180E+0624 240E+0620 200E+06
18 46 460E+06 498E+06 414E+0654 540E+0646 460E+06
3 300E+064 400E+06
18 180E+0738 380E+0655 550E+0652 520E+0622 220E+0613 130E+0622 220E+06
21 26 260E+06 704E+06 394E+0631 310E+0644 440E+06
3 300E+063 300E+063 300E+06
93 930E+0699 990E+06
106 106E+0716 160E+07
8 800E+067 700E+06
62 620E+0671 710E+0675 750E+06
8 800E+0615 150E+07
3 300E+0624 90 900E+06 106E+07 225E+06
89 890E+0690 900E+0613 130E+0713 130E+0711 110E+07
111 111E+0797 970E+0E
107 107E+07V 140E+077
i 5 130E+07
122
15 150E+0787 870E+0680 800E+06
124 124E+077 700E+06
10 100E+078 800E+06
123ciproBMA Plate countstime (in) count cone (cfuml) average std devO 80 800E+07 490E+07 212E+07
64 640E+0777 770E+0742 420E+0755 550E+0753 530E+0726 260E+0723 230E+0721 210E+07
2 31 310E+07 592E+07 235E+0731 310E+0743 430E+0759 590E+0764 640E+07
114 114E+0867 670E+0764 640E+0760 600E+07
4 75 750E+07 572E+07 206E+0770 700E+0786 860E+0742 420E+0738 380E+0732 320E+07
6 000
II
1 2 4
time(out) average std dev0 444E+07 154E+072 478E+07 203E+074 404E+07 198E+076 236E+07 125E+078 185E+05 104E+05
16 284E+06 018 328E+06 557E+0620 374E+06 021 386E+06 528E+0624 210E+06 580E+05
PolymerPlates were all blank for every dilution
11
~
125
15time (out) count cone (cfuml) average std dev
0 31 310E+07 427E+07 153E+0728 280E+0737 370E+0749 490E+0749 490E+0749 490E+0779 790E+0733 330E+07
2 29 290E+07 478E+07 203E+0725 250E+0717 170E+0767 670E+0781 810E+0768 680E+0745 450E+0748 480E+0750 500E+07
4 52 520E+07 404E+07 198E+0750 500E+0756 560E+0755 550E+0772 720E+07
147 147E+07143 143E+0728 280E+0722 220E+07
6 24 240E+07 236E+07 125E+0749 490E+07
138 138E+07126 126E+07150 150E+07
12 120E+0716 160E+0713 130E+0742 420E+0734 340E+0728 280E+07
8 11 110E+05 185E+05 104E+0524 240E+0532 320E+0580 800E+04
117 117E+0591 910E+0434 340E+05
18 56 560E+04 328E+06 557E+0660 600E+04
126
57 570E+046 600E+044 400E+049 900E+04
82 820E+0581 810E+0585 850E+0515 150E+0611 110E+067 700E+05
152 152E+07137 137E+07142 142E+07
21 183 183E+07 386E+06 528E+06111 111E+07126 126E+07186 186E+06159 159E+06148 148E+06
10 100E+0616 160E+0615 150E+0666 660E+0584 840E+0561 610E+0522 220E+0610 100E+0615 150E+06
24 22 220E+06 210E+06 580E+0524 240E+06
131 131E+06167 167E+06141 141E+0620 200E+06 - -
28 280E+0630 300E+06
127
APPENDIX H
M athematical Theory
128
M ATHEM ATICAL THEORY
Kwok (1997) used Basmadjian and Sefton to determine that the drug concentration
immediately next to the polymer in a tube was
CZCNkill rD ) = A [ (xr0)ReSc]13 where (xroReSc)lt104-103
Cs - surface concentration (|igcm5)
Nkill - minimum killing release rate (|Jgcm2s)
R0 - effective hydraulic radius (cm)D - diffusivity of ciprofloxacin in fluid (cnfs)A - constant for geometry x - axial distance from the entrance (cm)
Re - Reynoldrsquos number Sc - Schmidt number
Laminar flow with constant velocity v was used estimate Nkill as 57 x 10J pgcnrs
using the equation above
The ciprofloxacin impregnated polymers were assumed to behave as if dissolution
into a falling film was occurring allowing Pickrsquos second law of diffusion to be modified as
follows
Pickrsquos second law of diffusion
MciZMt = Dip M2CiZMx2
does not adequately model the controlled-release of ciprofloxacin as it does not take into
consideration the fluid flow over the polymer and results in a t12 release rate A better
129
equation would be
vz(x) McMz = Dip M2CiZMx2
where fluid flow is assumed to be occur in the z direction and diffusion is assumed to be in
the x direction The following boundary conditions should be sufficient for the situation
encountered in the flow cell over the first 24 hours
I) O gt Il O at N Il O
2) O gt Il O at y mdash co
3) O gtIl O pound at
OIlThe solution therefore is
CaZCao = erfc [yZ(4DzZvmax)]
130
APPENDIX I
Polymer Surface Area Measurements
131
POLYMER Date of experiment Surface area (mnV)Control 6997 72578
62897 6550372697 76102
Triglyme 8897 9455881097 9458882297 83026
Ciprotriglyme 81697 9064982497 9739782997 94352
BMA 83197 870619797 9140692197 91703
CiproBMA 9597 8818191497 8760691997 85282
MONTANA STATE UNIVERSITY LIBRARIES
3 1762 10302039 O
1
i
IMAGE ANALYSIS OF NOVEL BIOMATERIALS EFFECTIVENESS AT
INHIBITING BACTERIAL COLONIZATION WITH UNIQUE POLYMER
COATINGS ANDOR THE CONTROLLED RELEASE OF CIPROFLOXACIN
by
Sara Kirsten Hendricks
A thesis submitted in partial fulfillment o f the requirements for the degree
of
Master o f Science
in
Chemical Engineering
MONTANA STATE UNIVERSITY-BOZEMAN Bozeman Montana
April 1998
HsiiWitS1X
11
APPROVAL
of a thesis submitted by
Sara Kirsten Hendricks
This thesis has been read by each member o f the thesis committee and has been found
to be satisfactory regarding content English usage format citations bibliographic style and
consistency and is ready for submission to the College of Graduate Studies
James D Bryers Chair
John T Sears Dept Head
Approved for the Department of Chemical Engineering
Date
Graduate Dean
Ill
STATEMENT OF PERMISSION TO USE
In presenting this thesis in partial fulfillment o f the requirements for a masterrsquos
degree at Montana State University-B ozeman I agree that the Library shall make it available
to borrowers under rules o f the Library
I f I have indicated my intention to copyright this thesis by including a copyright
notice page copying is allowable only for scholarly purposes cosistent with ldquofair userdquo as
prescribed in the US Copyright Law Requests for permission for extended quotation from
or reproduction o f this thesis in whole or in parts may be granted only by the copyright
holder
Signature
Date
TABLE OF CONTENTS
Page
INTRODUCTION I
LITERATURE REVIEW 3
Background and Significance3Processes Governing Biofilm Formation 4Surface Modification 6
Modifications Host Cell Adhesion6Modifications Bacterial Cell Adhesion 7
Controlled Release 8Controlled Release Systems9
Ciprofloxacin14
MATERIALS AND METHODS 16
Bacteria and CulturesSolutions
MediumCytological StainsCiprofloxacin
Reactors and Flow Cell SystemsContinuously-stirred Tank Reactor (CSTR)Flow Cell
Microscope Setup and TechniquesPolymer Analylsis
Susceptibility and Adhesion Effect StudiesCiprofloxacinHoechst Stain (33342)FasteetliRHoecsht Stain Effects on P aeruginosa Adhesion
TubingBiomaterial Fabrication t
BP Control Polym erTest Polym ers
161616171718 18 18 21 21 242425 252526 26 26 27
RESULTS AND DISCUSSION 28
Pseudomonas aeruginosa Growth Experiments28Batch Studies28
Flow Cell Experimental Protocol 29Flow Cell Experiments 29
Ciprofloxacin release41
TABLE OF CONTENTS
SUMMARY 43
BIBLIOGRAPHY 45
APPENDICES 50
APPENDIX A - Growth Rate Experiments 51APPENDIX B - FasteethregSusceptibility59APPENDIX C - Hoechst 33342 61APPENDIX D - Ciprofloxacin 65APPENDIX E - Flow Cell Experiments Image Analysis69
Image Analysis 70APPENDIX F - Flow Cell Experiments Total CountsAO 72APPENDIX G - Flow Cell Experiments Viable CountsPlate Counts 103APPENDIX H - Mathematical Theory 127
Mathematical Theory128APPENDIX I - Polymer Surface Area Measurements130
Page
LIST OF TABLES
1 Parameters used for sizing of biologic reactor18
2 Flow channel dimensions and hydraulic parameters 20
3 Specific growth rate for P aeruginosa grown at room temperature with 500 ppmglucose fully aerated 28
4 Summary of Hoechst 33342 studies28
5 Description of polymers used in flow cell experiments 30
6 Ciprofloxacin concentrations in effluent 42
Table Page
vii
LIST OF FIGURES
Figure Page
1 Biofiltn formation 5
2 Zero-order first-order and square-root of time release patterns fromcontrolled-release devices 10
3 CSTR setup used to grow P aeruginosa continuously 19
4 Flow cell schematic 20
5 Experimental setup 22
6 BiospaiVConlrol time course of cell adhesion31
7 ControlBiospan polymer bacterial colonization 32
8 Comparison of the extent of colonization of different polymers at 1=24 hours33
9 Direct counts of cell density on the polymer surface after 24 hours34
10 Time course cell colonization curve of control lriglyme ciprolriglymeobtained from image analysis 35
11 Attachment rate differences are evident within the first 6 hours of theflow cell experiments 36
12 Total counts made with Acridine Orange 37
13 Calculated cell density on the ldquolestrdquo polymers using total cell count(acridine orange) data38
14 Plate count data from effluent samples taken from the polymer flowcells during the course of the experiments shows that viable cells are going throughthe flow cell39
15 Cell densities on polymers calculated from plate count data 40
16 Demonstrates the variations in bacterial density on the lriglyme polymerafter twenty four hours using image analysis (IA) acridine orange staining of the effluent and plate counts of the effluent 4f
vm
ABSTRACT
Millions of dollars are spent every year in the US on biomedical implants ranging from commonplace uses such as contact lenses to applications as rare as total artificial hearts One of the main stumbling blocks in the long term usage of these devices is bacterial infection which can only be rectified by the removal of the implant resulting in increased costs and trauma to the patient Consequently four different polymer formulations were studied for their efficacy at preventing bacterial colonization The polymer under investigation was placed in a parallel plate flow cell challenged with fluid containing Pseudomonas aeruginosa for six hours and then exposed to a fluid of nutrients only for the remainder of a twenty four hour run Two different sets
examined by image analysis One set consisted of latrix (BP) coated with triethylene glycol dimethyl
ether (triglyme) while the other set had an additional coating of poly(butyl methy aery late) polyBMA Each set also had one formulation to which a known amount of the antibiotic ciprofloxacintrade had been added The coatings of triglyme and triglyme+BMA cut bacterial colonization in half when compared to the control BP material Wliile the additional factor of the controlled release of ciprofloxacintrade from the materials resulted in more than a two fold reduction in bacterial colonization when compared to the control BP material These polymers therefore hold promise in decreasing the risk of infection encountered during the use of biomedical implants
of test polymers subjected to this protocol were a BioSpaiitrade polyletherurethane (PEU) base n
i
I
IN TR O D U C TIO N
The National Institutes of Health have defined a biomaterial ldquoas any substance
(other than a drug) or combination of substances synthetic or natural in origin which can
be used for any period of time as a whole or as a part of a system which treats augments
or replaces any tissue organ or function of the bodyrdquo Thus biomaterials will have an
impact on virtually everyone at some point in their life
Biomaterials may be used for long term applications such as central nervous
system shunts extended wear contact lenses or hemodialysis systems They may be
employed in short term applications like contact lenses needles for phlebotomy or
vaccination cardiopulmonary bypass systems or wound healing devices Or biomaterials
may be utilized in permanent implants such as heart valves periodental restorative devices
intraocular lenses or orthopedic devices(NIH Consens 1982)
AU biomedical implants are susceptible to bacterial colonization and subsequent
biofilm formation Biofilms are three dimensional gelatinous structures consisting of
adherent bacteria and insoluble polysaccharides secreted by the bacterial cells Bacteria use
the biomaterial as a substratum to which they attach and adhere resulting in a biomaterial
centered infection Biofilm infections are extremely difficult to eradicate The biofilm gel
matrix cannot only keep the host defense mechanisms from reaching andor recognizing the
adherent bacteria but biofilms can also lower the efficacy of antibiotics Usually the only
way to deal with a device-centered infection is to remove the infected implant which is
costly as well as traumatic to the patient Therefore it is desirable to develop a material that
wiU inhibit bacterial colonization
The objective of the research presented in this thesis was to ascertain the
effectiveness of four different formulations of a biomedical grade polyurethane Biospantrade
at inhibiting bacterial colonization under flow conditions The scope of this work
2
included (I) evaluation of four Biospantradepolyethylene glycol (PEG) matrix biomaterials
two of which contained the antibiotic ciprofloxacin (2) development of a flow cell system
to evaluate the potential for bacterial adhesion and biofilm formation and (3) development
of a novel staining technique to allow for the visualization of bacteria against an opaque
surface without interfering with normal cell behavior
3
LITERA TU RE REVIEW
Background and Significance
Biomaterials have been used in the human body since the early 1900s when bone
plates were introduced to stabilize fractures and speed healing By the 1950s
experimentation into the replacement of blood vessels had begun and by the 1960s
artificial hip joints and heart valves were under development As science and engineering
has advanced so has the clinical use of biomaterials(Blanchard 1996 NIH Consens
1982)
Biomedical implants are no longer used just in life-threatening situations They are
now utilized in every major body system for three general purposes (I) to preserve life or
limb (2) to restore or improve function and (3) to restore or improve shape The first
category includes most neurosurgical and cardiovascular implants such as pacemakers
and hydrocephalus shunts Dental implants and joint replacements are included in the
second category while biomaterials used in reconstructive surgeries are placed in the last
class(NIH Consens 1982)
Estimates in 1982 placed biomaterial implant use in the United States for that year at
several million The demand for biomaterials is said to grow by 5 to 15 percent a year and
will only increase as the population ages and the expectations of maintaining a good quality
of life increase What was a multi-million dollar per year industry in the US now exceeds
$10 billion a year This figure is especially remarkable given that the US only represents
about 10 percent of world demand (Blanchard 1996 NIH Consens 1982 Brictannica
Online 1997)
One of the major risks encountered in the extended use of implants is the
susceptibility of biomaterials to bacterial attachment and adhesion resulting in biomaterial-
4
centered infections The three most common bacterial species implicated in these infections
are Pseudomonas aeruginosa Staphylococcus epidermidis and Staphylococcus aureus
Esherichia coli Proteus mirabilis and beta hemolytic Streptococcus spp have also been
isolated from contaminated implants (Gristina 1987 Gristina 1994)
Once bacteria begin adhering to implant material they can form a biofilm that is
extremely difficult to eradicate The biofilm can not only prevent the host defense
mechanisms from reaching andor recognizing the bacteria but it can also lower the
efficacy of antibiotics Usually the only way to deal with biofilm infections is by removal
of the implant which can be costly as well as traumatic to the patient (Blanchard 1996
Gristina 1987 Gristina et al 1993) Tlierefore it is desirable to develop a biomaterial
that will inhibit bacterial colonization
There are two common approaches to preventing bacterial colonization The first is
to modify the substratumrsquos surface chemistry rendering it non-adhesive and the second is
to design a material which will slowly release an antibacterial agent killing the bacteria
before they reach the surface (Bryers 1997)
Processes G overning Biofilm Form ation
The establishment of a biofilm (figure I) involves many steps (I) preshy
conditioning of the surface by adsorption of organic molecules (eg protein) from the fluid
phase (2) cell transport to the substratum (3) cell adsorptiondesorption (4) permanent
adhesion to the surface (5) cellular metabolism (growth replication death) and (6)
biofilm removal (detachment and sloughing) Pre-conditioning involves coating the
surface with host- derived proteins such as fibronectin human serum albumin and
platelets (Tebbs Sawyer and Elliot 1994 Carballo Ferreiros and Criado 1991 and
Yu et al 1995) Cell transport to the surface may occur through passive processes such
5
as diffusion or fluid flow or active processes such as flagellar movement Reversible
adsorption (adsorptiondesorption) of cells to the substratum can be explained in terms of
the laws of colloid chemistry such as the Derjaguin-Landau and Verwey-Overbeek
Figure I Biofilm formation (I) pre-conditioning (2) cell transport to surface (3) cell adsorptiondesorption (4) permanent adhesion (5) proliferation and (6) removal
(DLVO) theory Electrostatic forces and London-van der Waals forces combine to bring
particles andor cells to a surface by helping to overcome energy barriers allowing the cells
to form a loose attachment with the substratum (Eginton 1995 Characklis and Marshall
1990 Weber and DiGiano 1996) Within a certain distance of the substratum permanent
adhesion becomes possible through such mechanisms as specific binding to proteins in the
conditioning film or hydrogen bonding Once at the surface colonization can begin Cells
begin to produce exopolysaccharides (EPS) literally gluing themselves to the surface
6
Within this EPS matrix the cells continue to grow divide and die Occasionally chunks
of the biofilm will detach as a result of either shear forces or weaken of the bonds holding
them to the substratum (Characklis 1990)
Surface M odification
Eveiy natural and synthetic surface has unique physical and chemical properties that
can influence cellular adhesion By modifying the biomaterial surface the fundamental
processes governing biofilm formation can be altered Several review articles discuss these
processes in detail (Cristina et al 1994 Cristina Naylor and Myrvik 1992 Bryers
1988 Characklis 1990 Dankeit Hogt and Feijen 1986) and acknowledge the similarities
between bacterial colonization and tissue integration In many situations host cells are
actually competing with bacteria to colonize the biomaterial surface Thus many surface
modifications are aimed at intentionally promoting natural tissue adhesion while others are
directed at preventing bacterial adhesion
M odifications Host Cell A dhesion
Techniques focused on promoting tissue integration range from endothelial cell
sodding to glow plasma discharge modification (Williams et al 1992 Massia and
Hubbell 1991) The coating of silicone rubber membranes with poly (2-hydroxy ethyl
methacrylate) (poly HEMA) by glow plasma discharge has shown encouraging results in
vitro with regard to the attachment and growth of corneal epithelial cells bringing the
development of an artificial cornea one step closer to reality (Lee et at 1996)
7
Hydroxylapatite (HA) coatings of bone implants have already proven effective at promoting
faster and greater bone adaptation and improving implant fixation Better techniques of
applying the calcium phosphate to the implant are being examined including plasma spray
heat-treated plasma spray and magnetron-sputter (Hulshoff et al 1996) Carbon
deposition excimer laser ablation and photochemical coatings are being examined as ways
of promoting and controlling endothelial cell proliferation (Kaibara et al 1996 Doi
Nakayama and Matsuda 1996) Surface modifications may also decrease the binding of
host proteins such as thrombin and anti thrombin III thereby lowering the potential to form
blood clots which can promote bacterial adhesion A common method of accomplishing
this is by immobilizing heparin on the surface (Byun Jacobs and Kim 1996 Paulsson
Gouda Larm and Ljungh 1994 Lindhout et al 1995)
M odifications Bacterial Cell A dhesion
Methods for inhibiting bacterial colonization range from antithrombogenic coatings
to the incorporation of antimicrobial substances such as silver or quaternary amine salts (
Wang Anderson and Marchant 1993 Ryu et al 1994 Jansen and Kohnen 1995)
Heparin is only one of the substances used to coat surfaces which have been shown to
decrease bacterial adhesion due to protein-mediated adhesion Poly(vinyl pyrrolidone)
(PVP) coatings which inhibit the adsorption of fibrinogen to the surface have also exhibited
decreased bacterial adhesion (Francois et al 1996) Reductions in bacterial adhesion to
silastic catheters coated with salicylic acid a nonsteroidal anti-inflammatory drug have
been demonstrated in vitro (Farber and Wolff 1993) Coatings of hydrophilic polymers
such as polyethylene glycol (PEG) have shown potential for inhibiting implant-related
infections (Portoles Refojo and Leong 1994) Latex catheters coated with
8
glycomethacrylate gel another hydrophilic polymer have also demonstrated the ability to
reduce infection The reduction was enhanced by the incorporation cephalothin an
antibiotic (Lazarus et al 1971) The elution of an antimicrobial from the implant is one
of the most popular and oldest methods of dealing with biomaterial-centered infections
illustrated by the use of antibiotic impregnated bone cement (Strachan 1995 Seyral et al
1994) As already seen however the incorporation of antibiotics and other antimicrobials
has also been studied with regard to various polymer systems (Rushton et al 1989
Ackart et al 1975 Golomb and Shplgelman 1991 Greenfeld et al 1995) As
knowledge about the immune system increases so does the potential for developing new
substances that can coat biomaterials or be released from them to provide protection against
bacterial colonization as witnessed by development of passive local immunotherapy
(Gristina 1997)
Controlled Release
Controlled release of antibiotics at the site of implantation is one of the more
common approaches to preventing infection and is being used successfully in orthopedic
surgery A recent US survey showed that 27 of responding hospitals commonly use
antibiotic impregnated bone cement for joint replacement surgery (Strachan 1995)
However the use of bone cement is not recommended in younger active people
Consequently the controlled release of antibiotics from coated implants is under
investigation (Price et al 1995) Thus it can be seen that there are several different types
of controlled release systems
9
Controlled Release System s
Controlled release devices are classified by the method that controls the release of
the substance of concern The most common classifications are diffusion controlled
systems chemical reaction systems and solvent activated systems There are several
excellent books and articles that cover this subject in depth (Langer and Wise 1984 Kost
and Langer 1984 Fan and Singh 1989 Baker 1987 Lohmann 1995 Kydonieus 1992
Robinson and Lee 1987) so only a brief overview will be given here
Controlled release systems can be designed to produce release rate profiles that
enhance the efficacy of the desired agent This is in contrast to sustained release devices
which allow the substance of concern to be effective longer but are dependent on
environmental factors when it comes to the amount and the rate of release
The three most common release profiles achieved by controlled release devices are
(I) zero-order release (2) first-order release and (3) t 12 release shown graphically in
figure 2 Zero-order release is the most desired release rate and is most easily obtained
by using diffusion controlled release systems (Kost and Langer 1984 Lohmann 1995)_
D iffusion Controlled D ev ices There are two general types of diffusion
controlled systems (I) matrix or monolithic and (2) reservoir The rate limiting step in
both systems is the diffusion of the drug through the polymer matrix which may be
described by (l)F ickrsquos first law of diffusion and (2) Pickrsquos second law of diffusion also
called the diffusion equation (Bird Stewart and Lightfooi 1960) For a one dimensional
system they may be written as
10
Release rate kinetic
^ first-order release
square-root of time release
zero-order release
Figure 2 Zero-order first-order and square-root of time release patterns from contolled-release devices
( 1 ) Ji = - D ip raquo d c d x
(2) bCjbt = Djp trcb2
Ji - mass flux of solute (drug) i
Ci - concentration of solute i
x - position of release
t - time
Djp - solute diffusion coefficient through the polymer
11
Equation (I) is commonly used to simulate the release rates from reservoir devices
The diffusion coefficient is a measure of the mobility of the individual solute molecules
through the reservoir membrane and is considered concentration independent The
concentration gradient in the membrane is represented by dCdx The negative sign reflects
the movement of solute down the concentration gradient toward more dilute regions If the
membrane is saturated with solute a burst effect may be seen which causes an initial spike
of solute A lag effect occurs when the solute must first permeate the membrane before it is
released (Baker 1987 Langer and Peppas 1981)
Equation (2) is obtained by combining equation (I) with the continuity equation for
mass transfer assuming no reaction and zero velocity Equation (2) describes transient
diffusion in membranes The diffusion coefficient is considered to be concentration
dependent It results in the square root of time release rate for simple geometries such as a
one-dimensional slab (Baker 1987 Langer and Peppas 1981) Detailed discussions on
the applications assumptions and solutions of both these equations can be found in the
literature (Langer and Wise 1984 Kost and Langer 1984 Fan and Singh 1989 Baker
1987 Lohmann 1995 Kydonieus 1992 Robinson and Lee 1987 Langer and Peppas
1981)
Monolithic devices are made by mixing the substance of concern with the polymeric
material to form a solution from which the finished product is manufactured The drug to
be released may be dissolved or dispersed (supersaturated) in the resulting polymer
depending on how much is ldquoloadedrdquo into the carrier polymer Examples of monolithic
devices include flea collars and antibiotic loaded bone cement
Examples of reservoir systems include nitroglycerin skin patches Norplanttrade a
subcutaneous birth control device and Ocusertrx1 a contact lens like device used to neat
glaucoma In these types of systems the substance of interest is surrounded by an inert
12
membrane which may be either porous or non-porous If the membrane is porous the
drug simply diffuses through the pores but if the membrane is non-porous the drug must
first dissolve in the membrane structure before it can diffuse along and between the
segments of the membrane Reservoir systems are known for the ease with which they can
be designed to achieve zero-order release rates
Both monolithic and reservoir diffusion controlled systems are rate limited by the
diffusion of the drug through the polymer Tlie choice of polymer and the resulting effect
on the diffusion and partition coefficient of the substance of concern as well as the
geometry of the device will influence drug release rates (Kost and Langer 1984 Lohmann
1995)
Chem ically Controlled S ystem s When the substance of concern is encased
in a biodegradable non-diffusive polymer the resulting reservoir device is classified as a
chemical reaction system As seen in the diffusion controlled devices there are two basic
types of biodegradable devices (I) reservoir and (2) monolithic The release rates of these
systems are strongly influenced by the erosion of the polymer In the ideal case surface
erosion would be the only factor affecting the release rate however this system has yet to
be designed (Kost and Langer 1984 Lohmann 1995)
A second category of chemical reaction controlled release is chemical
immobilization In this type of system the substance of concern may be chemically bound
to the polymer carrier backbone or it may he part of the backbone The release rate is then
influenced by the enzymatic or hydrolytic cleavage of the appropriate bonds (Kost and
Langer 1984 Lohmann 1995)
13
Solvent Activated S y s te m s The last class of controlled release devices to
be mentioned here are the solvent controlled systems These fall into two categories (I)
swelling controlled and (2) osmotically regulated In both types the substance of concern
is either dissolved or dispersed within the polymer but it is unable to diffuse through the
polymer matrix until activated In the case of the swelling controlled system the solvent is
absorbed by the matrix causing the polymer to swell and allowing the active agent to
diffuse out In the osmotic system the solvent permeates the polymer-drug system due to
osmotic pressure which promotes release Release may occur by either simple Fickian
diffusion or by non-Fickian diffusion Detailed analysis of these and other controlled
release systems can be found in the references cited previously
A dvantages Controlled release systems offers several advantages over
conventional drug delivery systems The major advantage when dealing with biomaterial
centered infections is increased efficacy of the drug The drug can be administered at the
biomaterial site thereby allowing the therapeutic levels to be maintained locally while
decreasing the systemic drug level This will minimize side effects and improve
pharmokinetics In addition the effective drug level can be sustained for an extended
period of time (Kost and Danger 1984 Lohmann 1995)
The use in joint replacement surgery of antibiotic impregnated bone cement
combined with a polymer coating such as poly-L-lactic acid polymer (PLLA) has proven
popular for its ability to prevent infections as well as aid in joint fixation (Strachan 1995)
Controlled release of antibiotics from biomaterials is less common however in operations
involving other types of implants Nonetheless research in being done into this method of
inhibiting bacterial colonization A British study showed that antibiotic impregnated
silicone rubber coatings of implanted stimulator devices significantly decreased
14
postoperative infection when compared with systemic antibiotic prophylaxis (Rushton e t
al 1989) One of the newer antibiotics receiving attention as a treatment for biomaterial-
centered infections is ciprofloxacin
C iprofloxacin
Ciprofloxacin is a Iluorinated quinolone antimicrobial agent It is active against a
broad range of bacteria ranging from aerobic gram-negative bacteria to aerobic gramshy
positive bacteria Anaerobic bacteria however are not affected by ciprofloxacin It was
approved by the Food and Drug Administration in October 1987 (Wolfson and Hooper
1989 cponline 1997)
Like other quinolone agents ciprofloxacin is a synthetic antimicrobial which mainly
effects DNA gyrase the bacterial topoisomerase II The gyrase is a two subunit enzyme
responsible for regulating the supercoiling of DNA during replication and transcription
The A subunit of the gyrase introduces nicks in the DNA that allow the B subunit to twist
the single stranded DNA (ssDNA) around its complementary strand of DNA The A
subunit of the gyrase then seals the nicks It is believed that ciprofloxacin and the other
quinolones interfere with the A subunit preventing it from sealing the nicks Bactericidal
levels of quinolones do not affect mammalian topoisomerase enzymes The exact bacterial
killing mechanism is not known but detailed discussions about the mechanisms of
quinolones action can be found in WolfSon and Hooper (1989) It is known that both slow
growing and fast growing organisms are inhibited by ciprofloxacin and that a prolonged
post-antibiotic effect is exhibited by fluoroquinolones (Wolfson and Hooper 1989
cponline 1997 Craig and Ebert 1991 Cam pa Bendinelli and Friedman 1993)
15
Ciprofloxacin has the lowest minimum inhibitory concentration (MIC) of the
quinolones The MIC90 for P aeruginosa in vitro is between 025 (igml and I jigml
Thus ninety percent of the P aeruginosa strains will be inhibited at these low
concentrations (Craig and Ebert 1991 Campa Bendinelli and Friedman 1993) Due to
its wide antimicrobial range and low MIC ciprofloxacin was chosen as a model antibiotic
for incorporation into the test PEU polymers
16
MATERIALS AND METHODS
Bacteria and Cultures
Pseudomonas aeruginosa (ERC-I) was obtained from the National Science
Foundation Engineering Research Center for Biofilm Engineering Montana State
University Bozeman MT Cultures of P aeruginosa were stored as frozen stocks
maintained in a solution of 2 peptone and 20 glycerol at -70degC
Solutions
M edium
A minimal salts medium with glucose as the sole carbon source was used for
culturing bacteria A one liter solution consisted of 05g glucose 256g Na2HPO4 208 g
KH2PO 4 IOg NH4Cl Olg CaCl2 05g MgSO4 and 002ml of a trace metals solution
The trace metal solution was composed of 05 CuSO4-SH2O 05 ZnSO4-VH2O 05
FeSO4-VH2O and 02 MnCl2-4H20 all in a weight per volume ratio dissolved in 10
concentrated HCl (Manual of Industrial Microbiology and Biotechnology 1986) The trace
metals solution was autoclaved separately from the nutrient medium as was a 5M CaCl2
solution and a 2SM MgSO4 solution The glucose trace metals CaCl2 and MgSO4 were
all added to the sterile medium by injection through a septum after the medium had been
brought to room temperature All solutions were filler sterilized through a 02 |im sterile
syringe tip filter (Coming) before addition to the medium AU solutions were made using
Nanopure water (Bamstead ultrapure water system Nanopure system) and autoclaved in
glass containers at 121degC for 15 minutes per liter
17
CvtologicaI Stains
A 005 solution of Acridine Orange used for epifluorescent total cell counts was
filter sterilized using an autoclaved filter apparatus Hoechst 33342 (Sigma) was obtained
in IOOmg quantities and stored in a O0C freezer until a fresh solution was needed Then
IOml of sterile nanopure water were added through a 02 jam sterile syringe tip filter to
dissolve the powder Once the Hoechst solution was made it was kept in the refrigerator
All stains were stored in light sensitive bottles and made at fresh at least once a month
C iprofloxacin
Ciprofloxacin hydrochloride was obtained from Miles Inc as 867 fag
ciprofloxacinmg A 10000 fagml stock solution was made by dissolving 1153 mg of
powder in 10 ml of sterile nanopure water Tlte stock solution was stored in a light
sensitive glass container in the refrigerator for up to one year as per the supplierrsquos
recommendations
D etection A Milton Roy Spectronic 1201 spectrophotometer was used to
determine the proper wavelength for detecting ciprofloxacin Effluent samples were
collected from the flow cell filtered through a 02 (am sterile syringe tip filter (Corning)
and stored in amber microcentrifuge tubes kept in a 0degC freezer until analysis A Milton
Roy Spectronic 601 set at 339 nm was used to determine the concentration of ciprofloxacin
in the effluent from the flow cell_
18
Reactors and Flow Cell Systems
Continuouslvrstirred Tank Reactor (CSTR)
A CSTR was designed to provide a constant supply of Pseudomonas aeruginosa
at room temperature (230+3degC) in exponential growth A 125 ml filter flask was equipped
with an inlet outlet aerator and injection port to build the CSTR The arm of the filter
flask was situated so that overflow occurred when a volume of 128 ml was reached
Table I lists the parameters used for sizing the CSTR At steady-state operation tire
specific growth rate p is assumed to be equivalent to the dilution rate D Figure 3
shows a schematic of the chemostat setup The outlet lube from CSTR was connected to a
Specific growth rate (|_t) 0467+ 0025 hr1 (Appendix A)Volume (V) 128 mlVolumetric flow rate (Q) 10 mlminTable I Parameters used for sizing of biologic reactor
waste jug unless cells were needed for an experiment in which case the CSTR was
connected to a collection vessel A fresh clean sterile collection flask was used for every
experiment The setup was dismantled cleaned and sterilized at least once every two
weeks
Flow C ell
A schematic of the flow cell used to evaluate the test materials can be seen in figure
4 The polymer sample (P) was placed on a clear polycarbonate base which had entrance
and exit stainless steel portals milled into it A white FDA vinylnitrile rubber (D) gasket
19
Collectionvessel
CSTR
Figure 3 CSTR setup used to grow P aeruginosa continuously
was used to equalize sealing pressure around the polymer sample as the assembly was
screwed together A thin gauge natural latex rubber (C) gasket was clamped between the
test sample and coverglass (B) to form the flow channel The coverglass was glued over a
hole in the clear polycarbonate cover using the denture adhesive Fasteethreg Table 2
lists the dimensions of the flow channel and various hydrodynamic parameters AU of
the materials used in the flow cell were sterilized by dipping the components in 70 ethyl
20
Figure 4 Flow cell schematic (A) clear polycarbonate cover with hole through center for viewing (B) 2 glass coverslip (C) thin gauge natural latex gasket (D) white FDA vinylnitrile rubber sealing gasket (E) clear polycarbonate base (P) test
polymer
alcohol rinsing with sterile nanopure water and exposing to UV light for at least 15
minutes The test polymers were not exposed to UV The How cell was assembled
under a laminar flow hood to ensure sterility
Table 2 Flow channel dimensions and hydraulic parameters
width (w) 16 mmlength (I) 44 mmdepth (d) 08 mmarea (A) 128 mmwetted perimeter (P) 336 mmhydraulic radius (Rh) 04 mmReynolds number (Rp) 2 1entrance length (Lp) 01 mmwall shear stress (Jfl) 203 dynecnri
21
Microscope Setup and Techniques
Polym er A nalysis
The polymer samples were tested for bacterial adhesion and growth using an image
analysis system seen in figure 5 For the first six hours of the experiment approximately
5 x IO8 cellsml of stained Pseudomonas aeruginosa were flowed over the test polymer at
a rate of 10 mlmin For the remainder of the experiment complete medium without
bacteria was pumped through the flow cell
Hoechst 33342 Staining Procedure P aeruginosa in log growth were
collected and stained with lOpgml of Hoechst 33342 Once the stain was added to the
cells the flask containing the mixture was wrapped in foil and put on an insulated stir plate
for three hours After three hours the suspension was poured into a sterile centrifuge bottle
and centrifuged at 10000 xg for 15 minutes in a 20degC centrifuge (Sorvall Instruments
Dupont model RC5C GSA rotor) The liquid was then poured off and the cells were
resuspended in sterile complete medium minus the glucose The cells were washed twice
more before placing them in a sterile 125 ml Erienmeyer flask with a stir bar at a
concentration of approximately 5 x 10s cellsml This procedure was repeated every two
hours until the flow cell feed was switched to complete medium only at hour six
Cell V isualization At t=0 the flow cell was place on the stage of an
Olympus BH-2 Epi-Illumination UV upright microscope equipped with Olympus filter
combinations encompassing the ultra-violet violet blue and green regions of the
spectrum A 40x Nikon water immersion objective was used since the flow channel was
22
greater than 0100 mm in depth A minimum of three fields was captured by an Optronics
OPDEI-470OT cooled color CCD camera The resulting image was processed by a Targa
64+ analog digital converter (ADC) card and stored on computer until the image could be
analyzed using Image Pro Plustrade Images were taken every two hours until t=6 hours
when the feed was switched from the cell suspension to sterile complete medium The
remaining four time points captured were (I) t=7 or 8 hours (2) t=16 or 18 hours (3)
t=20 or 21 hours and (4) t=24 hours
Waste
Figure 5 Experimental setup Feed container = cell suspension t=0-6 hrs after t=6 hrs feed = complete medium Flow rate through flow cell 10 mlmin
23
Cell density calculations Tlie software system Image Pro Plus was used to
determine the density of cells on the polymer surface At the beginning each experiment an
image of a micrometer was taken to allow for the calibration of cell size and image area
Actual cell counts could be obtained at the early time points Cell density calculations were
then simply a matter of dividing cell count by the viewing area At time points greater than
8 hours the area occupied by cells was used to give a range for the cellular density This
was accomplished by dividing the area covered by the high and low published values for P
aeruginosa cell area (Holt 1994) to calculate cell numbers This method proved to be valid
as the cells numbers obtained at the early time points fell within the high and low range of
cell numbers calculated using area covered
In addition samples from both the inlet and outlet of the flow cell were collected for
total cell counts and viable cell counts Total counts and viable counts were also conducted
on a sample of the solution in which the polymer was placed at the end of the experiment
Before any sample was removed for these tests the polymer was sonicated for 30 seconds
to remove adherent bacteria This allowed for the calculation of cell density on the polymer
using total cell counts and viable cell counts
Total Cell C ounts A portion of each sample collected from the inlet outlet
and sonicated polymer solution was used to determine total cell counts One milliliter of
005 Acridine orange was combined with one milliliter of 2 glutaraldehyde and the
appropriate dilution of sample This solution was poured over a black polycarbonate
membrane (pore size 022 pm and 25 mm diameter Fisher Scientific) placed in a cell free
glass Millipore filter apparatus Suction was applied to trap the cells on the membrane
The membrane was mounted on a slide by putting a drop of oil (non-drying immersion oil
type FF) on a microscope slide placing the membrane cell side up on top of the oil drop
24
followed by a second drop of oil and covering with a glass cover slip The slide was
examined under fluorescent microscopy Bacteria were counted using an Reichert-Jung
Microstar IV model UV microscope with a mercury lamp and a Reicheit IOOx oil
immersion objective Total counts ( cellsgrid) were then converted to total cellsml using
the following conversion
total cells (cell count) (dilution) (conversion factor) ml ~ sample volume
where the conversion factor was 227 x 10
Viable Counts A part of the cell suspension sample was used to make serial
dilution for plating onto plate count agar (Difco Laboratories) plates A I(K) pl multipipetor
(Rainin epd 2) was used to dispense ten 10 pi drops of properly diluted cell suspension
onto a plate This procedure was performed in triplicate for each dilution plated Plates
were incubated at room temperature for 24 hours Drops that contained between 3 and 30
colonies were counted and converted to colony forming units (cfu)ml by taking into
account the dilution factor (Miles etal 1938)
Susceptibility and Adhesion Effect Studies
C iprofloxacin
Growth curves carried out in batch were used to determine the susceptibility of
increasing concentrations of ciprofloxacin on P aeruginosa These tests were not carried
out as most traditional MIC assays Studies here were performed as per the procedures of
25
Nodine and Siegler 1964 Lennette et al 1985 starting with a cell concentration of IO6
cellsml P aeruginosa was grown in separate batch cultures which contained various
concentrations of ciprofloxacin At time points ranging from t=0 to t=24 hours samples
were taken for viable counts
Hoechst Stain 1333421
Susceptibility studies were also conducted on Hoechst 33342 to ensure that the
stain did not interfere with normal cell growth The studies were conducted in the same
manner as the ciprofloxacin tests Concentrations of Hoechst stain examined ranged from
Ojagml (control) to 50|igml
Fasteethreg
Studies were also carried out to ensure that the denture adhesive Fasteethreg used
to glue the coverglass to the polycarbonate cover of the flow cell had no negative effect on
the growth of bacteria These studies were conducted in the same manner as those for
ciprofloxacin and the Hoechst stain
Hoechst Stain Effects on P a e r u g in o s a Adhesion
Tests were performed to determine whether the Hoechst stain interferes with the
normal adherence of the cells to a surface The flow cell was assembled without a polymer
sample and an untreated cell suspension was run through the cell for four hours Since the
base of the flow cell is a clear polycarbonate light microscopy could be used to monitor
cell adhesion using video recording Experiments were also carried out using stained cells
still in the staining liquid and stained cells that had been washed and resuspended in
ldquocleanrdquo medium
2 6
The possibility of ciprofloxacin and Hoechst interfering with each other was also
investigated Plate counts were used as in the susceptibility studies Microscope slides
were also made and any change in staining ability was noted
Tubing
All of the tubing used was FDA approved MasterFlex (Cole Palmer) for use with
either pharmaceuticals or food Tubing used included Pharmedreg size 1314 and 16
Norprenereg Food size 13 and 14 and Tygonreg Food size 14 Before each use it was
sterilized by autoclaving at 121degC for 15 minutes
Biom aterial Fabrication
BP Control Polym er
A poly (ether) urethane (Biospantrade) poly ethylene glycol (PEG) film (BP) was
prepared for use as a control The method of fabrication was as follows (I) 20 ml of
deionized water was used to dissolve 2 g of PEG (Polyscience) (2) the resulting solution
was lyophilized and the powder was sieved to obtain 90 pm or smaller particles (3) this
powder was mixed with a 24 Biospantrade solution (Polymer Technology Group Inc) (4)
the polymer solution was degassed transferred to a Teflon mold (Chemware) and
incubated at 60degC for one day and finally (5) the film was dried completely in a vacuum
chamber
27
Test Polym ers
The test polymers were manufactured by the same procedure except the
ciprofloxacin containing films also had an equal amount of ciprofloxacin added in step (I)
In addition the test polymers were coated with either triethylene glycol dimethyl ether
(triglyme) or tiiglyme plus n-butylmethacrylate (BMA) by glow discharge plasma
deposition (GDPD)
Note All test materials were fabricated at the University of Washington by Connie
Kwok
2 8
RESULTS AND DISCUSSION
Pseudomonas aerueinosa Growth Experiments
Batch S tud ies
Growth Rate Studies were conducted to determine the growth rate of P
aeruginosa under experimental conditions Table 3 (Appendix A) The specific growth
rate (I was found to be 0467 hr1
Experiment specific growth rate (h r1)I 04802 05023 04444 04436Average 0467plusmn0025Table 3 Specific growth rate for P a eru g in osa grown at room temperature with SOOppm
glucose fully aerated
Susceptibility S tu d ies In addition susceptibility studies were done on
ciprofloxacin Hoechst 33342 and Fas teethreg (Appendices BC and D) The
ciprofloxacin tests confirmed the published M IC90 of l(igml The Hoechst stain (33342)
were shown not to inhibit growth at 10 |_igml Table 4 summarizes the results of the
Hoechst 33342 susceptibility tests Results from the Fasteethreg susceptibility studies show
no negative effects on P a eru g in o sa
Hoechst 33342 concentration (pgml) Growth inhibited0 No5 No10 No50 YesTable 4 Summary of Hoechst 33342 studies
29
Flow Cell Experimental Protocol
The concentration of resuspended bacteria used to challenge the test polymers was
roughly 5 x IO8 cellsml The flow rate to the parallel plate flow cell was maintained at
approximately 10 mlmin for the duration of each experiment Samples were taken for
total counts and viable counts from both the system influent and the effluent at t = 0 2 4
and 6 hours for every experiment Only effluent samples were collected after t = 6 hours
Effluent samples were also used to determine if any ciprofloxacin eluted from the test
polymers containing the antibiotic All the experiments were earned out at room
temperature in the medium previously described
Flow Cell Experiments
The ability of a polymer to affect bacterial adherence and colonization was examined
in flow cell experiments run on four different formulations of a poly (ether) urethane (PEU)
base material The control material (BP) was a PEU base matrix (Biospantrade) containing
poly (ethylene glycol) (PEG) as a pore forming agent
The materials tested included (I) triglym e BP coated with triethylene glycol
dimethyl ether (triglyme) (2) ciprotriglym e BP made up of equal parts PEG and
ciprofloxacin coated with triglyme (3) BM A BP coated with a layer of n-
butylmethacrylate (BMA) underneath the triglyme coating and (4) ciproBM A BP made
up of equal parts PEG and ciprofloxacin coated with BMA followed by triglyme (Table
5) The triglyme coating was used to control the release rates of the model antibiotic
ciprofloxacin
30
Polym er FormulationBPControl BiospanlivV PEG (poly ethylene glycol)triglyme Triethylene glycol dimethyl ether coated BPciprotriglyme BP made with equal parts PEG and ciprofloxacin coated with triglymeBMA BP coated with n-butylmethacrylate followed by a coating of tryiglmeCiproBMA BP made with equal parts PEG and ciprofloxacin coated with BMA
followed by a coating of triglyme
Table 5 Description of polymers used in flow cell experiments
Three samples of each polymer were tested A good representation of the events at
the polymer surface is provided by image analysis (IA) as it is obtained from pictures of
the stained cells on the surface Figures 6 and 7 illustrate the attachment and growth of
P aeruginosa on the control polymer over the course of an experiment Figure 8
displays the differences in cell density on three different polymers after 24 hours in the
flow cell A significant decrease in bacterial adhesion and colonization was evident when
the test polymers were compared to the BP polymer at the end of the experiments and over
the entire run using pictures taken for TA (figures 6 7 and 8)
The graphs generated from the image analysis data (figures 9 10 and 11) were
obtained from a single run for each polymer Each experiment was however replicated
three times The error bars were obtained because at least three different fields of view
were taken for each time point from which the average cell density and the standard
deviation were calculated (Appendix E)
Figure 6 BiospanControl time course of cell adhesion
t=0 hours t=2 hours
t=4 hours t=6 hours
Figure 7 ControlBiospan polymer bacterial colonization
t=24 hours
Figure 8 Comparison of the extent of colonization of different polymers at t=24 hours
triglyme Cipro-triglyme
34
CNlt
EE
0)O
pound(AC0)O
100E+06
100E+05
100E+04
100E+03
100E+02
100E+01
100E+00 J -
I III bullbullbullbullbullbullbullbullbull Ce -
Control STrigIyme 0 ciproAriglyme S BMA S ciproBMA
Polymers
Figure 9 Dhiect counts of cell density on the polymer surface after 24 hours (L-R) Control triglyme ciprotriglyme BMA ciproBMA
Figure 9 clearly shows that the coatings of triglyme and BMA + triglyme reduce
bacterial colonization by at least half when compared to the BP control It can also be seen
from Figure 9 that the addition of ciprofloxacin to the polymer formulation decreases
bacterial colonization by at least two orders of magnitude Note that the y-axis on figure
9 is a logarithmic scale
35
60E+05
50E+05
40E+05
30E+05
20E+05
10E+05
OOE+OO I r
-10E+05
tim e (hrs
mdash Control
-laquo~-trigiyme
A ciprotriqlyme
FigurelO Time course cell colonization curve of control triglyme ciprotriglyme obtained from image analysis
Figure 10 shows that bacterial attachment and colonization to the control polymer is much
greater than to either the triglyme or ciprotriglyme polymer Analysis of the data in
Appendix E will show the same trend for BMA and ciproBMA At t = 6 hours the feed
was switched from a medium containing ~5 x IO8 cellsml with no glucose to a sterile feed
of complete medium plus 500 ppm glucose Therefore any increase in cell density can be
attributed to growth Slightly more growth can be seen on the triglyme than on the
ciprotriglyme over the course of the experiment however neither of these polymers
exhibits the growth found on the control polymer
36
Figure 11 reveals that bacteria are attaching to the triglyme and ciprotiiglmc
polymers but not to the same extent as to the BP control polymer The bacteria attach to
the control polymer at a rale ol 114 x IO4 ccllsmnrhr while the rates of attachment to the
triglyme and the ciprolriglymc are significantly lower 66 cel I smm 2Zhr and 537
C ellsZm m 2Zhr respectively While the attachment rate is greater on the ciprolriglymc than on
the triglyme The rale of growth is greater on the triglyme than on the ciprolriglymc It can
80E+04
70E+04
60E+04
E 50E+04
40E+04
30E+04
20E+04
10E+04
00E+00
-10E+04
time (hrs)
Control
triglyme
A ciprotriqlyme
Figure 11 Attachment rate differences are evident within the first 6 hours of the flow cell experiments The control polymer demonstrates a much more rapid attachment rate than either triglyme or ciprotriglyme
be seen from figure 10 that the control polymer exhibits an exponential rale of growth
from 1=16-24 hours that is significantly higher than either triglyme or ciprolryglmc Whal
37
is not readily seen is the fact that triglyme exhibits a faster growth rate than the
ciprotriglyme 181 x IO3 cellsmm2hr versus 27 cellsmm2hr
Total counts of the effluent found in Appendix F back up the imagae analysis
results ( figures 1213) F igure 12 shows that for the first six hours ~5xlO8 cellsml
are being pumped through the flow cell Once the supply of cells is cut off at t=6 hours
cells can still be seen in the effluent implying that growth of new cells is taking place in the
flow cell system
140E+09
120E+09
T=100E+09
S800E+08
S600E+08
agt400E+08
200E+08
000E+000 2 4 6 8 1012 141 6 1 8 20 22 24 26
mdash Control Triglyme
Ciprotriglyme- -x- - BMA
ciproBMA
time (hrsF igure 12 Total counts made with Acridine Orange From t=0-6 hours a feed
composed of a bacterial suspension in medium without a carbon source was pumped through the flow cell after t=6 hous the feed was switched to sterile complete medium
Figure 13 obtained from total cell counts displays the same trend with regard to
the amount of cell density on the polymer surface after 24 hours as figure 9 which was
made from direct count data The control polymer exhibits the highest cell density after
24 hours The effluent data does not demonstrate as much of a difference between
polymers as the image analysis data which may be explained by the growth and sloughing
of bacteria in the effluent tubing It is to be expected that the samples collected from the
Den
sity
(ce
lls
mm
A2)
38
effluent would have higher cell counts since there is more surface area available for cell
growth
100E+08 T
100E+07
100E+06
100E+05
100E+04
100E+03
100E+02
100E+01
100E+00Polym ers
I n Control | s Triglyme | ^Ciprotriglyme I SBMA I sciproBMA
Figure 13 Calculated cell density on the ldquotestrdquo polymers using total cell count (acridine orange) data Note that it follows the same trend as the image analysis data
Figure 14 shows that viable cells are being pumped through the flow cell while
figure 15 demonstrates that the concentration of ciprofloxacin at the polymer surface is
high enough to have a noticable effect on the density of bacteria on the polymer (Appendix
G - Plate Count Data)
39
Effluent viability data from t = 0-24hours
100E+10
100E+09
100E+08
j 100E+07 -
100E+06 -
100E+05
100E+04
time (hrs)
mdashmdash Control triglyme
bull-c ip ro tr ig ly m eBMA
-bull- ciproBMA
Figure 14 Plate count data from effluent samples taken from the polymer flow cells during the course of the experiments shows that viable cells are going through the flow cell
As stated previously total counts and viable counts are not considered to be as
accurate as direct counts The effect of the extra surface area available for cell adhesion and
growth provided by the tubing was not factored into the results Subsequent sloughing
andor entrapment of cells in this region of the flow cell setup could affect the cell
concentration data collected Figure 16 demonstrates the variation obtained from the
den
sity
(cf
um
mA2
)40
concentration data collected Figure 16 demonstrates the variation obtained from the
100E+06
SxltltSSSxgtxv-v
mm
I B
reg Control reg triglyme 0 ciprotriglyme 0 BMA Q ciproBMA
Polymers
Figure 15 Cell densities on polymers calculated from plate count data No colonies were found on any of the plates made for the ciproBMA polymer (L-R) Control triglyme ciprotriglyme BMA ciproBMA
same polymer using different techniques As stated previously the results obtained from IA
are considered to he the most accurate since they are taken from the polymer surface and
not the effluent
cell
dens
ity (c
ells
or c
fum
m2)
41
100E+07
100E+06
100E+05
100E+04
100E+03
100E+02
100E+01
100E+00 Plate counts Total counts IA
I
Figure 16 demonstrates the variations in bacterial density on the triglyme polymer after twenty four hours using image analysis (IA) acridine orange staining of the effluent and plate counts of the effluent
C iprofloxacin re lease
The extra surface area could also factor into the amount of ciprofloxacin detected in
the effluent (table 6) of the polymers incorporating ciprofloxacin In one millileter of
effluent roughly 3 ug of ciprofloxacin should be detected It should be noted that all of
the polymers containing ciprofloxacin still retained significant amounts of ciprofloxacin
This is to be expected given that the initial loading of ciprofloxacin was 04g Additionally
42
an earlier study found that these polymers continue to elute ciprofloxacin for up to 128
hours in a well stirred flask (Kwok CS et al 997) The erratic release of ciprofloxacin
seen in table 6 may be due to the interaction of the antibiotic with cells growing in the
effluent tubing ciprofloxacin degradation resulting
Experiment Time (hours) Cipro cone (figml) of points above detectionCiprotriglym e
O 35 plusmn21 2
2 17 I4 5 I6 4 I8 ND O18 ND O21 18 I24 5 + 5 2
CiproBM A O 6 plusmn 5 32 I I4 ND O6 ND O8 29 I18 2 I21 ND O24 ND O
Table 6 Ciprofloxacin concentrations in effluent ND = not detectable
from light exposure pulsating flow unforeseen release behavior or damage to polymer
coating Appendix H expands on the mathematical theory behind the controlled-release
of a drug from a one-dimensional slab under flow conditions
Overall the flow cells experiments showed that ciprofloxacin could successfully be
incorporated into BiospantradePEG polymers and still maintain its efficacy In addition
they demonstrated that cell adhesion and colonization of opaque materials could be
monitored continuously for up to 24 hours under Jlow conditions The results involving
the triglyme and BMA coatings were also encouraging
43
SUMMARY
The research conducted for this study involved exposing planktonic Pseudomonas
aeruginosa to 10 |igml of the DNA stain Hoechst 33342 for 3 hours The cell
suspension was then washed and resuspended in fresh complete medium minus glucose
the carbon source Every two hours for six hours a fresh batch of resuspended cells was
pumped over a ldquotestrdquo polymer in a flow cell being monitored microscopically for bacterial
attachment After six hours the flow was switch from the cell suspension to complete
medium plus glucose in order to observe cell adhesion and growth over the 24 hour run
Pictures were taken periodically over the course of the experiment and examined by image
analysis to detect changes in bacteria cell density on the surface of the ldquotestrdquo polymer The
results obtained from image analysis were for the most part confirmed by total and viable
cell counts performed on effluent samples Within the limitations and scope of this work
the results show that
1) Both the BMA coating and the triglyme coating can cut bacterial adhesion and
colonization in half
2) The addition of the ciprofloxacin to the polymer matrix decreases bacterial adhesion and
colonization by at least two orders of magnitude when compared with the control
3) Hoechst 33342 can be used at lOugml without interfering with P aeruginosa growth
patterns
4) Hoechst 33342 enables bacterial adhesion and biofilm formation on an opaque surface
to be monitored in a flow cell system for up to 24 hours
The results of this research indicate that it would be worthwhile to pursue
development of the ldquotestrdquo polymers for use as biomedical materials Further investigation
into how well image analysis correlates with actual bacterial cell adhesion and colonization
44
is also suggested from these results It would be interesting to run a set of experiments on
a substratum comparing image analysis and destructive sampling in which the flow cell is
broken down and the substratum is removed at every time point In addition a better
indication of the long-term performance of these materials could be gained by conducting
tests over a longer period of time a week or more Likewise the exposure of the material
to proteins before andor during bacterial challenge would provide more realistic test
conditions Dealings with industry have shown that the types of adhesion and colonization
experiments conducted in this study are among the initial steps in gaining approval from the
FDA
45
BIBLIOGRAPHY
Ackart WB Camp RL Wheelwright WL and JS Byck A n tim ic r o b ia l P o ly m e r s Journal of Biomedical Materials Research V 9 p 55 - 68 1975)
Baker RW Controlled Release of Biologically Active A gents John Wiley amp Sons New York NY 1987
Bellido F and REW Hancock S u s c e p t ib i l i ty a n d R e s is ta n c e o f P s e u d o m o n a s a e ru g in o sa to A n tim ic r o b ia l A g e n ts P s e u d o m a n a s a e r u g i n o s a as an Opportunistic Pathogen eds M Campa M Bendinelli and H Friedman Plenum Press New York NY p 321- 348 1993
Bird RB Stewart WE and EN Lightfoot Transport Phenomena John Wiley amp Sons New York NY p 495 - 625 I960
Blanchard CR B io m a te r ia ls B o d y P a r ts o f the F u tu re lthttpwwwswiiorg3pubsttodayfallimplanthtmgt June 4 1996
Bondi A B a s ic P h a m a c o lo g ic T ec h n iq u es f o r E va lu a tin g A n tim ic r o b ia l A g e n ts I Animal and Clinical Pharm acologic Techniques in Drug Evaluation eds JH Nodine and PE Siegler Year Book Medical Chicago IL p 440 - 450 1964
Bryers JD M o d e lin g b io ftlm a cc u m u la tio n Physiological Models in Microbiology V o l rsquol l ed Brazin MJ and Prossser JL CRC Press Boca Raton FE p1091
1988
Byun Y Jacobs HA and Sung Wan Kim M ec h a n ism o f th ro m b in in a c tiv a tio n b y im m o b il iz e d h e p a r in Journal of Biomedical Materials Research V 30 p 423 - 427 1996
Carballo J CM Ferreiros and MT Criado Im p o r ta n c e o f experim en ta l d e s ig n in th e e v a lu a tio n o f th e in flu en ce o f p r o te in s in b a c te r ia l a d h e re n c e to p o ly m e r s Medical Microbiology and Immunology V 180 p 149-155 1991
Characklis WG and KC Marshall eds Biofilms J Wiley amp Sons New York NY 1990
Ciprofloxacin Ciproreg Ciproreg IV C loxanreg Clinical Pharmacology Online lthttpwwwcponlinegsmcomscriplsfullmonoshowmonopl7mononum=I 12gtMay 19 1997
Clinical Applications of Biomalerials NIH Consens Statement 1982 Nov 1-3 [cited 1997 August 21] 4(5)1-19 httptextnlmnihgovnihcdcwww34txthtml
46
May 27 1996
Craig and Ebert Pseudomonas aeruginosa Infections amp Treatment p 467-491
Dankert J Hogt AH and J Feijen Biomedical Polymers Bacterial Adhesion Colonization and Infection CRC Critical Reviews in B iocom patibility V 2 p 219-301 1986
Doi K Nakayama Y and T Matsuda Novel compliant and tissue-permeable microporous polyurethane vascular prosthesis fabrication using an excimer laser ablation technique Journal o f Biomedical M aterials Research V 31 p 27 - 33 1996
Eginton PJ et al The influence o f substratum properties on the attachment o f bacterial cells Colloids and Surfaces B B io in terfaces V 5 p 153-159 1995
Farber BF and AG Wolff Salicylic acid prevents the adherence of bacteria and yeast to silastic catheters Journal o f Biomedical Materials Research V 2 7 p 5 9 9 - 6021993
Fan LT and SK Singh Controlled Release a Quantitative Treatments Springer-Verlag New York NY 1989
Francois P et al Physical and biological effects o f a surface coating procedure on polyurethane catheters Biom aterials V 17 p 667 - 678 1996
Golomb G and A Shplgelman Prevention o f bacterial colonization on polyurethane in vitro incorporated antibacterial agent Journal o f Biomedical Materials Research V 25 p 937 - 952 1991
Greenfeld et al Decreased bacterial adherence and biofilm formation on chlorhexidince and silver sulfadiazine-impregnated central venous catheters implanted in swine Critical Care Medicine V 23 p 894 - 900 1995
Gristina AG Biomaterial-Centered Infection Microbial Adhesion Versus Tissue Integration Science V237 p1588-1595 Sept 1987
Gristina AG Implant Failure and the Immuno-Incompentent Fibro-InflammatoryZone
Clinical Orthopaedics And Related Research V298 p106-118 1994
Gristina AG et al Cell biology and molecular mechanisms in artificial device infections The International Journal of Artificial Organs V16 p755- 764 1993
Gristina AG et al The Glycocalyx Biofilm Microbes and Resistant Infection Seminars in Arthroplasty V5 p160-170 October 1994
47
Gristina AG Naylor PT and Q Myrvik The Race for the Surface Microbes Tissue Cells and Biomaterials Molecular M echanisms o f M icrobial Adhesion eds Switalski L Hook M and E Beachey Springer-Verlag New York NY 1989
Gristina AG Passive Local Immunotherapy ldquoPLIrdquo to Prevent Biomaterial and Wound Infection Frank N Nelson Lecture Nov 11 1997
Hanker JS and BL Giammara Biomaterials and Biomedical Devices S cien ce V 242 p885-892 Nov 11 1988
Holt JG et al B ergeyrsquos Manual of Determinative B acterio logy 9th ed Williams amp Wilkins Baltimore MD p 93 - 941994
Hulshoff JEG et al Evaluation of plasma-spray and magnetron-sputter Ca-P- coated implants An in vivo experiment using rabbits Journal o fBiomedical Materials Research V 31 p 329 - 337 1996
Jansen B and W Kohnen Prevention o f biofilm formation by polymer modificationJournal of Industrial Microbiology V 15 p391-396 1995
Kaibara et al Promotion and control o f selective adhesion and proliferation o f endothelial cells on polymer surface by carbon deposition Journals o fBiomedical Material Research V 31 p 429 - 435 1996
Kost J and R Danger Controlled release of bioactive agents Trends in B iotechnology V2 p47-51 1984
Kwok CS et al Design of Infection-resistant Polymers I Fabrication and Formulation in the process of submitting 1997
Kydonieus A ed Treatise on Controlled Drug Delivery Fundam entals Optimization Applications M arcelDekker Inc New York NY 1992
Danger RS and DL Wise eds Medical Applications of Controlled R e lea se Volume I CRC Press Inc Boca Raton PD 1984
Danger RS and DL Wise eds Medical Applications of Controlled R e lea se Volume II Applications and Evaluation CRC Press Inc Boca Raton PD 1984
Danger RS and N A Peppas Present and future application of biomaterials in controlled drug delivery systems Biomaterials V 2 p 244 -246 1981
Lazarus SM et al A Hydrophilic Polymer-Coated Antimicrobial Urethral CatheterJournal of Biomedical Materials Research V 5 p 129 - 138 1971
Lee S-D et al Artificial cornea surface modification o f silicone rubber membrane by graft polymerization o f pHEMA via glow discharge B iom aterials V 17 p
4 8
587 - 5951996
Lindhout T etal Antithrombinactivity o f surface-bound heparin studied underflow conditions Journal of Biom edical Materials Research V 29 p 1255 - 1266 1995
Lohmann D Controlled Release-recent progress in polymeric drug delivery systems M acromol Symp V 100 p25-30 1995
Manual of Industrial M icrobiology and Biotechnology p30 1986
Massia SP and JA Hubbell Human endothelial cell interactions with surface- coupled adhesion peptides on a nonadhesive glass substrate and two polymeric biomaterials Journal of Biom edical Materials R esearch V 25 p 223- 242 1991
Materials Science Materials for medicine Britanica Onlinelthttpwwwebcom 180cgi-bingDocF=macro5004232htmgt [Accessed Nov 20 1997]
Miles AA Misra SS and JO Irwin The Estimation o f the Bactericidal Power o f the Blood Journal of Hygiene V 38 p 732-749 1938
Paulsson M Gouda I Larm O and A Ljungh Adherence o f coagulase-negative staphylococci to heparin and other glycosaminoslycans immobilized on polymer surfaces Journal of Biomedical M aterials Research V 28 p 311 - 317 1994
Portoles M Refojo MF and F-L Leong Poloxamer 407 as a bacterial abhesive for hydrogel contact lenses Journal o f Biomedical M aterials Research V 28 p 303 - 309 1994
Price JS Tencer AF Arm DM and GA Bohach Controlled release o f antibiotics from coated orthopedic implants Journal o f Biom edical Materials Research V 30 p281-286 1996
Robinson JR and VHL Lee Controlled Drug Delivery Fundamentals and Applications 2nd ed Marcel Dekker Inc New York NY 1987
Rushton DN Brindley GS Polkey CE and GV Browning Implant infections and antibiotic-impregnated silicone rubber coating Journal of N eu ro lo g y Neurosurgery and Psychiatry V 52 p 223-229 1989
Ryu GH et al Antithrombogenicity o f lumbrokinase-immobilized polyurethane Journal of Biomedical M aterials Research V 28 p 1069-1077 1994
Schlichting H Boundary-Layer T heory translated by J Kestin 7 ed McGraw- Hill New York NY p 596-615 1979
49
Seyral P Zannier A JN Argenson and D Raoult The r e le a s e in v itro o f v a n c o m y c in a n d to b ra n y c in f r o m a c ry lic b o n e cem en t Journal o fAntimicrobial Chemotherapy V 33 p 337 - 339 1994
Strachan CJL The p r e v e n tio n o f o r th o p a e d ic im p la n t a n d v a sc u la r g ra ft in f e c t io n s Journal o f Hospital Infection V 30 (Supplement) p 54-63 1995
Suljak JP e t a l B a c te r ia l a d h e s io n to d en ta l am algam a n d th re e res in c o m p o s i te s Journal of Dentistry V23 p171-176 1995
Sullam PM Payan DG Dazin PF and FH Valone B in d in g o f V irid a n s G rou p S tr e p to c o c c i to H u m a n P la te le ts a Q u a n tita tiv e A n a ly s is Infection and Immunity V 58 p 3802-3806 Nov 1990
Tebbs SE Sawyer A and TSJ Elliot In flu en ce o f su rfa ce m o rp h o lo g y on in v i t r o b a c te r ia l a d h e re n c e to c e n tra l ven o u s c a th e te r s British Journal o f Anaesthesia V 72 p 587-591 1994
Thomsberry C and JC Sherris Section XI Laboratory Tests in Chemotherapy General Considerations Manual of Clinical Microbiology eds EH Lennette A Balows W J Hausler and HJ Shadomy 4th ed American Society for Microbiology Washington DC p 959 -977
Wang I Anderson JM and RE Marchant P la te le t -m e d ia te d a d h e s io n o f S ta p h y lo c o c c u s e p id e r m id is to h yd ro p h o b ic N H L B I re fe ren ce p o ly e th y le n e Journal o f Biomedical Materials Research V 27 p 1119-1128 1993
Weber W J and F A DiiGiano Process Dynamics in Environmental S ystem s John Wiley amp Sons Inc p 390 - 398 1996
William SK e t al F o rm a tio n o f a m u ltila y e r ce llu la r lin ing on a p o ly u r e th a n e v a s c u la r g r a f t f o l lo w in g en d o th e lia l ce ll s o d d in g Journal of B iom edical M aterials Research V 26 p 103-117 1992
Wolfson JS and DC Hooper eds Quinolone Antimicrobial A gents American Society for Microbiology Washington DC 1989
Yu Jian-Lin et al F ib ro n e c tin on the S urface o f B ilia ry D ra in M a te r ia ls - A R o le in B a c te r ia l A d h e r e n c e Journal of Surgical Research V 59 p 596-600 1995
APPENDICES
51
APPENDIX A
Growth Rate Experiments
52Growth Curves (500 ppm Glucose) Room Temperaturetime count cone (cellsml) average std dev Specific growth rate
0 28 159E+06 711E+06 687E+06 048046690552 295E+06
296 168E+071 40 227E+06 785E+06 408E+06
210 119E+07165 936E+06
2 28 159E+06 204E+06 766E+0525 142E+0655 312E+06
3 281 159E+07 138E+07 156E+06216 123E+07233 132E+07
45 98 556E+07 550E+07 212E+06
101 573E+0792 522E+07
6 177 100E+08 736E+07 206E+0789 505E+07
123 698E+077 290 165E+08 122E+08 318E+07
198 112E+08156 885E+07
8 56 318E+08 210E+08 820E+0721 119E+0834 193E+08
9 114 647E+08 522E+08 779E+0782 465E+0893 528E+0879 448E+08
10 141 800E+08 749E+08 930E+07109 619E+08146 828E+08
11 282 160E+09 115E+09 284E+08206 117E+09172 976E+08150 851 E+08
12 200 113E+09 110E+09 329E+07186 106E+09195 111E+09
13 76 216E+09 277E+09 107E+0975 213E+09
163 462E+0976 216E+09
14 127 360E+09 340E+09 356E+08102 289E+09130 369E+09
53
15 273 775E+09 817E+09 318E+08300 851 E+09291 826E+09
16 287 163E+10 155E+10 765E+08278 158E+10255 145E+10
17 295 167E+10 145E+10 191 E+09213 121E+10260 148E+10
18 313 178E+10 163E+10 120E+09- --------
261 148E+10 - -------- -------286 162E+10
54
time count Cone (cellsml) average std dev Specific growth rateO 20 113E+06 271 E+06 191 E+06 050174225
109 619E+0657 323E+0617 965E+0536 204E+06
123 121 687E+06 746E+06 767E+05
117 664E+06137 777E+06151 857E+06
456 160 908E+06 128E+07 351 E+06
309 175E+07210 119E+07
7 35 199E+0728 159E+0738 216E+07
89 78 443E+08 485E+08 268E+07
87 494E+0891 516E+0886 488E+08
101112 69 392E+08 400E+08 147E+07
73 414E+0867 380E+0873 414E+08
13 107 607E+08 649E+08 549E+07128 726E+08 --108 613E+08
14 64 182E+09 131E+09 292E+0840 113E+0939 111E+0942 119E+09
15 64 182E+09 182E+09 401 E+0766 187E+0964 182E+0962 176E+09
1617 121 343E+09 362E+09 142E+08
129 366E+09133 377E+09
18 364 207E+10 227E+10 146E+091
55411 233E+10424 241 E+10
19 375 213E+10 217E+10 350E+08390 221 E+10384 218E+10
20 98 556E+10 680E+10 179E+1080 454E+10
155 880E+10146 828E+10
56
time count Cone (cellsml) average std dev Specific growth rateO 23 522E+06 639E+06 114E+06 0443703052
27 613E+0637 840E+0630 681 E+0622 499E+0630 681 E+06
11 119 135E+10 119E+10 165E+09119 135E+1090 102E+1090 102E+10
12 45 102E+10 934E+09 231E+0926 590E+0932 726E+0938 863E+0954 123E+1052 118E+10
13 49 111E+10 126E+10 131E+0948 109E+1059 134E+1061 138E+1054 123E+1063 143E+10
14 135 306E+10 302E+10 250E+09128 291 E+10150 340E+10120 272E+10
15 167 379E+10 368E+10 166E+09168 381 E+10152 345E+10 J Z
16 239 542E+10 495E+10 619E+09201 456E+10250 567E+10183 415E+10
17 57 647E+10 726E+10 960E+0977 874E+1056 636E+1066 749E+10
18 86 976E+10 102E+11 804E+0982 931 E+10
101 115E+11 -90 102E+11
19 121 137E+11 121 E+11 182E+10124 141 E+11
57
92 104E+1189 101E+11
20 89 101E+11 107E+11 830E+0996 109E+11
105 119E+1186 976E+10
21 101 115E+11 124E+11 104E+10122 138E+11114 129E+11100 113E+11
22 67 760E+10 111E+11 216E+10115 131E+1197 110E+11
112 127E+11
58
time count Cone (cellsmi) average std dev Specific growth rate averageO 25 142E+06 127E+06 434E+05 0443600055 0467378
22 125E+0632 182E+06 std dev
9 511E+05 00248917 965E+0529 165E+06
12 62 281 E+07 421 E+07 779E+0693 422E+0786 390E+07
116 527E+07108 490E+0791 413E+07
14 33 150E+08 156E+08 339E+0737 168E+0826 118E+0833 150E+0828 127E+0849 222E+08
155 39 177E+08 239E+08 810E+0731 141E+0888 399E+0854 245E+0851 232E+0853 241 E+08
175 61 277E+08 261 E+08 657E+0745 204E+0851 232E+0849 222E+08 - - Z
88 399E+0851 232E+08
225 136 309E+10 274E+10 247E+09114 259E+10112 254E+10
59
APPENDIX B
FASTEETHreg SUSCEPTIBILITY
6 0
time 01g260E+04
005280E+04 240E+04
Glucose Abs0008
640E+04 140E+05 170E+04 0016370E+05 770E+05 220E+04 0033
125 198E+06 310E+06 220E+05 0071145 890E+06 194E+06 330E+05 0146245 160E+08 200E+08 160E+07 0266
110E+08 180E+08 160E+07 100 0405275 170E+08 170E+08 190E+07 200 0408
time 0 05g 0025g217E+04 330E+04 110E+05
Fasteeth MIC Study I518E+05 760E+05 230E+05
125 194E+06 185E+06 410E+05314E+06 147E+06 816E+05
165 660E+06 100E+07 178E+06195 192E+07 880E+06 242E+06225 430E+07 140E+07 180E+07255 119E+09 292E+07 130E+07
time 157E-02
200E+08
150E+08
I 100E+08U
500E+07
000E+00
7 X
V
I I
01g
005
C ~
233E+04 133E+0510 15 20 25 30time (hours)
194E+06 566E+06880E+06 746E+06226E+07 120E+07125E+08 120E+08133E+08 703E+08
time Control 450E-02121E+05 152E+05140E+05 264E+06197E+06 246E+06
185 362E+06 919E+06457E+06 211E+07461E+07 234E+08
IhU 200E+07
100E+07
000E+00
250E+08
200E+08
150E+08
1 00E+08
500E+07
OOOE+OO
I
I
Z1
Control
450E-02
500E+07
400E+07
300E+07
F a s te e th MIC Il
I
y -
Jlt3
0 05g
0025g
C
10 15 20 25timefhrs)
Fasteeth MIC III
157E-02
C
time (hrs)
APP ENDlX C
Hoechst 33342
me control s1 S2 S3O 162E+05 149E+05 118E+05 139E+05
195 477E+06 443E+07 317E+07 883E+04OOOE+OO
O 134E+04 159E+04 280E+04 194E+0414 210E+06 520E+05 380E+05 945E+0416 228E+06 313E+06 604E+06 294E+0519 763E+06 980E+06 169E+07 207E+0523 263E+07 133E+08 883E+07 967E+04
5ugml10ugmlSOugml
Hoechst 33342 MIC no wash
-control
-5ugml
-10ugml -50ugml
time (hrs)
time control s1 S2 S3O 162E+05 149E+05 118E+05 139E+05
195 477E+06 443E+07 317E+07 883E+04OOOE+OO
O 134E+04 159E+04 280E+04 194E+0414 210E+06 520E+05 380E+05 945E+0416 228E+06 313E+06 604E+06 294E+0519 763E+06 980E+06 169E+07 207E+0523 263E+07 133E+08 883E+07 967E+04
5ugmllOugml50ugml
Hoechst 33342 MIC no wash
control -5ugml bull10ugml 50ugml
time control A B3 129E+05 129E+05 139E+05
15 104E+06 100E+05 169E+0616 645E+06 227E+05 122E+062022
423E+06 113E+05 254E+06106E+07 160E+06 158E+07
24 707E+07 109E+07 175E+07
Hoescht MIC - incubate in stain for 3 hrs then wash
800E+07700E+07600E+07500E+07400E+07300E+07200E+07100E+07OOOE+OO
MIC w wash
DLO
800E+07
600E+07
400E+07
200E+07
000E+00
- controlbullA
-B
O 10 20 30
time(hrs)
200E+07180E+07160E+07140E+07120E+07100E+07800E+06600E+06400E+06200E+06000E+00
65
APPENDIX D
C iprofloxacin
66
Ciprofloxacin MIC study Plate countstime count (1ugml) cfuml average std dev count (1 ugml) cfuml
0 96 960E+04 962E+04 530E+03 21 210E+0496 960E+04 28 280E+04
105 105E+05 22 220E+0410 100E+059 900E+049 900E+04
155 67 670E+04 865E+04 266E+04 3 300E+0385 850E+04 2 200E+0377 770E+04 2 200E+03
5 500E+0411 110E+0513 130E+05
17 76 760E+04 687E+04 220E+04 20 200E+0465 650E+04 27 270E+0441 410E+04 20 200E+0411 110E+055 500E+047 700E+04
20 31 310E+04 230E+04 128E+04 13 130E+0433 330E+04 0 000E+00
5 500E+03 0 000E+0022 0 ND 0
0 00 0
24 0 ND 00 00 0
time 1 ugml std dev 01 ugml std dev control std dev0 720E+04 345E+04 566E+04 263E+04 593E+04 170E+03
155 584E+04 452E+04 510E+06 168E+06 903E+06 419E+0517 532E+04 283E+04 380E+06 221E+06 153E+07 963E+0520 137E+04 137E+04 670E+06 381 E+06 963E+07 741 E+0622 0 0 254E+07 587E+06 377E+07 450E+0624 0 0 920E+06 440E+06 377E+07 450E+06
67
average std dev count (01 ugml) cfuml average std dev count (01 ugml)237E+04 309E+03 75 750E+04 783E+04 340E+03 20
83 830E+04 2077 770E+04 14
8 800E+048 800E+046 600E+04
233E+03 471 E+02 66 660E+06 3677 770E+06 3056 560E+06 41
223E+04 330E+03 56 560E+06 587E+06 602E+05 15153 530E+06 17167 670E+06 155
17 13
14433E+03 613E+03 TNTC 119
TNTC 53TNTC 29
215 215E+07 232E+07 362E+06 253189 189E+07 256247 247E+07 235
19 190E+07 2127 270E+07 2828 280E+07 42
Bad plate 60Bad plate 110Bad plate 17
5- - 7
68
cfum average std dev count (control) cfuml average std dev200E+04 180E+04 283E+03 61 610E+04 593E+04 170E+03200E+04 60 600E+04140E+04 57 570E+04
360E+06 357E+06 450E+05 96 960E+06 903E+06 419E+05300E+06 89 890E+06410E+06 86 860E+06
151E+06 153E+06 148E+05 166 166E+07 153E+07 963E+05171E+06 150 150E+07155E+06 143 143E+07170E+06130E+06140E+06119E+07 670E+06 381 E+06 86 860E+07 670E+07 300E+07530E+06 103 103E+08290E+06 100 100E+08253E+07 276E+07 680E+06 34 340E+07 X256E+07 35 350E+07235E+07 44 440E+07210E+07280E+07420E+07600E+06 920E+06 440E+06 34 340E+07 377E+07 450E+06110E+07 35 350E+07170E+07 44 440E+07500E+06700E+06
I
I
69
APPENDIX F
Flow Cell Experiments Image Analysis
70
IMAGE ANALYSIS
Images of the polymers were taken using a CCD camera They were then analyzed
using Image Pro Plus The analysis of each image was automatically saved as an Excel
file generating 48 Excel sheets per experiment Since a hard copy of this information
would be too bulking to include in the Appendices a disk with all of the data will be kept
with a copy of this thesis at the Chemical Engineering Department and at the Center for
Biofilm Engineering
The spreadsheet are labeled with the time at which the image was taken die field of
view (eg A b c etc) parameters measured (eg Area ave dia width length) For
every field of view taken two spreadsheets were generated One consisted of the
parameters measured and the other gave the dimensions of the field of view (length x
width)
At the beginning of each experiment an image of a micrometer was taken in order to
calibrate all of the measurements for the experiment Cell numbers were calculated by
summing the area values of one field of view and dividing by 075 for a high end value or
50 for a low end value These values were than averaged to get the average values and
standard deviations The above values were obtained from B ergey rsquos Manual o f
Determinative Microbiology which gave the width of P aeruginosa at 05-1Ojim and
the length as 15-50pm This method for calculating cell numbers was found to be
accurate as actual cell numbers could be counted for the early time points They fell within
the range calculated by the above method
The files are listed as
Control
Triglyme
71
Ciprotriglyme
BMA
CiproBMA
The graphs found in the thesis text were made from the above files and then
converted into data which was easier to handle The files from which the graphs were
made are
Endpoint
Curves
APPENDIX F
Flow Cell Experiments Total CountsAO
cell
con
e(o
ellm
iEffluent counts over a 24
hour time period - Comparison
150E+09
000E+00
mdash- Control
Triglyme bull Ciprotriglyme
- BMA -bull- ciproBMA
CU
den
sity
(ce
lls
mm
A2)
100E+07
100E+06
100E+05
100E+04
100E+03
100E+02
100E+01
H ControlHTrigIyme^CiprotriglymeHBMAHciproBMA
Polymers100E+00
cell
con
e (
cell
sm
l)Effluent data t=0-8 Total counts
140E+09
120E+09
100E+09
800E+08
600E+08
400E+08
200E+08
000E+00
mdash Control Triglyme
-Ciprotriglyme - x~ BMA -^c ip roB M A
time (hrs)
76Control AO countstime (in) cell count cellsml average std Dev
0 100 454E+08 491 E+08 134E+0874 336E+08
110 499E+08101 458E+08172 781 E+0882 372E+08
125 567E+08165 749E+08132 599E+08108 490E+0860 272E+08
113 513E+0897 440E+0893 422E+0890 409E+08
2 107 486E+08 730E+08 152E+08167 758E+08154 699E+08111 504E+08167 758E+08196 890E+08204 926E+08
180 817E+084 113 513E+08 678E+08 171E+08
108 490E+08172 781 E+08
82 372E+08125 567E+08132 599E+08165 749E+08167 758E+08204 926E+08180 817E+08196 890E+08
6 0 0 0 00000
77
area (mmA2)72578 714E+02 441 E+016550376102
Polymercount cone
33 150E+08 201 E+08 660E+0750 227E+0841 186E+0847 213E+08
455 103E+08430 976E+07450 102E+08
62 281 E+0854 245E+0859 268E+0848 218E+0865 295E+0851 232E+08
density845E+06 277E+06
78
time (out) cell count cellsml average std Dev time (out) average std Dev0 65 295E+08 373E+08 780E+07 0 373E+08 780E+07
74 336E+08 2 303E+08 123E+08111 504E+08 4 209E+08 800E+0777 350E+08 6 262E+08 698E+07
109 495E+08 8 162E+08 088 399E+08 16 159E+07 116E+0653 241 E+08 18 232E+07 089 404E+08 20 304E+07 901E+0673 331 E+08 21 407E+07 082 372E+08 24 714E+07 213E+07
2 101 458E+08 303E+08 123E+08103 468E+08 Control101 458E+0830 136 E+08 0 491 E+08 134E+0835 159E+08 2 730E+08 152E+0844 200E+08 4 678E+08 171 E+0860 272E+08 6 0 068 309E+08 8 0 058 263E+08 16 0 0
4 30 136E+08 209E+08 800E+07 18 0 035 159E+08 20 0 028 127E+08 21 0 044 200E+08 24 0 019 863E+0744 200E+0869 313E+0872 327E+08 time in-out66 300E+08 0 000E+0054 245E+08 2 000E+00
6 39 177E+08 262E+08 698E+07 4 -262E+0860 272E+08 6 226E+0856 254E+08 8 162E+0867 304E+08 16 159E+0738 173E+08 18 232E+07
46 209E+08 20 304E+0744 200E+08 21 407E+0772 327E+08 24 714E+0788 399E+0867 304E+08
16 62 141E+07 159E+07 116E+0669 157E+0766 150E+0776 173E+0769 157E+0770 159E+0773 166E+07
79
ff l 184E+0768 154E+0767 152E+07
20 161 365E+07 304E+07 901 E+06158 359E+07196 445E+0798 222E+0791 207E+07
100 227E+0724 206 468E+07 714E+07 213E+07
121 275E+07219 497E+07217 493E+07360 817E+07270 613E+07420 953E+07280 636E+07430 976E+07390 885E+07320 726E+07360 817E+07430 976E+07380 863E+07
80
Triglyme AO countstime (in) count cellsml average std Dev
0 77 350E+08 517E+08 224E+0883 377E+0878 354E+0867 304E+0888 399E+08
115 522E+0896 436E+0888 399E+0883 377E+08
195 885E+08208 944E+08188 853E+08
2 99 449E+08 765E+08 251 E+08120 545E+08102 463E+08130 590E+08138 626E+08136 617E+08133 604E+08232 105E+09265 120E+09260 118E+09197 894E+08190 863E+08190 863E+08
4 238 108E+09 708E+08 307E+08225 102E+09215 976E+08100 454E+0864 291 E+0899 449E+08
124 563E+0898 445E+08
194 881 E+08188 853E+08151 685E+08176 799E+08
6 0 0 0 00 00 00 00 00 00 0
81
Polymercount cone
35 794E+07 353E+07 341 E+0741 931 E+0737 840E+0734 772E+0736 817E+0744 200E+0734 154E+0725 113E+0729 132E+0732 145E+0712 545E+0627 123E+0719 863E+0615 681 E+0614 636E+06
density117E+06 113E+06
area94558 907E+02 544E+019458883024
82
time (out) average std Dev time in-out0 676E+08 970E+07 0 500E+082 463E+08 118E+08 2 302E+084 477E+08 294E+08 4 231 E+086 550E+08 262E+08 6 550E+088 349E+07 302E+07 8 349E+07
16 284E+07 0 16 284E+0718 268E+07 238E+07 18 268E+0720 241 E+07 0 20 241 E+0721 228E+07 116E+07 21 228E+0724 223E+07 196E+07 24 223E+07
triglyme
time (in)0 517E+08 224E+082 765E+08 251 E+084 708E+08 307E+086 0 08 0 0
16 0 018 0 020 0 021 0 024 0 0
83
time (out) count cellsml average std Dev0 130 590E+08 678E+08 970E+07
136 617E+08157 713E+08150 681 E+08123 558E+08148 672E+08128 581 E+08140 636E+08172 781 E+08152 690E+08205 931 E+08152 690E+08
2 150 681 E+08 463E+08 118E+0867 304E+08
101 458E+08100 454E+0863 286E+0896 436E+0899 449E+08
100 454E+08110 499E+0871 322E+08
130 590E+08136 617E+08157 713E+08150 681 E+08
4 28 127E+08 477E+08 294E+0818 817E+0738 173E+0823 104E+0826 11ampE+08
127 577E+08134 608E+08115 522E+08128 581 E+08150 681 E+08120 545E+08205 931 E+08145 658E+08215 976E+08
6 47 213E+08 550E+08 262E+0849 222E+0849 222E+0859 268E+0858 263E+08
164 744E+08
84
219 994E+08180 817E+08175 794E+08191 867E+08127 577E+08134 608E+08115 522E+08128 581 E+08
8 16 726E+07 349E+07 302E+0710 454E+0718 817E+0720 908E+0716 726E+072 908E+064 182E+074 182E+075 227E+074 182E+07
18 9 204E+07 268E+07 238E+071 227E+067 159E+070 000E+000 000E+00
99 449E+07142 645E+07128 581 E+07108 490E+07165 749E+0727 123E+0730 136E+0733 150E+0737 168E+0730 136E+07
21 8 182E+07 228E+07 116E+0720 454E+0710 227E+0712 272E+0719 431E+0727 123E+0730 136E+0733 150E+0737 168E+0730 136E+07
24 25 113E+07 223E+07 196E+0711 499E+0622 999E+0623 104E+0716 726E+06
85
19 863E+0626 118E+0723 104E+0725 113E+0718 817E+0614 318E+0722 499E+0727 613E+0716 363E+0727 613E+07
Cel
l con
e (
cells
ml)
Acridine Orange effluent counts t= 8-24hours
180E+08 160E+08 140E+08 120E+08 100E+08 800E+07 600E+07 400E+07 200E+07 000E+00
8 12 16 20 24
mdash diamsmdash Control
- Ciprotriglyme - -x- -B MA - X - ciproBMA
time (hours)
87
Ciprotriglyme AO countstime (in) count cellsml average std Dev
0 110 499E+08 932E+08 329E+08106 481 E+08115 522E+08144 654E+08141 640E+08157 143E+09113 103E+09119 108E+09103 935E+08105 953E+08147 133E+09136 123E+09 bull146 133E+09
2 115 104E+09 985E+08 202E+08105 953E+08102 926E+0898 890E+08
129 117E+09132 120E+09140 127E+09121 110E+09128 116E+09150 681 E+08184 835E+08131 595E+08
4 213 967E+08 954E+08 481 E+08242 110E+09
13 590E+07251 114E+09132 599E+08168 153E+09
13 118E+0844 399E+08
154 140E+09190 173E+09115 104E+09132 120E+09132 120E+0998 890E+08
6 0 0
88
Polymercount cone
84 953E+06 701 E+06 441 E+0650 567E+0655 624E+0642 477E+0667 760E+06
140 159E+0799 112E+0796 109E+0797 110E+07
107 121E+079 204E+068 182E+06
10 227E+0610 227E+068 182E+06
area94352 941E+02 276E+019064997397
density 223E+05 141 E+05
89
time (out) average std Dev0 754E+08 210E+082 919E+08 207E+084 942E+08 388E+086 292E+08 273E+088 128E+07 216E+06
16 705E+06 bull 018 561 E+06 406E+0620 947E+06 021 114E+07 573E+0624 184E+07 774E+06
Ciprotriglyme
time (in)0 932E+08 329E+082 985E+08 202E+084 954E+08 481 E+086 0 08 0 0
16 0 018 0 020 0 021 0 024 0 0
90
time (out) count cellsml average std Dev0 120 545E+08 754E+08 210E+08
130 590E+08153 695E+08156 708E+0852 472E+0851 463E+0889 808E+08
118 107E+0981 735E+08
111 101E+0996 872E+08
119 108E+092 92 835E+08 919E+08 207E+08
78 708E+0869 626E+0883 754E+0890 817E+08
103 935E+08135 123E+09143 130E+09134 122E+09117 106E+09191 867E+08167 758E+08Ig 844E+08
4 186 844E+08 942E+08 388E+08241 109E+09289 131E+09243 110E+09159 144E+09177 161E+0931 281 E+0820 182E+08
102 926E+08103 935E+0880 726E+0899 899E+0899 899E+08
6 92 835E+08 292E+08 273E+0865 590E+0882 744E+0865 590E+0854 490E+08
21 191 E+0826 236E+0817 154E+08
91
25 227E+0820 182E+08
133 302E+07113 256E+0793 211E+07
114 259E+07134 304E+07
8 68 154E+07 128E+07 216E+0652 118E+0744 999E+0675 170E+0748 109E+0757 129E+0766 150E+0750 113E+0752 118E+0751 116E+07
18 44 999E+06 561 E+06 406E+0657 129E+0734 772E+0637 840E+0635 794E+06
8 182E+066 136E+065 113E+068 182E+06
13 295E+0621 71 161E+07 114E+07 573E+06
94 213E+0779 179E+0777 175E+0729 658E+0631 704E+0628 636E+0625 567E+0630 681 E+0661 138E+0761 138E+0752 118E+0764 145E+07
3 681E+0524 35 794E+06 184E+07 774E+06
45 102E+0756 127E+0738 863E+06
53 120E+07182 207E+07205 233E+07
92
235 267E+07240 272E+07220 250E+0771 806E+06
200 227E+07195 221E+07265 301 E+07
93BMA total counts Acric ine Orange BMAtime(in) count cone (cellsml) average std dev time (in) ave std dev
0 134 122E+09 826E+08 249E+08 0 826E+08 249E+08146 133E+09 2 610E+08 276E+08130 118E+09 4 731 E+08 382E+0869 626E+08 6 0 069 626E+0891 826E+0872 654E+08 time (out)66 599E+08 0 853E+08 155E+0872 654E+08 2 612E+08 177E+0883 754E+08 4 456E+08 282E+0878 708E+08 6 288E+08 208E+0882 744E+08 8 137E+07 934E+06
2 12 109E+08 610E+08 276E+08 16 445E+07 049 445E+08 18 523E+07 175E+0738 345E+08 20 720E+07 062 563E+08 21 818E+07 379E+0760 545E+08 24 853E+07 340E+07
115 104E+09109 990E+08122 111E+0964 581 E+0876 690E+0849 445E+0852 472E+0866 599E+08
4 73 663E+08 731 E+08 382E+0881 735E+0898 890E+0870 636E+0873 663E+08
131 119E+09115 104E+09141 128E+09147 133E+0929 263E+0829 263E+0838 345E+0821 191E+08
6 00000000
94
0
Polymercount cone
125 567E+07 895E+07 418E+07140 636E+07100 454E+07115 522E+07137 622E+07139 631 E+07150 681 E+07270 123E+08380 173E+08360 163E+08 density250 113E+08 298E+06 139E+06200 908E+07
area87061 901 E+02 21217235669140691703
95
time(out) count cone (cellsml) average std devC 82 754E+0E 853E+08 155E+08
7E 708E+0E86 781 E+0893 844E+0881 735E+0882 744E+0877 699E+0892 835E+08
121 110E+09116 105E+09125 113E+09
2 92 835E+08 612E+08 177E+0876 690E+08
109 990E+0892 835E+0860 545E+0855 499E+0863 572E+0872 654E+0847 427E+0843 390E+0844 399E+0867 608E+0856 508E+08
4 47 427E+08 456E+08 282E+0852 472E+0859 536E+0860 545E+0836 327E+0897 881 E+0830 272E+0850 454E+08
115 104E+09104 944E+08
19 173E+0814 127E+0828 254E+0822 200E+0821 191 E+08
6 16 145E+08 288E+08 201 E+0815 136E+0813 118E+0821 191 E+0816 145E+0855 499E+0840 363E+0845 409E+08
96
85 772E+0873 663E+0820 182E+0820 182E+0820 182E+0820 182E+0817 154E+08
8 6 136E+07 137E+07 934E+060 000E+005 113E+074 908E+061 227E+06
27 245E+0728 254E+0726 236E+07
18 77 699E+07 523E+07 175E+0773 663E+0783 754E+0773 663E+0772 654E+0768 617E+0717 386E+0719 431 E+0715 340E+0712 272E+0712 272E+07
21 310 704E+07 818E+07 379E+07300 681 E+07140 318E+07230 522E+07210 477E+07285 129E+08290 132E+08340 154E+08 - -
250 113E+08123 558E+07136 617E+07144 654E+07
24 107 486E+07 853E+07 340E+07108 490E+07112 508E+07270 123E+08250 113E+08320 145E+08260 118E+08148 672E+07153 695E+07150 681 E+07
97
ciproBMA AO counts
time (in) count cone average std dev0 74 672E+08 673E+08 19E+08
100 908E+0880 726E+08
112 102E+0956 508E+0869 626E+08
108 981 E+0871 645E+0886 781 E+0876 69E+0838 345E+0852 472E+0856 508E+0860 545E+08
2 44 399E+08 897E+08 61 E+0851 463E+0825 227E+0832 291 E+0841 372E+08
103 935E+0893 844E+0899 899E+08
219 199E+09192 174E+09188 171E+09
4 92 835E+08 726E+08 178E+0878 708E+08
102 926E+0897 881 E+08
102 926E+0884 763E+0886 781 E+0879 717E+08
106 962E+0856 508E+0848 436E+0854 49E+0856 508E+08
_
i
98
Polymercount cone
139 316E+07 541 E+07 463E+07114 259E+07125 284E+07134 304E+07280 127E+08290 132E+08250 113E+08
79 179E+0773 166E+0779 179E+07
area88181 870E+02 125E+018760685282
density187E+06 160E+06
99
time (in) ave std devO 673E+08 190E+082 897E+08 610E+084 726E+08 128E+086 0 0
time (out)0 700E+08 146E+082 652E+08 311E+084 524E+08 227E+086 350E+08 127E+088 545E+06 286E+06
16 101E+07 018 113E+07 430E+0620 281 E+07 0
21 365E+07 201 E+0724 682E+07 510E+07
100
time (out) count cone average std dev0 71 645E+08 7E+08 146E+08
71 645E+0876 69E+0899 899E+08
103 935E+0884 763E+0891 826E+0865 59E+0860 545E+0851 463E+08
2 30 272E+08 652E+08 311 E+0842 381 E+0824 218E+0831 281 E+0823 209E+08
130 118E+0966 599E+0866 599E+0890 817E+0897 881 E+0867 608E+0888 799E+08
113 103E+09104 944E+08107 971 E+08
4 83 754E+08 524E+08 227E+0872 654E+0884 763E+0890 817E+0866 599E+0857 518E+0889 808E+0867 608E+0830 272E+0820 182E+0834 309E+0828 254E+08
mdash30 272E+08
6 39 354E+08 35E+08 123E+0846 418E+0854 49E+0859 536E+0852 472E+0818 163E+08
101
30 272E+0825 227E+0835 318E+0848 436E+0852 472E+0840 363E+0828 254E+0814 127E+08
8 17 386E+06 545E+06 286E+0611 250E+0612 272E+0623 104E+07
9 409E+0616 726E+0620 908E+06
8 363E+0618 35 159E+07 113E+07 430E+06
37 168E+0736 163E+0734 772E+0627 613E+0639 885E+0654 123E+0728 636E+06
21 300 681 E+07 365E+07 201 E+07275 624E+07300 681 E+07255 579E+07275 624E+07
85 193E+0767 152E+0779 179E+0770 159E+0793 211 E+0770 318E+0761 277E+0750 227E+0748 218E+0778 354E+07
24 42 191 E+07 682E+07 510E+0757 259E+0770 318E+0767 304E+0749 222E+07
270 123E+08305 138E+08385 175E+08270 123E+08
102
74 336E+07124 563E+0775 340E+07
165 749E+07
103
APPENDIX G
Flow Cell Experiments Viable CountsPlate Counts
104
Plate counts were conducted by placing ten 10 microliter drops of properly diluted
effluent and influent on plate count agar plates and incubating overnight at room
temperature before counting Several serial dilutions were made for each sample to ensure
that countable plates 3 to 300 colonies were obtained Only viable cells would develop
into colonies on the plates therefore the counts performed in this manner are classified as
viable counts or plate counts
105
Control Plate counttime (in) count cone (cellsml) average std dev
0 159 159E+07 936E+06 628E+06193 193E+07188 188E+0768 680E+0664 640E+0658 580E+0632 320E+0648 480E+0632 320E+06
2 298 298E+07 374E+07 852E+06289 289E+07329 329E+07
54 540E+0739 390E+0740 400E+07
4 79 790E+06 330E+07 328E+07111 111E+0798 980E+0692 920E+0786 860E+0723 230E+0721 210E+0713 130E+07
6 0
time (in) ave cone std dev time (out) ave cone std dev0 936E+06 628E+06 0 249E+06 222E+062 374E+07 852E+06 2 993E+06 293E+064 330E+07 328E+07 4 208E+07 922E+066 0 0 6 111E+07 0
8 147E+07 016 113E+05 235E+0418 281E+05 020 449E+05 417E+0521 371 E+05 024 138E+05 109E+05
Polymer | 130E+06
106
area average std dev72578 7139433333 44072296550376102
density537E+04 548E+04 3474333595E+04512E+04
107
time(out) count cone (cellsml) average std dev0 49 490E+06 249E+06 222E+06
50 500E+0667 670E+06
7 700E+056 600E+05
9 900E+0517 170E+068 800E+05
11 110E+062 125 125E+07 993E+06 293E+06
122 122E+07119 119E+07
9 900E+0610 100E+074 400E+06
4 30 300E+07 208E+07 922E+0633 330E+0731 310E+07
104 104E+0794 940E+06
106 106E+0721 210E+0721 210E+0713 130E+07
6 no data
16 71 710E+04 113E+05 235E+04105 105E+05120 120E+05
15 150E+0511 110E+0512 120E+05
20 24 240E+04 449E+05 417E+0526 260E+0453 530E+0477 770E+0589 890E+0593 930E+05
24 17 170E+05 138E+05 109E+0526 260E+05
I 29 290E+05
108
26 260E+0459 590E+0420 200E+04
Polymer 10 100E+06 130E+06 551 E+0513 130E+0613 130E+0658 580E+0556 560E+05
119 119E+06 -
171 171E+06161 161 E+06244 244E+06
109
triglyme Plate countstime (in) count cone (cellsml) average std dev
0 167 167E+08 108E+08 700E+07184 184E+08182 182E+0831 310E+0737 370E+0747 470E+07
2 86 bull 860E+07 522E+07 334E+0778 780E+0774 740E+07
120 120E+07112 112E+07
4 159 159E+08 562E+07 489E+07116 116E+08145 145E+07244 244E+07224 224E+07
42 420E+0732 320E+0739 390E+07
6 000
time (in) ave cone std dev0 108E+08 700E+072 522E+07 334E+074 562E+07 489E+076 0 0
lt Z
Polymer density782E+06 441 E+06 248E+05
248E+05area Average 283E+05
94558 90723333339458883024
time (out) average std dev
no
O 882E+07 714E+072 336E+07 125E+074 821E+07 139E+076 214E+07 439E+078 223E+06 125E+05
16 326E+06 018 352E+06 246E+0620 773E+06 021 984E+06 105E+0724 299E+06 101 E+06
Polymer 50 500E+06 782E+0661 610E+0662 620E+06
108 108E+0747 470E+0615 150E+0716 160E+0713 130E+07
331 331 E+06281 281 E+06301 301 E+06
97 970E+0660 600E+06
I l l
time (out) count cone (cellsml) average std dev0 167 167E+08 882E+07 714E+07
136 136E+08173 173E+08176 176E+07186 186E+07168 168E+07
2 51 510E+07 336E+07 125E+0747 470E+0746 460E+0740 400E+0752 520E+0734 340E+07
177 177E+07188 188E+07213 213E+07
24 240E+0725 250E+0726 260E+07
4 77 770E+07 821 E+07 139E+0797 970E+07
104 104E+0860 600E+0767 670E+0791 910E+0778 780E+0783 830E+07
6 48 480E+06 214E+07 439E+07-34 340E+06 r
35 350E+0630 300E+06
ave 28 280E+06260E+05 34 340E+06
stddev 129 129E+081626657 8 22 220E+06 223E+06 125E+05
24 240E+0621 210E+06
18 153 153E+06 352E+06 246E+06225 225E+06198 198E+06
112
22 220E+0615 150E+0616 160E+0662 620E+0660 600E+0684 840E+06
21 179 179 E+06 984E+06 105E+07275 275E+06247 247E+0622 220E+07
3 300E+0627 270E+07
441 E+06 24 254 254E+06 299E+06 101 E+06240 240E+06264 264E+06
30 300E+0637 370E+0658 580E+0620 200E+0631 310E+0616 160E+06
279 279E+06338 338E+06297 297E+06
113
ciprotriglyme Plate countstime (in) count cone (cfuml) average std dev time (out)
0 15 150E+08 654E+08 307E+08 013 130E+0843 430E+0889 890E+0887 870E+0882 820E+0884 840E+0884 840E+0892 920E+08
2 96 960E+08 103E+09 48E+0881 810E+08
116 116E+09164 164E+09169 169E+09 2184 184E+0954 540E+0897 970E+08
128 128E+093 300E+085 500E+087 700E+08
4 55 550E+08 918E+08 363E+0831 310E+0890 900E+0814 140E+0910 100E+09 44 400E+08
90 900E+0899 990E+08
115 115E+09100 100E+0980 800E+08
162 162E+096 0 0
6
time (Out) average std dev0 506E+06 553E+062 121E+09 944E+084 192E+08 166E+086 121E+08 112E+08 I8 140E+06 116E+06
16 900E+05 0 I18 774E+05 980E+05 I
20 120E+06 0 |21 141E+06 110E+06 i
114
24 1642+06 1902+06 8
density773698491 7761707346 2284489805303975749509738
18area
94352 9412+02 2762+019064997397
21
Polymercount cone (cfuml) average std dev
23 2302+03 2432+03 9982+0236 3602+0330 3002+03
2 2002+034 4002+033 3002+032 2002+031 1002+031 1002+03
24
115
count cone (cfuml) average std dev23 2302+04 5062+06 5532+0621 2102+0420 2002+04
114 1142+07103 1032+07120 1202+07
10 1002+0713 1302+079 9002+060 0002+000 0002+000 0002+000 0002+00
87 8702+08 1212+09 9442+0892 9202+08
190 1902+09102 1022+0975 7502+0896 9602+0872 7202+0891 9102+08
167 1672+096 6002+082 2002+08
40 4002+0957 5702+08 1922+08 1662+0825 2502+0836 3602+08
128 1282+0893 9302+07
168 1682+0856 5602+0748 4802+0755 5502+0748 4802+07 1212+08 1132+0851 5102+0790 9002+07
149 1492+08180 1802+08162 1622+08261 260E+0812 i 1202+0839 3902+0870 7002+0539 3902+0565 6502+05
116
3 300E+05 140E+06 116E+0615 150E+0645 450E+0689 890E+05
127 127E+06127 127E+0610 100E+0614 140E+065 500E+058 800E+05 774E+05 918E+05
19 190E+0629 290E+06
199 199E+05225 225E+05213 213E+0523 230E+0525 250E+0525 250E+0536 360E+05 141 E+06 110E+0692 920E+0594 940E+0553 530E+0582 820E+0567 670E+05
8 800E+058 800E+05
10 100E+06169 169E+06142 142E+0624 240E+0645 450E+0629 290E+0625 250E+04 164E+06 190E+0629 290E+0452 520E+046 600E+048 800E+041 100E+04
139 139E+0610 100E+0638 380E+0662 620E+0632 320E+0621 210E+0634 340E+06
117
BMA Plate counts
time (in) count cone (cfuml) average std devO 53 530E+07 974E+07 377E+07
59 590E+0759 590E+0784 840E+07
123 123E+08139 - 139E+08
9 900E+0717 170E+0810 100E+08
2 23 230E+07 357E+07 441 E+0723 230E+0720 200E+07
165 165E+0838 380E+0673 730E+06
231 231 E+0724 240E+0739 390E+0729 290E+07
4 17 170E+07 171 E+07 575E+0619 190E+0711 110E+07
220 220E+07213 213E+07228 228E+07
21 210E+0716 160E+0726 260E+07
6 600E+0612 120E+0711 110E+07
6 0 0
118
time(out) average std dev0 499E+07 154E+072 413E+07 179E+074 577E+07 526E+076 129E+07 496E+068 149E+06 912E+05
16 428E+06 018 498E+06 414E+0620 635E+06 021 704E+06 394E+0624 106E+07 225E+06
=
119
Polymercount cone average std dev
27 270E+06 117E+07 13381334127 127E+0732 320E+0743 430E+0739 390E+0640 400E+0636 360E+06 density41 41 OEf 06 404E+05 391 E+0559 590E+06 385E+0554 540E+06 384E+05
area average std dev87061 900566667 21217235669140691703
120
time (out) count cone (cfuml) average std dev0 40 400E+07 499E+07 154E+07
35 350E+0750 500E+0781 810E+0770 700E+0757 570E+07
408 408E+07386 386E+07367 367E+07
2 37 370E+07 413E+07 179E+0725 250E+0736 360E+0765 650E+0777 770E+0734 340E+0725 250E+0731 310E+07
4 46 460E+07 577E+07 526E+0733 330E+0732 320E+07
158 158E+0892 920E+07
130 130E+0813 130E+079 900E+066 600E+06
6 92 920E+06 129E+07 496E+0672 720E+0688 880E+06
9 900E+067 700E+067 700E+06 - -
169 169E+07192 192E+07191 191E+0720 200E+0714 140E+0724 240E+07
101 101E+07119 119E+07149 149E+07
10 100E+0712 120E+07
11 110E+078 46 460E+05 149E+06 912E+05
13 bull130E+05|
121
13 130E+05191 191E+06217 217E+06244 244E+06
18 180E+0624 240E+0620 200E+06
18 46 460E+06 498E+06 414E+0654 540E+0646 460E+06
3 300E+064 400E+06
18 180E+0738 380E+0655 550E+0652 520E+0622 220E+0613 130E+0622 220E+06
21 26 260E+06 704E+06 394E+0631 310E+0644 440E+06
3 300E+063 300E+063 300E+06
93 930E+0699 990E+06
106 106E+0716 160E+07
8 800E+067 700E+06
62 620E+0671 710E+0675 750E+06
8 800E+0615 150E+07
3 300E+0624 90 900E+06 106E+07 225E+06
89 890E+0690 900E+0613 130E+0713 130E+0711 110E+07
111 111E+0797 970E+0E
107 107E+07V 140E+077
i 5 130E+07
122
15 150E+0787 870E+0680 800E+06
124 124E+077 700E+06
10 100E+078 800E+06
123ciproBMA Plate countstime (in) count cone (cfuml) average std devO 80 800E+07 490E+07 212E+07
64 640E+0777 770E+0742 420E+0755 550E+0753 530E+0726 260E+0723 230E+0721 210E+07
2 31 310E+07 592E+07 235E+0731 310E+0743 430E+0759 590E+0764 640E+07
114 114E+0867 670E+0764 640E+0760 600E+07
4 75 750E+07 572E+07 206E+0770 700E+0786 860E+0742 420E+0738 380E+0732 320E+07
6 000
II
1 2 4
time(out) average std dev0 444E+07 154E+072 478E+07 203E+074 404E+07 198E+076 236E+07 125E+078 185E+05 104E+05
16 284E+06 018 328E+06 557E+0620 374E+06 021 386E+06 528E+0624 210E+06 580E+05
PolymerPlates were all blank for every dilution
11
~
125
15time (out) count cone (cfuml) average std dev
0 31 310E+07 427E+07 153E+0728 280E+0737 370E+0749 490E+0749 490E+0749 490E+0779 790E+0733 330E+07
2 29 290E+07 478E+07 203E+0725 250E+0717 170E+0767 670E+0781 810E+0768 680E+0745 450E+0748 480E+0750 500E+07
4 52 520E+07 404E+07 198E+0750 500E+0756 560E+0755 550E+0772 720E+07
147 147E+07143 143E+0728 280E+0722 220E+07
6 24 240E+07 236E+07 125E+0749 490E+07
138 138E+07126 126E+07150 150E+07
12 120E+0716 160E+0713 130E+0742 420E+0734 340E+0728 280E+07
8 11 110E+05 185E+05 104E+0524 240E+0532 320E+0580 800E+04
117 117E+0591 910E+0434 340E+05
18 56 560E+04 328E+06 557E+0660 600E+04
126
57 570E+046 600E+044 400E+049 900E+04
82 820E+0581 810E+0585 850E+0515 150E+0611 110E+067 700E+05
152 152E+07137 137E+07142 142E+07
21 183 183E+07 386E+06 528E+06111 111E+07126 126E+07186 186E+06159 159E+06148 148E+06
10 100E+0616 160E+0615 150E+0666 660E+0584 840E+0561 610E+0522 220E+0610 100E+0615 150E+06
24 22 220E+06 210E+06 580E+0524 240E+06
131 131E+06167 167E+06141 141E+0620 200E+06 - -
28 280E+0630 300E+06
127
APPENDIX H
M athematical Theory
128
M ATHEM ATICAL THEORY
Kwok (1997) used Basmadjian and Sefton to determine that the drug concentration
immediately next to the polymer in a tube was
CZCNkill rD ) = A [ (xr0)ReSc]13 where (xroReSc)lt104-103
Cs - surface concentration (|igcm5)
Nkill - minimum killing release rate (|Jgcm2s)
R0 - effective hydraulic radius (cm)D - diffusivity of ciprofloxacin in fluid (cnfs)A - constant for geometry x - axial distance from the entrance (cm)
Re - Reynoldrsquos number Sc - Schmidt number
Laminar flow with constant velocity v was used estimate Nkill as 57 x 10J pgcnrs
using the equation above
The ciprofloxacin impregnated polymers were assumed to behave as if dissolution
into a falling film was occurring allowing Pickrsquos second law of diffusion to be modified as
follows
Pickrsquos second law of diffusion
MciZMt = Dip M2CiZMx2
does not adequately model the controlled-release of ciprofloxacin as it does not take into
consideration the fluid flow over the polymer and results in a t12 release rate A better
129
equation would be
vz(x) McMz = Dip M2CiZMx2
where fluid flow is assumed to be occur in the z direction and diffusion is assumed to be in
the x direction The following boundary conditions should be sufficient for the situation
encountered in the flow cell over the first 24 hours
I) O gt Il O at N Il O
2) O gt Il O at y mdash co
3) O gtIl O pound at
OIlThe solution therefore is
CaZCao = erfc [yZ(4DzZvmax)]
130
APPENDIX I
Polymer Surface Area Measurements
131
POLYMER Date of experiment Surface area (mnV)Control 6997 72578
62897 6550372697 76102
Triglyme 8897 9455881097 9458882297 83026
Ciprotriglyme 81697 9064982497 9739782997 94352
BMA 83197 870619797 9140692197 91703
CiproBMA 9597 8818191497 8760691997 85282
MONTANA STATE UNIVERSITY LIBRARIES
3 1762 10302039 O
1
i

TABLE OF CONTENTS
Page
INTRODUCTION I
LITERATURE REVIEW 3
Background and Significance3Processes Governing Biofilm Formation 4Surface Modification 6
Modifications Host Cell Adhesion6Modifications Bacterial Cell Adhesion 7
Controlled Release 8Controlled Release Systems9
Ciprofloxacin14
MATERIALS AND METHODS 16
Bacteria and CulturesSolutions
MediumCytological StainsCiprofloxacin
Reactors and Flow Cell SystemsContinuously-stirred Tank Reactor (CSTR)Flow Cell
Microscope Setup and TechniquesPolymer Analylsis
Susceptibility and Adhesion Effect StudiesCiprofloxacinHoechst Stain (33342)FasteetliRHoecsht Stain Effects on P aeruginosa Adhesion
TubingBiomaterial Fabrication t
BP Control Polym erTest Polym ers
161616171718 18 18 21 21 242425 252526 26 26 27
RESULTS AND DISCUSSION 28
Pseudomonas aeruginosa Growth Experiments28Batch Studies28
Flow Cell Experimental Protocol 29Flow Cell Experiments 29
Ciprofloxacin release41
TABLE OF CONTENTS
SUMMARY 43
BIBLIOGRAPHY 45
APPENDICES 50
APPENDIX A - Growth Rate Experiments 51APPENDIX B - FasteethregSusceptibility59APPENDIX C - Hoechst 33342 61APPENDIX D - Ciprofloxacin 65APPENDIX E - Flow Cell Experiments Image Analysis69
Image Analysis 70APPENDIX F - Flow Cell Experiments Total CountsAO 72APPENDIX G - Flow Cell Experiments Viable CountsPlate Counts 103APPENDIX H - Mathematical Theory 127
Mathematical Theory128APPENDIX I - Polymer Surface Area Measurements130
Page
LIST OF TABLES
1 Parameters used for sizing of biologic reactor18
2 Flow channel dimensions and hydraulic parameters 20
3 Specific growth rate for P aeruginosa grown at room temperature with 500 ppmglucose fully aerated 28
4 Summary of Hoechst 33342 studies28
5 Description of polymers used in flow cell experiments 30
6 Ciprofloxacin concentrations in effluent 42
Table Page
vii
LIST OF FIGURES
Figure Page
1 Biofiltn formation 5
2 Zero-order first-order and square-root of time release patterns fromcontrolled-release devices 10
3 CSTR setup used to grow P aeruginosa continuously 19
4 Flow cell schematic 20
5 Experimental setup 22
6 BiospaiVConlrol time course of cell adhesion31
7 ControlBiospan polymer bacterial colonization 32
8 Comparison of the extent of colonization of different polymers at 1=24 hours33
9 Direct counts of cell density on the polymer surface after 24 hours34
10 Time course cell colonization curve of control lriglyme ciprolriglymeobtained from image analysis 35
11 Attachment rate differences are evident within the first 6 hours of theflow cell experiments 36
12 Total counts made with Acridine Orange 37
13 Calculated cell density on the ldquolestrdquo polymers using total cell count(acridine orange) data38
14 Plate count data from effluent samples taken from the polymer flowcells during the course of the experiments shows that viable cells are going throughthe flow cell39
15 Cell densities on polymers calculated from plate count data 40
16 Demonstrates the variations in bacterial density on the lriglyme polymerafter twenty four hours using image analysis (IA) acridine orange staining of the effluent and plate counts of the effluent 4f
vm
ABSTRACT
Millions of dollars are spent every year in the US on biomedical implants ranging from commonplace uses such as contact lenses to applications as rare as total artificial hearts One of the main stumbling blocks in the long term usage of these devices is bacterial infection which can only be rectified by the removal of the implant resulting in increased costs and trauma to the patient Consequently four different polymer formulations were studied for their efficacy at preventing bacterial colonization The polymer under investigation was placed in a parallel plate flow cell challenged with fluid containing Pseudomonas aeruginosa for six hours and then exposed to a fluid of nutrients only for the remainder of a twenty four hour run Two different sets
examined by image analysis One set consisted of latrix (BP) coated with triethylene glycol dimethyl
ether (triglyme) while the other set had an additional coating of poly(butyl methy aery late) polyBMA Each set also had one formulation to which a known amount of the antibiotic ciprofloxacintrade had been added The coatings of triglyme and triglyme+BMA cut bacterial colonization in half when compared to the control BP material Wliile the additional factor of the controlled release of ciprofloxacintrade from the materials resulted in more than a two fold reduction in bacterial colonization when compared to the control BP material These polymers therefore hold promise in decreasing the risk of infection encountered during the use of biomedical implants
of test polymers subjected to this protocol were a BioSpaiitrade polyletherurethane (PEU) base n
i
I
IN TR O D U C TIO N
The National Institutes of Health have defined a biomaterial ldquoas any substance
(other than a drug) or combination of substances synthetic or natural in origin which can
be used for any period of time as a whole or as a part of a system which treats augments
or replaces any tissue organ or function of the bodyrdquo Thus biomaterials will have an
impact on virtually everyone at some point in their life
Biomaterials may be used for long term applications such as central nervous
system shunts extended wear contact lenses or hemodialysis systems They may be
employed in short term applications like contact lenses needles for phlebotomy or
vaccination cardiopulmonary bypass systems or wound healing devices Or biomaterials
may be utilized in permanent implants such as heart valves periodental restorative devices
intraocular lenses or orthopedic devices(NIH Consens 1982)
AU biomedical implants are susceptible to bacterial colonization and subsequent
biofilm formation Biofilms are three dimensional gelatinous structures consisting of
adherent bacteria and insoluble polysaccharides secreted by the bacterial cells Bacteria use
the biomaterial as a substratum to which they attach and adhere resulting in a biomaterial
centered infection Biofilm infections are extremely difficult to eradicate The biofilm gel
matrix cannot only keep the host defense mechanisms from reaching andor recognizing the
adherent bacteria but biofilms can also lower the efficacy of antibiotics Usually the only
way to deal with a device-centered infection is to remove the infected implant which is
costly as well as traumatic to the patient Therefore it is desirable to develop a material that
wiU inhibit bacterial colonization
The objective of the research presented in this thesis was to ascertain the
effectiveness of four different formulations of a biomedical grade polyurethane Biospantrade
at inhibiting bacterial colonization under flow conditions The scope of this work
2
included (I) evaluation of four Biospantradepolyethylene glycol (PEG) matrix biomaterials
two of which contained the antibiotic ciprofloxacin (2) development of a flow cell system
to evaluate the potential for bacterial adhesion and biofilm formation and (3) development
of a novel staining technique to allow for the visualization of bacteria against an opaque
surface without interfering with normal cell behavior
3
LITERA TU RE REVIEW
Background and Significance
Biomaterials have been used in the human body since the early 1900s when bone
plates were introduced to stabilize fractures and speed healing By the 1950s
experimentation into the replacement of blood vessels had begun and by the 1960s
artificial hip joints and heart valves were under development As science and engineering
has advanced so has the clinical use of biomaterials(Blanchard 1996 NIH Consens
1982)
Biomedical implants are no longer used just in life-threatening situations They are
now utilized in every major body system for three general purposes (I) to preserve life or
limb (2) to restore or improve function and (3) to restore or improve shape The first
category includes most neurosurgical and cardiovascular implants such as pacemakers
and hydrocephalus shunts Dental implants and joint replacements are included in the
second category while biomaterials used in reconstructive surgeries are placed in the last
class(NIH Consens 1982)
Estimates in 1982 placed biomaterial implant use in the United States for that year at
several million The demand for biomaterials is said to grow by 5 to 15 percent a year and
will only increase as the population ages and the expectations of maintaining a good quality
of life increase What was a multi-million dollar per year industry in the US now exceeds
$10 billion a year This figure is especially remarkable given that the US only represents
about 10 percent of world demand (Blanchard 1996 NIH Consens 1982 Brictannica
Online 1997)
One of the major risks encountered in the extended use of implants is the
susceptibility of biomaterials to bacterial attachment and adhesion resulting in biomaterial-
4
centered infections The three most common bacterial species implicated in these infections
are Pseudomonas aeruginosa Staphylococcus epidermidis and Staphylococcus aureus
Esherichia coli Proteus mirabilis and beta hemolytic Streptococcus spp have also been
isolated from contaminated implants (Gristina 1987 Gristina 1994)
Once bacteria begin adhering to implant material they can form a biofilm that is
extremely difficult to eradicate The biofilm can not only prevent the host defense
mechanisms from reaching andor recognizing the bacteria but it can also lower the
efficacy of antibiotics Usually the only way to deal with biofilm infections is by removal
of the implant which can be costly as well as traumatic to the patient (Blanchard 1996
Gristina 1987 Gristina et al 1993) Tlierefore it is desirable to develop a biomaterial
that will inhibit bacterial colonization
There are two common approaches to preventing bacterial colonization The first is
to modify the substratumrsquos surface chemistry rendering it non-adhesive and the second is
to design a material which will slowly release an antibacterial agent killing the bacteria
before they reach the surface (Bryers 1997)
Processes G overning Biofilm Form ation
The establishment of a biofilm (figure I) involves many steps (I) preshy
conditioning of the surface by adsorption of organic molecules (eg protein) from the fluid
phase (2) cell transport to the substratum (3) cell adsorptiondesorption (4) permanent
adhesion to the surface (5) cellular metabolism (growth replication death) and (6)
biofilm removal (detachment and sloughing) Pre-conditioning involves coating the
surface with host- derived proteins such as fibronectin human serum albumin and
platelets (Tebbs Sawyer and Elliot 1994 Carballo Ferreiros and Criado 1991 and
Yu et al 1995) Cell transport to the surface may occur through passive processes such
5
as diffusion or fluid flow or active processes such as flagellar movement Reversible
adsorption (adsorptiondesorption) of cells to the substratum can be explained in terms of
the laws of colloid chemistry such as the Derjaguin-Landau and Verwey-Overbeek
Figure I Biofilm formation (I) pre-conditioning (2) cell transport to surface (3) cell adsorptiondesorption (4) permanent adhesion (5) proliferation and (6) removal
(DLVO) theory Electrostatic forces and London-van der Waals forces combine to bring
particles andor cells to a surface by helping to overcome energy barriers allowing the cells
to form a loose attachment with the substratum (Eginton 1995 Characklis and Marshall
1990 Weber and DiGiano 1996) Within a certain distance of the substratum permanent
adhesion becomes possible through such mechanisms as specific binding to proteins in the
conditioning film or hydrogen bonding Once at the surface colonization can begin Cells
begin to produce exopolysaccharides (EPS) literally gluing themselves to the surface
6
Within this EPS matrix the cells continue to grow divide and die Occasionally chunks
of the biofilm will detach as a result of either shear forces or weaken of the bonds holding
them to the substratum (Characklis 1990)
Surface M odification
Eveiy natural and synthetic surface has unique physical and chemical properties that
can influence cellular adhesion By modifying the biomaterial surface the fundamental
processes governing biofilm formation can be altered Several review articles discuss these
processes in detail (Cristina et al 1994 Cristina Naylor and Myrvik 1992 Bryers
1988 Characklis 1990 Dankeit Hogt and Feijen 1986) and acknowledge the similarities
between bacterial colonization and tissue integration In many situations host cells are
actually competing with bacteria to colonize the biomaterial surface Thus many surface
modifications are aimed at intentionally promoting natural tissue adhesion while others are
directed at preventing bacterial adhesion
M odifications Host Cell A dhesion
Techniques focused on promoting tissue integration range from endothelial cell
sodding to glow plasma discharge modification (Williams et al 1992 Massia and
Hubbell 1991) The coating of silicone rubber membranes with poly (2-hydroxy ethyl
methacrylate) (poly HEMA) by glow plasma discharge has shown encouraging results in
vitro with regard to the attachment and growth of corneal epithelial cells bringing the
development of an artificial cornea one step closer to reality (Lee et at 1996)
7
Hydroxylapatite (HA) coatings of bone implants have already proven effective at promoting
faster and greater bone adaptation and improving implant fixation Better techniques of
applying the calcium phosphate to the implant are being examined including plasma spray
heat-treated plasma spray and magnetron-sputter (Hulshoff et al 1996) Carbon
deposition excimer laser ablation and photochemical coatings are being examined as ways
of promoting and controlling endothelial cell proliferation (Kaibara et al 1996 Doi
Nakayama and Matsuda 1996) Surface modifications may also decrease the binding of
host proteins such as thrombin and anti thrombin III thereby lowering the potential to form
blood clots which can promote bacterial adhesion A common method of accomplishing
this is by immobilizing heparin on the surface (Byun Jacobs and Kim 1996 Paulsson
Gouda Larm and Ljungh 1994 Lindhout et al 1995)
M odifications Bacterial Cell A dhesion
Methods for inhibiting bacterial colonization range from antithrombogenic coatings
to the incorporation of antimicrobial substances such as silver or quaternary amine salts (
Wang Anderson and Marchant 1993 Ryu et al 1994 Jansen and Kohnen 1995)
Heparin is only one of the substances used to coat surfaces which have been shown to
decrease bacterial adhesion due to protein-mediated adhesion Poly(vinyl pyrrolidone)
(PVP) coatings which inhibit the adsorption of fibrinogen to the surface have also exhibited
decreased bacterial adhesion (Francois et al 1996) Reductions in bacterial adhesion to
silastic catheters coated with salicylic acid a nonsteroidal anti-inflammatory drug have
been demonstrated in vitro (Farber and Wolff 1993) Coatings of hydrophilic polymers
such as polyethylene glycol (PEG) have shown potential for inhibiting implant-related
infections (Portoles Refojo and Leong 1994) Latex catheters coated with
8
glycomethacrylate gel another hydrophilic polymer have also demonstrated the ability to
reduce infection The reduction was enhanced by the incorporation cephalothin an
antibiotic (Lazarus et al 1971) The elution of an antimicrobial from the implant is one
of the most popular and oldest methods of dealing with biomaterial-centered infections
illustrated by the use of antibiotic impregnated bone cement (Strachan 1995 Seyral et al
1994) As already seen however the incorporation of antibiotics and other antimicrobials
has also been studied with regard to various polymer systems (Rushton et al 1989
Ackart et al 1975 Golomb and Shplgelman 1991 Greenfeld et al 1995) As
knowledge about the immune system increases so does the potential for developing new
substances that can coat biomaterials or be released from them to provide protection against
bacterial colonization as witnessed by development of passive local immunotherapy
(Gristina 1997)
Controlled Release
Controlled release of antibiotics at the site of implantation is one of the more
common approaches to preventing infection and is being used successfully in orthopedic
surgery A recent US survey showed that 27 of responding hospitals commonly use
antibiotic impregnated bone cement for joint replacement surgery (Strachan 1995)
However the use of bone cement is not recommended in younger active people
Consequently the controlled release of antibiotics from coated implants is under
investigation (Price et al 1995) Thus it can be seen that there are several different types
of controlled release systems
9
Controlled Release System s
Controlled release devices are classified by the method that controls the release of
the substance of concern The most common classifications are diffusion controlled
systems chemical reaction systems and solvent activated systems There are several
excellent books and articles that cover this subject in depth (Langer and Wise 1984 Kost
and Langer 1984 Fan and Singh 1989 Baker 1987 Lohmann 1995 Kydonieus 1992
Robinson and Lee 1987) so only a brief overview will be given here
Controlled release systems can be designed to produce release rate profiles that
enhance the efficacy of the desired agent This is in contrast to sustained release devices
which allow the substance of concern to be effective longer but are dependent on
environmental factors when it comes to the amount and the rate of release
The three most common release profiles achieved by controlled release devices are
(I) zero-order release (2) first-order release and (3) t 12 release shown graphically in
figure 2 Zero-order release is the most desired release rate and is most easily obtained
by using diffusion controlled release systems (Kost and Langer 1984 Lohmann 1995)_
D iffusion Controlled D ev ices There are two general types of diffusion
controlled systems (I) matrix or monolithic and (2) reservoir The rate limiting step in
both systems is the diffusion of the drug through the polymer matrix which may be
described by (l)F ickrsquos first law of diffusion and (2) Pickrsquos second law of diffusion also
called the diffusion equation (Bird Stewart and Lightfooi 1960) For a one dimensional
system they may be written as
10
Release rate kinetic
^ first-order release
square-root of time release
zero-order release
Figure 2 Zero-order first-order and square-root of time release patterns from contolled-release devices
( 1 ) Ji = - D ip raquo d c d x
(2) bCjbt = Djp trcb2
Ji - mass flux of solute (drug) i
Ci - concentration of solute i
x - position of release
t - time
Djp - solute diffusion coefficient through the polymer
11
Equation (I) is commonly used to simulate the release rates from reservoir devices
The diffusion coefficient is a measure of the mobility of the individual solute molecules
through the reservoir membrane and is considered concentration independent The
concentration gradient in the membrane is represented by dCdx The negative sign reflects
the movement of solute down the concentration gradient toward more dilute regions If the
membrane is saturated with solute a burst effect may be seen which causes an initial spike
of solute A lag effect occurs when the solute must first permeate the membrane before it is
released (Baker 1987 Langer and Peppas 1981)
Equation (2) is obtained by combining equation (I) with the continuity equation for
mass transfer assuming no reaction and zero velocity Equation (2) describes transient
diffusion in membranes The diffusion coefficient is considered to be concentration
dependent It results in the square root of time release rate for simple geometries such as a
one-dimensional slab (Baker 1987 Langer and Peppas 1981) Detailed discussions on
the applications assumptions and solutions of both these equations can be found in the
literature (Langer and Wise 1984 Kost and Langer 1984 Fan and Singh 1989 Baker
1987 Lohmann 1995 Kydonieus 1992 Robinson and Lee 1987 Langer and Peppas
1981)
Monolithic devices are made by mixing the substance of concern with the polymeric
material to form a solution from which the finished product is manufactured The drug to
be released may be dissolved or dispersed (supersaturated) in the resulting polymer
depending on how much is ldquoloadedrdquo into the carrier polymer Examples of monolithic
devices include flea collars and antibiotic loaded bone cement
Examples of reservoir systems include nitroglycerin skin patches Norplanttrade a
subcutaneous birth control device and Ocusertrx1 a contact lens like device used to neat
glaucoma In these types of systems the substance of interest is surrounded by an inert
12
membrane which may be either porous or non-porous If the membrane is porous the
drug simply diffuses through the pores but if the membrane is non-porous the drug must
first dissolve in the membrane structure before it can diffuse along and between the
segments of the membrane Reservoir systems are known for the ease with which they can
be designed to achieve zero-order release rates
Both monolithic and reservoir diffusion controlled systems are rate limited by the
diffusion of the drug through the polymer Tlie choice of polymer and the resulting effect
on the diffusion and partition coefficient of the substance of concern as well as the
geometry of the device will influence drug release rates (Kost and Langer 1984 Lohmann
1995)
Chem ically Controlled S ystem s When the substance of concern is encased
in a biodegradable non-diffusive polymer the resulting reservoir device is classified as a
chemical reaction system As seen in the diffusion controlled devices there are two basic
types of biodegradable devices (I) reservoir and (2) monolithic The release rates of these
systems are strongly influenced by the erosion of the polymer In the ideal case surface
erosion would be the only factor affecting the release rate however this system has yet to
be designed (Kost and Langer 1984 Lohmann 1995)
A second category of chemical reaction controlled release is chemical
immobilization In this type of system the substance of concern may be chemically bound
to the polymer carrier backbone or it may he part of the backbone The release rate is then
influenced by the enzymatic or hydrolytic cleavage of the appropriate bonds (Kost and
Langer 1984 Lohmann 1995)
13
Solvent Activated S y s te m s The last class of controlled release devices to
be mentioned here are the solvent controlled systems These fall into two categories (I)
swelling controlled and (2) osmotically regulated In both types the substance of concern
is either dissolved or dispersed within the polymer but it is unable to diffuse through the
polymer matrix until activated In the case of the swelling controlled system the solvent is
absorbed by the matrix causing the polymer to swell and allowing the active agent to
diffuse out In the osmotic system the solvent permeates the polymer-drug system due to
osmotic pressure which promotes release Release may occur by either simple Fickian
diffusion or by non-Fickian diffusion Detailed analysis of these and other controlled
release systems can be found in the references cited previously
A dvantages Controlled release systems offers several advantages over
conventional drug delivery systems The major advantage when dealing with biomaterial
centered infections is increased efficacy of the drug The drug can be administered at the
biomaterial site thereby allowing the therapeutic levels to be maintained locally while
decreasing the systemic drug level This will minimize side effects and improve
pharmokinetics In addition the effective drug level can be sustained for an extended
period of time (Kost and Danger 1984 Lohmann 1995)
The use in joint replacement surgery of antibiotic impregnated bone cement
combined with a polymer coating such as poly-L-lactic acid polymer (PLLA) has proven
popular for its ability to prevent infections as well as aid in joint fixation (Strachan 1995)
Controlled release of antibiotics from biomaterials is less common however in operations
involving other types of implants Nonetheless research in being done into this method of
inhibiting bacterial colonization A British study showed that antibiotic impregnated
silicone rubber coatings of implanted stimulator devices significantly decreased
14
postoperative infection when compared with systemic antibiotic prophylaxis (Rushton e t
al 1989) One of the newer antibiotics receiving attention as a treatment for biomaterial-
centered infections is ciprofloxacin
C iprofloxacin
Ciprofloxacin is a Iluorinated quinolone antimicrobial agent It is active against a
broad range of bacteria ranging from aerobic gram-negative bacteria to aerobic gramshy
positive bacteria Anaerobic bacteria however are not affected by ciprofloxacin It was
approved by the Food and Drug Administration in October 1987 (Wolfson and Hooper
1989 cponline 1997)
Like other quinolone agents ciprofloxacin is a synthetic antimicrobial which mainly
effects DNA gyrase the bacterial topoisomerase II The gyrase is a two subunit enzyme
responsible for regulating the supercoiling of DNA during replication and transcription
The A subunit of the gyrase introduces nicks in the DNA that allow the B subunit to twist
the single stranded DNA (ssDNA) around its complementary strand of DNA The A
subunit of the gyrase then seals the nicks It is believed that ciprofloxacin and the other
quinolones interfere with the A subunit preventing it from sealing the nicks Bactericidal
levels of quinolones do not affect mammalian topoisomerase enzymes The exact bacterial
killing mechanism is not known but detailed discussions about the mechanisms of
quinolones action can be found in WolfSon and Hooper (1989) It is known that both slow
growing and fast growing organisms are inhibited by ciprofloxacin and that a prolonged
post-antibiotic effect is exhibited by fluoroquinolones (Wolfson and Hooper 1989
cponline 1997 Craig and Ebert 1991 Cam pa Bendinelli and Friedman 1993)
15
Ciprofloxacin has the lowest minimum inhibitory concentration (MIC) of the
quinolones The MIC90 for P aeruginosa in vitro is between 025 (igml and I jigml
Thus ninety percent of the P aeruginosa strains will be inhibited at these low
concentrations (Craig and Ebert 1991 Campa Bendinelli and Friedman 1993) Due to
its wide antimicrobial range and low MIC ciprofloxacin was chosen as a model antibiotic
for incorporation into the test PEU polymers
16
MATERIALS AND METHODS
Bacteria and Cultures
Pseudomonas aeruginosa (ERC-I) was obtained from the National Science
Foundation Engineering Research Center for Biofilm Engineering Montana State
University Bozeman MT Cultures of P aeruginosa were stored as frozen stocks
maintained in a solution of 2 peptone and 20 glycerol at -70degC
Solutions
M edium
A minimal salts medium with glucose as the sole carbon source was used for
culturing bacteria A one liter solution consisted of 05g glucose 256g Na2HPO4 208 g
KH2PO 4 IOg NH4Cl Olg CaCl2 05g MgSO4 and 002ml of a trace metals solution
The trace metal solution was composed of 05 CuSO4-SH2O 05 ZnSO4-VH2O 05
FeSO4-VH2O and 02 MnCl2-4H20 all in a weight per volume ratio dissolved in 10
concentrated HCl (Manual of Industrial Microbiology and Biotechnology 1986) The trace
metals solution was autoclaved separately from the nutrient medium as was a 5M CaCl2
solution and a 2SM MgSO4 solution The glucose trace metals CaCl2 and MgSO4 were
all added to the sterile medium by injection through a septum after the medium had been
brought to room temperature All solutions were filler sterilized through a 02 |im sterile
syringe tip filter (Coming) before addition to the medium AU solutions were made using
Nanopure water (Bamstead ultrapure water system Nanopure system) and autoclaved in
glass containers at 121degC for 15 minutes per liter
17
CvtologicaI Stains
A 005 solution of Acridine Orange used for epifluorescent total cell counts was
filter sterilized using an autoclaved filter apparatus Hoechst 33342 (Sigma) was obtained
in IOOmg quantities and stored in a O0C freezer until a fresh solution was needed Then
IOml of sterile nanopure water were added through a 02 jam sterile syringe tip filter to
dissolve the powder Once the Hoechst solution was made it was kept in the refrigerator
All stains were stored in light sensitive bottles and made at fresh at least once a month
C iprofloxacin
Ciprofloxacin hydrochloride was obtained from Miles Inc as 867 fag
ciprofloxacinmg A 10000 fagml stock solution was made by dissolving 1153 mg of
powder in 10 ml of sterile nanopure water Tlte stock solution was stored in a light
sensitive glass container in the refrigerator for up to one year as per the supplierrsquos
recommendations
D etection A Milton Roy Spectronic 1201 spectrophotometer was used to
determine the proper wavelength for detecting ciprofloxacin Effluent samples were
collected from the flow cell filtered through a 02 (am sterile syringe tip filter (Corning)
and stored in amber microcentrifuge tubes kept in a 0degC freezer until analysis A Milton
Roy Spectronic 601 set at 339 nm was used to determine the concentration of ciprofloxacin
in the effluent from the flow cell_
18
Reactors and Flow Cell Systems
Continuouslvrstirred Tank Reactor (CSTR)
A CSTR was designed to provide a constant supply of Pseudomonas aeruginosa
at room temperature (230+3degC) in exponential growth A 125 ml filter flask was equipped
with an inlet outlet aerator and injection port to build the CSTR The arm of the filter
flask was situated so that overflow occurred when a volume of 128 ml was reached
Table I lists the parameters used for sizing the CSTR At steady-state operation tire
specific growth rate p is assumed to be equivalent to the dilution rate D Figure 3
shows a schematic of the chemostat setup The outlet lube from CSTR was connected to a
Specific growth rate (|_t) 0467+ 0025 hr1 (Appendix A)Volume (V) 128 mlVolumetric flow rate (Q) 10 mlminTable I Parameters used for sizing of biologic reactor
waste jug unless cells were needed for an experiment in which case the CSTR was
connected to a collection vessel A fresh clean sterile collection flask was used for every
experiment The setup was dismantled cleaned and sterilized at least once every two
weeks
Flow C ell
A schematic of the flow cell used to evaluate the test materials can be seen in figure
4 The polymer sample (P) was placed on a clear polycarbonate base which had entrance
and exit stainless steel portals milled into it A white FDA vinylnitrile rubber (D) gasket
19
Collectionvessel
CSTR
Figure 3 CSTR setup used to grow P aeruginosa continuously
was used to equalize sealing pressure around the polymer sample as the assembly was
screwed together A thin gauge natural latex rubber (C) gasket was clamped between the
test sample and coverglass (B) to form the flow channel The coverglass was glued over a
hole in the clear polycarbonate cover using the denture adhesive Fasteethreg Table 2
lists the dimensions of the flow channel and various hydrodynamic parameters AU of
the materials used in the flow cell were sterilized by dipping the components in 70 ethyl
20
Figure 4 Flow cell schematic (A) clear polycarbonate cover with hole through center for viewing (B) 2 glass coverslip (C) thin gauge natural latex gasket (D) white FDA vinylnitrile rubber sealing gasket (E) clear polycarbonate base (P) test
polymer
alcohol rinsing with sterile nanopure water and exposing to UV light for at least 15
minutes The test polymers were not exposed to UV The How cell was assembled
under a laminar flow hood to ensure sterility
Table 2 Flow channel dimensions and hydraulic parameters
width (w) 16 mmlength (I) 44 mmdepth (d) 08 mmarea (A) 128 mmwetted perimeter (P) 336 mmhydraulic radius (Rh) 04 mmReynolds number (Rp) 2 1entrance length (Lp) 01 mmwall shear stress (Jfl) 203 dynecnri
21
Microscope Setup and Techniques
Polym er A nalysis
The polymer samples were tested for bacterial adhesion and growth using an image
analysis system seen in figure 5 For the first six hours of the experiment approximately
5 x IO8 cellsml of stained Pseudomonas aeruginosa were flowed over the test polymer at
a rate of 10 mlmin For the remainder of the experiment complete medium without
bacteria was pumped through the flow cell
Hoechst 33342 Staining Procedure P aeruginosa in log growth were
collected and stained with lOpgml of Hoechst 33342 Once the stain was added to the
cells the flask containing the mixture was wrapped in foil and put on an insulated stir plate
for three hours After three hours the suspension was poured into a sterile centrifuge bottle
and centrifuged at 10000 xg for 15 minutes in a 20degC centrifuge (Sorvall Instruments
Dupont model RC5C GSA rotor) The liquid was then poured off and the cells were
resuspended in sterile complete medium minus the glucose The cells were washed twice
more before placing them in a sterile 125 ml Erienmeyer flask with a stir bar at a
concentration of approximately 5 x 10s cellsml This procedure was repeated every two
hours until the flow cell feed was switched to complete medium only at hour six
Cell V isualization At t=0 the flow cell was place on the stage of an
Olympus BH-2 Epi-Illumination UV upright microscope equipped with Olympus filter
combinations encompassing the ultra-violet violet blue and green regions of the
spectrum A 40x Nikon water immersion objective was used since the flow channel was
22
greater than 0100 mm in depth A minimum of three fields was captured by an Optronics
OPDEI-470OT cooled color CCD camera The resulting image was processed by a Targa
64+ analog digital converter (ADC) card and stored on computer until the image could be
analyzed using Image Pro Plustrade Images were taken every two hours until t=6 hours
when the feed was switched from the cell suspension to sterile complete medium The
remaining four time points captured were (I) t=7 or 8 hours (2) t=16 or 18 hours (3)
t=20 or 21 hours and (4) t=24 hours
Waste
Figure 5 Experimental setup Feed container = cell suspension t=0-6 hrs after t=6 hrs feed = complete medium Flow rate through flow cell 10 mlmin
23
Cell density calculations Tlie software system Image Pro Plus was used to
determine the density of cells on the polymer surface At the beginning each experiment an
image of a micrometer was taken to allow for the calibration of cell size and image area
Actual cell counts could be obtained at the early time points Cell density calculations were
then simply a matter of dividing cell count by the viewing area At time points greater than
8 hours the area occupied by cells was used to give a range for the cellular density This
was accomplished by dividing the area covered by the high and low published values for P
aeruginosa cell area (Holt 1994) to calculate cell numbers This method proved to be valid
as the cells numbers obtained at the early time points fell within the high and low range of
cell numbers calculated using area covered
In addition samples from both the inlet and outlet of the flow cell were collected for
total cell counts and viable cell counts Total counts and viable counts were also conducted
on a sample of the solution in which the polymer was placed at the end of the experiment
Before any sample was removed for these tests the polymer was sonicated for 30 seconds
to remove adherent bacteria This allowed for the calculation of cell density on the polymer
using total cell counts and viable cell counts
Total Cell C ounts A portion of each sample collected from the inlet outlet
and sonicated polymer solution was used to determine total cell counts One milliliter of
005 Acridine orange was combined with one milliliter of 2 glutaraldehyde and the
appropriate dilution of sample This solution was poured over a black polycarbonate
membrane (pore size 022 pm and 25 mm diameter Fisher Scientific) placed in a cell free
glass Millipore filter apparatus Suction was applied to trap the cells on the membrane
The membrane was mounted on a slide by putting a drop of oil (non-drying immersion oil
type FF) on a microscope slide placing the membrane cell side up on top of the oil drop
24
followed by a second drop of oil and covering with a glass cover slip The slide was
examined under fluorescent microscopy Bacteria were counted using an Reichert-Jung
Microstar IV model UV microscope with a mercury lamp and a Reicheit IOOx oil
immersion objective Total counts ( cellsgrid) were then converted to total cellsml using
the following conversion
total cells (cell count) (dilution) (conversion factor) ml ~ sample volume
where the conversion factor was 227 x 10
Viable Counts A part of the cell suspension sample was used to make serial
dilution for plating onto plate count agar (Difco Laboratories) plates A I(K) pl multipipetor
(Rainin epd 2) was used to dispense ten 10 pi drops of properly diluted cell suspension
onto a plate This procedure was performed in triplicate for each dilution plated Plates
were incubated at room temperature for 24 hours Drops that contained between 3 and 30
colonies were counted and converted to colony forming units (cfu)ml by taking into
account the dilution factor (Miles etal 1938)
Susceptibility and Adhesion Effect Studies
C iprofloxacin
Growth curves carried out in batch were used to determine the susceptibility of
increasing concentrations of ciprofloxacin on P aeruginosa These tests were not carried
out as most traditional MIC assays Studies here were performed as per the procedures of
25
Nodine and Siegler 1964 Lennette et al 1985 starting with a cell concentration of IO6
cellsml P aeruginosa was grown in separate batch cultures which contained various
concentrations of ciprofloxacin At time points ranging from t=0 to t=24 hours samples
were taken for viable counts
Hoechst Stain 1333421
Susceptibility studies were also conducted on Hoechst 33342 to ensure that the
stain did not interfere with normal cell growth The studies were conducted in the same
manner as the ciprofloxacin tests Concentrations of Hoechst stain examined ranged from
Ojagml (control) to 50|igml
Fasteethreg
Studies were also carried out to ensure that the denture adhesive Fasteethreg used
to glue the coverglass to the polycarbonate cover of the flow cell had no negative effect on
the growth of bacteria These studies were conducted in the same manner as those for
ciprofloxacin and the Hoechst stain
Hoechst Stain Effects on P a e r u g in o s a Adhesion
Tests were performed to determine whether the Hoechst stain interferes with the
normal adherence of the cells to a surface The flow cell was assembled without a polymer
sample and an untreated cell suspension was run through the cell for four hours Since the
base of the flow cell is a clear polycarbonate light microscopy could be used to monitor
cell adhesion using video recording Experiments were also carried out using stained cells
still in the staining liquid and stained cells that had been washed and resuspended in
ldquocleanrdquo medium
2 6
The possibility of ciprofloxacin and Hoechst interfering with each other was also
investigated Plate counts were used as in the susceptibility studies Microscope slides
were also made and any change in staining ability was noted
Tubing
All of the tubing used was FDA approved MasterFlex (Cole Palmer) for use with
either pharmaceuticals or food Tubing used included Pharmedreg size 1314 and 16
Norprenereg Food size 13 and 14 and Tygonreg Food size 14 Before each use it was
sterilized by autoclaving at 121degC for 15 minutes
Biom aterial Fabrication
BP Control Polym er
A poly (ether) urethane (Biospantrade) poly ethylene glycol (PEG) film (BP) was
prepared for use as a control The method of fabrication was as follows (I) 20 ml of
deionized water was used to dissolve 2 g of PEG (Polyscience) (2) the resulting solution
was lyophilized and the powder was sieved to obtain 90 pm or smaller particles (3) this
powder was mixed with a 24 Biospantrade solution (Polymer Technology Group Inc) (4)
the polymer solution was degassed transferred to a Teflon mold (Chemware) and
incubated at 60degC for one day and finally (5) the film was dried completely in a vacuum
chamber
27
Test Polym ers
The test polymers were manufactured by the same procedure except the
ciprofloxacin containing films also had an equal amount of ciprofloxacin added in step (I)
In addition the test polymers were coated with either triethylene glycol dimethyl ether
(triglyme) or tiiglyme plus n-butylmethacrylate (BMA) by glow discharge plasma
deposition (GDPD)
Note All test materials were fabricated at the University of Washington by Connie
Kwok
2 8
RESULTS AND DISCUSSION
Pseudomonas aerueinosa Growth Experiments
Batch S tud ies
Growth Rate Studies were conducted to determine the growth rate of P
aeruginosa under experimental conditions Table 3 (Appendix A) The specific growth
rate (I was found to be 0467 hr1
Experiment specific growth rate (h r1)I 04802 05023 04444 04436Average 0467plusmn0025Table 3 Specific growth rate for P a eru g in osa grown at room temperature with SOOppm
glucose fully aerated
Susceptibility S tu d ies In addition susceptibility studies were done on
ciprofloxacin Hoechst 33342 and Fas teethreg (Appendices BC and D) The
ciprofloxacin tests confirmed the published M IC90 of l(igml The Hoechst stain (33342)
were shown not to inhibit growth at 10 |_igml Table 4 summarizes the results of the
Hoechst 33342 susceptibility tests Results from the Fasteethreg susceptibility studies show
no negative effects on P a eru g in o sa
Hoechst 33342 concentration (pgml) Growth inhibited0 No5 No10 No50 YesTable 4 Summary of Hoechst 33342 studies
29
Flow Cell Experimental Protocol
The concentration of resuspended bacteria used to challenge the test polymers was
roughly 5 x IO8 cellsml The flow rate to the parallel plate flow cell was maintained at
approximately 10 mlmin for the duration of each experiment Samples were taken for
total counts and viable counts from both the system influent and the effluent at t = 0 2 4
and 6 hours for every experiment Only effluent samples were collected after t = 6 hours
Effluent samples were also used to determine if any ciprofloxacin eluted from the test
polymers containing the antibiotic All the experiments were earned out at room
temperature in the medium previously described
Flow Cell Experiments
The ability of a polymer to affect bacterial adherence and colonization was examined
in flow cell experiments run on four different formulations of a poly (ether) urethane (PEU)
base material The control material (BP) was a PEU base matrix (Biospantrade) containing
poly (ethylene glycol) (PEG) as a pore forming agent
The materials tested included (I) triglym e BP coated with triethylene glycol
dimethyl ether (triglyme) (2) ciprotriglym e BP made up of equal parts PEG and
ciprofloxacin coated with triglyme (3) BM A BP coated with a layer of n-
butylmethacrylate (BMA) underneath the triglyme coating and (4) ciproBM A BP made
up of equal parts PEG and ciprofloxacin coated with BMA followed by triglyme (Table
5) The triglyme coating was used to control the release rates of the model antibiotic
ciprofloxacin
30
Polym er FormulationBPControl BiospanlivV PEG (poly ethylene glycol)triglyme Triethylene glycol dimethyl ether coated BPciprotriglyme BP made with equal parts PEG and ciprofloxacin coated with triglymeBMA BP coated with n-butylmethacrylate followed by a coating of tryiglmeCiproBMA BP made with equal parts PEG and ciprofloxacin coated with BMA
followed by a coating of triglyme
Table 5 Description of polymers used in flow cell experiments
Three samples of each polymer were tested A good representation of the events at
the polymer surface is provided by image analysis (IA) as it is obtained from pictures of
the stained cells on the surface Figures 6 and 7 illustrate the attachment and growth of
P aeruginosa on the control polymer over the course of an experiment Figure 8
displays the differences in cell density on three different polymers after 24 hours in the
flow cell A significant decrease in bacterial adhesion and colonization was evident when
the test polymers were compared to the BP polymer at the end of the experiments and over
the entire run using pictures taken for TA (figures 6 7 and 8)
The graphs generated from the image analysis data (figures 9 10 and 11) were
obtained from a single run for each polymer Each experiment was however replicated
three times The error bars were obtained because at least three different fields of view
were taken for each time point from which the average cell density and the standard
deviation were calculated (Appendix E)
Figure 6 BiospanControl time course of cell adhesion
t=0 hours t=2 hours
t=4 hours t=6 hours
Figure 7 ControlBiospan polymer bacterial colonization
t=24 hours
Figure 8 Comparison of the extent of colonization of different polymers at t=24 hours
triglyme Cipro-triglyme
34
CNlt
EE
0)O
pound(AC0)O
100E+06
100E+05
100E+04
100E+03
100E+02
100E+01
100E+00 J -
I III bullbullbullbullbullbullbullbullbull Ce -
Control STrigIyme 0 ciproAriglyme S BMA S ciproBMA
Polymers
Figure 9 Dhiect counts of cell density on the polymer surface after 24 hours (L-R) Control triglyme ciprotriglyme BMA ciproBMA
Figure 9 clearly shows that the coatings of triglyme and BMA + triglyme reduce
bacterial colonization by at least half when compared to the BP control It can also be seen
from Figure 9 that the addition of ciprofloxacin to the polymer formulation decreases
bacterial colonization by at least two orders of magnitude Note that the y-axis on figure
9 is a logarithmic scale
35
60E+05
50E+05
40E+05
30E+05
20E+05
10E+05
OOE+OO I r
-10E+05
tim e (hrs
mdash Control
-laquo~-trigiyme
A ciprotriqlyme
FigurelO Time course cell colonization curve of control triglyme ciprotriglyme obtained from image analysis
Figure 10 shows that bacterial attachment and colonization to the control polymer is much
greater than to either the triglyme or ciprotriglyme polymer Analysis of the data in
Appendix E will show the same trend for BMA and ciproBMA At t = 6 hours the feed
was switched from a medium containing ~5 x IO8 cellsml with no glucose to a sterile feed
of complete medium plus 500 ppm glucose Therefore any increase in cell density can be
attributed to growth Slightly more growth can be seen on the triglyme than on the
ciprotriglyme over the course of the experiment however neither of these polymers
exhibits the growth found on the control polymer
36
Figure 11 reveals that bacteria are attaching to the triglyme and ciprotiiglmc
polymers but not to the same extent as to the BP control polymer The bacteria attach to
the control polymer at a rale ol 114 x IO4 ccllsmnrhr while the rates of attachment to the
triglyme and the ciprolriglymc are significantly lower 66 cel I smm 2Zhr and 537
C ellsZm m 2Zhr respectively While the attachment rate is greater on the ciprolriglymc than on
the triglyme The rale of growth is greater on the triglyme than on the ciprolriglymc It can
80E+04
70E+04
60E+04
E 50E+04
40E+04
30E+04
20E+04
10E+04
00E+00
-10E+04
time (hrs)
Control
triglyme
A ciprotriqlyme
Figure 11 Attachment rate differences are evident within the first 6 hours of the flow cell experiments The control polymer demonstrates a much more rapid attachment rate than either triglyme or ciprotriglyme
be seen from figure 10 that the control polymer exhibits an exponential rale of growth
from 1=16-24 hours that is significantly higher than either triglyme or ciprolryglmc Whal
37
is not readily seen is the fact that triglyme exhibits a faster growth rate than the
ciprotriglyme 181 x IO3 cellsmm2hr versus 27 cellsmm2hr
Total counts of the effluent found in Appendix F back up the imagae analysis
results ( figures 1213) F igure 12 shows that for the first six hours ~5xlO8 cellsml
are being pumped through the flow cell Once the supply of cells is cut off at t=6 hours
cells can still be seen in the effluent implying that growth of new cells is taking place in the
flow cell system
140E+09
120E+09
T=100E+09
S800E+08
S600E+08
agt400E+08
200E+08
000E+000 2 4 6 8 1012 141 6 1 8 20 22 24 26
mdash Control Triglyme
Ciprotriglyme- -x- - BMA
ciproBMA
time (hrsF igure 12 Total counts made with Acridine Orange From t=0-6 hours a feed
composed of a bacterial suspension in medium without a carbon source was pumped through the flow cell after t=6 hous the feed was switched to sterile complete medium
Figure 13 obtained from total cell counts displays the same trend with regard to
the amount of cell density on the polymer surface after 24 hours as figure 9 which was
made from direct count data The control polymer exhibits the highest cell density after
24 hours The effluent data does not demonstrate as much of a difference between
polymers as the image analysis data which may be explained by the growth and sloughing
of bacteria in the effluent tubing It is to be expected that the samples collected from the
Den
sity
(ce
lls
mm
A2)
38
effluent would have higher cell counts since there is more surface area available for cell
growth
100E+08 T
100E+07
100E+06
100E+05
100E+04
100E+03
100E+02
100E+01
100E+00Polym ers
I n Control | s Triglyme | ^Ciprotriglyme I SBMA I sciproBMA
Figure 13 Calculated cell density on the ldquotestrdquo polymers using total cell count (acridine orange) data Note that it follows the same trend as the image analysis data
Figure 14 shows that viable cells are being pumped through the flow cell while
figure 15 demonstrates that the concentration of ciprofloxacin at the polymer surface is
high enough to have a noticable effect on the density of bacteria on the polymer (Appendix
G - Plate Count Data)
39
Effluent viability data from t = 0-24hours
100E+10
100E+09
100E+08
j 100E+07 -
100E+06 -
100E+05
100E+04
time (hrs)
mdashmdash Control triglyme
bull-c ip ro tr ig ly m eBMA
-bull- ciproBMA
Figure 14 Plate count data from effluent samples taken from the polymer flow cells during the course of the experiments shows that viable cells are going through the flow cell
As stated previously total counts and viable counts are not considered to be as
accurate as direct counts The effect of the extra surface area available for cell adhesion and
growth provided by the tubing was not factored into the results Subsequent sloughing
andor entrapment of cells in this region of the flow cell setup could affect the cell
concentration data collected Figure 16 demonstrates the variation obtained from the
den
sity
(cf
um
mA2
)40
concentration data collected Figure 16 demonstrates the variation obtained from the
100E+06
SxltltSSSxgtxv-v
mm
I B
reg Control reg triglyme 0 ciprotriglyme 0 BMA Q ciproBMA
Polymers
Figure 15 Cell densities on polymers calculated from plate count data No colonies were found on any of the plates made for the ciproBMA polymer (L-R) Control triglyme ciprotriglyme BMA ciproBMA
same polymer using different techniques As stated previously the results obtained from IA
are considered to he the most accurate since they are taken from the polymer surface and
not the effluent
cell
dens
ity (c
ells
or c
fum
m2)
41
100E+07
100E+06
100E+05
100E+04
100E+03
100E+02
100E+01
100E+00 Plate counts Total counts IA
I
Figure 16 demonstrates the variations in bacterial density on the triglyme polymer after twenty four hours using image analysis (IA) acridine orange staining of the effluent and plate counts of the effluent
C iprofloxacin re lease
The extra surface area could also factor into the amount of ciprofloxacin detected in
the effluent (table 6) of the polymers incorporating ciprofloxacin In one millileter of
effluent roughly 3 ug of ciprofloxacin should be detected It should be noted that all of
the polymers containing ciprofloxacin still retained significant amounts of ciprofloxacin
This is to be expected given that the initial loading of ciprofloxacin was 04g Additionally
42
an earlier study found that these polymers continue to elute ciprofloxacin for up to 128
hours in a well stirred flask (Kwok CS et al 997) The erratic release of ciprofloxacin
seen in table 6 may be due to the interaction of the antibiotic with cells growing in the
effluent tubing ciprofloxacin degradation resulting
Experiment Time (hours) Cipro cone (figml) of points above detectionCiprotriglym e
O 35 plusmn21 2
2 17 I4 5 I6 4 I8 ND O18 ND O21 18 I24 5 + 5 2
CiproBM A O 6 plusmn 5 32 I I4 ND O6 ND O8 29 I18 2 I21 ND O24 ND O
Table 6 Ciprofloxacin concentrations in effluent ND = not detectable
from light exposure pulsating flow unforeseen release behavior or damage to polymer
coating Appendix H expands on the mathematical theory behind the controlled-release
of a drug from a one-dimensional slab under flow conditions
Overall the flow cells experiments showed that ciprofloxacin could successfully be
incorporated into BiospantradePEG polymers and still maintain its efficacy In addition
they demonstrated that cell adhesion and colonization of opaque materials could be
monitored continuously for up to 24 hours under Jlow conditions The results involving
the triglyme and BMA coatings were also encouraging
43
SUMMARY
The research conducted for this study involved exposing planktonic Pseudomonas
aeruginosa to 10 |igml of the DNA stain Hoechst 33342 for 3 hours The cell
suspension was then washed and resuspended in fresh complete medium minus glucose
the carbon source Every two hours for six hours a fresh batch of resuspended cells was
pumped over a ldquotestrdquo polymer in a flow cell being monitored microscopically for bacterial
attachment After six hours the flow was switch from the cell suspension to complete
medium plus glucose in order to observe cell adhesion and growth over the 24 hour run
Pictures were taken periodically over the course of the experiment and examined by image
analysis to detect changes in bacteria cell density on the surface of the ldquotestrdquo polymer The
results obtained from image analysis were for the most part confirmed by total and viable
cell counts performed on effluent samples Within the limitations and scope of this work
the results show that
1) Both the BMA coating and the triglyme coating can cut bacterial adhesion and
colonization in half
2) The addition of the ciprofloxacin to the polymer matrix decreases bacterial adhesion and
colonization by at least two orders of magnitude when compared with the control
3) Hoechst 33342 can be used at lOugml without interfering with P aeruginosa growth
patterns
4) Hoechst 33342 enables bacterial adhesion and biofilm formation on an opaque surface
to be monitored in a flow cell system for up to 24 hours
The results of this research indicate that it would be worthwhile to pursue
development of the ldquotestrdquo polymers for use as biomedical materials Further investigation
into how well image analysis correlates with actual bacterial cell adhesion and colonization
44
is also suggested from these results It would be interesting to run a set of experiments on
a substratum comparing image analysis and destructive sampling in which the flow cell is
broken down and the substratum is removed at every time point In addition a better
indication of the long-term performance of these materials could be gained by conducting
tests over a longer period of time a week or more Likewise the exposure of the material
to proteins before andor during bacterial challenge would provide more realistic test
conditions Dealings with industry have shown that the types of adhesion and colonization
experiments conducted in this study are among the initial steps in gaining approval from the
FDA
45
BIBLIOGRAPHY
Ackart WB Camp RL Wheelwright WL and JS Byck A n tim ic r o b ia l P o ly m e r s Journal of Biomedical Materials Research V 9 p 55 - 68 1975)
Baker RW Controlled Release of Biologically Active A gents John Wiley amp Sons New York NY 1987
Bellido F and REW Hancock S u s c e p t ib i l i ty a n d R e s is ta n c e o f P s e u d o m o n a s a e ru g in o sa to A n tim ic r o b ia l A g e n ts P s e u d o m a n a s a e r u g i n o s a as an Opportunistic Pathogen eds M Campa M Bendinelli and H Friedman Plenum Press New York NY p 321- 348 1993
Bird RB Stewart WE and EN Lightfoot Transport Phenomena John Wiley amp Sons New York NY p 495 - 625 I960
Blanchard CR B io m a te r ia ls B o d y P a r ts o f the F u tu re lthttpwwwswiiorg3pubsttodayfallimplanthtmgt June 4 1996
Bondi A B a s ic P h a m a c o lo g ic T ec h n iq u es f o r E va lu a tin g A n tim ic r o b ia l A g e n ts I Animal and Clinical Pharm acologic Techniques in Drug Evaluation eds JH Nodine and PE Siegler Year Book Medical Chicago IL p 440 - 450 1964
Bryers JD M o d e lin g b io ftlm a cc u m u la tio n Physiological Models in Microbiology V o l rsquol l ed Brazin MJ and Prossser JL CRC Press Boca Raton FE p1091
1988
Byun Y Jacobs HA and Sung Wan Kim M ec h a n ism o f th ro m b in in a c tiv a tio n b y im m o b il iz e d h e p a r in Journal of Biomedical Materials Research V 30 p 423 - 427 1996
Carballo J CM Ferreiros and MT Criado Im p o r ta n c e o f experim en ta l d e s ig n in th e e v a lu a tio n o f th e in flu en ce o f p r o te in s in b a c te r ia l a d h e re n c e to p o ly m e r s Medical Microbiology and Immunology V 180 p 149-155 1991
Characklis WG and KC Marshall eds Biofilms J Wiley amp Sons New York NY 1990
Ciprofloxacin Ciproreg Ciproreg IV C loxanreg Clinical Pharmacology Online lthttpwwwcponlinegsmcomscriplsfullmonoshowmonopl7mononum=I 12gtMay 19 1997
Clinical Applications of Biomalerials NIH Consens Statement 1982 Nov 1-3 [cited 1997 August 21] 4(5)1-19 httptextnlmnihgovnihcdcwww34txthtml
46
May 27 1996
Craig and Ebert Pseudomonas aeruginosa Infections amp Treatment p 467-491
Dankert J Hogt AH and J Feijen Biomedical Polymers Bacterial Adhesion Colonization and Infection CRC Critical Reviews in B iocom patibility V 2 p 219-301 1986
Doi K Nakayama Y and T Matsuda Novel compliant and tissue-permeable microporous polyurethane vascular prosthesis fabrication using an excimer laser ablation technique Journal o f Biomedical M aterials Research V 31 p 27 - 33 1996
Eginton PJ et al The influence o f substratum properties on the attachment o f bacterial cells Colloids and Surfaces B B io in terfaces V 5 p 153-159 1995
Farber BF and AG Wolff Salicylic acid prevents the adherence of bacteria and yeast to silastic catheters Journal o f Biomedical Materials Research V 2 7 p 5 9 9 - 6021993
Fan LT and SK Singh Controlled Release a Quantitative Treatments Springer-Verlag New York NY 1989
Francois P et al Physical and biological effects o f a surface coating procedure on polyurethane catheters Biom aterials V 17 p 667 - 678 1996
Golomb G and A Shplgelman Prevention o f bacterial colonization on polyurethane in vitro incorporated antibacterial agent Journal o f Biomedical Materials Research V 25 p 937 - 952 1991
Greenfeld et al Decreased bacterial adherence and biofilm formation on chlorhexidince and silver sulfadiazine-impregnated central venous catheters implanted in swine Critical Care Medicine V 23 p 894 - 900 1995
Gristina AG Biomaterial-Centered Infection Microbial Adhesion Versus Tissue Integration Science V237 p1588-1595 Sept 1987
Gristina AG Implant Failure and the Immuno-Incompentent Fibro-InflammatoryZone
Clinical Orthopaedics And Related Research V298 p106-118 1994
Gristina AG et al Cell biology and molecular mechanisms in artificial device infections The International Journal of Artificial Organs V16 p755- 764 1993
Gristina AG et al The Glycocalyx Biofilm Microbes and Resistant Infection Seminars in Arthroplasty V5 p160-170 October 1994
47
Gristina AG Naylor PT and Q Myrvik The Race for the Surface Microbes Tissue Cells and Biomaterials Molecular M echanisms o f M icrobial Adhesion eds Switalski L Hook M and E Beachey Springer-Verlag New York NY 1989
Gristina AG Passive Local Immunotherapy ldquoPLIrdquo to Prevent Biomaterial and Wound Infection Frank N Nelson Lecture Nov 11 1997
Hanker JS and BL Giammara Biomaterials and Biomedical Devices S cien ce V 242 p885-892 Nov 11 1988
Holt JG et al B ergeyrsquos Manual of Determinative B acterio logy 9th ed Williams amp Wilkins Baltimore MD p 93 - 941994
Hulshoff JEG et al Evaluation of plasma-spray and magnetron-sputter Ca-P- coated implants An in vivo experiment using rabbits Journal o fBiomedical Materials Research V 31 p 329 - 337 1996
Jansen B and W Kohnen Prevention o f biofilm formation by polymer modificationJournal of Industrial Microbiology V 15 p391-396 1995
Kaibara et al Promotion and control o f selective adhesion and proliferation o f endothelial cells on polymer surface by carbon deposition Journals o fBiomedical Material Research V 31 p 429 - 435 1996
Kost J and R Danger Controlled release of bioactive agents Trends in B iotechnology V2 p47-51 1984
Kwok CS et al Design of Infection-resistant Polymers I Fabrication and Formulation in the process of submitting 1997
Kydonieus A ed Treatise on Controlled Drug Delivery Fundam entals Optimization Applications M arcelDekker Inc New York NY 1992
Danger RS and DL Wise eds Medical Applications of Controlled R e lea se Volume I CRC Press Inc Boca Raton PD 1984
Danger RS and DL Wise eds Medical Applications of Controlled R e lea se Volume II Applications and Evaluation CRC Press Inc Boca Raton PD 1984
Danger RS and N A Peppas Present and future application of biomaterials in controlled drug delivery systems Biomaterials V 2 p 244 -246 1981
Lazarus SM et al A Hydrophilic Polymer-Coated Antimicrobial Urethral CatheterJournal of Biomedical Materials Research V 5 p 129 - 138 1971
Lee S-D et al Artificial cornea surface modification o f silicone rubber membrane by graft polymerization o f pHEMA via glow discharge B iom aterials V 17 p
4 8
587 - 5951996
Lindhout T etal Antithrombinactivity o f surface-bound heparin studied underflow conditions Journal of Biom edical Materials Research V 29 p 1255 - 1266 1995
Lohmann D Controlled Release-recent progress in polymeric drug delivery systems M acromol Symp V 100 p25-30 1995
Manual of Industrial M icrobiology and Biotechnology p30 1986
Massia SP and JA Hubbell Human endothelial cell interactions with surface- coupled adhesion peptides on a nonadhesive glass substrate and two polymeric biomaterials Journal of Biom edical Materials R esearch V 25 p 223- 242 1991
Materials Science Materials for medicine Britanica Onlinelthttpwwwebcom 180cgi-bingDocF=macro5004232htmgt [Accessed Nov 20 1997]
Miles AA Misra SS and JO Irwin The Estimation o f the Bactericidal Power o f the Blood Journal of Hygiene V 38 p 732-749 1938
Paulsson M Gouda I Larm O and A Ljungh Adherence o f coagulase-negative staphylococci to heparin and other glycosaminoslycans immobilized on polymer surfaces Journal of Biomedical M aterials Research V 28 p 311 - 317 1994
Portoles M Refojo MF and F-L Leong Poloxamer 407 as a bacterial abhesive for hydrogel contact lenses Journal o f Biomedical M aterials Research V 28 p 303 - 309 1994
Price JS Tencer AF Arm DM and GA Bohach Controlled release o f antibiotics from coated orthopedic implants Journal o f Biom edical Materials Research V 30 p281-286 1996
Robinson JR and VHL Lee Controlled Drug Delivery Fundamentals and Applications 2nd ed Marcel Dekker Inc New York NY 1987
Rushton DN Brindley GS Polkey CE and GV Browning Implant infections and antibiotic-impregnated silicone rubber coating Journal of N eu ro lo g y Neurosurgery and Psychiatry V 52 p 223-229 1989
Ryu GH et al Antithrombogenicity o f lumbrokinase-immobilized polyurethane Journal of Biomedical M aterials Research V 28 p 1069-1077 1994
Schlichting H Boundary-Layer T heory translated by J Kestin 7 ed McGraw- Hill New York NY p 596-615 1979
49
Seyral P Zannier A JN Argenson and D Raoult The r e le a s e in v itro o f v a n c o m y c in a n d to b ra n y c in f r o m a c ry lic b o n e cem en t Journal o fAntimicrobial Chemotherapy V 33 p 337 - 339 1994
Strachan CJL The p r e v e n tio n o f o r th o p a e d ic im p la n t a n d v a sc u la r g ra ft in f e c t io n s Journal o f Hospital Infection V 30 (Supplement) p 54-63 1995
Suljak JP e t a l B a c te r ia l a d h e s io n to d en ta l am algam a n d th re e res in c o m p o s i te s Journal of Dentistry V23 p171-176 1995
Sullam PM Payan DG Dazin PF and FH Valone B in d in g o f V irid a n s G rou p S tr e p to c o c c i to H u m a n P la te le ts a Q u a n tita tiv e A n a ly s is Infection and Immunity V 58 p 3802-3806 Nov 1990
Tebbs SE Sawyer A and TSJ Elliot In flu en ce o f su rfa ce m o rp h o lo g y on in v i t r o b a c te r ia l a d h e re n c e to c e n tra l ven o u s c a th e te r s British Journal o f Anaesthesia V 72 p 587-591 1994
Thomsberry C and JC Sherris Section XI Laboratory Tests in Chemotherapy General Considerations Manual of Clinical Microbiology eds EH Lennette A Balows W J Hausler and HJ Shadomy 4th ed American Society for Microbiology Washington DC p 959 -977
Wang I Anderson JM and RE Marchant P la te le t -m e d ia te d a d h e s io n o f S ta p h y lo c o c c u s e p id e r m id is to h yd ro p h o b ic N H L B I re fe ren ce p o ly e th y le n e Journal o f Biomedical Materials Research V 27 p 1119-1128 1993
Weber W J and F A DiiGiano Process Dynamics in Environmental S ystem s John Wiley amp Sons Inc p 390 - 398 1996
William SK e t al F o rm a tio n o f a m u ltila y e r ce llu la r lin ing on a p o ly u r e th a n e v a s c u la r g r a f t f o l lo w in g en d o th e lia l ce ll s o d d in g Journal of B iom edical M aterials Research V 26 p 103-117 1992
Wolfson JS and DC Hooper eds Quinolone Antimicrobial A gents American Society for Microbiology Washington DC 1989
Yu Jian-Lin et al F ib ro n e c tin on the S urface o f B ilia ry D ra in M a te r ia ls - A R o le in B a c te r ia l A d h e r e n c e Journal of Surgical Research V 59 p 596-600 1995
APPENDICES
51
APPENDIX A
Growth Rate Experiments
52Growth Curves (500 ppm Glucose) Room Temperaturetime count cone (cellsml) average std dev Specific growth rate
0 28 159E+06 711E+06 687E+06 048046690552 295E+06
296 168E+071 40 227E+06 785E+06 408E+06
210 119E+07165 936E+06
2 28 159E+06 204E+06 766E+0525 142E+0655 312E+06
3 281 159E+07 138E+07 156E+06216 123E+07233 132E+07
45 98 556E+07 550E+07 212E+06
101 573E+0792 522E+07
6 177 100E+08 736E+07 206E+0789 505E+07
123 698E+077 290 165E+08 122E+08 318E+07
198 112E+08156 885E+07
8 56 318E+08 210E+08 820E+0721 119E+0834 193E+08
9 114 647E+08 522E+08 779E+0782 465E+0893 528E+0879 448E+08
10 141 800E+08 749E+08 930E+07109 619E+08146 828E+08
11 282 160E+09 115E+09 284E+08206 117E+09172 976E+08150 851 E+08
12 200 113E+09 110E+09 329E+07186 106E+09195 111E+09
13 76 216E+09 277E+09 107E+0975 213E+09
163 462E+0976 216E+09
14 127 360E+09 340E+09 356E+08102 289E+09130 369E+09
53
15 273 775E+09 817E+09 318E+08300 851 E+09291 826E+09
16 287 163E+10 155E+10 765E+08278 158E+10255 145E+10
17 295 167E+10 145E+10 191 E+09213 121E+10260 148E+10
18 313 178E+10 163E+10 120E+09- --------
261 148E+10 - -------- -------286 162E+10
54
time count Cone (cellsml) average std dev Specific growth rateO 20 113E+06 271 E+06 191 E+06 050174225
109 619E+0657 323E+0617 965E+0536 204E+06
123 121 687E+06 746E+06 767E+05
117 664E+06137 777E+06151 857E+06
456 160 908E+06 128E+07 351 E+06
309 175E+07210 119E+07
7 35 199E+0728 159E+0738 216E+07
89 78 443E+08 485E+08 268E+07
87 494E+0891 516E+0886 488E+08
101112 69 392E+08 400E+08 147E+07
73 414E+0867 380E+0873 414E+08
13 107 607E+08 649E+08 549E+07128 726E+08 --108 613E+08
14 64 182E+09 131E+09 292E+0840 113E+0939 111E+0942 119E+09
15 64 182E+09 182E+09 401 E+0766 187E+0964 182E+0962 176E+09
1617 121 343E+09 362E+09 142E+08
129 366E+09133 377E+09
18 364 207E+10 227E+10 146E+091
55411 233E+10424 241 E+10
19 375 213E+10 217E+10 350E+08390 221 E+10384 218E+10
20 98 556E+10 680E+10 179E+1080 454E+10
155 880E+10146 828E+10
56
time count Cone (cellsml) average std dev Specific growth rateO 23 522E+06 639E+06 114E+06 0443703052
27 613E+0637 840E+0630 681 E+0622 499E+0630 681 E+06
11 119 135E+10 119E+10 165E+09119 135E+1090 102E+1090 102E+10
12 45 102E+10 934E+09 231E+0926 590E+0932 726E+0938 863E+0954 123E+1052 118E+10
13 49 111E+10 126E+10 131E+0948 109E+1059 134E+1061 138E+1054 123E+1063 143E+10
14 135 306E+10 302E+10 250E+09128 291 E+10150 340E+10120 272E+10
15 167 379E+10 368E+10 166E+09168 381 E+10152 345E+10 J Z
16 239 542E+10 495E+10 619E+09201 456E+10250 567E+10183 415E+10
17 57 647E+10 726E+10 960E+0977 874E+1056 636E+1066 749E+10
18 86 976E+10 102E+11 804E+0982 931 E+10
101 115E+11 -90 102E+11
19 121 137E+11 121 E+11 182E+10124 141 E+11
57
92 104E+1189 101E+11
20 89 101E+11 107E+11 830E+0996 109E+11
105 119E+1186 976E+10
21 101 115E+11 124E+11 104E+10122 138E+11114 129E+11100 113E+11
22 67 760E+10 111E+11 216E+10115 131E+1197 110E+11
112 127E+11
58
time count Cone (cellsmi) average std dev Specific growth rate averageO 25 142E+06 127E+06 434E+05 0443600055 0467378
22 125E+0632 182E+06 std dev
9 511E+05 00248917 965E+0529 165E+06
12 62 281 E+07 421 E+07 779E+0693 422E+0786 390E+07
116 527E+07108 490E+0791 413E+07
14 33 150E+08 156E+08 339E+0737 168E+0826 118E+0833 150E+0828 127E+0849 222E+08
155 39 177E+08 239E+08 810E+0731 141E+0888 399E+0854 245E+0851 232E+0853 241 E+08
175 61 277E+08 261 E+08 657E+0745 204E+0851 232E+0849 222E+08 - - Z
88 399E+0851 232E+08
225 136 309E+10 274E+10 247E+09114 259E+10112 254E+10
59
APPENDIX B
FASTEETHreg SUSCEPTIBILITY
6 0
time 01g260E+04
005280E+04 240E+04
Glucose Abs0008
640E+04 140E+05 170E+04 0016370E+05 770E+05 220E+04 0033
125 198E+06 310E+06 220E+05 0071145 890E+06 194E+06 330E+05 0146245 160E+08 200E+08 160E+07 0266
110E+08 180E+08 160E+07 100 0405275 170E+08 170E+08 190E+07 200 0408
time 0 05g 0025g217E+04 330E+04 110E+05
Fasteeth MIC Study I518E+05 760E+05 230E+05
125 194E+06 185E+06 410E+05314E+06 147E+06 816E+05
165 660E+06 100E+07 178E+06195 192E+07 880E+06 242E+06225 430E+07 140E+07 180E+07255 119E+09 292E+07 130E+07
time 157E-02
200E+08
150E+08
I 100E+08U
500E+07
000E+00
7 X
V
I I
01g
005
C ~
233E+04 133E+0510 15 20 25 30time (hours)
194E+06 566E+06880E+06 746E+06226E+07 120E+07125E+08 120E+08133E+08 703E+08
time Control 450E-02121E+05 152E+05140E+05 264E+06197E+06 246E+06
185 362E+06 919E+06457E+06 211E+07461E+07 234E+08
IhU 200E+07
100E+07
000E+00
250E+08
200E+08
150E+08
1 00E+08
500E+07
OOOE+OO
I
I
Z1
Control
450E-02
500E+07
400E+07
300E+07
F a s te e th MIC Il
I
y -
Jlt3
0 05g
0025g
C
10 15 20 25timefhrs)
Fasteeth MIC III
157E-02
C
time (hrs)
APP ENDlX C
Hoechst 33342
me control s1 S2 S3O 162E+05 149E+05 118E+05 139E+05
195 477E+06 443E+07 317E+07 883E+04OOOE+OO
O 134E+04 159E+04 280E+04 194E+0414 210E+06 520E+05 380E+05 945E+0416 228E+06 313E+06 604E+06 294E+0519 763E+06 980E+06 169E+07 207E+0523 263E+07 133E+08 883E+07 967E+04
5ugml10ugmlSOugml
Hoechst 33342 MIC no wash
-control
-5ugml
-10ugml -50ugml
time (hrs)
time control s1 S2 S3O 162E+05 149E+05 118E+05 139E+05
195 477E+06 443E+07 317E+07 883E+04OOOE+OO
O 134E+04 159E+04 280E+04 194E+0414 210E+06 520E+05 380E+05 945E+0416 228E+06 313E+06 604E+06 294E+0519 763E+06 980E+06 169E+07 207E+0523 263E+07 133E+08 883E+07 967E+04
5ugmllOugml50ugml
Hoechst 33342 MIC no wash
control -5ugml bull10ugml 50ugml
time control A B3 129E+05 129E+05 139E+05
15 104E+06 100E+05 169E+0616 645E+06 227E+05 122E+062022
423E+06 113E+05 254E+06106E+07 160E+06 158E+07
24 707E+07 109E+07 175E+07
Hoescht MIC - incubate in stain for 3 hrs then wash
800E+07700E+07600E+07500E+07400E+07300E+07200E+07100E+07OOOE+OO
MIC w wash
DLO
800E+07
600E+07
400E+07
200E+07
000E+00
- controlbullA
-B
O 10 20 30
time(hrs)
200E+07180E+07160E+07140E+07120E+07100E+07800E+06600E+06400E+06200E+06000E+00
65
APPENDIX D
C iprofloxacin
66
Ciprofloxacin MIC study Plate countstime count (1ugml) cfuml average std dev count (1 ugml) cfuml
0 96 960E+04 962E+04 530E+03 21 210E+0496 960E+04 28 280E+04
105 105E+05 22 220E+0410 100E+059 900E+049 900E+04
155 67 670E+04 865E+04 266E+04 3 300E+0385 850E+04 2 200E+0377 770E+04 2 200E+03
5 500E+0411 110E+0513 130E+05
17 76 760E+04 687E+04 220E+04 20 200E+0465 650E+04 27 270E+0441 410E+04 20 200E+0411 110E+055 500E+047 700E+04
20 31 310E+04 230E+04 128E+04 13 130E+0433 330E+04 0 000E+00
5 500E+03 0 000E+0022 0 ND 0
0 00 0
24 0 ND 00 00 0
time 1 ugml std dev 01 ugml std dev control std dev0 720E+04 345E+04 566E+04 263E+04 593E+04 170E+03
155 584E+04 452E+04 510E+06 168E+06 903E+06 419E+0517 532E+04 283E+04 380E+06 221E+06 153E+07 963E+0520 137E+04 137E+04 670E+06 381 E+06 963E+07 741 E+0622 0 0 254E+07 587E+06 377E+07 450E+0624 0 0 920E+06 440E+06 377E+07 450E+06
67
average std dev count (01 ugml) cfuml average std dev count (01 ugml)237E+04 309E+03 75 750E+04 783E+04 340E+03 20
83 830E+04 2077 770E+04 14
8 800E+048 800E+046 600E+04
233E+03 471 E+02 66 660E+06 3677 770E+06 3056 560E+06 41
223E+04 330E+03 56 560E+06 587E+06 602E+05 15153 530E+06 17167 670E+06 155
17 13
14433E+03 613E+03 TNTC 119
TNTC 53TNTC 29
215 215E+07 232E+07 362E+06 253189 189E+07 256247 247E+07 235
19 190E+07 2127 270E+07 2828 280E+07 42
Bad plate 60Bad plate 110Bad plate 17
5- - 7
68
cfum average std dev count (control) cfuml average std dev200E+04 180E+04 283E+03 61 610E+04 593E+04 170E+03200E+04 60 600E+04140E+04 57 570E+04
360E+06 357E+06 450E+05 96 960E+06 903E+06 419E+05300E+06 89 890E+06410E+06 86 860E+06
151E+06 153E+06 148E+05 166 166E+07 153E+07 963E+05171E+06 150 150E+07155E+06 143 143E+07170E+06130E+06140E+06119E+07 670E+06 381 E+06 86 860E+07 670E+07 300E+07530E+06 103 103E+08290E+06 100 100E+08253E+07 276E+07 680E+06 34 340E+07 X256E+07 35 350E+07235E+07 44 440E+07210E+07280E+07420E+07600E+06 920E+06 440E+06 34 340E+07 377E+07 450E+06110E+07 35 350E+07170E+07 44 440E+07500E+06700E+06
I
I
69
APPENDIX F
Flow Cell Experiments Image Analysis
70
IMAGE ANALYSIS
Images of the polymers were taken using a CCD camera They were then analyzed
using Image Pro Plus The analysis of each image was automatically saved as an Excel
file generating 48 Excel sheets per experiment Since a hard copy of this information
would be too bulking to include in the Appendices a disk with all of the data will be kept
with a copy of this thesis at the Chemical Engineering Department and at the Center for
Biofilm Engineering
The spreadsheet are labeled with the time at which the image was taken die field of
view (eg A b c etc) parameters measured (eg Area ave dia width length) For
every field of view taken two spreadsheets were generated One consisted of the
parameters measured and the other gave the dimensions of the field of view (length x
width)
At the beginning of each experiment an image of a micrometer was taken in order to
calibrate all of the measurements for the experiment Cell numbers were calculated by
summing the area values of one field of view and dividing by 075 for a high end value or
50 for a low end value These values were than averaged to get the average values and
standard deviations The above values were obtained from B ergey rsquos Manual o f
Determinative Microbiology which gave the width of P aeruginosa at 05-1Ojim and
the length as 15-50pm This method for calculating cell numbers was found to be
accurate as actual cell numbers could be counted for the early time points They fell within
the range calculated by the above method
The files are listed as
Control
Triglyme
71
Ciprotriglyme
BMA
CiproBMA
The graphs found in the thesis text were made from the above files and then
converted into data which was easier to handle The files from which the graphs were
made are
Endpoint
Curves
APPENDIX F
Flow Cell Experiments Total CountsAO
cell
con
e(o
ellm
iEffluent counts over a 24
hour time period - Comparison
150E+09
000E+00
mdash- Control
Triglyme bull Ciprotriglyme
- BMA -bull- ciproBMA
CU
den
sity
(ce
lls
mm
A2)
100E+07
100E+06
100E+05
100E+04
100E+03
100E+02
100E+01
H ControlHTrigIyme^CiprotriglymeHBMAHciproBMA
Polymers100E+00
cell
con
e (
cell
sm
l)Effluent data t=0-8 Total counts
140E+09
120E+09
100E+09
800E+08
600E+08
400E+08
200E+08
000E+00
mdash Control Triglyme
-Ciprotriglyme - x~ BMA -^c ip roB M A
time (hrs)
76Control AO countstime (in) cell count cellsml average std Dev
0 100 454E+08 491 E+08 134E+0874 336E+08
110 499E+08101 458E+08172 781 E+0882 372E+08
125 567E+08165 749E+08132 599E+08108 490E+0860 272E+08
113 513E+0897 440E+0893 422E+0890 409E+08
2 107 486E+08 730E+08 152E+08167 758E+08154 699E+08111 504E+08167 758E+08196 890E+08204 926E+08
180 817E+084 113 513E+08 678E+08 171E+08
108 490E+08172 781 E+08
82 372E+08125 567E+08132 599E+08165 749E+08167 758E+08204 926E+08180 817E+08196 890E+08
6 0 0 0 00000
77
area (mmA2)72578 714E+02 441 E+016550376102
Polymercount cone
33 150E+08 201 E+08 660E+0750 227E+0841 186E+0847 213E+08
455 103E+08430 976E+07450 102E+08
62 281 E+0854 245E+0859 268E+0848 218E+0865 295E+0851 232E+08
density845E+06 277E+06
78
time (out) cell count cellsml average std Dev time (out) average std Dev0 65 295E+08 373E+08 780E+07 0 373E+08 780E+07
74 336E+08 2 303E+08 123E+08111 504E+08 4 209E+08 800E+0777 350E+08 6 262E+08 698E+07
109 495E+08 8 162E+08 088 399E+08 16 159E+07 116E+0653 241 E+08 18 232E+07 089 404E+08 20 304E+07 901E+0673 331 E+08 21 407E+07 082 372E+08 24 714E+07 213E+07
2 101 458E+08 303E+08 123E+08103 468E+08 Control101 458E+0830 136 E+08 0 491 E+08 134E+0835 159E+08 2 730E+08 152E+0844 200E+08 4 678E+08 171 E+0860 272E+08 6 0 068 309E+08 8 0 058 263E+08 16 0 0
4 30 136E+08 209E+08 800E+07 18 0 035 159E+08 20 0 028 127E+08 21 0 044 200E+08 24 0 019 863E+0744 200E+0869 313E+0872 327E+08 time in-out66 300E+08 0 000E+0054 245E+08 2 000E+00
6 39 177E+08 262E+08 698E+07 4 -262E+0860 272E+08 6 226E+0856 254E+08 8 162E+0867 304E+08 16 159E+0738 173E+08 18 232E+07
46 209E+08 20 304E+0744 200E+08 21 407E+0772 327E+08 24 714E+0788 399E+0867 304E+08
16 62 141E+07 159E+07 116E+0669 157E+0766 150E+0776 173E+0769 157E+0770 159E+0773 166E+07
79
ff l 184E+0768 154E+0767 152E+07
20 161 365E+07 304E+07 901 E+06158 359E+07196 445E+0798 222E+0791 207E+07
100 227E+0724 206 468E+07 714E+07 213E+07
121 275E+07219 497E+07217 493E+07360 817E+07270 613E+07420 953E+07280 636E+07430 976E+07390 885E+07320 726E+07360 817E+07430 976E+07380 863E+07
80
Triglyme AO countstime (in) count cellsml average std Dev
0 77 350E+08 517E+08 224E+0883 377E+0878 354E+0867 304E+0888 399E+08
115 522E+0896 436E+0888 399E+0883 377E+08
195 885E+08208 944E+08188 853E+08
2 99 449E+08 765E+08 251 E+08120 545E+08102 463E+08130 590E+08138 626E+08136 617E+08133 604E+08232 105E+09265 120E+09260 118E+09197 894E+08190 863E+08190 863E+08
4 238 108E+09 708E+08 307E+08225 102E+09215 976E+08100 454E+0864 291 E+0899 449E+08
124 563E+0898 445E+08
194 881 E+08188 853E+08151 685E+08176 799E+08
6 0 0 0 00 00 00 00 00 00 0
81
Polymercount cone
35 794E+07 353E+07 341 E+0741 931 E+0737 840E+0734 772E+0736 817E+0744 200E+0734 154E+0725 113E+0729 132E+0732 145E+0712 545E+0627 123E+0719 863E+0615 681 E+0614 636E+06
density117E+06 113E+06
area94558 907E+02 544E+019458883024
82
time (out) average std Dev time in-out0 676E+08 970E+07 0 500E+082 463E+08 118E+08 2 302E+084 477E+08 294E+08 4 231 E+086 550E+08 262E+08 6 550E+088 349E+07 302E+07 8 349E+07
16 284E+07 0 16 284E+0718 268E+07 238E+07 18 268E+0720 241 E+07 0 20 241 E+0721 228E+07 116E+07 21 228E+0724 223E+07 196E+07 24 223E+07
triglyme
time (in)0 517E+08 224E+082 765E+08 251 E+084 708E+08 307E+086 0 08 0 0
16 0 018 0 020 0 021 0 024 0 0
83
time (out) count cellsml average std Dev0 130 590E+08 678E+08 970E+07
136 617E+08157 713E+08150 681 E+08123 558E+08148 672E+08128 581 E+08140 636E+08172 781 E+08152 690E+08205 931 E+08152 690E+08
2 150 681 E+08 463E+08 118E+0867 304E+08
101 458E+08100 454E+0863 286E+0896 436E+0899 449E+08
100 454E+08110 499E+0871 322E+08
130 590E+08136 617E+08157 713E+08150 681 E+08
4 28 127E+08 477E+08 294E+0818 817E+0738 173E+0823 104E+0826 11ampE+08
127 577E+08134 608E+08115 522E+08128 581 E+08150 681 E+08120 545E+08205 931 E+08145 658E+08215 976E+08
6 47 213E+08 550E+08 262E+0849 222E+0849 222E+0859 268E+0858 263E+08
164 744E+08
84
219 994E+08180 817E+08175 794E+08191 867E+08127 577E+08134 608E+08115 522E+08128 581 E+08
8 16 726E+07 349E+07 302E+0710 454E+0718 817E+0720 908E+0716 726E+072 908E+064 182E+074 182E+075 227E+074 182E+07
18 9 204E+07 268E+07 238E+071 227E+067 159E+070 000E+000 000E+00
99 449E+07142 645E+07128 581 E+07108 490E+07165 749E+0727 123E+0730 136E+0733 150E+0737 168E+0730 136E+07
21 8 182E+07 228E+07 116E+0720 454E+0710 227E+0712 272E+0719 431E+0727 123E+0730 136E+0733 150E+0737 168E+0730 136E+07
24 25 113E+07 223E+07 196E+0711 499E+0622 999E+0623 104E+0716 726E+06
85
19 863E+0626 118E+0723 104E+0725 113E+0718 817E+0614 318E+0722 499E+0727 613E+0716 363E+0727 613E+07
Cel
l con
e (
cells
ml)
Acridine Orange effluent counts t= 8-24hours
180E+08 160E+08 140E+08 120E+08 100E+08 800E+07 600E+07 400E+07 200E+07 000E+00
8 12 16 20 24
mdash diamsmdash Control
- Ciprotriglyme - -x- -B MA - X - ciproBMA
time (hours)
87
Ciprotriglyme AO countstime (in) count cellsml average std Dev
0 110 499E+08 932E+08 329E+08106 481 E+08115 522E+08144 654E+08141 640E+08157 143E+09113 103E+09119 108E+09103 935E+08105 953E+08147 133E+09136 123E+09 bull146 133E+09
2 115 104E+09 985E+08 202E+08105 953E+08102 926E+0898 890E+08
129 117E+09132 120E+09140 127E+09121 110E+09128 116E+09150 681 E+08184 835E+08131 595E+08
4 213 967E+08 954E+08 481 E+08242 110E+09
13 590E+07251 114E+09132 599E+08168 153E+09
13 118E+0844 399E+08
154 140E+09190 173E+09115 104E+09132 120E+09132 120E+0998 890E+08
6 0 0
88
Polymercount cone
84 953E+06 701 E+06 441 E+0650 567E+0655 624E+0642 477E+0667 760E+06
140 159E+0799 112E+0796 109E+0797 110E+07
107 121E+079 204E+068 182E+06
10 227E+0610 227E+068 182E+06
area94352 941E+02 276E+019064997397
density 223E+05 141 E+05
89
time (out) average std Dev0 754E+08 210E+082 919E+08 207E+084 942E+08 388E+086 292E+08 273E+088 128E+07 216E+06
16 705E+06 bull 018 561 E+06 406E+0620 947E+06 021 114E+07 573E+0624 184E+07 774E+06
Ciprotriglyme
time (in)0 932E+08 329E+082 985E+08 202E+084 954E+08 481 E+086 0 08 0 0
16 0 018 0 020 0 021 0 024 0 0
90
time (out) count cellsml average std Dev0 120 545E+08 754E+08 210E+08
130 590E+08153 695E+08156 708E+0852 472E+0851 463E+0889 808E+08
118 107E+0981 735E+08
111 101E+0996 872E+08
119 108E+092 92 835E+08 919E+08 207E+08
78 708E+0869 626E+0883 754E+0890 817E+08
103 935E+08135 123E+09143 130E+09134 122E+09117 106E+09191 867E+08167 758E+08Ig 844E+08
4 186 844E+08 942E+08 388E+08241 109E+09289 131E+09243 110E+09159 144E+09177 161E+0931 281 E+0820 182E+08
102 926E+08103 935E+0880 726E+0899 899E+0899 899E+08
6 92 835E+08 292E+08 273E+0865 590E+0882 744E+0865 590E+0854 490E+08
21 191 E+0826 236E+0817 154E+08
91
25 227E+0820 182E+08
133 302E+07113 256E+0793 211E+07
114 259E+07134 304E+07
8 68 154E+07 128E+07 216E+0652 118E+0744 999E+0675 170E+0748 109E+0757 129E+0766 150E+0750 113E+0752 118E+0751 116E+07
18 44 999E+06 561 E+06 406E+0657 129E+0734 772E+0637 840E+0635 794E+06
8 182E+066 136E+065 113E+068 182E+06
13 295E+0621 71 161E+07 114E+07 573E+06
94 213E+0779 179E+0777 175E+0729 658E+0631 704E+0628 636E+0625 567E+0630 681 E+0661 138E+0761 138E+0752 118E+0764 145E+07
3 681E+0524 35 794E+06 184E+07 774E+06
45 102E+0756 127E+0738 863E+06
53 120E+07182 207E+07205 233E+07
92
235 267E+07240 272E+07220 250E+0771 806E+06
200 227E+07195 221E+07265 301 E+07
93BMA total counts Acric ine Orange BMAtime(in) count cone (cellsml) average std dev time (in) ave std dev
0 134 122E+09 826E+08 249E+08 0 826E+08 249E+08146 133E+09 2 610E+08 276E+08130 118E+09 4 731 E+08 382E+0869 626E+08 6 0 069 626E+0891 826E+0872 654E+08 time (out)66 599E+08 0 853E+08 155E+0872 654E+08 2 612E+08 177E+0883 754E+08 4 456E+08 282E+0878 708E+08 6 288E+08 208E+0882 744E+08 8 137E+07 934E+06
2 12 109E+08 610E+08 276E+08 16 445E+07 049 445E+08 18 523E+07 175E+0738 345E+08 20 720E+07 062 563E+08 21 818E+07 379E+0760 545E+08 24 853E+07 340E+07
115 104E+09109 990E+08122 111E+0964 581 E+0876 690E+0849 445E+0852 472E+0866 599E+08
4 73 663E+08 731 E+08 382E+0881 735E+0898 890E+0870 636E+0873 663E+08
131 119E+09115 104E+09141 128E+09147 133E+0929 263E+0829 263E+0838 345E+0821 191E+08
6 00000000
94
0
Polymercount cone
125 567E+07 895E+07 418E+07140 636E+07100 454E+07115 522E+07137 622E+07139 631 E+07150 681 E+07270 123E+08380 173E+08360 163E+08 density250 113E+08 298E+06 139E+06200 908E+07
area87061 901 E+02 21217235669140691703
95
time(out) count cone (cellsml) average std devC 82 754E+0E 853E+08 155E+08
7E 708E+0E86 781 E+0893 844E+0881 735E+0882 744E+0877 699E+0892 835E+08
121 110E+09116 105E+09125 113E+09
2 92 835E+08 612E+08 177E+0876 690E+08
109 990E+0892 835E+0860 545E+0855 499E+0863 572E+0872 654E+0847 427E+0843 390E+0844 399E+0867 608E+0856 508E+08
4 47 427E+08 456E+08 282E+0852 472E+0859 536E+0860 545E+0836 327E+0897 881 E+0830 272E+0850 454E+08
115 104E+09104 944E+08
19 173E+0814 127E+0828 254E+0822 200E+0821 191 E+08
6 16 145E+08 288E+08 201 E+0815 136E+0813 118E+0821 191 E+0816 145E+0855 499E+0840 363E+0845 409E+08
96
85 772E+0873 663E+0820 182E+0820 182E+0820 182E+0820 182E+0817 154E+08
8 6 136E+07 137E+07 934E+060 000E+005 113E+074 908E+061 227E+06
27 245E+0728 254E+0726 236E+07
18 77 699E+07 523E+07 175E+0773 663E+0783 754E+0773 663E+0772 654E+0768 617E+0717 386E+0719 431 E+0715 340E+0712 272E+0712 272E+07
21 310 704E+07 818E+07 379E+07300 681 E+07140 318E+07230 522E+07210 477E+07285 129E+08290 132E+08340 154E+08 - -
250 113E+08123 558E+07136 617E+07144 654E+07
24 107 486E+07 853E+07 340E+07108 490E+07112 508E+07270 123E+08250 113E+08320 145E+08260 118E+08148 672E+07153 695E+07150 681 E+07
97
ciproBMA AO counts
time (in) count cone average std dev0 74 672E+08 673E+08 19E+08
100 908E+0880 726E+08
112 102E+0956 508E+0869 626E+08
108 981 E+0871 645E+0886 781 E+0876 69E+0838 345E+0852 472E+0856 508E+0860 545E+08
2 44 399E+08 897E+08 61 E+0851 463E+0825 227E+0832 291 E+0841 372E+08
103 935E+0893 844E+0899 899E+08
219 199E+09192 174E+09188 171E+09
4 92 835E+08 726E+08 178E+0878 708E+08
102 926E+0897 881 E+08
102 926E+0884 763E+0886 781 E+0879 717E+08
106 962E+0856 508E+0848 436E+0854 49E+0856 508E+08
_
i
98
Polymercount cone
139 316E+07 541 E+07 463E+07114 259E+07125 284E+07134 304E+07280 127E+08290 132E+08250 113E+08
79 179E+0773 166E+0779 179E+07
area88181 870E+02 125E+018760685282
density187E+06 160E+06
99
time (in) ave std devO 673E+08 190E+082 897E+08 610E+084 726E+08 128E+086 0 0
time (out)0 700E+08 146E+082 652E+08 311E+084 524E+08 227E+086 350E+08 127E+088 545E+06 286E+06
16 101E+07 018 113E+07 430E+0620 281 E+07 0
21 365E+07 201 E+0724 682E+07 510E+07
100
time (out) count cone average std dev0 71 645E+08 7E+08 146E+08
71 645E+0876 69E+0899 899E+08
103 935E+0884 763E+0891 826E+0865 59E+0860 545E+0851 463E+08
2 30 272E+08 652E+08 311 E+0842 381 E+0824 218E+0831 281 E+0823 209E+08
130 118E+0966 599E+0866 599E+0890 817E+0897 881 E+0867 608E+0888 799E+08
113 103E+09104 944E+08107 971 E+08
4 83 754E+08 524E+08 227E+0872 654E+0884 763E+0890 817E+0866 599E+0857 518E+0889 808E+0867 608E+0830 272E+0820 182E+0834 309E+0828 254E+08
mdash30 272E+08
6 39 354E+08 35E+08 123E+0846 418E+0854 49E+0859 536E+0852 472E+0818 163E+08
101
30 272E+0825 227E+0835 318E+0848 436E+0852 472E+0840 363E+0828 254E+0814 127E+08
8 17 386E+06 545E+06 286E+0611 250E+0612 272E+0623 104E+07
9 409E+0616 726E+0620 908E+06
8 363E+0618 35 159E+07 113E+07 430E+06
37 168E+0736 163E+0734 772E+0627 613E+0639 885E+0654 123E+0728 636E+06
21 300 681 E+07 365E+07 201 E+07275 624E+07300 681 E+07255 579E+07275 624E+07
85 193E+0767 152E+0779 179E+0770 159E+0793 211 E+0770 318E+0761 277E+0750 227E+0748 218E+0778 354E+07
24 42 191 E+07 682E+07 510E+0757 259E+0770 318E+0767 304E+0749 222E+07
270 123E+08305 138E+08385 175E+08270 123E+08
102
74 336E+07124 563E+0775 340E+07
165 749E+07
103
APPENDIX G
Flow Cell Experiments Viable CountsPlate Counts
104
Plate counts were conducted by placing ten 10 microliter drops of properly diluted
effluent and influent on plate count agar plates and incubating overnight at room
temperature before counting Several serial dilutions were made for each sample to ensure
that countable plates 3 to 300 colonies were obtained Only viable cells would develop
into colonies on the plates therefore the counts performed in this manner are classified as
viable counts or plate counts
105
Control Plate counttime (in) count cone (cellsml) average std dev
0 159 159E+07 936E+06 628E+06193 193E+07188 188E+0768 680E+0664 640E+0658 580E+0632 320E+0648 480E+0632 320E+06
2 298 298E+07 374E+07 852E+06289 289E+07329 329E+07
54 540E+0739 390E+0740 400E+07
4 79 790E+06 330E+07 328E+07111 111E+0798 980E+0692 920E+0786 860E+0723 230E+0721 210E+0713 130E+07
6 0
time (in) ave cone std dev time (out) ave cone std dev0 936E+06 628E+06 0 249E+06 222E+062 374E+07 852E+06 2 993E+06 293E+064 330E+07 328E+07 4 208E+07 922E+066 0 0 6 111E+07 0
8 147E+07 016 113E+05 235E+0418 281E+05 020 449E+05 417E+0521 371 E+05 024 138E+05 109E+05
Polymer | 130E+06
106
area average std dev72578 7139433333 44072296550376102
density537E+04 548E+04 3474333595E+04512E+04
107
time(out) count cone (cellsml) average std dev0 49 490E+06 249E+06 222E+06
50 500E+0667 670E+06
7 700E+056 600E+05
9 900E+0517 170E+068 800E+05
11 110E+062 125 125E+07 993E+06 293E+06
122 122E+07119 119E+07
9 900E+0610 100E+074 400E+06
4 30 300E+07 208E+07 922E+0633 330E+0731 310E+07
104 104E+0794 940E+06
106 106E+0721 210E+0721 210E+0713 130E+07
6 no data
16 71 710E+04 113E+05 235E+04105 105E+05120 120E+05
15 150E+0511 110E+0512 120E+05
20 24 240E+04 449E+05 417E+0526 260E+0453 530E+0477 770E+0589 890E+0593 930E+05
24 17 170E+05 138E+05 109E+0526 260E+05
I 29 290E+05
108
26 260E+0459 590E+0420 200E+04
Polymer 10 100E+06 130E+06 551 E+0513 130E+0613 130E+0658 580E+0556 560E+05
119 119E+06 -
171 171E+06161 161 E+06244 244E+06
109
triglyme Plate countstime (in) count cone (cellsml) average std dev
0 167 167E+08 108E+08 700E+07184 184E+08182 182E+0831 310E+0737 370E+0747 470E+07
2 86 bull 860E+07 522E+07 334E+0778 780E+0774 740E+07
120 120E+07112 112E+07
4 159 159E+08 562E+07 489E+07116 116E+08145 145E+07244 244E+07224 224E+07
42 420E+0732 320E+0739 390E+07
6 000
time (in) ave cone std dev0 108E+08 700E+072 522E+07 334E+074 562E+07 489E+076 0 0
lt Z
Polymer density782E+06 441 E+06 248E+05
248E+05area Average 283E+05
94558 90723333339458883024
time (out) average std dev
no
O 882E+07 714E+072 336E+07 125E+074 821E+07 139E+076 214E+07 439E+078 223E+06 125E+05
16 326E+06 018 352E+06 246E+0620 773E+06 021 984E+06 105E+0724 299E+06 101 E+06
Polymer 50 500E+06 782E+0661 610E+0662 620E+06
108 108E+0747 470E+0615 150E+0716 160E+0713 130E+07
331 331 E+06281 281 E+06301 301 E+06
97 970E+0660 600E+06
I l l
time (out) count cone (cellsml) average std dev0 167 167E+08 882E+07 714E+07
136 136E+08173 173E+08176 176E+07186 186E+07168 168E+07
2 51 510E+07 336E+07 125E+0747 470E+0746 460E+0740 400E+0752 520E+0734 340E+07
177 177E+07188 188E+07213 213E+07
24 240E+0725 250E+0726 260E+07
4 77 770E+07 821 E+07 139E+0797 970E+07
104 104E+0860 600E+0767 670E+0791 910E+0778 780E+0783 830E+07
6 48 480E+06 214E+07 439E+07-34 340E+06 r
35 350E+0630 300E+06
ave 28 280E+06260E+05 34 340E+06
stddev 129 129E+081626657 8 22 220E+06 223E+06 125E+05
24 240E+0621 210E+06
18 153 153E+06 352E+06 246E+06225 225E+06198 198E+06
112
22 220E+0615 150E+0616 160E+0662 620E+0660 600E+0684 840E+06
21 179 179 E+06 984E+06 105E+07275 275E+06247 247E+0622 220E+07
3 300E+0627 270E+07
441 E+06 24 254 254E+06 299E+06 101 E+06240 240E+06264 264E+06
30 300E+0637 370E+0658 580E+0620 200E+0631 310E+0616 160E+06
279 279E+06338 338E+06297 297E+06
113
ciprotriglyme Plate countstime (in) count cone (cfuml) average std dev time (out)
0 15 150E+08 654E+08 307E+08 013 130E+0843 430E+0889 890E+0887 870E+0882 820E+0884 840E+0884 840E+0892 920E+08
2 96 960E+08 103E+09 48E+0881 810E+08
116 116E+09164 164E+09169 169E+09 2184 184E+0954 540E+0897 970E+08
128 128E+093 300E+085 500E+087 700E+08
4 55 550E+08 918E+08 363E+0831 310E+0890 900E+0814 140E+0910 100E+09 44 400E+08
90 900E+0899 990E+08
115 115E+09100 100E+0980 800E+08
162 162E+096 0 0
6
time (Out) average std dev0 506E+06 553E+062 121E+09 944E+084 192E+08 166E+086 121E+08 112E+08 I8 140E+06 116E+06
16 900E+05 0 I18 774E+05 980E+05 I
20 120E+06 0 |21 141E+06 110E+06 i
114
24 1642+06 1902+06 8
density773698491 7761707346 2284489805303975749509738
18area
94352 9412+02 2762+019064997397
21
Polymercount cone (cfuml) average std dev
23 2302+03 2432+03 9982+0236 3602+0330 3002+03
2 2002+034 4002+033 3002+032 2002+031 1002+031 1002+03
24
115
count cone (cfuml) average std dev23 2302+04 5062+06 5532+0621 2102+0420 2002+04
114 1142+07103 1032+07120 1202+07
10 1002+0713 1302+079 9002+060 0002+000 0002+000 0002+000 0002+00
87 8702+08 1212+09 9442+0892 9202+08
190 1902+09102 1022+0975 7502+0896 9602+0872 7202+0891 9102+08
167 1672+096 6002+082 2002+08
40 4002+0957 5702+08 1922+08 1662+0825 2502+0836 3602+08
128 1282+0893 9302+07
168 1682+0856 5602+0748 4802+0755 5502+0748 4802+07 1212+08 1132+0851 5102+0790 9002+07
149 1492+08180 1802+08162 1622+08261 260E+0812 i 1202+0839 3902+0870 7002+0539 3902+0565 6502+05
116
3 300E+05 140E+06 116E+0615 150E+0645 450E+0689 890E+05
127 127E+06127 127E+0610 100E+0614 140E+065 500E+058 800E+05 774E+05 918E+05
19 190E+0629 290E+06
199 199E+05225 225E+05213 213E+0523 230E+0525 250E+0525 250E+0536 360E+05 141 E+06 110E+0692 920E+0594 940E+0553 530E+0582 820E+0567 670E+05
8 800E+058 800E+05
10 100E+06169 169E+06142 142E+0624 240E+0645 450E+0629 290E+0625 250E+04 164E+06 190E+0629 290E+0452 520E+046 600E+048 800E+041 100E+04
139 139E+0610 100E+0638 380E+0662 620E+0632 320E+0621 210E+0634 340E+06
117
BMA Plate counts
time (in) count cone (cfuml) average std devO 53 530E+07 974E+07 377E+07
59 590E+0759 590E+0784 840E+07
123 123E+08139 - 139E+08
9 900E+0717 170E+0810 100E+08
2 23 230E+07 357E+07 441 E+0723 230E+0720 200E+07
165 165E+0838 380E+0673 730E+06
231 231 E+0724 240E+0739 390E+0729 290E+07
4 17 170E+07 171 E+07 575E+0619 190E+0711 110E+07
220 220E+07213 213E+07228 228E+07
21 210E+0716 160E+0726 260E+07
6 600E+0612 120E+0711 110E+07
6 0 0
118
time(out) average std dev0 499E+07 154E+072 413E+07 179E+074 577E+07 526E+076 129E+07 496E+068 149E+06 912E+05
16 428E+06 018 498E+06 414E+0620 635E+06 021 704E+06 394E+0624 106E+07 225E+06
=
119
Polymercount cone average std dev
27 270E+06 117E+07 13381334127 127E+0732 320E+0743 430E+0739 390E+0640 400E+0636 360E+06 density41 41 OEf 06 404E+05 391 E+0559 590E+06 385E+0554 540E+06 384E+05
area average std dev87061 900566667 21217235669140691703
120
time (out) count cone (cfuml) average std dev0 40 400E+07 499E+07 154E+07
35 350E+0750 500E+0781 810E+0770 700E+0757 570E+07
408 408E+07386 386E+07367 367E+07
2 37 370E+07 413E+07 179E+0725 250E+0736 360E+0765 650E+0777 770E+0734 340E+0725 250E+0731 310E+07
4 46 460E+07 577E+07 526E+0733 330E+0732 320E+07
158 158E+0892 920E+07
130 130E+0813 130E+079 900E+066 600E+06
6 92 920E+06 129E+07 496E+0672 720E+0688 880E+06
9 900E+067 700E+067 700E+06 - -
169 169E+07192 192E+07191 191E+0720 200E+0714 140E+0724 240E+07
101 101E+07119 119E+07149 149E+07
10 100E+0712 120E+07
11 110E+078 46 460E+05 149E+06 912E+05
13 bull130E+05|
121
13 130E+05191 191E+06217 217E+06244 244E+06
18 180E+0624 240E+0620 200E+06
18 46 460E+06 498E+06 414E+0654 540E+0646 460E+06
3 300E+064 400E+06
18 180E+0738 380E+0655 550E+0652 520E+0622 220E+0613 130E+0622 220E+06
21 26 260E+06 704E+06 394E+0631 310E+0644 440E+06
3 300E+063 300E+063 300E+06
93 930E+0699 990E+06
106 106E+0716 160E+07
8 800E+067 700E+06
62 620E+0671 710E+0675 750E+06
8 800E+0615 150E+07
3 300E+0624 90 900E+06 106E+07 225E+06
89 890E+0690 900E+0613 130E+0713 130E+0711 110E+07
111 111E+0797 970E+0E
107 107E+07V 140E+077
i 5 130E+07
122
15 150E+0787 870E+0680 800E+06
124 124E+077 700E+06
10 100E+078 800E+06
123ciproBMA Plate countstime (in) count cone (cfuml) average std devO 80 800E+07 490E+07 212E+07
64 640E+0777 770E+0742 420E+0755 550E+0753 530E+0726 260E+0723 230E+0721 210E+07
2 31 310E+07 592E+07 235E+0731 310E+0743 430E+0759 590E+0764 640E+07
114 114E+0867 670E+0764 640E+0760 600E+07
4 75 750E+07 572E+07 206E+0770 700E+0786 860E+0742 420E+0738 380E+0732 320E+07
6 000
II
1 2 4
time(out) average std dev0 444E+07 154E+072 478E+07 203E+074 404E+07 198E+076 236E+07 125E+078 185E+05 104E+05
16 284E+06 018 328E+06 557E+0620 374E+06 021 386E+06 528E+0624 210E+06 580E+05
PolymerPlates were all blank for every dilution
11
~
125
15time (out) count cone (cfuml) average std dev
0 31 310E+07 427E+07 153E+0728 280E+0737 370E+0749 490E+0749 490E+0749 490E+0779 790E+0733 330E+07
2 29 290E+07 478E+07 203E+0725 250E+0717 170E+0767 670E+0781 810E+0768 680E+0745 450E+0748 480E+0750 500E+07
4 52 520E+07 404E+07 198E+0750 500E+0756 560E+0755 550E+0772 720E+07
147 147E+07143 143E+0728 280E+0722 220E+07
6 24 240E+07 236E+07 125E+0749 490E+07
138 138E+07126 126E+07150 150E+07
12 120E+0716 160E+0713 130E+0742 420E+0734 340E+0728 280E+07
8 11 110E+05 185E+05 104E+0524 240E+0532 320E+0580 800E+04
117 117E+0591 910E+0434 340E+05
18 56 560E+04 328E+06 557E+0660 600E+04
126
57 570E+046 600E+044 400E+049 900E+04
82 820E+0581 810E+0585 850E+0515 150E+0611 110E+067 700E+05
152 152E+07137 137E+07142 142E+07
21 183 183E+07 386E+06 528E+06111 111E+07126 126E+07186 186E+06159 159E+06148 148E+06
10 100E+0616 160E+0615 150E+0666 660E+0584 840E+0561 610E+0522 220E+0610 100E+0615 150E+06
24 22 220E+06 210E+06 580E+0524 240E+06
131 131E+06167 167E+06141 141E+0620 200E+06 - -
28 280E+0630 300E+06
127
APPENDIX H
M athematical Theory
128
M ATHEM ATICAL THEORY
Kwok (1997) used Basmadjian and Sefton to determine that the drug concentration
immediately next to the polymer in a tube was
CZCNkill rD ) = A [ (xr0)ReSc]13 where (xroReSc)lt104-103
Cs - surface concentration (|igcm5)
Nkill - minimum killing release rate (|Jgcm2s)
R0 - effective hydraulic radius (cm)D - diffusivity of ciprofloxacin in fluid (cnfs)A - constant for geometry x - axial distance from the entrance (cm)
Re - Reynoldrsquos number Sc - Schmidt number
Laminar flow with constant velocity v was used estimate Nkill as 57 x 10J pgcnrs
using the equation above
The ciprofloxacin impregnated polymers were assumed to behave as if dissolution
into a falling film was occurring allowing Pickrsquos second law of diffusion to be modified as
follows
Pickrsquos second law of diffusion
MciZMt = Dip M2CiZMx2
does not adequately model the controlled-release of ciprofloxacin as it does not take into
consideration the fluid flow over the polymer and results in a t12 release rate A better
129
equation would be
vz(x) McMz = Dip M2CiZMx2
where fluid flow is assumed to be occur in the z direction and diffusion is assumed to be in
the x direction The following boundary conditions should be sufficient for the situation
encountered in the flow cell over the first 24 hours
I) O gt Il O at N Il O
2) O gt Il O at y mdash co
3) O gtIl O pound at
OIlThe solution therefore is
CaZCao = erfc [yZ(4DzZvmax)]
130
APPENDIX I
Polymer Surface Area Measurements
131
POLYMER Date of experiment Surface area (mnV)Control 6997 72578
62897 6550372697 76102
Triglyme 8897 9455881097 9458882297 83026
Ciprotriglyme 81697 9064982497 9739782997 94352
BMA 83197 870619797 9140692197 91703
CiproBMA 9597 8818191497 8760691997 85282
MONTANA STATE UNIVERSITY LIBRARIES
3 1762 10302039 O
1
i

TABLE OF CONTENTS
SUMMARY 43
BIBLIOGRAPHY 45
APPENDICES 50
APPENDIX A - Growth Rate Experiments 51APPENDIX B - FasteethregSusceptibility59APPENDIX C - Hoechst 33342 61APPENDIX D - Ciprofloxacin 65APPENDIX E - Flow Cell Experiments Image Analysis69
Image Analysis 70APPENDIX F - Flow Cell Experiments Total CountsAO 72APPENDIX G - Flow Cell Experiments Viable CountsPlate Counts 103APPENDIX H - Mathematical Theory 127
Mathematical Theory128APPENDIX I - Polymer Surface Area Measurements130
Page
LIST OF TABLES
1 Parameters used for sizing of biologic reactor18
2 Flow channel dimensions and hydraulic parameters 20
3 Specific growth rate for P aeruginosa grown at room temperature with 500 ppmglucose fully aerated 28
4 Summary of Hoechst 33342 studies28
5 Description of polymers used in flow cell experiments 30
6 Ciprofloxacin concentrations in effluent 42
Table Page
vii
LIST OF FIGURES
Figure Page
1 Biofiltn formation 5
2 Zero-order first-order and square-root of time release patterns fromcontrolled-release devices 10
3 CSTR setup used to grow P aeruginosa continuously 19
4 Flow cell schematic 20
5 Experimental setup 22
6 BiospaiVConlrol time course of cell adhesion31
7 ControlBiospan polymer bacterial colonization 32
8 Comparison of the extent of colonization of different polymers at 1=24 hours33
9 Direct counts of cell density on the polymer surface after 24 hours34
10 Time course cell colonization curve of control lriglyme ciprolriglymeobtained from image analysis 35
11 Attachment rate differences are evident within the first 6 hours of theflow cell experiments 36
12 Total counts made with Acridine Orange 37
13 Calculated cell density on the ldquolestrdquo polymers using total cell count(acridine orange) data38
14 Plate count data from effluent samples taken from the polymer flowcells during the course of the experiments shows that viable cells are going throughthe flow cell39
15 Cell densities on polymers calculated from plate count data 40
16 Demonstrates the variations in bacterial density on the lriglyme polymerafter twenty four hours using image analysis (IA) acridine orange staining of the effluent and plate counts of the effluent 4f
vm
ABSTRACT
Millions of dollars are spent every year in the US on biomedical implants ranging from commonplace uses such as contact lenses to applications as rare as total artificial hearts One of the main stumbling blocks in the long term usage of these devices is bacterial infection which can only be rectified by the removal of the implant resulting in increased costs and trauma to the patient Consequently four different polymer formulations were studied for their efficacy at preventing bacterial colonization The polymer under investigation was placed in a parallel plate flow cell challenged with fluid containing Pseudomonas aeruginosa for six hours and then exposed to a fluid of nutrients only for the remainder of a twenty four hour run Two different sets
examined by image analysis One set consisted of latrix (BP) coated with triethylene glycol dimethyl
ether (triglyme) while the other set had an additional coating of poly(butyl methy aery late) polyBMA Each set also had one formulation to which a known amount of the antibiotic ciprofloxacintrade had been added The coatings of triglyme and triglyme+BMA cut bacterial colonization in half when compared to the control BP material Wliile the additional factor of the controlled release of ciprofloxacintrade from the materials resulted in more than a two fold reduction in bacterial colonization when compared to the control BP material These polymers therefore hold promise in decreasing the risk of infection encountered during the use of biomedical implants
of test polymers subjected to this protocol were a BioSpaiitrade polyletherurethane (PEU) base n
i
I
IN TR O D U C TIO N
The National Institutes of Health have defined a biomaterial ldquoas any substance
(other than a drug) or combination of substances synthetic or natural in origin which can
be used for any period of time as a whole or as a part of a system which treats augments
or replaces any tissue organ or function of the bodyrdquo Thus biomaterials will have an
impact on virtually everyone at some point in their life
Biomaterials may be used for long term applications such as central nervous
system shunts extended wear contact lenses or hemodialysis systems They may be
employed in short term applications like contact lenses needles for phlebotomy or
vaccination cardiopulmonary bypass systems or wound healing devices Or biomaterials
may be utilized in permanent implants such as heart valves periodental restorative devices
intraocular lenses or orthopedic devices(NIH Consens 1982)
AU biomedical implants are susceptible to bacterial colonization and subsequent
biofilm formation Biofilms are three dimensional gelatinous structures consisting of
adherent bacteria and insoluble polysaccharides secreted by the bacterial cells Bacteria use
the biomaterial as a substratum to which they attach and adhere resulting in a biomaterial
centered infection Biofilm infections are extremely difficult to eradicate The biofilm gel
matrix cannot only keep the host defense mechanisms from reaching andor recognizing the
adherent bacteria but biofilms can also lower the efficacy of antibiotics Usually the only
way to deal with a device-centered infection is to remove the infected implant which is
costly as well as traumatic to the patient Therefore it is desirable to develop a material that
wiU inhibit bacterial colonization
The objective of the research presented in this thesis was to ascertain the
effectiveness of four different formulations of a biomedical grade polyurethane Biospantrade
at inhibiting bacterial colonization under flow conditions The scope of this work
2
included (I) evaluation of four Biospantradepolyethylene glycol (PEG) matrix biomaterials
two of which contained the antibiotic ciprofloxacin (2) development of a flow cell system
to evaluate the potential for bacterial adhesion and biofilm formation and (3) development
of a novel staining technique to allow for the visualization of bacteria against an opaque
surface without interfering with normal cell behavior
3
LITERA TU RE REVIEW
Background and Significance
Biomaterials have been used in the human body since the early 1900s when bone
plates were introduced to stabilize fractures and speed healing By the 1950s
experimentation into the replacement of blood vessels had begun and by the 1960s
artificial hip joints and heart valves were under development As science and engineering
has advanced so has the clinical use of biomaterials(Blanchard 1996 NIH Consens
1982)
Biomedical implants are no longer used just in life-threatening situations They are
now utilized in every major body system for three general purposes (I) to preserve life or
limb (2) to restore or improve function and (3) to restore or improve shape The first
category includes most neurosurgical and cardiovascular implants such as pacemakers
and hydrocephalus shunts Dental implants and joint replacements are included in the
second category while biomaterials used in reconstructive surgeries are placed in the last
class(NIH Consens 1982)
Estimates in 1982 placed biomaterial implant use in the United States for that year at
several million The demand for biomaterials is said to grow by 5 to 15 percent a year and
will only increase as the population ages and the expectations of maintaining a good quality
of life increase What was a multi-million dollar per year industry in the US now exceeds
$10 billion a year This figure is especially remarkable given that the US only represents
about 10 percent of world demand (Blanchard 1996 NIH Consens 1982 Brictannica
Online 1997)
One of the major risks encountered in the extended use of implants is the
susceptibility of biomaterials to bacterial attachment and adhesion resulting in biomaterial-
4
centered infections The three most common bacterial species implicated in these infections
are Pseudomonas aeruginosa Staphylococcus epidermidis and Staphylococcus aureus
Esherichia coli Proteus mirabilis and beta hemolytic Streptococcus spp have also been
isolated from contaminated implants (Gristina 1987 Gristina 1994)
Once bacteria begin adhering to implant material they can form a biofilm that is
extremely difficult to eradicate The biofilm can not only prevent the host defense
mechanisms from reaching andor recognizing the bacteria but it can also lower the
efficacy of antibiotics Usually the only way to deal with biofilm infections is by removal
of the implant which can be costly as well as traumatic to the patient (Blanchard 1996
Gristina 1987 Gristina et al 1993) Tlierefore it is desirable to develop a biomaterial
that will inhibit bacterial colonization
There are two common approaches to preventing bacterial colonization The first is
to modify the substratumrsquos surface chemistry rendering it non-adhesive and the second is
to design a material which will slowly release an antibacterial agent killing the bacteria
before they reach the surface (Bryers 1997)
Processes G overning Biofilm Form ation
The establishment of a biofilm (figure I) involves many steps (I) preshy
conditioning of the surface by adsorption of organic molecules (eg protein) from the fluid
phase (2) cell transport to the substratum (3) cell adsorptiondesorption (4) permanent
adhesion to the surface (5) cellular metabolism (growth replication death) and (6)
biofilm removal (detachment and sloughing) Pre-conditioning involves coating the
surface with host- derived proteins such as fibronectin human serum albumin and
platelets (Tebbs Sawyer and Elliot 1994 Carballo Ferreiros and Criado 1991 and
Yu et al 1995) Cell transport to the surface may occur through passive processes such
5
as diffusion or fluid flow or active processes such as flagellar movement Reversible
adsorption (adsorptiondesorption) of cells to the substratum can be explained in terms of
the laws of colloid chemistry such as the Derjaguin-Landau and Verwey-Overbeek
Figure I Biofilm formation (I) pre-conditioning (2) cell transport to surface (3) cell adsorptiondesorption (4) permanent adhesion (5) proliferation and (6) removal
(DLVO) theory Electrostatic forces and London-van der Waals forces combine to bring
particles andor cells to a surface by helping to overcome energy barriers allowing the cells
to form a loose attachment with the substratum (Eginton 1995 Characklis and Marshall
1990 Weber and DiGiano 1996) Within a certain distance of the substratum permanent
adhesion becomes possible through such mechanisms as specific binding to proteins in the
conditioning film or hydrogen bonding Once at the surface colonization can begin Cells
begin to produce exopolysaccharides (EPS) literally gluing themselves to the surface
6
Within this EPS matrix the cells continue to grow divide and die Occasionally chunks
of the biofilm will detach as a result of either shear forces or weaken of the bonds holding
them to the substratum (Characklis 1990)
Surface M odification
Eveiy natural and synthetic surface has unique physical and chemical properties that
can influence cellular adhesion By modifying the biomaterial surface the fundamental
processes governing biofilm formation can be altered Several review articles discuss these
processes in detail (Cristina et al 1994 Cristina Naylor and Myrvik 1992 Bryers
1988 Characklis 1990 Dankeit Hogt and Feijen 1986) and acknowledge the similarities
between bacterial colonization and tissue integration In many situations host cells are
actually competing with bacteria to colonize the biomaterial surface Thus many surface
modifications are aimed at intentionally promoting natural tissue adhesion while others are
directed at preventing bacterial adhesion
M odifications Host Cell A dhesion
Techniques focused on promoting tissue integration range from endothelial cell
sodding to glow plasma discharge modification (Williams et al 1992 Massia and
Hubbell 1991) The coating of silicone rubber membranes with poly (2-hydroxy ethyl
methacrylate) (poly HEMA) by glow plasma discharge has shown encouraging results in
vitro with regard to the attachment and growth of corneal epithelial cells bringing the
development of an artificial cornea one step closer to reality (Lee et at 1996)
7
Hydroxylapatite (HA) coatings of bone implants have already proven effective at promoting
faster and greater bone adaptation and improving implant fixation Better techniques of
applying the calcium phosphate to the implant are being examined including plasma spray
heat-treated plasma spray and magnetron-sputter (Hulshoff et al 1996) Carbon
deposition excimer laser ablation and photochemical coatings are being examined as ways
of promoting and controlling endothelial cell proliferation (Kaibara et al 1996 Doi
Nakayama and Matsuda 1996) Surface modifications may also decrease the binding of
host proteins such as thrombin and anti thrombin III thereby lowering the potential to form
blood clots which can promote bacterial adhesion A common method of accomplishing
this is by immobilizing heparin on the surface (Byun Jacobs and Kim 1996 Paulsson
Gouda Larm and Ljungh 1994 Lindhout et al 1995)
M odifications Bacterial Cell A dhesion
Methods for inhibiting bacterial colonization range from antithrombogenic coatings
to the incorporation of antimicrobial substances such as silver or quaternary amine salts (
Wang Anderson and Marchant 1993 Ryu et al 1994 Jansen and Kohnen 1995)
Heparin is only one of the substances used to coat surfaces which have been shown to
decrease bacterial adhesion due to protein-mediated adhesion Poly(vinyl pyrrolidone)
(PVP) coatings which inhibit the adsorption of fibrinogen to the surface have also exhibited
decreased bacterial adhesion (Francois et al 1996) Reductions in bacterial adhesion to
silastic catheters coated with salicylic acid a nonsteroidal anti-inflammatory drug have
been demonstrated in vitro (Farber and Wolff 1993) Coatings of hydrophilic polymers
such as polyethylene glycol (PEG) have shown potential for inhibiting implant-related
infections (Portoles Refojo and Leong 1994) Latex catheters coated with
8
glycomethacrylate gel another hydrophilic polymer have also demonstrated the ability to
reduce infection The reduction was enhanced by the incorporation cephalothin an
antibiotic (Lazarus et al 1971) The elution of an antimicrobial from the implant is one
of the most popular and oldest methods of dealing with biomaterial-centered infections
illustrated by the use of antibiotic impregnated bone cement (Strachan 1995 Seyral et al
1994) As already seen however the incorporation of antibiotics and other antimicrobials
has also been studied with regard to various polymer systems (Rushton et al 1989
Ackart et al 1975 Golomb and Shplgelman 1991 Greenfeld et al 1995) As
knowledge about the immune system increases so does the potential for developing new
substances that can coat biomaterials or be released from them to provide protection against
bacterial colonization as witnessed by development of passive local immunotherapy
(Gristina 1997)
Controlled Release
Controlled release of antibiotics at the site of implantation is one of the more
common approaches to preventing infection and is being used successfully in orthopedic
surgery A recent US survey showed that 27 of responding hospitals commonly use
antibiotic impregnated bone cement for joint replacement surgery (Strachan 1995)
However the use of bone cement is not recommended in younger active people
Consequently the controlled release of antibiotics from coated implants is under
investigation (Price et al 1995) Thus it can be seen that there are several different types
of controlled release systems
9
Controlled Release System s
Controlled release devices are classified by the method that controls the release of
the substance of concern The most common classifications are diffusion controlled
systems chemical reaction systems and solvent activated systems There are several
excellent books and articles that cover this subject in depth (Langer and Wise 1984 Kost
and Langer 1984 Fan and Singh 1989 Baker 1987 Lohmann 1995 Kydonieus 1992
Robinson and Lee 1987) so only a brief overview will be given here
Controlled release systems can be designed to produce release rate profiles that
enhance the efficacy of the desired agent This is in contrast to sustained release devices
which allow the substance of concern to be effective longer but are dependent on
environmental factors when it comes to the amount and the rate of release
The three most common release profiles achieved by controlled release devices are
(I) zero-order release (2) first-order release and (3) t 12 release shown graphically in
figure 2 Zero-order release is the most desired release rate and is most easily obtained
by using diffusion controlled release systems (Kost and Langer 1984 Lohmann 1995)_
D iffusion Controlled D ev ices There are two general types of diffusion
controlled systems (I) matrix or monolithic and (2) reservoir The rate limiting step in
both systems is the diffusion of the drug through the polymer matrix which may be
described by (l)F ickrsquos first law of diffusion and (2) Pickrsquos second law of diffusion also
called the diffusion equation (Bird Stewart and Lightfooi 1960) For a one dimensional
system they may be written as
10
Release rate kinetic
^ first-order release
square-root of time release
zero-order release
Figure 2 Zero-order first-order and square-root of time release patterns from contolled-release devices
( 1 ) Ji = - D ip raquo d c d x
(2) bCjbt = Djp trcb2
Ji - mass flux of solute (drug) i
Ci - concentration of solute i
x - position of release
t - time
Djp - solute diffusion coefficient through the polymer
11
Equation (I) is commonly used to simulate the release rates from reservoir devices
The diffusion coefficient is a measure of the mobility of the individual solute molecules
through the reservoir membrane and is considered concentration independent The
concentration gradient in the membrane is represented by dCdx The negative sign reflects
the movement of solute down the concentration gradient toward more dilute regions If the
membrane is saturated with solute a burst effect may be seen which causes an initial spike
of solute A lag effect occurs when the solute must first permeate the membrane before it is
released (Baker 1987 Langer and Peppas 1981)
Equation (2) is obtained by combining equation (I) with the continuity equation for
mass transfer assuming no reaction and zero velocity Equation (2) describes transient
diffusion in membranes The diffusion coefficient is considered to be concentration
dependent It results in the square root of time release rate for simple geometries such as a
one-dimensional slab (Baker 1987 Langer and Peppas 1981) Detailed discussions on
the applications assumptions and solutions of both these equations can be found in the
literature (Langer and Wise 1984 Kost and Langer 1984 Fan and Singh 1989 Baker
1987 Lohmann 1995 Kydonieus 1992 Robinson and Lee 1987 Langer and Peppas
1981)
Monolithic devices are made by mixing the substance of concern with the polymeric
material to form a solution from which the finished product is manufactured The drug to
be released may be dissolved or dispersed (supersaturated) in the resulting polymer
depending on how much is ldquoloadedrdquo into the carrier polymer Examples of monolithic
devices include flea collars and antibiotic loaded bone cement
Examples of reservoir systems include nitroglycerin skin patches Norplanttrade a
subcutaneous birth control device and Ocusertrx1 a contact lens like device used to neat
glaucoma In these types of systems the substance of interest is surrounded by an inert
12
membrane which may be either porous or non-porous If the membrane is porous the
drug simply diffuses through the pores but if the membrane is non-porous the drug must
first dissolve in the membrane structure before it can diffuse along and between the
segments of the membrane Reservoir systems are known for the ease with which they can
be designed to achieve zero-order release rates
Both monolithic and reservoir diffusion controlled systems are rate limited by the
diffusion of the drug through the polymer Tlie choice of polymer and the resulting effect
on the diffusion and partition coefficient of the substance of concern as well as the
geometry of the device will influence drug release rates (Kost and Langer 1984 Lohmann
1995)
Chem ically Controlled S ystem s When the substance of concern is encased
in a biodegradable non-diffusive polymer the resulting reservoir device is classified as a
chemical reaction system As seen in the diffusion controlled devices there are two basic
types of biodegradable devices (I) reservoir and (2) monolithic The release rates of these
systems are strongly influenced by the erosion of the polymer In the ideal case surface
erosion would be the only factor affecting the release rate however this system has yet to
be designed (Kost and Langer 1984 Lohmann 1995)
A second category of chemical reaction controlled release is chemical
immobilization In this type of system the substance of concern may be chemically bound
to the polymer carrier backbone or it may he part of the backbone The release rate is then
influenced by the enzymatic or hydrolytic cleavage of the appropriate bonds (Kost and
Langer 1984 Lohmann 1995)
13
Solvent Activated S y s te m s The last class of controlled release devices to
be mentioned here are the solvent controlled systems These fall into two categories (I)
swelling controlled and (2) osmotically regulated In both types the substance of concern
is either dissolved or dispersed within the polymer but it is unable to diffuse through the
polymer matrix until activated In the case of the swelling controlled system the solvent is
absorbed by the matrix causing the polymer to swell and allowing the active agent to
diffuse out In the osmotic system the solvent permeates the polymer-drug system due to
osmotic pressure which promotes release Release may occur by either simple Fickian
diffusion or by non-Fickian diffusion Detailed analysis of these and other controlled
release systems can be found in the references cited previously
A dvantages Controlled release systems offers several advantages over
conventional drug delivery systems The major advantage when dealing with biomaterial
centered infections is increased efficacy of the drug The drug can be administered at the
biomaterial site thereby allowing the therapeutic levels to be maintained locally while
decreasing the systemic drug level This will minimize side effects and improve
pharmokinetics In addition the effective drug level can be sustained for an extended
period of time (Kost and Danger 1984 Lohmann 1995)
The use in joint replacement surgery of antibiotic impregnated bone cement
combined with a polymer coating such as poly-L-lactic acid polymer (PLLA) has proven
popular for its ability to prevent infections as well as aid in joint fixation (Strachan 1995)
Controlled release of antibiotics from biomaterials is less common however in operations
involving other types of implants Nonetheless research in being done into this method of
inhibiting bacterial colonization A British study showed that antibiotic impregnated
silicone rubber coatings of implanted stimulator devices significantly decreased
14
postoperative infection when compared with systemic antibiotic prophylaxis (Rushton e t
al 1989) One of the newer antibiotics receiving attention as a treatment for biomaterial-
centered infections is ciprofloxacin
C iprofloxacin
Ciprofloxacin is a Iluorinated quinolone antimicrobial agent It is active against a
broad range of bacteria ranging from aerobic gram-negative bacteria to aerobic gramshy
positive bacteria Anaerobic bacteria however are not affected by ciprofloxacin It was
approved by the Food and Drug Administration in October 1987 (Wolfson and Hooper
1989 cponline 1997)
Like other quinolone agents ciprofloxacin is a synthetic antimicrobial which mainly
effects DNA gyrase the bacterial topoisomerase II The gyrase is a two subunit enzyme
responsible for regulating the supercoiling of DNA during replication and transcription
The A subunit of the gyrase introduces nicks in the DNA that allow the B subunit to twist
the single stranded DNA (ssDNA) around its complementary strand of DNA The A
subunit of the gyrase then seals the nicks It is believed that ciprofloxacin and the other
quinolones interfere with the A subunit preventing it from sealing the nicks Bactericidal
levels of quinolones do not affect mammalian topoisomerase enzymes The exact bacterial
killing mechanism is not known but detailed discussions about the mechanisms of
quinolones action can be found in WolfSon and Hooper (1989) It is known that both slow
growing and fast growing organisms are inhibited by ciprofloxacin and that a prolonged
post-antibiotic effect is exhibited by fluoroquinolones (Wolfson and Hooper 1989
cponline 1997 Craig and Ebert 1991 Cam pa Bendinelli and Friedman 1993)
15
Ciprofloxacin has the lowest minimum inhibitory concentration (MIC) of the
quinolones The MIC90 for P aeruginosa in vitro is between 025 (igml and I jigml
Thus ninety percent of the P aeruginosa strains will be inhibited at these low
concentrations (Craig and Ebert 1991 Campa Bendinelli and Friedman 1993) Due to
its wide antimicrobial range and low MIC ciprofloxacin was chosen as a model antibiotic
for incorporation into the test PEU polymers
16
MATERIALS AND METHODS
Bacteria and Cultures
Pseudomonas aeruginosa (ERC-I) was obtained from the National Science
Foundation Engineering Research Center for Biofilm Engineering Montana State
University Bozeman MT Cultures of P aeruginosa were stored as frozen stocks
maintained in a solution of 2 peptone and 20 glycerol at -70degC
Solutions
M edium
A minimal salts medium with glucose as the sole carbon source was used for
culturing bacteria A one liter solution consisted of 05g glucose 256g Na2HPO4 208 g
KH2PO 4 IOg NH4Cl Olg CaCl2 05g MgSO4 and 002ml of a trace metals solution
The trace metal solution was composed of 05 CuSO4-SH2O 05 ZnSO4-VH2O 05
FeSO4-VH2O and 02 MnCl2-4H20 all in a weight per volume ratio dissolved in 10
concentrated HCl (Manual of Industrial Microbiology and Biotechnology 1986) The trace
metals solution was autoclaved separately from the nutrient medium as was a 5M CaCl2
solution and a 2SM MgSO4 solution The glucose trace metals CaCl2 and MgSO4 were
all added to the sterile medium by injection through a septum after the medium had been
brought to room temperature All solutions were filler sterilized through a 02 |im sterile
syringe tip filter (Coming) before addition to the medium AU solutions were made using
Nanopure water (Bamstead ultrapure water system Nanopure system) and autoclaved in
glass containers at 121degC for 15 minutes per liter
17
CvtologicaI Stains
A 005 solution of Acridine Orange used for epifluorescent total cell counts was
filter sterilized using an autoclaved filter apparatus Hoechst 33342 (Sigma) was obtained
in IOOmg quantities and stored in a O0C freezer until a fresh solution was needed Then
IOml of sterile nanopure water were added through a 02 jam sterile syringe tip filter to
dissolve the powder Once the Hoechst solution was made it was kept in the refrigerator
All stains were stored in light sensitive bottles and made at fresh at least once a month
C iprofloxacin
Ciprofloxacin hydrochloride was obtained from Miles Inc as 867 fag
ciprofloxacinmg A 10000 fagml stock solution was made by dissolving 1153 mg of
powder in 10 ml of sterile nanopure water Tlte stock solution was stored in a light
sensitive glass container in the refrigerator for up to one year as per the supplierrsquos
recommendations
D etection A Milton Roy Spectronic 1201 spectrophotometer was used to
determine the proper wavelength for detecting ciprofloxacin Effluent samples were
collected from the flow cell filtered through a 02 (am sterile syringe tip filter (Corning)
and stored in amber microcentrifuge tubes kept in a 0degC freezer until analysis A Milton
Roy Spectronic 601 set at 339 nm was used to determine the concentration of ciprofloxacin
in the effluent from the flow cell_
18
Reactors and Flow Cell Systems
Continuouslvrstirred Tank Reactor (CSTR)
A CSTR was designed to provide a constant supply of Pseudomonas aeruginosa
at room temperature (230+3degC) in exponential growth A 125 ml filter flask was equipped
with an inlet outlet aerator and injection port to build the CSTR The arm of the filter
flask was situated so that overflow occurred when a volume of 128 ml was reached
Table I lists the parameters used for sizing the CSTR At steady-state operation tire
specific growth rate p is assumed to be equivalent to the dilution rate D Figure 3
shows a schematic of the chemostat setup The outlet lube from CSTR was connected to a
Specific growth rate (|_t) 0467+ 0025 hr1 (Appendix A)Volume (V) 128 mlVolumetric flow rate (Q) 10 mlminTable I Parameters used for sizing of biologic reactor
waste jug unless cells were needed for an experiment in which case the CSTR was
connected to a collection vessel A fresh clean sterile collection flask was used for every
experiment The setup was dismantled cleaned and sterilized at least once every two
weeks
Flow C ell
A schematic of the flow cell used to evaluate the test materials can be seen in figure
4 The polymer sample (P) was placed on a clear polycarbonate base which had entrance
and exit stainless steel portals milled into it A white FDA vinylnitrile rubber (D) gasket
19
Collectionvessel
CSTR
Figure 3 CSTR setup used to grow P aeruginosa continuously
was used to equalize sealing pressure around the polymer sample as the assembly was
screwed together A thin gauge natural latex rubber (C) gasket was clamped between the
test sample and coverglass (B) to form the flow channel The coverglass was glued over a
hole in the clear polycarbonate cover using the denture adhesive Fasteethreg Table 2
lists the dimensions of the flow channel and various hydrodynamic parameters AU of
the materials used in the flow cell were sterilized by dipping the components in 70 ethyl
20
Figure 4 Flow cell schematic (A) clear polycarbonate cover with hole through center for viewing (B) 2 glass coverslip (C) thin gauge natural latex gasket (D) white FDA vinylnitrile rubber sealing gasket (E) clear polycarbonate base (P) test
polymer
alcohol rinsing with sterile nanopure water and exposing to UV light for at least 15
minutes The test polymers were not exposed to UV The How cell was assembled
under a laminar flow hood to ensure sterility
Table 2 Flow channel dimensions and hydraulic parameters
width (w) 16 mmlength (I) 44 mmdepth (d) 08 mmarea (A) 128 mmwetted perimeter (P) 336 mmhydraulic radius (Rh) 04 mmReynolds number (Rp) 2 1entrance length (Lp) 01 mmwall shear stress (Jfl) 203 dynecnri
21
Microscope Setup and Techniques
Polym er A nalysis
The polymer samples were tested for bacterial adhesion and growth using an image
analysis system seen in figure 5 For the first six hours of the experiment approximately
5 x IO8 cellsml of stained Pseudomonas aeruginosa were flowed over the test polymer at
a rate of 10 mlmin For the remainder of the experiment complete medium without
bacteria was pumped through the flow cell
Hoechst 33342 Staining Procedure P aeruginosa in log growth were
collected and stained with lOpgml of Hoechst 33342 Once the stain was added to the
cells the flask containing the mixture was wrapped in foil and put on an insulated stir plate
for three hours After three hours the suspension was poured into a sterile centrifuge bottle
and centrifuged at 10000 xg for 15 minutes in a 20degC centrifuge (Sorvall Instruments
Dupont model RC5C GSA rotor) The liquid was then poured off and the cells were
resuspended in sterile complete medium minus the glucose The cells were washed twice
more before placing them in a sterile 125 ml Erienmeyer flask with a stir bar at a
concentration of approximately 5 x 10s cellsml This procedure was repeated every two
hours until the flow cell feed was switched to complete medium only at hour six
Cell V isualization At t=0 the flow cell was place on the stage of an
Olympus BH-2 Epi-Illumination UV upright microscope equipped with Olympus filter
combinations encompassing the ultra-violet violet blue and green regions of the
spectrum A 40x Nikon water immersion objective was used since the flow channel was
22
greater than 0100 mm in depth A minimum of three fields was captured by an Optronics
OPDEI-470OT cooled color CCD camera The resulting image was processed by a Targa
64+ analog digital converter (ADC) card and stored on computer until the image could be
analyzed using Image Pro Plustrade Images were taken every two hours until t=6 hours
when the feed was switched from the cell suspension to sterile complete medium The
remaining four time points captured were (I) t=7 or 8 hours (2) t=16 or 18 hours (3)
t=20 or 21 hours and (4) t=24 hours
Waste
Figure 5 Experimental setup Feed container = cell suspension t=0-6 hrs after t=6 hrs feed = complete medium Flow rate through flow cell 10 mlmin
23
Cell density calculations Tlie software system Image Pro Plus was used to
determine the density of cells on the polymer surface At the beginning each experiment an
image of a micrometer was taken to allow for the calibration of cell size and image area
Actual cell counts could be obtained at the early time points Cell density calculations were
then simply a matter of dividing cell count by the viewing area At time points greater than
8 hours the area occupied by cells was used to give a range for the cellular density This
was accomplished by dividing the area covered by the high and low published values for P
aeruginosa cell area (Holt 1994) to calculate cell numbers This method proved to be valid
as the cells numbers obtained at the early time points fell within the high and low range of
cell numbers calculated using area covered
In addition samples from both the inlet and outlet of the flow cell were collected for
total cell counts and viable cell counts Total counts and viable counts were also conducted
on a sample of the solution in which the polymer was placed at the end of the experiment
Before any sample was removed for these tests the polymer was sonicated for 30 seconds
to remove adherent bacteria This allowed for the calculation of cell density on the polymer
using total cell counts and viable cell counts
Total Cell C ounts A portion of each sample collected from the inlet outlet
and sonicated polymer solution was used to determine total cell counts One milliliter of
005 Acridine orange was combined with one milliliter of 2 glutaraldehyde and the
appropriate dilution of sample This solution was poured over a black polycarbonate
membrane (pore size 022 pm and 25 mm diameter Fisher Scientific) placed in a cell free
glass Millipore filter apparatus Suction was applied to trap the cells on the membrane
The membrane was mounted on a slide by putting a drop of oil (non-drying immersion oil
type FF) on a microscope slide placing the membrane cell side up on top of the oil drop
24
followed by a second drop of oil and covering with a glass cover slip The slide was
examined under fluorescent microscopy Bacteria were counted using an Reichert-Jung
Microstar IV model UV microscope with a mercury lamp and a Reicheit IOOx oil
immersion objective Total counts ( cellsgrid) were then converted to total cellsml using
the following conversion
total cells (cell count) (dilution) (conversion factor) ml ~ sample volume
where the conversion factor was 227 x 10
Viable Counts A part of the cell suspension sample was used to make serial
dilution for plating onto plate count agar (Difco Laboratories) plates A I(K) pl multipipetor
(Rainin epd 2) was used to dispense ten 10 pi drops of properly diluted cell suspension
onto a plate This procedure was performed in triplicate for each dilution plated Plates
were incubated at room temperature for 24 hours Drops that contained between 3 and 30
colonies were counted and converted to colony forming units (cfu)ml by taking into
account the dilution factor (Miles etal 1938)
Susceptibility and Adhesion Effect Studies
C iprofloxacin
Growth curves carried out in batch were used to determine the susceptibility of
increasing concentrations of ciprofloxacin on P aeruginosa These tests were not carried
out as most traditional MIC assays Studies here were performed as per the procedures of
25
Nodine and Siegler 1964 Lennette et al 1985 starting with a cell concentration of IO6
cellsml P aeruginosa was grown in separate batch cultures which contained various
concentrations of ciprofloxacin At time points ranging from t=0 to t=24 hours samples
were taken for viable counts
Hoechst Stain 1333421
Susceptibility studies were also conducted on Hoechst 33342 to ensure that the
stain did not interfere with normal cell growth The studies were conducted in the same
manner as the ciprofloxacin tests Concentrations of Hoechst stain examined ranged from
Ojagml (control) to 50|igml
Fasteethreg
Studies were also carried out to ensure that the denture adhesive Fasteethreg used
to glue the coverglass to the polycarbonate cover of the flow cell had no negative effect on
the growth of bacteria These studies were conducted in the same manner as those for
ciprofloxacin and the Hoechst stain
Hoechst Stain Effects on P a e r u g in o s a Adhesion
Tests were performed to determine whether the Hoechst stain interferes with the
normal adherence of the cells to a surface The flow cell was assembled without a polymer
sample and an untreated cell suspension was run through the cell for four hours Since the
base of the flow cell is a clear polycarbonate light microscopy could be used to monitor
cell adhesion using video recording Experiments were also carried out using stained cells
still in the staining liquid and stained cells that had been washed and resuspended in
ldquocleanrdquo medium
2 6
The possibility of ciprofloxacin and Hoechst interfering with each other was also
investigated Plate counts were used as in the susceptibility studies Microscope slides
were also made and any change in staining ability was noted
Tubing
All of the tubing used was FDA approved MasterFlex (Cole Palmer) for use with
either pharmaceuticals or food Tubing used included Pharmedreg size 1314 and 16
Norprenereg Food size 13 and 14 and Tygonreg Food size 14 Before each use it was
sterilized by autoclaving at 121degC for 15 minutes
Biom aterial Fabrication
BP Control Polym er
A poly (ether) urethane (Biospantrade) poly ethylene glycol (PEG) film (BP) was
prepared for use as a control The method of fabrication was as follows (I) 20 ml of
deionized water was used to dissolve 2 g of PEG (Polyscience) (2) the resulting solution
was lyophilized and the powder was sieved to obtain 90 pm or smaller particles (3) this
powder was mixed with a 24 Biospantrade solution (Polymer Technology Group Inc) (4)
the polymer solution was degassed transferred to a Teflon mold (Chemware) and
incubated at 60degC for one day and finally (5) the film was dried completely in a vacuum
chamber
27
Test Polym ers
The test polymers were manufactured by the same procedure except the
ciprofloxacin containing films also had an equal amount of ciprofloxacin added in step (I)
In addition the test polymers were coated with either triethylene glycol dimethyl ether
(triglyme) or tiiglyme plus n-butylmethacrylate (BMA) by glow discharge plasma
deposition (GDPD)
Note All test materials were fabricated at the University of Washington by Connie
Kwok
2 8
RESULTS AND DISCUSSION
Pseudomonas aerueinosa Growth Experiments
Batch S tud ies
Growth Rate Studies were conducted to determine the growth rate of P
aeruginosa under experimental conditions Table 3 (Appendix A) The specific growth
rate (I was found to be 0467 hr1
Experiment specific growth rate (h r1)I 04802 05023 04444 04436Average 0467plusmn0025Table 3 Specific growth rate for P a eru g in osa grown at room temperature with SOOppm
glucose fully aerated
Susceptibility S tu d ies In addition susceptibility studies were done on
ciprofloxacin Hoechst 33342 and Fas teethreg (Appendices BC and D) The
ciprofloxacin tests confirmed the published M IC90 of l(igml The Hoechst stain (33342)
were shown not to inhibit growth at 10 |_igml Table 4 summarizes the results of the
Hoechst 33342 susceptibility tests Results from the Fasteethreg susceptibility studies show
no negative effects on P a eru g in o sa
Hoechst 33342 concentration (pgml) Growth inhibited0 No5 No10 No50 YesTable 4 Summary of Hoechst 33342 studies
29
Flow Cell Experimental Protocol
The concentration of resuspended bacteria used to challenge the test polymers was
roughly 5 x IO8 cellsml The flow rate to the parallel plate flow cell was maintained at
approximately 10 mlmin for the duration of each experiment Samples were taken for
total counts and viable counts from both the system influent and the effluent at t = 0 2 4
and 6 hours for every experiment Only effluent samples were collected after t = 6 hours
Effluent samples were also used to determine if any ciprofloxacin eluted from the test
polymers containing the antibiotic All the experiments were earned out at room
temperature in the medium previously described
Flow Cell Experiments
The ability of a polymer to affect bacterial adherence and colonization was examined
in flow cell experiments run on four different formulations of a poly (ether) urethane (PEU)
base material The control material (BP) was a PEU base matrix (Biospantrade) containing
poly (ethylene glycol) (PEG) as a pore forming agent
The materials tested included (I) triglym e BP coated with triethylene glycol
dimethyl ether (triglyme) (2) ciprotriglym e BP made up of equal parts PEG and
ciprofloxacin coated with triglyme (3) BM A BP coated with a layer of n-
butylmethacrylate (BMA) underneath the triglyme coating and (4) ciproBM A BP made
up of equal parts PEG and ciprofloxacin coated with BMA followed by triglyme (Table
5) The triglyme coating was used to control the release rates of the model antibiotic
ciprofloxacin
30
Polym er FormulationBPControl BiospanlivV PEG (poly ethylene glycol)triglyme Triethylene glycol dimethyl ether coated BPciprotriglyme BP made with equal parts PEG and ciprofloxacin coated with triglymeBMA BP coated with n-butylmethacrylate followed by a coating of tryiglmeCiproBMA BP made with equal parts PEG and ciprofloxacin coated with BMA
followed by a coating of triglyme
Table 5 Description of polymers used in flow cell experiments
Three samples of each polymer were tested A good representation of the events at
the polymer surface is provided by image analysis (IA) as it is obtained from pictures of
the stained cells on the surface Figures 6 and 7 illustrate the attachment and growth of
P aeruginosa on the control polymer over the course of an experiment Figure 8
displays the differences in cell density on three different polymers after 24 hours in the
flow cell A significant decrease in bacterial adhesion and colonization was evident when
the test polymers were compared to the BP polymer at the end of the experiments and over
the entire run using pictures taken for TA (figures 6 7 and 8)
The graphs generated from the image analysis data (figures 9 10 and 11) were
obtained from a single run for each polymer Each experiment was however replicated
three times The error bars were obtained because at least three different fields of view
were taken for each time point from which the average cell density and the standard
deviation were calculated (Appendix E)
Figure 6 BiospanControl time course of cell adhesion
t=0 hours t=2 hours
t=4 hours t=6 hours
Figure 7 ControlBiospan polymer bacterial colonization
t=24 hours
Figure 8 Comparison of the extent of colonization of different polymers at t=24 hours
triglyme Cipro-triglyme
34
CNlt
EE
0)O
pound(AC0)O
100E+06
100E+05
100E+04
100E+03
100E+02
100E+01
100E+00 J -
I III bullbullbullbullbullbullbullbullbull Ce -
Control STrigIyme 0 ciproAriglyme S BMA S ciproBMA
Polymers
Figure 9 Dhiect counts of cell density on the polymer surface after 24 hours (L-R) Control triglyme ciprotriglyme BMA ciproBMA
Figure 9 clearly shows that the coatings of triglyme and BMA + triglyme reduce
bacterial colonization by at least half when compared to the BP control It can also be seen
from Figure 9 that the addition of ciprofloxacin to the polymer formulation decreases
bacterial colonization by at least two orders of magnitude Note that the y-axis on figure
9 is a logarithmic scale
35
60E+05
50E+05
40E+05
30E+05
20E+05
10E+05
OOE+OO I r
-10E+05
tim e (hrs
mdash Control
-laquo~-trigiyme
A ciprotriqlyme
FigurelO Time course cell colonization curve of control triglyme ciprotriglyme obtained from image analysis
Figure 10 shows that bacterial attachment and colonization to the control polymer is much
greater than to either the triglyme or ciprotriglyme polymer Analysis of the data in
Appendix E will show the same trend for BMA and ciproBMA At t = 6 hours the feed
was switched from a medium containing ~5 x IO8 cellsml with no glucose to a sterile feed
of complete medium plus 500 ppm glucose Therefore any increase in cell density can be
attributed to growth Slightly more growth can be seen on the triglyme than on the
ciprotriglyme over the course of the experiment however neither of these polymers
exhibits the growth found on the control polymer
36
Figure 11 reveals that bacteria are attaching to the triglyme and ciprotiiglmc
polymers but not to the same extent as to the BP control polymer The bacteria attach to
the control polymer at a rale ol 114 x IO4 ccllsmnrhr while the rates of attachment to the
triglyme and the ciprolriglymc are significantly lower 66 cel I smm 2Zhr and 537
C ellsZm m 2Zhr respectively While the attachment rate is greater on the ciprolriglymc than on
the triglyme The rale of growth is greater on the triglyme than on the ciprolriglymc It can
80E+04
70E+04
60E+04
E 50E+04
40E+04
30E+04
20E+04
10E+04
00E+00
-10E+04
time (hrs)
Control
triglyme
A ciprotriqlyme
Figure 11 Attachment rate differences are evident within the first 6 hours of the flow cell experiments The control polymer demonstrates a much more rapid attachment rate than either triglyme or ciprotriglyme
be seen from figure 10 that the control polymer exhibits an exponential rale of growth
from 1=16-24 hours that is significantly higher than either triglyme or ciprolryglmc Whal
37
is not readily seen is the fact that triglyme exhibits a faster growth rate than the
ciprotriglyme 181 x IO3 cellsmm2hr versus 27 cellsmm2hr
Total counts of the effluent found in Appendix F back up the imagae analysis
results ( figures 1213) F igure 12 shows that for the first six hours ~5xlO8 cellsml
are being pumped through the flow cell Once the supply of cells is cut off at t=6 hours
cells can still be seen in the effluent implying that growth of new cells is taking place in the
flow cell system
140E+09
120E+09
T=100E+09
S800E+08
S600E+08
agt400E+08
200E+08
000E+000 2 4 6 8 1012 141 6 1 8 20 22 24 26
mdash Control Triglyme
Ciprotriglyme- -x- - BMA
ciproBMA
time (hrsF igure 12 Total counts made with Acridine Orange From t=0-6 hours a feed
composed of a bacterial suspension in medium without a carbon source was pumped through the flow cell after t=6 hous the feed was switched to sterile complete medium
Figure 13 obtained from total cell counts displays the same trend with regard to
the amount of cell density on the polymer surface after 24 hours as figure 9 which was
made from direct count data The control polymer exhibits the highest cell density after
24 hours The effluent data does not demonstrate as much of a difference between
polymers as the image analysis data which may be explained by the growth and sloughing
of bacteria in the effluent tubing It is to be expected that the samples collected from the
Den
sity
(ce
lls
mm
A2)
38
effluent would have higher cell counts since there is more surface area available for cell
growth
100E+08 T
100E+07
100E+06
100E+05
100E+04
100E+03
100E+02
100E+01
100E+00Polym ers
I n Control | s Triglyme | ^Ciprotriglyme I SBMA I sciproBMA
Figure 13 Calculated cell density on the ldquotestrdquo polymers using total cell count (acridine orange) data Note that it follows the same trend as the image analysis data
Figure 14 shows that viable cells are being pumped through the flow cell while
figure 15 demonstrates that the concentration of ciprofloxacin at the polymer surface is
high enough to have a noticable effect on the density of bacteria on the polymer (Appendix
G - Plate Count Data)
39
Effluent viability data from t = 0-24hours
100E+10
100E+09
100E+08
j 100E+07 -
100E+06 -
100E+05
100E+04
time (hrs)
mdashmdash Control triglyme
bull-c ip ro tr ig ly m eBMA
-bull- ciproBMA
Figure 14 Plate count data from effluent samples taken from the polymer flow cells during the course of the experiments shows that viable cells are going through the flow cell
As stated previously total counts and viable counts are not considered to be as
accurate as direct counts The effect of the extra surface area available for cell adhesion and
growth provided by the tubing was not factored into the results Subsequent sloughing
andor entrapment of cells in this region of the flow cell setup could affect the cell
concentration data collected Figure 16 demonstrates the variation obtained from the
den
sity
(cf
um
mA2
)40
concentration data collected Figure 16 demonstrates the variation obtained from the
100E+06
SxltltSSSxgtxv-v
mm
I B
reg Control reg triglyme 0 ciprotriglyme 0 BMA Q ciproBMA
Polymers
Figure 15 Cell densities on polymers calculated from plate count data No colonies were found on any of the plates made for the ciproBMA polymer (L-R) Control triglyme ciprotriglyme BMA ciproBMA
same polymer using different techniques As stated previously the results obtained from IA
are considered to he the most accurate since they are taken from the polymer surface and
not the effluent
cell
dens
ity (c
ells
or c
fum
m2)
41
100E+07
100E+06
100E+05
100E+04
100E+03
100E+02
100E+01
100E+00 Plate counts Total counts IA
I
Figure 16 demonstrates the variations in bacterial density on the triglyme polymer after twenty four hours using image analysis (IA) acridine orange staining of the effluent and plate counts of the effluent
C iprofloxacin re lease
The extra surface area could also factor into the amount of ciprofloxacin detected in
the effluent (table 6) of the polymers incorporating ciprofloxacin In one millileter of
effluent roughly 3 ug of ciprofloxacin should be detected It should be noted that all of
the polymers containing ciprofloxacin still retained significant amounts of ciprofloxacin
This is to be expected given that the initial loading of ciprofloxacin was 04g Additionally
42
an earlier study found that these polymers continue to elute ciprofloxacin for up to 128
hours in a well stirred flask (Kwok CS et al 997) The erratic release of ciprofloxacin
seen in table 6 may be due to the interaction of the antibiotic with cells growing in the
effluent tubing ciprofloxacin degradation resulting
Experiment Time (hours) Cipro cone (figml) of points above detectionCiprotriglym e
O 35 plusmn21 2
2 17 I4 5 I6 4 I8 ND O18 ND O21 18 I24 5 + 5 2
CiproBM A O 6 plusmn 5 32 I I4 ND O6 ND O8 29 I18 2 I21 ND O24 ND O
Table 6 Ciprofloxacin concentrations in effluent ND = not detectable
from light exposure pulsating flow unforeseen release behavior or damage to polymer
coating Appendix H expands on the mathematical theory behind the controlled-release
of a drug from a one-dimensional slab under flow conditions
Overall the flow cells experiments showed that ciprofloxacin could successfully be
incorporated into BiospantradePEG polymers and still maintain its efficacy In addition
they demonstrated that cell adhesion and colonization of opaque materials could be
monitored continuously for up to 24 hours under Jlow conditions The results involving
the triglyme and BMA coatings were also encouraging
43
SUMMARY
The research conducted for this study involved exposing planktonic Pseudomonas
aeruginosa to 10 |igml of the DNA stain Hoechst 33342 for 3 hours The cell
suspension was then washed and resuspended in fresh complete medium minus glucose
the carbon source Every two hours for six hours a fresh batch of resuspended cells was
pumped over a ldquotestrdquo polymer in a flow cell being monitored microscopically for bacterial
attachment After six hours the flow was switch from the cell suspension to complete
medium plus glucose in order to observe cell adhesion and growth over the 24 hour run
Pictures were taken periodically over the course of the experiment and examined by image
analysis to detect changes in bacteria cell density on the surface of the ldquotestrdquo polymer The
results obtained from image analysis were for the most part confirmed by total and viable
cell counts performed on effluent samples Within the limitations and scope of this work
the results show that
1) Both the BMA coating and the triglyme coating can cut bacterial adhesion and
colonization in half
2) The addition of the ciprofloxacin to the polymer matrix decreases bacterial adhesion and
colonization by at least two orders of magnitude when compared with the control
3) Hoechst 33342 can be used at lOugml without interfering with P aeruginosa growth
patterns
4) Hoechst 33342 enables bacterial adhesion and biofilm formation on an opaque surface
to be monitored in a flow cell system for up to 24 hours
The results of this research indicate that it would be worthwhile to pursue
development of the ldquotestrdquo polymers for use as biomedical materials Further investigation
into how well image analysis correlates with actual bacterial cell adhesion and colonization
44
is also suggested from these results It would be interesting to run a set of experiments on
a substratum comparing image analysis and destructive sampling in which the flow cell is
broken down and the substratum is removed at every time point In addition a better
indication of the long-term performance of these materials could be gained by conducting
tests over a longer period of time a week or more Likewise the exposure of the material
to proteins before andor during bacterial challenge would provide more realistic test
conditions Dealings with industry have shown that the types of adhesion and colonization
experiments conducted in this study are among the initial steps in gaining approval from the
FDA
45
BIBLIOGRAPHY
Ackart WB Camp RL Wheelwright WL and JS Byck A n tim ic r o b ia l P o ly m e r s Journal of Biomedical Materials Research V 9 p 55 - 68 1975)
Baker RW Controlled Release of Biologically Active A gents John Wiley amp Sons New York NY 1987
Bellido F and REW Hancock S u s c e p t ib i l i ty a n d R e s is ta n c e o f P s e u d o m o n a s a e ru g in o sa to A n tim ic r o b ia l A g e n ts P s e u d o m a n a s a e r u g i n o s a as an Opportunistic Pathogen eds M Campa M Bendinelli and H Friedman Plenum Press New York NY p 321- 348 1993
Bird RB Stewart WE and EN Lightfoot Transport Phenomena John Wiley amp Sons New York NY p 495 - 625 I960
Blanchard CR B io m a te r ia ls B o d y P a r ts o f the F u tu re lthttpwwwswiiorg3pubsttodayfallimplanthtmgt June 4 1996
Bondi A B a s ic P h a m a c o lo g ic T ec h n iq u es f o r E va lu a tin g A n tim ic r o b ia l A g e n ts I Animal and Clinical Pharm acologic Techniques in Drug Evaluation eds JH Nodine and PE Siegler Year Book Medical Chicago IL p 440 - 450 1964
Bryers JD M o d e lin g b io ftlm a cc u m u la tio n Physiological Models in Microbiology V o l rsquol l ed Brazin MJ and Prossser JL CRC Press Boca Raton FE p1091
1988
Byun Y Jacobs HA and Sung Wan Kim M ec h a n ism o f th ro m b in in a c tiv a tio n b y im m o b il iz e d h e p a r in Journal of Biomedical Materials Research V 30 p 423 - 427 1996
Carballo J CM Ferreiros and MT Criado Im p o r ta n c e o f experim en ta l d e s ig n in th e e v a lu a tio n o f th e in flu en ce o f p r o te in s in b a c te r ia l a d h e re n c e to p o ly m e r s Medical Microbiology and Immunology V 180 p 149-155 1991
Characklis WG and KC Marshall eds Biofilms J Wiley amp Sons New York NY 1990
Ciprofloxacin Ciproreg Ciproreg IV C loxanreg Clinical Pharmacology Online lthttpwwwcponlinegsmcomscriplsfullmonoshowmonopl7mononum=I 12gtMay 19 1997
Clinical Applications of Biomalerials NIH Consens Statement 1982 Nov 1-3 [cited 1997 August 21] 4(5)1-19 httptextnlmnihgovnihcdcwww34txthtml
46
May 27 1996
Craig and Ebert Pseudomonas aeruginosa Infections amp Treatment p 467-491
Dankert J Hogt AH and J Feijen Biomedical Polymers Bacterial Adhesion Colonization and Infection CRC Critical Reviews in B iocom patibility V 2 p 219-301 1986
Doi K Nakayama Y and T Matsuda Novel compliant and tissue-permeable microporous polyurethane vascular prosthesis fabrication using an excimer laser ablation technique Journal o f Biomedical M aterials Research V 31 p 27 - 33 1996
Eginton PJ et al The influence o f substratum properties on the attachment o f bacterial cells Colloids and Surfaces B B io in terfaces V 5 p 153-159 1995
Farber BF and AG Wolff Salicylic acid prevents the adherence of bacteria and yeast to silastic catheters Journal o f Biomedical Materials Research V 2 7 p 5 9 9 - 6021993
Fan LT and SK Singh Controlled Release a Quantitative Treatments Springer-Verlag New York NY 1989
Francois P et al Physical and biological effects o f a surface coating procedure on polyurethane catheters Biom aterials V 17 p 667 - 678 1996
Golomb G and A Shplgelman Prevention o f bacterial colonization on polyurethane in vitro incorporated antibacterial agent Journal o f Biomedical Materials Research V 25 p 937 - 952 1991
Greenfeld et al Decreased bacterial adherence and biofilm formation on chlorhexidince and silver sulfadiazine-impregnated central venous catheters implanted in swine Critical Care Medicine V 23 p 894 - 900 1995
Gristina AG Biomaterial-Centered Infection Microbial Adhesion Versus Tissue Integration Science V237 p1588-1595 Sept 1987
Gristina AG Implant Failure and the Immuno-Incompentent Fibro-InflammatoryZone
Clinical Orthopaedics And Related Research V298 p106-118 1994
Gristina AG et al Cell biology and molecular mechanisms in artificial device infections The International Journal of Artificial Organs V16 p755- 764 1993
Gristina AG et al The Glycocalyx Biofilm Microbes and Resistant Infection Seminars in Arthroplasty V5 p160-170 October 1994
47
Gristina AG Naylor PT and Q Myrvik The Race for the Surface Microbes Tissue Cells and Biomaterials Molecular M echanisms o f M icrobial Adhesion eds Switalski L Hook M and E Beachey Springer-Verlag New York NY 1989
Gristina AG Passive Local Immunotherapy ldquoPLIrdquo to Prevent Biomaterial and Wound Infection Frank N Nelson Lecture Nov 11 1997
Hanker JS and BL Giammara Biomaterials and Biomedical Devices S cien ce V 242 p885-892 Nov 11 1988
Holt JG et al B ergeyrsquos Manual of Determinative B acterio logy 9th ed Williams amp Wilkins Baltimore MD p 93 - 941994
Hulshoff JEG et al Evaluation of plasma-spray and magnetron-sputter Ca-P- coated implants An in vivo experiment using rabbits Journal o fBiomedical Materials Research V 31 p 329 - 337 1996
Jansen B and W Kohnen Prevention o f biofilm formation by polymer modificationJournal of Industrial Microbiology V 15 p391-396 1995
Kaibara et al Promotion and control o f selective adhesion and proliferation o f endothelial cells on polymer surface by carbon deposition Journals o fBiomedical Material Research V 31 p 429 - 435 1996
Kost J and R Danger Controlled release of bioactive agents Trends in B iotechnology V2 p47-51 1984
Kwok CS et al Design of Infection-resistant Polymers I Fabrication and Formulation in the process of submitting 1997
Kydonieus A ed Treatise on Controlled Drug Delivery Fundam entals Optimization Applications M arcelDekker Inc New York NY 1992
Danger RS and DL Wise eds Medical Applications of Controlled R e lea se Volume I CRC Press Inc Boca Raton PD 1984
Danger RS and DL Wise eds Medical Applications of Controlled R e lea se Volume II Applications and Evaluation CRC Press Inc Boca Raton PD 1984
Danger RS and N A Peppas Present and future application of biomaterials in controlled drug delivery systems Biomaterials V 2 p 244 -246 1981
Lazarus SM et al A Hydrophilic Polymer-Coated Antimicrobial Urethral CatheterJournal of Biomedical Materials Research V 5 p 129 - 138 1971
Lee S-D et al Artificial cornea surface modification o f silicone rubber membrane by graft polymerization o f pHEMA via glow discharge B iom aterials V 17 p
4 8
587 - 5951996
Lindhout T etal Antithrombinactivity o f surface-bound heparin studied underflow conditions Journal of Biom edical Materials Research V 29 p 1255 - 1266 1995
Lohmann D Controlled Release-recent progress in polymeric drug delivery systems M acromol Symp V 100 p25-30 1995
Manual of Industrial M icrobiology and Biotechnology p30 1986
Massia SP and JA Hubbell Human endothelial cell interactions with surface- coupled adhesion peptides on a nonadhesive glass substrate and two polymeric biomaterials Journal of Biom edical Materials R esearch V 25 p 223- 242 1991
Materials Science Materials for medicine Britanica Onlinelthttpwwwebcom 180cgi-bingDocF=macro5004232htmgt [Accessed Nov 20 1997]
Miles AA Misra SS and JO Irwin The Estimation o f the Bactericidal Power o f the Blood Journal of Hygiene V 38 p 732-749 1938
Paulsson M Gouda I Larm O and A Ljungh Adherence o f coagulase-negative staphylococci to heparin and other glycosaminoslycans immobilized on polymer surfaces Journal of Biomedical M aterials Research V 28 p 311 - 317 1994
Portoles M Refojo MF and F-L Leong Poloxamer 407 as a bacterial abhesive for hydrogel contact lenses Journal o f Biomedical M aterials Research V 28 p 303 - 309 1994
Price JS Tencer AF Arm DM and GA Bohach Controlled release o f antibiotics from coated orthopedic implants Journal o f Biom edical Materials Research V 30 p281-286 1996
Robinson JR and VHL Lee Controlled Drug Delivery Fundamentals and Applications 2nd ed Marcel Dekker Inc New York NY 1987
Rushton DN Brindley GS Polkey CE and GV Browning Implant infections and antibiotic-impregnated silicone rubber coating Journal of N eu ro lo g y Neurosurgery and Psychiatry V 52 p 223-229 1989
Ryu GH et al Antithrombogenicity o f lumbrokinase-immobilized polyurethane Journal of Biomedical M aterials Research V 28 p 1069-1077 1994
Schlichting H Boundary-Layer T heory translated by J Kestin 7 ed McGraw- Hill New York NY p 596-615 1979
49
Seyral P Zannier A JN Argenson and D Raoult The r e le a s e in v itro o f v a n c o m y c in a n d to b ra n y c in f r o m a c ry lic b o n e cem en t Journal o fAntimicrobial Chemotherapy V 33 p 337 - 339 1994
Strachan CJL The p r e v e n tio n o f o r th o p a e d ic im p la n t a n d v a sc u la r g ra ft in f e c t io n s Journal o f Hospital Infection V 30 (Supplement) p 54-63 1995
Suljak JP e t a l B a c te r ia l a d h e s io n to d en ta l am algam a n d th re e res in c o m p o s i te s Journal of Dentistry V23 p171-176 1995
Sullam PM Payan DG Dazin PF and FH Valone B in d in g o f V irid a n s G rou p S tr e p to c o c c i to H u m a n P la te le ts a Q u a n tita tiv e A n a ly s is Infection and Immunity V 58 p 3802-3806 Nov 1990
Tebbs SE Sawyer A and TSJ Elliot In flu en ce o f su rfa ce m o rp h o lo g y on in v i t r o b a c te r ia l a d h e re n c e to c e n tra l ven o u s c a th e te r s British Journal o f Anaesthesia V 72 p 587-591 1994
Thomsberry C and JC Sherris Section XI Laboratory Tests in Chemotherapy General Considerations Manual of Clinical Microbiology eds EH Lennette A Balows W J Hausler and HJ Shadomy 4th ed American Society for Microbiology Washington DC p 959 -977
Wang I Anderson JM and RE Marchant P la te le t -m e d ia te d a d h e s io n o f S ta p h y lo c o c c u s e p id e r m id is to h yd ro p h o b ic N H L B I re fe ren ce p o ly e th y le n e Journal o f Biomedical Materials Research V 27 p 1119-1128 1993
Weber W J and F A DiiGiano Process Dynamics in Environmental S ystem s John Wiley amp Sons Inc p 390 - 398 1996
William SK e t al F o rm a tio n o f a m u ltila y e r ce llu la r lin ing on a p o ly u r e th a n e v a s c u la r g r a f t f o l lo w in g en d o th e lia l ce ll s o d d in g Journal of B iom edical M aterials Research V 26 p 103-117 1992
Wolfson JS and DC Hooper eds Quinolone Antimicrobial A gents American Society for Microbiology Washington DC 1989
Yu Jian-Lin et al F ib ro n e c tin on the S urface o f B ilia ry D ra in M a te r ia ls - A R o le in B a c te r ia l A d h e r e n c e Journal of Surgical Research V 59 p 596-600 1995
APPENDICES
51
APPENDIX A
Growth Rate Experiments
52Growth Curves (500 ppm Glucose) Room Temperaturetime count cone (cellsml) average std dev Specific growth rate
0 28 159E+06 711E+06 687E+06 048046690552 295E+06
296 168E+071 40 227E+06 785E+06 408E+06
210 119E+07165 936E+06
2 28 159E+06 204E+06 766E+0525 142E+0655 312E+06
3 281 159E+07 138E+07 156E+06216 123E+07233 132E+07
45 98 556E+07 550E+07 212E+06
101 573E+0792 522E+07
6 177 100E+08 736E+07 206E+0789 505E+07
123 698E+077 290 165E+08 122E+08 318E+07
198 112E+08156 885E+07
8 56 318E+08 210E+08 820E+0721 119E+0834 193E+08
9 114 647E+08 522E+08 779E+0782 465E+0893 528E+0879 448E+08
10 141 800E+08 749E+08 930E+07109 619E+08146 828E+08
11 282 160E+09 115E+09 284E+08206 117E+09172 976E+08150 851 E+08
12 200 113E+09 110E+09 329E+07186 106E+09195 111E+09
13 76 216E+09 277E+09 107E+0975 213E+09
163 462E+0976 216E+09
14 127 360E+09 340E+09 356E+08102 289E+09130 369E+09
53
15 273 775E+09 817E+09 318E+08300 851 E+09291 826E+09
16 287 163E+10 155E+10 765E+08278 158E+10255 145E+10
17 295 167E+10 145E+10 191 E+09213 121E+10260 148E+10
18 313 178E+10 163E+10 120E+09- --------
261 148E+10 - -------- -------286 162E+10
54
time count Cone (cellsml) average std dev Specific growth rateO 20 113E+06 271 E+06 191 E+06 050174225
109 619E+0657 323E+0617 965E+0536 204E+06
123 121 687E+06 746E+06 767E+05
117 664E+06137 777E+06151 857E+06
456 160 908E+06 128E+07 351 E+06
309 175E+07210 119E+07
7 35 199E+0728 159E+0738 216E+07
89 78 443E+08 485E+08 268E+07
87 494E+0891 516E+0886 488E+08
101112 69 392E+08 400E+08 147E+07
73 414E+0867 380E+0873 414E+08
13 107 607E+08 649E+08 549E+07128 726E+08 --108 613E+08
14 64 182E+09 131E+09 292E+0840 113E+0939 111E+0942 119E+09
15 64 182E+09 182E+09 401 E+0766 187E+0964 182E+0962 176E+09
1617 121 343E+09 362E+09 142E+08
129 366E+09133 377E+09
18 364 207E+10 227E+10 146E+091
55411 233E+10424 241 E+10
19 375 213E+10 217E+10 350E+08390 221 E+10384 218E+10
20 98 556E+10 680E+10 179E+1080 454E+10
155 880E+10146 828E+10
56
time count Cone (cellsml) average std dev Specific growth rateO 23 522E+06 639E+06 114E+06 0443703052
27 613E+0637 840E+0630 681 E+0622 499E+0630 681 E+06
11 119 135E+10 119E+10 165E+09119 135E+1090 102E+1090 102E+10
12 45 102E+10 934E+09 231E+0926 590E+0932 726E+0938 863E+0954 123E+1052 118E+10
13 49 111E+10 126E+10 131E+0948 109E+1059 134E+1061 138E+1054 123E+1063 143E+10
14 135 306E+10 302E+10 250E+09128 291 E+10150 340E+10120 272E+10
15 167 379E+10 368E+10 166E+09168 381 E+10152 345E+10 J Z
16 239 542E+10 495E+10 619E+09201 456E+10250 567E+10183 415E+10
17 57 647E+10 726E+10 960E+0977 874E+1056 636E+1066 749E+10
18 86 976E+10 102E+11 804E+0982 931 E+10
101 115E+11 -90 102E+11
19 121 137E+11 121 E+11 182E+10124 141 E+11
57
92 104E+1189 101E+11
20 89 101E+11 107E+11 830E+0996 109E+11
105 119E+1186 976E+10
21 101 115E+11 124E+11 104E+10122 138E+11114 129E+11100 113E+11
22 67 760E+10 111E+11 216E+10115 131E+1197 110E+11
112 127E+11
58
time count Cone (cellsmi) average std dev Specific growth rate averageO 25 142E+06 127E+06 434E+05 0443600055 0467378
22 125E+0632 182E+06 std dev
9 511E+05 00248917 965E+0529 165E+06
12 62 281 E+07 421 E+07 779E+0693 422E+0786 390E+07
116 527E+07108 490E+0791 413E+07
14 33 150E+08 156E+08 339E+0737 168E+0826 118E+0833 150E+0828 127E+0849 222E+08
155 39 177E+08 239E+08 810E+0731 141E+0888 399E+0854 245E+0851 232E+0853 241 E+08
175 61 277E+08 261 E+08 657E+0745 204E+0851 232E+0849 222E+08 - - Z
88 399E+0851 232E+08
225 136 309E+10 274E+10 247E+09114 259E+10112 254E+10
59
APPENDIX B
FASTEETHreg SUSCEPTIBILITY
6 0
time 01g260E+04
005280E+04 240E+04
Glucose Abs0008
640E+04 140E+05 170E+04 0016370E+05 770E+05 220E+04 0033
125 198E+06 310E+06 220E+05 0071145 890E+06 194E+06 330E+05 0146245 160E+08 200E+08 160E+07 0266
110E+08 180E+08 160E+07 100 0405275 170E+08 170E+08 190E+07 200 0408
time 0 05g 0025g217E+04 330E+04 110E+05
Fasteeth MIC Study I518E+05 760E+05 230E+05
125 194E+06 185E+06 410E+05314E+06 147E+06 816E+05
165 660E+06 100E+07 178E+06195 192E+07 880E+06 242E+06225 430E+07 140E+07 180E+07255 119E+09 292E+07 130E+07
time 157E-02
200E+08
150E+08
I 100E+08U
500E+07
000E+00
7 X
V
I I
01g
005
C ~
233E+04 133E+0510 15 20 25 30time (hours)
194E+06 566E+06880E+06 746E+06226E+07 120E+07125E+08 120E+08133E+08 703E+08
time Control 450E-02121E+05 152E+05140E+05 264E+06197E+06 246E+06
185 362E+06 919E+06457E+06 211E+07461E+07 234E+08
IhU 200E+07
100E+07
000E+00
250E+08
200E+08
150E+08
1 00E+08
500E+07
OOOE+OO
I
I
Z1
Control
450E-02
500E+07
400E+07
300E+07
F a s te e th MIC Il
I
y -
Jlt3
0 05g
0025g
C
10 15 20 25timefhrs)
Fasteeth MIC III
157E-02
C
time (hrs)
APP ENDlX C
Hoechst 33342
me control s1 S2 S3O 162E+05 149E+05 118E+05 139E+05
195 477E+06 443E+07 317E+07 883E+04OOOE+OO
O 134E+04 159E+04 280E+04 194E+0414 210E+06 520E+05 380E+05 945E+0416 228E+06 313E+06 604E+06 294E+0519 763E+06 980E+06 169E+07 207E+0523 263E+07 133E+08 883E+07 967E+04
5ugml10ugmlSOugml
Hoechst 33342 MIC no wash
-control
-5ugml
-10ugml -50ugml
time (hrs)
time control s1 S2 S3O 162E+05 149E+05 118E+05 139E+05
195 477E+06 443E+07 317E+07 883E+04OOOE+OO
O 134E+04 159E+04 280E+04 194E+0414 210E+06 520E+05 380E+05 945E+0416 228E+06 313E+06 604E+06 294E+0519 763E+06 980E+06 169E+07 207E+0523 263E+07 133E+08 883E+07 967E+04
5ugmllOugml50ugml
Hoechst 33342 MIC no wash
control -5ugml bull10ugml 50ugml
time control A B3 129E+05 129E+05 139E+05
15 104E+06 100E+05 169E+0616 645E+06 227E+05 122E+062022
423E+06 113E+05 254E+06106E+07 160E+06 158E+07
24 707E+07 109E+07 175E+07
Hoescht MIC - incubate in stain for 3 hrs then wash
800E+07700E+07600E+07500E+07400E+07300E+07200E+07100E+07OOOE+OO
MIC w wash
DLO
800E+07
600E+07
400E+07
200E+07
000E+00
- controlbullA
-B
O 10 20 30
time(hrs)
200E+07180E+07160E+07140E+07120E+07100E+07800E+06600E+06400E+06200E+06000E+00
65
APPENDIX D
C iprofloxacin
66
Ciprofloxacin MIC study Plate countstime count (1ugml) cfuml average std dev count (1 ugml) cfuml
0 96 960E+04 962E+04 530E+03 21 210E+0496 960E+04 28 280E+04
105 105E+05 22 220E+0410 100E+059 900E+049 900E+04
155 67 670E+04 865E+04 266E+04 3 300E+0385 850E+04 2 200E+0377 770E+04 2 200E+03
5 500E+0411 110E+0513 130E+05
17 76 760E+04 687E+04 220E+04 20 200E+0465 650E+04 27 270E+0441 410E+04 20 200E+0411 110E+055 500E+047 700E+04
20 31 310E+04 230E+04 128E+04 13 130E+0433 330E+04 0 000E+00
5 500E+03 0 000E+0022 0 ND 0
0 00 0
24 0 ND 00 00 0
time 1 ugml std dev 01 ugml std dev control std dev0 720E+04 345E+04 566E+04 263E+04 593E+04 170E+03
155 584E+04 452E+04 510E+06 168E+06 903E+06 419E+0517 532E+04 283E+04 380E+06 221E+06 153E+07 963E+0520 137E+04 137E+04 670E+06 381 E+06 963E+07 741 E+0622 0 0 254E+07 587E+06 377E+07 450E+0624 0 0 920E+06 440E+06 377E+07 450E+06
67
average std dev count (01 ugml) cfuml average std dev count (01 ugml)237E+04 309E+03 75 750E+04 783E+04 340E+03 20
83 830E+04 2077 770E+04 14
8 800E+048 800E+046 600E+04
233E+03 471 E+02 66 660E+06 3677 770E+06 3056 560E+06 41
223E+04 330E+03 56 560E+06 587E+06 602E+05 15153 530E+06 17167 670E+06 155
17 13
14433E+03 613E+03 TNTC 119
TNTC 53TNTC 29
215 215E+07 232E+07 362E+06 253189 189E+07 256247 247E+07 235
19 190E+07 2127 270E+07 2828 280E+07 42
Bad plate 60Bad plate 110Bad plate 17
5- - 7
68
cfum average std dev count (control) cfuml average std dev200E+04 180E+04 283E+03 61 610E+04 593E+04 170E+03200E+04 60 600E+04140E+04 57 570E+04
360E+06 357E+06 450E+05 96 960E+06 903E+06 419E+05300E+06 89 890E+06410E+06 86 860E+06
151E+06 153E+06 148E+05 166 166E+07 153E+07 963E+05171E+06 150 150E+07155E+06 143 143E+07170E+06130E+06140E+06119E+07 670E+06 381 E+06 86 860E+07 670E+07 300E+07530E+06 103 103E+08290E+06 100 100E+08253E+07 276E+07 680E+06 34 340E+07 X256E+07 35 350E+07235E+07 44 440E+07210E+07280E+07420E+07600E+06 920E+06 440E+06 34 340E+07 377E+07 450E+06110E+07 35 350E+07170E+07 44 440E+07500E+06700E+06
I
I
69
APPENDIX F
Flow Cell Experiments Image Analysis
70
IMAGE ANALYSIS
Images of the polymers were taken using a CCD camera They were then analyzed
using Image Pro Plus The analysis of each image was automatically saved as an Excel
file generating 48 Excel sheets per experiment Since a hard copy of this information
would be too bulking to include in the Appendices a disk with all of the data will be kept
with a copy of this thesis at the Chemical Engineering Department and at the Center for
Biofilm Engineering
The spreadsheet are labeled with the time at which the image was taken die field of
view (eg A b c etc) parameters measured (eg Area ave dia width length) For
every field of view taken two spreadsheets were generated One consisted of the
parameters measured and the other gave the dimensions of the field of view (length x
width)
At the beginning of each experiment an image of a micrometer was taken in order to
calibrate all of the measurements for the experiment Cell numbers were calculated by
summing the area values of one field of view and dividing by 075 for a high end value or
50 for a low end value These values were than averaged to get the average values and
standard deviations The above values were obtained from B ergey rsquos Manual o f
Determinative Microbiology which gave the width of P aeruginosa at 05-1Ojim and
the length as 15-50pm This method for calculating cell numbers was found to be
accurate as actual cell numbers could be counted for the early time points They fell within
the range calculated by the above method
The files are listed as
Control
Triglyme
71
Ciprotriglyme
BMA
CiproBMA
The graphs found in the thesis text were made from the above files and then
converted into data which was easier to handle The files from which the graphs were
made are
Endpoint
Curves
APPENDIX F
Flow Cell Experiments Total CountsAO
cell
con
e(o
ellm
iEffluent counts over a 24
hour time period - Comparison
150E+09
000E+00
mdash- Control
Triglyme bull Ciprotriglyme
- BMA -bull- ciproBMA
CU
den
sity
(ce
lls
mm
A2)
100E+07
100E+06
100E+05
100E+04
100E+03
100E+02
100E+01
H ControlHTrigIyme^CiprotriglymeHBMAHciproBMA
Polymers100E+00
cell
con
e (
cell
sm
l)Effluent data t=0-8 Total counts
140E+09
120E+09
100E+09
800E+08
600E+08
400E+08
200E+08
000E+00
mdash Control Triglyme
-Ciprotriglyme - x~ BMA -^c ip roB M A
time (hrs)
76Control AO countstime (in) cell count cellsml average std Dev
0 100 454E+08 491 E+08 134E+0874 336E+08
110 499E+08101 458E+08172 781 E+0882 372E+08
125 567E+08165 749E+08132 599E+08108 490E+0860 272E+08
113 513E+0897 440E+0893 422E+0890 409E+08
2 107 486E+08 730E+08 152E+08167 758E+08154 699E+08111 504E+08167 758E+08196 890E+08204 926E+08
180 817E+084 113 513E+08 678E+08 171E+08
108 490E+08172 781 E+08
82 372E+08125 567E+08132 599E+08165 749E+08167 758E+08204 926E+08180 817E+08196 890E+08
6 0 0 0 00000
77
area (mmA2)72578 714E+02 441 E+016550376102
Polymercount cone
33 150E+08 201 E+08 660E+0750 227E+0841 186E+0847 213E+08
455 103E+08430 976E+07450 102E+08
62 281 E+0854 245E+0859 268E+0848 218E+0865 295E+0851 232E+08
density845E+06 277E+06
78
time (out) cell count cellsml average std Dev time (out) average std Dev0 65 295E+08 373E+08 780E+07 0 373E+08 780E+07
74 336E+08 2 303E+08 123E+08111 504E+08 4 209E+08 800E+0777 350E+08 6 262E+08 698E+07
109 495E+08 8 162E+08 088 399E+08 16 159E+07 116E+0653 241 E+08 18 232E+07 089 404E+08 20 304E+07 901E+0673 331 E+08 21 407E+07 082 372E+08 24 714E+07 213E+07
2 101 458E+08 303E+08 123E+08103 468E+08 Control101 458E+0830 136 E+08 0 491 E+08 134E+0835 159E+08 2 730E+08 152E+0844 200E+08 4 678E+08 171 E+0860 272E+08 6 0 068 309E+08 8 0 058 263E+08 16 0 0
4 30 136E+08 209E+08 800E+07 18 0 035 159E+08 20 0 028 127E+08 21 0 044 200E+08 24 0 019 863E+0744 200E+0869 313E+0872 327E+08 time in-out66 300E+08 0 000E+0054 245E+08 2 000E+00
6 39 177E+08 262E+08 698E+07 4 -262E+0860 272E+08 6 226E+0856 254E+08 8 162E+0867 304E+08 16 159E+0738 173E+08 18 232E+07
46 209E+08 20 304E+0744 200E+08 21 407E+0772 327E+08 24 714E+0788 399E+0867 304E+08
16 62 141E+07 159E+07 116E+0669 157E+0766 150E+0776 173E+0769 157E+0770 159E+0773 166E+07
79
ff l 184E+0768 154E+0767 152E+07
20 161 365E+07 304E+07 901 E+06158 359E+07196 445E+0798 222E+0791 207E+07
100 227E+0724 206 468E+07 714E+07 213E+07
121 275E+07219 497E+07217 493E+07360 817E+07270 613E+07420 953E+07280 636E+07430 976E+07390 885E+07320 726E+07360 817E+07430 976E+07380 863E+07
80
Triglyme AO countstime (in) count cellsml average std Dev
0 77 350E+08 517E+08 224E+0883 377E+0878 354E+0867 304E+0888 399E+08
115 522E+0896 436E+0888 399E+0883 377E+08
195 885E+08208 944E+08188 853E+08
2 99 449E+08 765E+08 251 E+08120 545E+08102 463E+08130 590E+08138 626E+08136 617E+08133 604E+08232 105E+09265 120E+09260 118E+09197 894E+08190 863E+08190 863E+08
4 238 108E+09 708E+08 307E+08225 102E+09215 976E+08100 454E+0864 291 E+0899 449E+08
124 563E+0898 445E+08
194 881 E+08188 853E+08151 685E+08176 799E+08
6 0 0 0 00 00 00 00 00 00 0
81
Polymercount cone
35 794E+07 353E+07 341 E+0741 931 E+0737 840E+0734 772E+0736 817E+0744 200E+0734 154E+0725 113E+0729 132E+0732 145E+0712 545E+0627 123E+0719 863E+0615 681 E+0614 636E+06
density117E+06 113E+06
area94558 907E+02 544E+019458883024
82
time (out) average std Dev time in-out0 676E+08 970E+07 0 500E+082 463E+08 118E+08 2 302E+084 477E+08 294E+08 4 231 E+086 550E+08 262E+08 6 550E+088 349E+07 302E+07 8 349E+07
16 284E+07 0 16 284E+0718 268E+07 238E+07 18 268E+0720 241 E+07 0 20 241 E+0721 228E+07 116E+07 21 228E+0724 223E+07 196E+07 24 223E+07
triglyme
time (in)0 517E+08 224E+082 765E+08 251 E+084 708E+08 307E+086 0 08 0 0
16 0 018 0 020 0 021 0 024 0 0
83
time (out) count cellsml average std Dev0 130 590E+08 678E+08 970E+07
136 617E+08157 713E+08150 681 E+08123 558E+08148 672E+08128 581 E+08140 636E+08172 781 E+08152 690E+08205 931 E+08152 690E+08
2 150 681 E+08 463E+08 118E+0867 304E+08
101 458E+08100 454E+0863 286E+0896 436E+0899 449E+08
100 454E+08110 499E+0871 322E+08
130 590E+08136 617E+08157 713E+08150 681 E+08
4 28 127E+08 477E+08 294E+0818 817E+0738 173E+0823 104E+0826 11ampE+08
127 577E+08134 608E+08115 522E+08128 581 E+08150 681 E+08120 545E+08205 931 E+08145 658E+08215 976E+08
6 47 213E+08 550E+08 262E+0849 222E+0849 222E+0859 268E+0858 263E+08
164 744E+08
84
219 994E+08180 817E+08175 794E+08191 867E+08127 577E+08134 608E+08115 522E+08128 581 E+08
8 16 726E+07 349E+07 302E+0710 454E+0718 817E+0720 908E+0716 726E+072 908E+064 182E+074 182E+075 227E+074 182E+07
18 9 204E+07 268E+07 238E+071 227E+067 159E+070 000E+000 000E+00
99 449E+07142 645E+07128 581 E+07108 490E+07165 749E+0727 123E+0730 136E+0733 150E+0737 168E+0730 136E+07
21 8 182E+07 228E+07 116E+0720 454E+0710 227E+0712 272E+0719 431E+0727 123E+0730 136E+0733 150E+0737 168E+0730 136E+07
24 25 113E+07 223E+07 196E+0711 499E+0622 999E+0623 104E+0716 726E+06
85
19 863E+0626 118E+0723 104E+0725 113E+0718 817E+0614 318E+0722 499E+0727 613E+0716 363E+0727 613E+07
Cel
l con
e (
cells
ml)
Acridine Orange effluent counts t= 8-24hours
180E+08 160E+08 140E+08 120E+08 100E+08 800E+07 600E+07 400E+07 200E+07 000E+00
8 12 16 20 24
mdash diamsmdash Control
- Ciprotriglyme - -x- -B MA - X - ciproBMA
time (hours)
87
Ciprotriglyme AO countstime (in) count cellsml average std Dev
0 110 499E+08 932E+08 329E+08106 481 E+08115 522E+08144 654E+08141 640E+08157 143E+09113 103E+09119 108E+09103 935E+08105 953E+08147 133E+09136 123E+09 bull146 133E+09
2 115 104E+09 985E+08 202E+08105 953E+08102 926E+0898 890E+08
129 117E+09132 120E+09140 127E+09121 110E+09128 116E+09150 681 E+08184 835E+08131 595E+08
4 213 967E+08 954E+08 481 E+08242 110E+09
13 590E+07251 114E+09132 599E+08168 153E+09
13 118E+0844 399E+08
154 140E+09190 173E+09115 104E+09132 120E+09132 120E+0998 890E+08
6 0 0
88
Polymercount cone
84 953E+06 701 E+06 441 E+0650 567E+0655 624E+0642 477E+0667 760E+06
140 159E+0799 112E+0796 109E+0797 110E+07
107 121E+079 204E+068 182E+06
10 227E+0610 227E+068 182E+06
area94352 941E+02 276E+019064997397
density 223E+05 141 E+05
89
time (out) average std Dev0 754E+08 210E+082 919E+08 207E+084 942E+08 388E+086 292E+08 273E+088 128E+07 216E+06
16 705E+06 bull 018 561 E+06 406E+0620 947E+06 021 114E+07 573E+0624 184E+07 774E+06
Ciprotriglyme
time (in)0 932E+08 329E+082 985E+08 202E+084 954E+08 481 E+086 0 08 0 0
16 0 018 0 020 0 021 0 024 0 0
90
time (out) count cellsml average std Dev0 120 545E+08 754E+08 210E+08
130 590E+08153 695E+08156 708E+0852 472E+0851 463E+0889 808E+08
118 107E+0981 735E+08
111 101E+0996 872E+08
119 108E+092 92 835E+08 919E+08 207E+08
78 708E+0869 626E+0883 754E+0890 817E+08
103 935E+08135 123E+09143 130E+09134 122E+09117 106E+09191 867E+08167 758E+08Ig 844E+08
4 186 844E+08 942E+08 388E+08241 109E+09289 131E+09243 110E+09159 144E+09177 161E+0931 281 E+0820 182E+08
102 926E+08103 935E+0880 726E+0899 899E+0899 899E+08
6 92 835E+08 292E+08 273E+0865 590E+0882 744E+0865 590E+0854 490E+08
21 191 E+0826 236E+0817 154E+08
91
25 227E+0820 182E+08
133 302E+07113 256E+0793 211E+07
114 259E+07134 304E+07
8 68 154E+07 128E+07 216E+0652 118E+0744 999E+0675 170E+0748 109E+0757 129E+0766 150E+0750 113E+0752 118E+0751 116E+07
18 44 999E+06 561 E+06 406E+0657 129E+0734 772E+0637 840E+0635 794E+06
8 182E+066 136E+065 113E+068 182E+06
13 295E+0621 71 161E+07 114E+07 573E+06
94 213E+0779 179E+0777 175E+0729 658E+0631 704E+0628 636E+0625 567E+0630 681 E+0661 138E+0761 138E+0752 118E+0764 145E+07
3 681E+0524 35 794E+06 184E+07 774E+06
45 102E+0756 127E+0738 863E+06
53 120E+07182 207E+07205 233E+07
92
235 267E+07240 272E+07220 250E+0771 806E+06
200 227E+07195 221E+07265 301 E+07
93BMA total counts Acric ine Orange BMAtime(in) count cone (cellsml) average std dev time (in) ave std dev
0 134 122E+09 826E+08 249E+08 0 826E+08 249E+08146 133E+09 2 610E+08 276E+08130 118E+09 4 731 E+08 382E+0869 626E+08 6 0 069 626E+0891 826E+0872 654E+08 time (out)66 599E+08 0 853E+08 155E+0872 654E+08 2 612E+08 177E+0883 754E+08 4 456E+08 282E+0878 708E+08 6 288E+08 208E+0882 744E+08 8 137E+07 934E+06
2 12 109E+08 610E+08 276E+08 16 445E+07 049 445E+08 18 523E+07 175E+0738 345E+08 20 720E+07 062 563E+08 21 818E+07 379E+0760 545E+08 24 853E+07 340E+07
115 104E+09109 990E+08122 111E+0964 581 E+0876 690E+0849 445E+0852 472E+0866 599E+08
4 73 663E+08 731 E+08 382E+0881 735E+0898 890E+0870 636E+0873 663E+08
131 119E+09115 104E+09141 128E+09147 133E+0929 263E+0829 263E+0838 345E+0821 191E+08
6 00000000
94
0
Polymercount cone
125 567E+07 895E+07 418E+07140 636E+07100 454E+07115 522E+07137 622E+07139 631 E+07150 681 E+07270 123E+08380 173E+08360 163E+08 density250 113E+08 298E+06 139E+06200 908E+07
area87061 901 E+02 21217235669140691703
95
time(out) count cone (cellsml) average std devC 82 754E+0E 853E+08 155E+08
7E 708E+0E86 781 E+0893 844E+0881 735E+0882 744E+0877 699E+0892 835E+08
121 110E+09116 105E+09125 113E+09
2 92 835E+08 612E+08 177E+0876 690E+08
109 990E+0892 835E+0860 545E+0855 499E+0863 572E+0872 654E+0847 427E+0843 390E+0844 399E+0867 608E+0856 508E+08
4 47 427E+08 456E+08 282E+0852 472E+0859 536E+0860 545E+0836 327E+0897 881 E+0830 272E+0850 454E+08
115 104E+09104 944E+08
19 173E+0814 127E+0828 254E+0822 200E+0821 191 E+08
6 16 145E+08 288E+08 201 E+0815 136E+0813 118E+0821 191 E+0816 145E+0855 499E+0840 363E+0845 409E+08
96
85 772E+0873 663E+0820 182E+0820 182E+0820 182E+0820 182E+0817 154E+08
8 6 136E+07 137E+07 934E+060 000E+005 113E+074 908E+061 227E+06
27 245E+0728 254E+0726 236E+07
18 77 699E+07 523E+07 175E+0773 663E+0783 754E+0773 663E+0772 654E+0768 617E+0717 386E+0719 431 E+0715 340E+0712 272E+0712 272E+07
21 310 704E+07 818E+07 379E+07300 681 E+07140 318E+07230 522E+07210 477E+07285 129E+08290 132E+08340 154E+08 - -
250 113E+08123 558E+07136 617E+07144 654E+07
24 107 486E+07 853E+07 340E+07108 490E+07112 508E+07270 123E+08250 113E+08320 145E+08260 118E+08148 672E+07153 695E+07150 681 E+07
97
ciproBMA AO counts
time (in) count cone average std dev0 74 672E+08 673E+08 19E+08
100 908E+0880 726E+08
112 102E+0956 508E+0869 626E+08
108 981 E+0871 645E+0886 781 E+0876 69E+0838 345E+0852 472E+0856 508E+0860 545E+08
2 44 399E+08 897E+08 61 E+0851 463E+0825 227E+0832 291 E+0841 372E+08
103 935E+0893 844E+0899 899E+08
219 199E+09192 174E+09188 171E+09
4 92 835E+08 726E+08 178E+0878 708E+08
102 926E+0897 881 E+08
102 926E+0884 763E+0886 781 E+0879 717E+08
106 962E+0856 508E+0848 436E+0854 49E+0856 508E+08
_
i
98
Polymercount cone
139 316E+07 541 E+07 463E+07114 259E+07125 284E+07134 304E+07280 127E+08290 132E+08250 113E+08
79 179E+0773 166E+0779 179E+07
area88181 870E+02 125E+018760685282
density187E+06 160E+06
99
time (in) ave std devO 673E+08 190E+082 897E+08 610E+084 726E+08 128E+086 0 0
time (out)0 700E+08 146E+082 652E+08 311E+084 524E+08 227E+086 350E+08 127E+088 545E+06 286E+06
16 101E+07 018 113E+07 430E+0620 281 E+07 0
21 365E+07 201 E+0724 682E+07 510E+07
100
time (out) count cone average std dev0 71 645E+08 7E+08 146E+08
71 645E+0876 69E+0899 899E+08
103 935E+0884 763E+0891 826E+0865 59E+0860 545E+0851 463E+08
2 30 272E+08 652E+08 311 E+0842 381 E+0824 218E+0831 281 E+0823 209E+08
130 118E+0966 599E+0866 599E+0890 817E+0897 881 E+0867 608E+0888 799E+08
113 103E+09104 944E+08107 971 E+08
4 83 754E+08 524E+08 227E+0872 654E+0884 763E+0890 817E+0866 599E+0857 518E+0889 808E+0867 608E+0830 272E+0820 182E+0834 309E+0828 254E+08
mdash30 272E+08
6 39 354E+08 35E+08 123E+0846 418E+0854 49E+0859 536E+0852 472E+0818 163E+08
101
30 272E+0825 227E+0835 318E+0848 436E+0852 472E+0840 363E+0828 254E+0814 127E+08
8 17 386E+06 545E+06 286E+0611 250E+0612 272E+0623 104E+07
9 409E+0616 726E+0620 908E+06
8 363E+0618 35 159E+07 113E+07 430E+06
37 168E+0736 163E+0734 772E+0627 613E+0639 885E+0654 123E+0728 636E+06
21 300 681 E+07 365E+07 201 E+07275 624E+07300 681 E+07255 579E+07275 624E+07
85 193E+0767 152E+0779 179E+0770 159E+0793 211 E+0770 318E+0761 277E+0750 227E+0748 218E+0778 354E+07
24 42 191 E+07 682E+07 510E+0757 259E+0770 318E+0767 304E+0749 222E+07
270 123E+08305 138E+08385 175E+08270 123E+08
102
74 336E+07124 563E+0775 340E+07
165 749E+07
103
APPENDIX G
Flow Cell Experiments Viable CountsPlate Counts
104
Plate counts were conducted by placing ten 10 microliter drops of properly diluted
effluent and influent on plate count agar plates and incubating overnight at room
temperature before counting Several serial dilutions were made for each sample to ensure
that countable plates 3 to 300 colonies were obtained Only viable cells would develop
into colonies on the plates therefore the counts performed in this manner are classified as
viable counts or plate counts
105
Control Plate counttime (in) count cone (cellsml) average std dev
0 159 159E+07 936E+06 628E+06193 193E+07188 188E+0768 680E+0664 640E+0658 580E+0632 320E+0648 480E+0632 320E+06
2 298 298E+07 374E+07 852E+06289 289E+07329 329E+07
54 540E+0739 390E+0740 400E+07
4 79 790E+06 330E+07 328E+07111 111E+0798 980E+0692 920E+0786 860E+0723 230E+0721 210E+0713 130E+07
6 0
time (in) ave cone std dev time (out) ave cone std dev0 936E+06 628E+06 0 249E+06 222E+062 374E+07 852E+06 2 993E+06 293E+064 330E+07 328E+07 4 208E+07 922E+066 0 0 6 111E+07 0
8 147E+07 016 113E+05 235E+0418 281E+05 020 449E+05 417E+0521 371 E+05 024 138E+05 109E+05
Polymer | 130E+06
106
area average std dev72578 7139433333 44072296550376102
density537E+04 548E+04 3474333595E+04512E+04
107
time(out) count cone (cellsml) average std dev0 49 490E+06 249E+06 222E+06
50 500E+0667 670E+06
7 700E+056 600E+05
9 900E+0517 170E+068 800E+05
11 110E+062 125 125E+07 993E+06 293E+06
122 122E+07119 119E+07
9 900E+0610 100E+074 400E+06
4 30 300E+07 208E+07 922E+0633 330E+0731 310E+07
104 104E+0794 940E+06
106 106E+0721 210E+0721 210E+0713 130E+07
6 no data
16 71 710E+04 113E+05 235E+04105 105E+05120 120E+05
15 150E+0511 110E+0512 120E+05
20 24 240E+04 449E+05 417E+0526 260E+0453 530E+0477 770E+0589 890E+0593 930E+05
24 17 170E+05 138E+05 109E+0526 260E+05
I 29 290E+05
108
26 260E+0459 590E+0420 200E+04
Polymer 10 100E+06 130E+06 551 E+0513 130E+0613 130E+0658 580E+0556 560E+05
119 119E+06 -
171 171E+06161 161 E+06244 244E+06
109
triglyme Plate countstime (in) count cone (cellsml) average std dev
0 167 167E+08 108E+08 700E+07184 184E+08182 182E+0831 310E+0737 370E+0747 470E+07
2 86 bull 860E+07 522E+07 334E+0778 780E+0774 740E+07
120 120E+07112 112E+07
4 159 159E+08 562E+07 489E+07116 116E+08145 145E+07244 244E+07224 224E+07
42 420E+0732 320E+0739 390E+07
6 000
time (in) ave cone std dev0 108E+08 700E+072 522E+07 334E+074 562E+07 489E+076 0 0
lt Z
Polymer density782E+06 441 E+06 248E+05
248E+05area Average 283E+05
94558 90723333339458883024
time (out) average std dev
no
O 882E+07 714E+072 336E+07 125E+074 821E+07 139E+076 214E+07 439E+078 223E+06 125E+05
16 326E+06 018 352E+06 246E+0620 773E+06 021 984E+06 105E+0724 299E+06 101 E+06
Polymer 50 500E+06 782E+0661 610E+0662 620E+06
108 108E+0747 470E+0615 150E+0716 160E+0713 130E+07
331 331 E+06281 281 E+06301 301 E+06
97 970E+0660 600E+06
I l l
time (out) count cone (cellsml) average std dev0 167 167E+08 882E+07 714E+07
136 136E+08173 173E+08176 176E+07186 186E+07168 168E+07
2 51 510E+07 336E+07 125E+0747 470E+0746 460E+0740 400E+0752 520E+0734 340E+07
177 177E+07188 188E+07213 213E+07
24 240E+0725 250E+0726 260E+07
4 77 770E+07 821 E+07 139E+0797 970E+07
104 104E+0860 600E+0767 670E+0791 910E+0778 780E+0783 830E+07
6 48 480E+06 214E+07 439E+07-34 340E+06 r
35 350E+0630 300E+06
ave 28 280E+06260E+05 34 340E+06
stddev 129 129E+081626657 8 22 220E+06 223E+06 125E+05
24 240E+0621 210E+06
18 153 153E+06 352E+06 246E+06225 225E+06198 198E+06
112
22 220E+0615 150E+0616 160E+0662 620E+0660 600E+0684 840E+06
21 179 179 E+06 984E+06 105E+07275 275E+06247 247E+0622 220E+07
3 300E+0627 270E+07
441 E+06 24 254 254E+06 299E+06 101 E+06240 240E+06264 264E+06
30 300E+0637 370E+0658 580E+0620 200E+0631 310E+0616 160E+06
279 279E+06338 338E+06297 297E+06
113
ciprotriglyme Plate countstime (in) count cone (cfuml) average std dev time (out)
0 15 150E+08 654E+08 307E+08 013 130E+0843 430E+0889 890E+0887 870E+0882 820E+0884 840E+0884 840E+0892 920E+08
2 96 960E+08 103E+09 48E+0881 810E+08
116 116E+09164 164E+09169 169E+09 2184 184E+0954 540E+0897 970E+08
128 128E+093 300E+085 500E+087 700E+08
4 55 550E+08 918E+08 363E+0831 310E+0890 900E+0814 140E+0910 100E+09 44 400E+08
90 900E+0899 990E+08
115 115E+09100 100E+0980 800E+08
162 162E+096 0 0
6
time (Out) average std dev0 506E+06 553E+062 121E+09 944E+084 192E+08 166E+086 121E+08 112E+08 I8 140E+06 116E+06
16 900E+05 0 I18 774E+05 980E+05 I
20 120E+06 0 |21 141E+06 110E+06 i
114
24 1642+06 1902+06 8
density773698491 7761707346 2284489805303975749509738
18area
94352 9412+02 2762+019064997397
21
Polymercount cone (cfuml) average std dev
23 2302+03 2432+03 9982+0236 3602+0330 3002+03
2 2002+034 4002+033 3002+032 2002+031 1002+031 1002+03
24
115
count cone (cfuml) average std dev23 2302+04 5062+06 5532+0621 2102+0420 2002+04
114 1142+07103 1032+07120 1202+07
10 1002+0713 1302+079 9002+060 0002+000 0002+000 0002+000 0002+00
87 8702+08 1212+09 9442+0892 9202+08
190 1902+09102 1022+0975 7502+0896 9602+0872 7202+0891 9102+08
167 1672+096 6002+082 2002+08
40 4002+0957 5702+08 1922+08 1662+0825 2502+0836 3602+08
128 1282+0893 9302+07
168 1682+0856 5602+0748 4802+0755 5502+0748 4802+07 1212+08 1132+0851 5102+0790 9002+07
149 1492+08180 1802+08162 1622+08261 260E+0812 i 1202+0839 3902+0870 7002+0539 3902+0565 6502+05
116
3 300E+05 140E+06 116E+0615 150E+0645 450E+0689 890E+05
127 127E+06127 127E+0610 100E+0614 140E+065 500E+058 800E+05 774E+05 918E+05
19 190E+0629 290E+06
199 199E+05225 225E+05213 213E+0523 230E+0525 250E+0525 250E+0536 360E+05 141 E+06 110E+0692 920E+0594 940E+0553 530E+0582 820E+0567 670E+05
8 800E+058 800E+05
10 100E+06169 169E+06142 142E+0624 240E+0645 450E+0629 290E+0625 250E+04 164E+06 190E+0629 290E+0452 520E+046 600E+048 800E+041 100E+04
139 139E+0610 100E+0638 380E+0662 620E+0632 320E+0621 210E+0634 340E+06
117
BMA Plate counts
time (in) count cone (cfuml) average std devO 53 530E+07 974E+07 377E+07
59 590E+0759 590E+0784 840E+07
123 123E+08139 - 139E+08
9 900E+0717 170E+0810 100E+08
2 23 230E+07 357E+07 441 E+0723 230E+0720 200E+07
165 165E+0838 380E+0673 730E+06
231 231 E+0724 240E+0739 390E+0729 290E+07
4 17 170E+07 171 E+07 575E+0619 190E+0711 110E+07
220 220E+07213 213E+07228 228E+07
21 210E+0716 160E+0726 260E+07
6 600E+0612 120E+0711 110E+07
6 0 0
118
time(out) average std dev0 499E+07 154E+072 413E+07 179E+074 577E+07 526E+076 129E+07 496E+068 149E+06 912E+05
16 428E+06 018 498E+06 414E+0620 635E+06 021 704E+06 394E+0624 106E+07 225E+06
=
119
Polymercount cone average std dev
27 270E+06 117E+07 13381334127 127E+0732 320E+0743 430E+0739 390E+0640 400E+0636 360E+06 density41 41 OEf 06 404E+05 391 E+0559 590E+06 385E+0554 540E+06 384E+05
area average std dev87061 900566667 21217235669140691703
120
time (out) count cone (cfuml) average std dev0 40 400E+07 499E+07 154E+07
35 350E+0750 500E+0781 810E+0770 700E+0757 570E+07
408 408E+07386 386E+07367 367E+07
2 37 370E+07 413E+07 179E+0725 250E+0736 360E+0765 650E+0777 770E+0734 340E+0725 250E+0731 310E+07
4 46 460E+07 577E+07 526E+0733 330E+0732 320E+07
158 158E+0892 920E+07
130 130E+0813 130E+079 900E+066 600E+06
6 92 920E+06 129E+07 496E+0672 720E+0688 880E+06
9 900E+067 700E+067 700E+06 - -
169 169E+07192 192E+07191 191E+0720 200E+0714 140E+0724 240E+07
101 101E+07119 119E+07149 149E+07
10 100E+0712 120E+07
11 110E+078 46 460E+05 149E+06 912E+05
13 bull130E+05|
121
13 130E+05191 191E+06217 217E+06244 244E+06
18 180E+0624 240E+0620 200E+06
18 46 460E+06 498E+06 414E+0654 540E+0646 460E+06
3 300E+064 400E+06
18 180E+0738 380E+0655 550E+0652 520E+0622 220E+0613 130E+0622 220E+06
21 26 260E+06 704E+06 394E+0631 310E+0644 440E+06
3 300E+063 300E+063 300E+06
93 930E+0699 990E+06
106 106E+0716 160E+07
8 800E+067 700E+06
62 620E+0671 710E+0675 750E+06
8 800E+0615 150E+07
3 300E+0624 90 900E+06 106E+07 225E+06
89 890E+0690 900E+0613 130E+0713 130E+0711 110E+07
111 111E+0797 970E+0E
107 107E+07V 140E+077
i 5 130E+07
122
15 150E+0787 870E+0680 800E+06
124 124E+077 700E+06
10 100E+078 800E+06
123ciproBMA Plate countstime (in) count cone (cfuml) average std devO 80 800E+07 490E+07 212E+07
64 640E+0777 770E+0742 420E+0755 550E+0753 530E+0726 260E+0723 230E+0721 210E+07
2 31 310E+07 592E+07 235E+0731 310E+0743 430E+0759 590E+0764 640E+07
114 114E+0867 670E+0764 640E+0760 600E+07
4 75 750E+07 572E+07 206E+0770 700E+0786 860E+0742 420E+0738 380E+0732 320E+07
6 000
II
1 2 4
time(out) average std dev0 444E+07 154E+072 478E+07 203E+074 404E+07 198E+076 236E+07 125E+078 185E+05 104E+05
16 284E+06 018 328E+06 557E+0620 374E+06 021 386E+06 528E+0624 210E+06 580E+05
PolymerPlates were all blank for every dilution
11
~
125
15time (out) count cone (cfuml) average std dev
0 31 310E+07 427E+07 153E+0728 280E+0737 370E+0749 490E+0749 490E+0749 490E+0779 790E+0733 330E+07
2 29 290E+07 478E+07 203E+0725 250E+0717 170E+0767 670E+0781 810E+0768 680E+0745 450E+0748 480E+0750 500E+07
4 52 520E+07 404E+07 198E+0750 500E+0756 560E+0755 550E+0772 720E+07
147 147E+07143 143E+0728 280E+0722 220E+07
6 24 240E+07 236E+07 125E+0749 490E+07
138 138E+07126 126E+07150 150E+07
12 120E+0716 160E+0713 130E+0742 420E+0734 340E+0728 280E+07
8 11 110E+05 185E+05 104E+0524 240E+0532 320E+0580 800E+04
117 117E+0591 910E+0434 340E+05
18 56 560E+04 328E+06 557E+0660 600E+04
126
57 570E+046 600E+044 400E+049 900E+04
82 820E+0581 810E+0585 850E+0515 150E+0611 110E+067 700E+05
152 152E+07137 137E+07142 142E+07
21 183 183E+07 386E+06 528E+06111 111E+07126 126E+07186 186E+06159 159E+06148 148E+06
10 100E+0616 160E+0615 150E+0666 660E+0584 840E+0561 610E+0522 220E+0610 100E+0615 150E+06
24 22 220E+06 210E+06 580E+0524 240E+06
131 131E+06167 167E+06141 141E+0620 200E+06 - -
28 280E+0630 300E+06
127
APPENDIX H
M athematical Theory
128
M ATHEM ATICAL THEORY
Kwok (1997) used Basmadjian and Sefton to determine that the drug concentration
immediately next to the polymer in a tube was
CZCNkill rD ) = A [ (xr0)ReSc]13 where (xroReSc)lt104-103
Cs - surface concentration (|igcm5)
Nkill - minimum killing release rate (|Jgcm2s)
R0 - effective hydraulic radius (cm)D - diffusivity of ciprofloxacin in fluid (cnfs)A - constant for geometry x - axial distance from the entrance (cm)
Re - Reynoldrsquos number Sc - Schmidt number
Laminar flow with constant velocity v was used estimate Nkill as 57 x 10J pgcnrs
using the equation above
The ciprofloxacin impregnated polymers were assumed to behave as if dissolution
into a falling film was occurring allowing Pickrsquos second law of diffusion to be modified as
follows
Pickrsquos second law of diffusion
MciZMt = Dip M2CiZMx2
does not adequately model the controlled-release of ciprofloxacin as it does not take into
consideration the fluid flow over the polymer and results in a t12 release rate A better
129
equation would be
vz(x) McMz = Dip M2CiZMx2
where fluid flow is assumed to be occur in the z direction and diffusion is assumed to be in
the x direction The following boundary conditions should be sufficient for the situation
encountered in the flow cell over the first 24 hours
I) O gt Il O at N Il O
2) O gt Il O at y mdash co
3) O gtIl O pound at
OIlThe solution therefore is
CaZCao = erfc [yZ(4DzZvmax)]
130
APPENDIX I
Polymer Surface Area Measurements
131
POLYMER Date of experiment Surface area (mnV)Control 6997 72578
62897 6550372697 76102
Triglyme 8897 9455881097 9458882297 83026
Ciprotriglyme 81697 9064982497 9739782997 94352
BMA 83197 870619797 9140692197 91703
CiproBMA 9597 8818191497 8760691997 85282
MONTANA STATE UNIVERSITY LIBRARIES
3 1762 10302039 O
1
i

I
IN TR O D U C TIO N
The National Institutes of Health have defined a biomaterial ldquoas any substance
(other than a drug) or combination of substances synthetic or natural in origin which can
be used for any period of time as a whole or as a part of a system which treats augments
or replaces any tissue organ or function of the bodyrdquo Thus biomaterials will have an
impact on virtually everyone at some point in their life
Biomaterials may be used for long term applications such as central nervous
system shunts extended wear contact lenses or hemodialysis systems They may be
employed in short term applications like contact lenses needles for phlebotomy or
vaccination cardiopulmonary bypass systems or wound healing devices Or biomaterials
may be utilized in permanent implants such as heart valves periodental restorative devices
intraocular lenses or orthopedic devices(NIH Consens 1982)
AU biomedical implants are susceptible to bacterial colonization and subsequent
biofilm formation Biofilms are three dimensional gelatinous structures consisting of
adherent bacteria and insoluble polysaccharides secreted by the bacterial cells Bacteria use
the biomaterial as a substratum to which they attach and adhere resulting in a biomaterial
centered infection Biofilm infections are extremely difficult to eradicate The biofilm gel
matrix cannot only keep the host defense mechanisms from reaching andor recognizing the
adherent bacteria but biofilms can also lower the efficacy of antibiotics Usually the only
way to deal with a device-centered infection is to remove the infected implant which is
costly as well as traumatic to the patient Therefore it is desirable to develop a material that
wiU inhibit bacterial colonization
The objective of the research presented in this thesis was to ascertain the
effectiveness of four different formulations of a biomedical grade polyurethane Biospantrade
at inhibiting bacterial colonization under flow conditions The scope of this work
2
included (I) evaluation of four Biospantradepolyethylene glycol (PEG) matrix biomaterials
two of which contained the antibiotic ciprofloxacin (2) development of a flow cell system
to evaluate the potential for bacterial adhesion and biofilm formation and (3) development
of a novel staining technique to allow for the visualization of bacteria against an opaque
surface without interfering with normal cell behavior
3
LITERA TU RE REVIEW
Background and Significance
Biomaterials have been used in the human body since the early 1900s when bone
plates were introduced to stabilize fractures and speed healing By the 1950s
experimentation into the replacement of blood vessels had begun and by the 1960s
artificial hip joints and heart valves were under development As science and engineering
has advanced so has the clinical use of biomaterials(Blanchard 1996 NIH Consens
1982)
Biomedical implants are no longer used just in life-threatening situations They are
now utilized in every major body system for three general purposes (I) to preserve life or
limb (2) to restore or improve function and (3) to restore or improve shape The first
category includes most neurosurgical and cardiovascular implants such as pacemakers
and hydrocephalus shunts Dental implants and joint replacements are included in the
second category while biomaterials used in reconstructive surgeries are placed in the last
class(NIH Consens 1982)
Estimates in 1982 placed biomaterial implant use in the United States for that year at
several million The demand for biomaterials is said to grow by 5 to 15 percent a year and
will only increase as the population ages and the expectations of maintaining a good quality
of life increase What was a multi-million dollar per year industry in the US now exceeds
$10 billion a year This figure is especially remarkable given that the US only represents
about 10 percent of world demand (Blanchard 1996 NIH Consens 1982 Brictannica
Online 1997)
One of the major risks encountered in the extended use of implants is the
susceptibility of biomaterials to bacterial attachment and adhesion resulting in biomaterial-
4
centered infections The three most common bacterial species implicated in these infections
are Pseudomonas aeruginosa Staphylococcus epidermidis and Staphylococcus aureus
Esherichia coli Proteus mirabilis and beta hemolytic Streptococcus spp have also been
isolated from contaminated implants (Gristina 1987 Gristina 1994)
Once bacteria begin adhering to implant material they can form a biofilm that is
extremely difficult to eradicate The biofilm can not only prevent the host defense
mechanisms from reaching andor recognizing the bacteria but it can also lower the
efficacy of antibiotics Usually the only way to deal with biofilm infections is by removal
of the implant which can be costly as well as traumatic to the patient (Blanchard 1996
Gristina 1987 Gristina et al 1993) Tlierefore it is desirable to develop a biomaterial
that will inhibit bacterial colonization
There are two common approaches to preventing bacterial colonization The first is
to modify the substratumrsquos surface chemistry rendering it non-adhesive and the second is
to design a material which will slowly release an antibacterial agent killing the bacteria
before they reach the surface (Bryers 1997)
Processes G overning Biofilm Form ation
The establishment of a biofilm (figure I) involves many steps (I) preshy
conditioning of the surface by adsorption of organic molecules (eg protein) from the fluid
phase (2) cell transport to the substratum (3) cell adsorptiondesorption (4) permanent
adhesion to the surface (5) cellular metabolism (growth replication death) and (6)
biofilm removal (detachment and sloughing) Pre-conditioning involves coating the
surface with host- derived proteins such as fibronectin human serum albumin and
platelets (Tebbs Sawyer and Elliot 1994 Carballo Ferreiros and Criado 1991 and
Yu et al 1995) Cell transport to the surface may occur through passive processes such
5
as diffusion or fluid flow or active processes such as flagellar movement Reversible
adsorption (adsorptiondesorption) of cells to the substratum can be explained in terms of
the laws of colloid chemistry such as the Derjaguin-Landau and Verwey-Overbeek
Figure I Biofilm formation (I) pre-conditioning (2) cell transport to surface (3) cell adsorptiondesorption (4) permanent adhesion (5) proliferation and (6) removal
(DLVO) theory Electrostatic forces and London-van der Waals forces combine to bring
particles andor cells to a surface by helping to overcome energy barriers allowing the cells
to form a loose attachment with the substratum (Eginton 1995 Characklis and Marshall
1990 Weber and DiGiano 1996) Within a certain distance of the substratum permanent
adhesion becomes possible through such mechanisms as specific binding to proteins in the
conditioning film or hydrogen bonding Once at the surface colonization can begin Cells
begin to produce exopolysaccharides (EPS) literally gluing themselves to the surface
6
Within this EPS matrix the cells continue to grow divide and die Occasionally chunks
of the biofilm will detach as a result of either shear forces or weaken of the bonds holding
them to the substratum (Characklis 1990)
Surface M odification
Eveiy natural and synthetic surface has unique physical and chemical properties that
can influence cellular adhesion By modifying the biomaterial surface the fundamental
processes governing biofilm formation can be altered Several review articles discuss these
processes in detail (Cristina et al 1994 Cristina Naylor and Myrvik 1992 Bryers
1988 Characklis 1990 Dankeit Hogt and Feijen 1986) and acknowledge the similarities
between bacterial colonization and tissue integration In many situations host cells are
actually competing with bacteria to colonize the biomaterial surface Thus many surface
modifications are aimed at intentionally promoting natural tissue adhesion while others are
directed at preventing bacterial adhesion
M odifications Host Cell A dhesion
Techniques focused on promoting tissue integration range from endothelial cell
sodding to glow plasma discharge modification (Williams et al 1992 Massia and
Hubbell 1991) The coating of silicone rubber membranes with poly (2-hydroxy ethyl
methacrylate) (poly HEMA) by glow plasma discharge has shown encouraging results in
vitro with regard to the attachment and growth of corneal epithelial cells bringing the
development of an artificial cornea one step closer to reality (Lee et at 1996)
7
Hydroxylapatite (HA) coatings of bone implants have already proven effective at promoting
faster and greater bone adaptation and improving implant fixation Better techniques of
applying the calcium phosphate to the implant are being examined including plasma spray
heat-treated plasma spray and magnetron-sputter (Hulshoff et al 1996) Carbon
deposition excimer laser ablation and photochemical coatings are being examined as ways
of promoting and controlling endothelial cell proliferation (Kaibara et al 1996 Doi
Nakayama and Matsuda 1996) Surface modifications may also decrease the binding of
host proteins such as thrombin and anti thrombin III thereby lowering the potential to form
blood clots which can promote bacterial adhesion A common method of accomplishing
this is by immobilizing heparin on the surface (Byun Jacobs and Kim 1996 Paulsson
Gouda Larm and Ljungh 1994 Lindhout et al 1995)
M odifications Bacterial Cell A dhesion
Methods for inhibiting bacterial colonization range from antithrombogenic coatings
to the incorporation of antimicrobial substances such as silver or quaternary amine salts (
Wang Anderson and Marchant 1993 Ryu et al 1994 Jansen and Kohnen 1995)
Heparin is only one of the substances used to coat surfaces which have been shown to
decrease bacterial adhesion due to protein-mediated adhesion Poly(vinyl pyrrolidone)
(PVP) coatings which inhibit the adsorption of fibrinogen to the surface have also exhibited
decreased bacterial adhesion (Francois et al 1996) Reductions in bacterial adhesion to
silastic catheters coated with salicylic acid a nonsteroidal anti-inflammatory drug have
been demonstrated in vitro (Farber and Wolff 1993) Coatings of hydrophilic polymers
such as polyethylene glycol (PEG) have shown potential for inhibiting implant-related
infections (Portoles Refojo and Leong 1994) Latex catheters coated with
8
glycomethacrylate gel another hydrophilic polymer have also demonstrated the ability to
reduce infection The reduction was enhanced by the incorporation cephalothin an
antibiotic (Lazarus et al 1971) The elution of an antimicrobial from the implant is one
of the most popular and oldest methods of dealing with biomaterial-centered infections
illustrated by the use of antibiotic impregnated bone cement (Strachan 1995 Seyral et al
1994) As already seen however the incorporation of antibiotics and other antimicrobials
has also been studied with regard to various polymer systems (Rushton et al 1989
Ackart et al 1975 Golomb and Shplgelman 1991 Greenfeld et al 1995) As
knowledge about the immune system increases so does the potential for developing new
substances that can coat biomaterials or be released from them to provide protection against
bacterial colonization as witnessed by development of passive local immunotherapy
(Gristina 1997)
Controlled Release
Controlled release of antibiotics at the site of implantation is one of the more
common approaches to preventing infection and is being used successfully in orthopedic
surgery A recent US survey showed that 27 of responding hospitals commonly use
antibiotic impregnated bone cement for joint replacement surgery (Strachan 1995)
However the use of bone cement is not recommended in younger active people
Consequently the controlled release of antibiotics from coated implants is under
investigation (Price et al 1995) Thus it can be seen that there are several different types
of controlled release systems
9
Controlled Release System s
Controlled release devices are classified by the method that controls the release of
the substance of concern The most common classifications are diffusion controlled
systems chemical reaction systems and solvent activated systems There are several
excellent books and articles that cover this subject in depth (Langer and Wise 1984 Kost
and Langer 1984 Fan and Singh 1989 Baker 1987 Lohmann 1995 Kydonieus 1992
Robinson and Lee 1987) so only a brief overview will be given here
Controlled release systems can be designed to produce release rate profiles that
enhance the efficacy of the desired agent This is in contrast to sustained release devices
which allow the substance of concern to be effective longer but are dependent on
environmental factors when it comes to the amount and the rate of release
The three most common release profiles achieved by controlled release devices are
(I) zero-order release (2) first-order release and (3) t 12 release shown graphically in
figure 2 Zero-order release is the most desired release rate and is most easily obtained
by using diffusion controlled release systems (Kost and Langer 1984 Lohmann 1995)_
D iffusion Controlled D ev ices There are two general types of diffusion
controlled systems (I) matrix or monolithic and (2) reservoir The rate limiting step in
both systems is the diffusion of the drug through the polymer matrix which may be
described by (l)F ickrsquos first law of diffusion and (2) Pickrsquos second law of diffusion also
called the diffusion equation (Bird Stewart and Lightfooi 1960) For a one dimensional
system they may be written as
10
Release rate kinetic
^ first-order release
square-root of time release
zero-order release
Figure 2 Zero-order first-order and square-root of time release patterns from contolled-release devices
( 1 ) Ji = - D ip raquo d c d x
(2) bCjbt = Djp trcb2
Ji - mass flux of solute (drug) i
Ci - concentration of solute i
x - position of release
t - time
Djp - solute diffusion coefficient through the polymer
11
Equation (I) is commonly used to simulate the release rates from reservoir devices
The diffusion coefficient is a measure of the mobility of the individual solute molecules
through the reservoir membrane and is considered concentration independent The
concentration gradient in the membrane is represented by dCdx The negative sign reflects
the movement of solute down the concentration gradient toward more dilute regions If the
membrane is saturated with solute a burst effect may be seen which causes an initial spike
of solute A lag effect occurs when the solute must first permeate the membrane before it is
released (Baker 1987 Langer and Peppas 1981)
Equation (2) is obtained by combining equation (I) with the continuity equation for
mass transfer assuming no reaction and zero velocity Equation (2) describes transient
diffusion in membranes The diffusion coefficient is considered to be concentration
dependent It results in the square root of time release rate for simple geometries such as a
one-dimensional slab (Baker 1987 Langer and Peppas 1981) Detailed discussions on
the applications assumptions and solutions of both these equations can be found in the
literature (Langer and Wise 1984 Kost and Langer 1984 Fan and Singh 1989 Baker
1987 Lohmann 1995 Kydonieus 1992 Robinson and Lee 1987 Langer and Peppas
1981)
Monolithic devices are made by mixing the substance of concern with the polymeric
material to form a solution from which the finished product is manufactured The drug to
be released may be dissolved or dispersed (supersaturated) in the resulting polymer
depending on how much is ldquoloadedrdquo into the carrier polymer Examples of monolithic
devices include flea collars and antibiotic loaded bone cement
Examples of reservoir systems include nitroglycerin skin patches Norplanttrade a
subcutaneous birth control device and Ocusertrx1 a contact lens like device used to neat
glaucoma In these types of systems the substance of interest is surrounded by an inert
12
membrane which may be either porous or non-porous If the membrane is porous the
drug simply diffuses through the pores but if the membrane is non-porous the drug must
first dissolve in the membrane structure before it can diffuse along and between the
segments of the membrane Reservoir systems are known for the ease with which they can
be designed to achieve zero-order release rates
Both monolithic and reservoir diffusion controlled systems are rate limited by the
diffusion of the drug through the polymer Tlie choice of polymer and the resulting effect
on the diffusion and partition coefficient of the substance of concern as well as the
geometry of the device will influence drug release rates (Kost and Langer 1984 Lohmann
1995)
Chem ically Controlled S ystem s When the substance of concern is encased
in a biodegradable non-diffusive polymer the resulting reservoir device is classified as a
chemical reaction system As seen in the diffusion controlled devices there are two basic
types of biodegradable devices (I) reservoir and (2) monolithic The release rates of these
systems are strongly influenced by the erosion of the polymer In the ideal case surface
erosion would be the only factor affecting the release rate however this system has yet to
be designed (Kost and Langer 1984 Lohmann 1995)
A second category of chemical reaction controlled release is chemical
immobilization In this type of system the substance of concern may be chemically bound
to the polymer carrier backbone or it may he part of the backbone The release rate is then
influenced by the enzymatic or hydrolytic cleavage of the appropriate bonds (Kost and
Langer 1984 Lohmann 1995)
13
Solvent Activated S y s te m s The last class of controlled release devices to
be mentioned here are the solvent controlled systems These fall into two categories (I)
swelling controlled and (2) osmotically regulated In both types the substance of concern
is either dissolved or dispersed within the polymer but it is unable to diffuse through the
polymer matrix until activated In the case of the swelling controlled system the solvent is
absorbed by the matrix causing the polymer to swell and allowing the active agent to
diffuse out In the osmotic system the solvent permeates the polymer-drug system due to
osmotic pressure which promotes release Release may occur by either simple Fickian
diffusion or by non-Fickian diffusion Detailed analysis of these and other controlled
release systems can be found in the references cited previously
A dvantages Controlled release systems offers several advantages over
conventional drug delivery systems The major advantage when dealing with biomaterial
centered infections is increased efficacy of the drug The drug can be administered at the
biomaterial site thereby allowing the therapeutic levels to be maintained locally while
decreasing the systemic drug level This will minimize side effects and improve
pharmokinetics In addition the effective drug level can be sustained for an extended
period of time (Kost and Danger 1984 Lohmann 1995)
The use in joint replacement surgery of antibiotic impregnated bone cement
combined with a polymer coating such as poly-L-lactic acid polymer (PLLA) has proven
popular for its ability to prevent infections as well as aid in joint fixation (Strachan 1995)
Controlled release of antibiotics from biomaterials is less common however in operations
involving other types of implants Nonetheless research in being done into this method of
inhibiting bacterial colonization A British study showed that antibiotic impregnated
silicone rubber coatings of implanted stimulator devices significantly decreased
14
postoperative infection when compared with systemic antibiotic prophylaxis (Rushton e t
al 1989) One of the newer antibiotics receiving attention as a treatment for biomaterial-
centered infections is ciprofloxacin
C iprofloxacin
Ciprofloxacin is a Iluorinated quinolone antimicrobial agent It is active against a
broad range of bacteria ranging from aerobic gram-negative bacteria to aerobic gramshy
positive bacteria Anaerobic bacteria however are not affected by ciprofloxacin It was
approved by the Food and Drug Administration in October 1987 (Wolfson and Hooper
1989 cponline 1997)
Like other quinolone agents ciprofloxacin is a synthetic antimicrobial which mainly
effects DNA gyrase the bacterial topoisomerase II The gyrase is a two subunit enzyme
responsible for regulating the supercoiling of DNA during replication and transcription
The A subunit of the gyrase introduces nicks in the DNA that allow the B subunit to twist
the single stranded DNA (ssDNA) around its complementary strand of DNA The A
subunit of the gyrase then seals the nicks It is believed that ciprofloxacin and the other
quinolones interfere with the A subunit preventing it from sealing the nicks Bactericidal
levels of quinolones do not affect mammalian topoisomerase enzymes The exact bacterial
killing mechanism is not known but detailed discussions about the mechanisms of
quinolones action can be found in WolfSon and Hooper (1989) It is known that both slow
growing and fast growing organisms are inhibited by ciprofloxacin and that a prolonged
post-antibiotic effect is exhibited by fluoroquinolones (Wolfson and Hooper 1989
cponline 1997 Craig and Ebert 1991 Cam pa Bendinelli and Friedman 1993)
15
Ciprofloxacin has the lowest minimum inhibitory concentration (MIC) of the
quinolones The MIC90 for P aeruginosa in vitro is between 025 (igml and I jigml
Thus ninety percent of the P aeruginosa strains will be inhibited at these low
concentrations (Craig and Ebert 1991 Campa Bendinelli and Friedman 1993) Due to
its wide antimicrobial range and low MIC ciprofloxacin was chosen as a model antibiotic
for incorporation into the test PEU polymers
16
MATERIALS AND METHODS
Bacteria and Cultures
Pseudomonas aeruginosa (ERC-I) was obtained from the National Science
Foundation Engineering Research Center for Biofilm Engineering Montana State
University Bozeman MT Cultures of P aeruginosa were stored as frozen stocks
maintained in a solution of 2 peptone and 20 glycerol at -70degC
Solutions
M edium
A minimal salts medium with glucose as the sole carbon source was used for
culturing bacteria A one liter solution consisted of 05g glucose 256g Na2HPO4 208 g
KH2PO 4 IOg NH4Cl Olg CaCl2 05g MgSO4 and 002ml of a trace metals solution
The trace metal solution was composed of 05 CuSO4-SH2O 05 ZnSO4-VH2O 05
FeSO4-VH2O and 02 MnCl2-4H20 all in a weight per volume ratio dissolved in 10
concentrated HCl (Manual of Industrial Microbiology and Biotechnology 1986) The trace
metals solution was autoclaved separately from the nutrient medium as was a 5M CaCl2
solution and a 2SM MgSO4 solution The glucose trace metals CaCl2 and MgSO4 were
all added to the sterile medium by injection through a septum after the medium had been
brought to room temperature All solutions were filler sterilized through a 02 |im sterile
syringe tip filter (Coming) before addition to the medium AU solutions were made using
Nanopure water (Bamstead ultrapure water system Nanopure system) and autoclaved in
glass containers at 121degC for 15 minutes per liter
17
CvtologicaI Stains
A 005 solution of Acridine Orange used for epifluorescent total cell counts was
filter sterilized using an autoclaved filter apparatus Hoechst 33342 (Sigma) was obtained
in IOOmg quantities and stored in a O0C freezer until a fresh solution was needed Then
IOml of sterile nanopure water were added through a 02 jam sterile syringe tip filter to
dissolve the powder Once the Hoechst solution was made it was kept in the refrigerator
All stains were stored in light sensitive bottles and made at fresh at least once a month
C iprofloxacin
Ciprofloxacin hydrochloride was obtained from Miles Inc as 867 fag
ciprofloxacinmg A 10000 fagml stock solution was made by dissolving 1153 mg of
powder in 10 ml of sterile nanopure water Tlte stock solution was stored in a light
sensitive glass container in the refrigerator for up to one year as per the supplierrsquos
recommendations
D etection A Milton Roy Spectronic 1201 spectrophotometer was used to
determine the proper wavelength for detecting ciprofloxacin Effluent samples were
collected from the flow cell filtered through a 02 (am sterile syringe tip filter (Corning)
and stored in amber microcentrifuge tubes kept in a 0degC freezer until analysis A Milton
Roy Spectronic 601 set at 339 nm was used to determine the concentration of ciprofloxacin
in the effluent from the flow cell_
18
Reactors and Flow Cell Systems
Continuouslvrstirred Tank Reactor (CSTR)
A CSTR was designed to provide a constant supply of Pseudomonas aeruginosa
at room temperature (230+3degC) in exponential growth A 125 ml filter flask was equipped
with an inlet outlet aerator and injection port to build the CSTR The arm of the filter
flask was situated so that overflow occurred when a volume of 128 ml was reached
Table I lists the parameters used for sizing the CSTR At steady-state operation tire
specific growth rate p is assumed to be equivalent to the dilution rate D Figure 3
shows a schematic of the chemostat setup The outlet lube from CSTR was connected to a
Specific growth rate (|_t) 0467+ 0025 hr1 (Appendix A)Volume (V) 128 mlVolumetric flow rate (Q) 10 mlminTable I Parameters used for sizing of biologic reactor
waste jug unless cells were needed for an experiment in which case the CSTR was
connected to a collection vessel A fresh clean sterile collection flask was used for every
experiment The setup was dismantled cleaned and sterilized at least once every two
weeks
Flow C ell
A schematic of the flow cell used to evaluate the test materials can be seen in figure
4 The polymer sample (P) was placed on a clear polycarbonate base which had entrance
and exit stainless steel portals milled into it A white FDA vinylnitrile rubber (D) gasket
19
Collectionvessel
CSTR
Figure 3 CSTR setup used to grow P aeruginosa continuously
was used to equalize sealing pressure around the polymer sample as the assembly was
screwed together A thin gauge natural latex rubber (C) gasket was clamped between the
test sample and coverglass (B) to form the flow channel The coverglass was glued over a
hole in the clear polycarbonate cover using the denture adhesive Fasteethreg Table 2
lists the dimensions of the flow channel and various hydrodynamic parameters AU of
the materials used in the flow cell were sterilized by dipping the components in 70 ethyl
20
Figure 4 Flow cell schematic (A) clear polycarbonate cover with hole through center for viewing (B) 2 glass coverslip (C) thin gauge natural latex gasket (D) white FDA vinylnitrile rubber sealing gasket (E) clear polycarbonate base (P) test
polymer
alcohol rinsing with sterile nanopure water and exposing to UV light for at least 15
minutes The test polymers were not exposed to UV The How cell was assembled
under a laminar flow hood to ensure sterility
Table 2 Flow channel dimensions and hydraulic parameters
width (w) 16 mmlength (I) 44 mmdepth (d) 08 mmarea (A) 128 mmwetted perimeter (P) 336 mmhydraulic radius (Rh) 04 mmReynolds number (Rp) 2 1entrance length (Lp) 01 mmwall shear stress (Jfl) 203 dynecnri
21
Microscope Setup and Techniques
Polym er A nalysis
The polymer samples were tested for bacterial adhesion and growth using an image
analysis system seen in figure 5 For the first six hours of the experiment approximately
5 x IO8 cellsml of stained Pseudomonas aeruginosa were flowed over the test polymer at
a rate of 10 mlmin For the remainder of the experiment complete medium without
bacteria was pumped through the flow cell
Hoechst 33342 Staining Procedure P aeruginosa in log growth were
collected and stained with lOpgml of Hoechst 33342 Once the stain was added to the
cells the flask containing the mixture was wrapped in foil and put on an insulated stir plate
for three hours After three hours the suspension was poured into a sterile centrifuge bottle
and centrifuged at 10000 xg for 15 minutes in a 20degC centrifuge (Sorvall Instruments
Dupont model RC5C GSA rotor) The liquid was then poured off and the cells were
resuspended in sterile complete medium minus the glucose The cells were washed twice
more before placing them in a sterile 125 ml Erienmeyer flask with a stir bar at a
concentration of approximately 5 x 10s cellsml This procedure was repeated every two
hours until the flow cell feed was switched to complete medium only at hour six
Cell V isualization At t=0 the flow cell was place on the stage of an
Olympus BH-2 Epi-Illumination UV upright microscope equipped with Olympus filter
combinations encompassing the ultra-violet violet blue and green regions of the
spectrum A 40x Nikon water immersion objective was used since the flow channel was
22
greater than 0100 mm in depth A minimum of three fields was captured by an Optronics
OPDEI-470OT cooled color CCD camera The resulting image was processed by a Targa
64+ analog digital converter (ADC) card and stored on computer until the image could be
analyzed using Image Pro Plustrade Images were taken every two hours until t=6 hours
when the feed was switched from the cell suspension to sterile complete medium The
remaining four time points captured were (I) t=7 or 8 hours (2) t=16 or 18 hours (3)
t=20 or 21 hours and (4) t=24 hours
Waste
Figure 5 Experimental setup Feed container = cell suspension t=0-6 hrs after t=6 hrs feed = complete medium Flow rate through flow cell 10 mlmin
23
Cell density calculations Tlie software system Image Pro Plus was used to
determine the density of cells on the polymer surface At the beginning each experiment an
image of a micrometer was taken to allow for the calibration of cell size and image area
Actual cell counts could be obtained at the early time points Cell density calculations were
then simply a matter of dividing cell count by the viewing area At time points greater than
8 hours the area occupied by cells was used to give a range for the cellular density This
was accomplished by dividing the area covered by the high and low published values for P
aeruginosa cell area (Holt 1994) to calculate cell numbers This method proved to be valid
as the cells numbers obtained at the early time points fell within the high and low range of
cell numbers calculated using area covered
In addition samples from both the inlet and outlet of the flow cell were collected for
total cell counts and viable cell counts Total counts and viable counts were also conducted
on a sample of the solution in which the polymer was placed at the end of the experiment
Before any sample was removed for these tests the polymer was sonicated for 30 seconds
to remove adherent bacteria This allowed for the calculation of cell density on the polymer
using total cell counts and viable cell counts
Total Cell C ounts A portion of each sample collected from the inlet outlet
and sonicated polymer solution was used to determine total cell counts One milliliter of
005 Acridine orange was combined with one milliliter of 2 glutaraldehyde and the
appropriate dilution of sample This solution was poured over a black polycarbonate
membrane (pore size 022 pm and 25 mm diameter Fisher Scientific) placed in a cell free
glass Millipore filter apparatus Suction was applied to trap the cells on the membrane
The membrane was mounted on a slide by putting a drop of oil (non-drying immersion oil
type FF) on a microscope slide placing the membrane cell side up on top of the oil drop
24
followed by a second drop of oil and covering with a glass cover slip The slide was
examined under fluorescent microscopy Bacteria were counted using an Reichert-Jung
Microstar IV model UV microscope with a mercury lamp and a Reicheit IOOx oil
immersion objective Total counts ( cellsgrid) were then converted to total cellsml using
the following conversion
total cells (cell count) (dilution) (conversion factor) ml ~ sample volume
where the conversion factor was 227 x 10
Viable Counts A part of the cell suspension sample was used to make serial
dilution for plating onto plate count agar (Difco Laboratories) plates A I(K) pl multipipetor
(Rainin epd 2) was used to dispense ten 10 pi drops of properly diluted cell suspension
onto a plate This procedure was performed in triplicate for each dilution plated Plates
were incubated at room temperature for 24 hours Drops that contained between 3 and 30
colonies were counted and converted to colony forming units (cfu)ml by taking into
account the dilution factor (Miles etal 1938)
Susceptibility and Adhesion Effect Studies
C iprofloxacin
Growth curves carried out in batch were used to determine the susceptibility of
increasing concentrations of ciprofloxacin on P aeruginosa These tests were not carried
out as most traditional MIC assays Studies here were performed as per the procedures of
25
Nodine and Siegler 1964 Lennette et al 1985 starting with a cell concentration of IO6
cellsml P aeruginosa was grown in separate batch cultures which contained various
concentrations of ciprofloxacin At time points ranging from t=0 to t=24 hours samples
were taken for viable counts
Hoechst Stain 1333421
Susceptibility studies were also conducted on Hoechst 33342 to ensure that the
stain did not interfere with normal cell growth The studies were conducted in the same
manner as the ciprofloxacin tests Concentrations of Hoechst stain examined ranged from
Ojagml (control) to 50|igml
Fasteethreg
Studies were also carried out to ensure that the denture adhesive Fasteethreg used
to glue the coverglass to the polycarbonate cover of the flow cell had no negative effect on
the growth of bacteria These studies were conducted in the same manner as those for
ciprofloxacin and the Hoechst stain
Hoechst Stain Effects on P a e r u g in o s a Adhesion
Tests were performed to determine whether the Hoechst stain interferes with the
normal adherence of the cells to a surface The flow cell was assembled without a polymer
sample and an untreated cell suspension was run through the cell for four hours Since the
base of the flow cell is a clear polycarbonate light microscopy could be used to monitor
cell adhesion using video recording Experiments were also carried out using stained cells
still in the staining liquid and stained cells that had been washed and resuspended in
ldquocleanrdquo medium
2 6
The possibility of ciprofloxacin and Hoechst interfering with each other was also
investigated Plate counts were used as in the susceptibility studies Microscope slides
were also made and any change in staining ability was noted
Tubing
All of the tubing used was FDA approved MasterFlex (Cole Palmer) for use with
either pharmaceuticals or food Tubing used included Pharmedreg size 1314 and 16
Norprenereg Food size 13 and 14 and Tygonreg Food size 14 Before each use it was
sterilized by autoclaving at 121degC for 15 minutes
Biom aterial Fabrication
BP Control Polym er
A poly (ether) urethane (Biospantrade) poly ethylene glycol (PEG) film (BP) was
prepared for use as a control The method of fabrication was as follows (I) 20 ml of
deionized water was used to dissolve 2 g of PEG (Polyscience) (2) the resulting solution
was lyophilized and the powder was sieved to obtain 90 pm or smaller particles (3) this
powder was mixed with a 24 Biospantrade solution (Polymer Technology Group Inc) (4)
the polymer solution was degassed transferred to a Teflon mold (Chemware) and
incubated at 60degC for one day and finally (5) the film was dried completely in a vacuum
chamber
27
Test Polym ers
The test polymers were manufactured by the same procedure except the
ciprofloxacin containing films also had an equal amount of ciprofloxacin added in step (I)
In addition the test polymers were coated with either triethylene glycol dimethyl ether
(triglyme) or tiiglyme plus n-butylmethacrylate (BMA) by glow discharge plasma
deposition (GDPD)
Note All test materials were fabricated at the University of Washington by Connie
Kwok
2 8
RESULTS AND DISCUSSION
Pseudomonas aerueinosa Growth Experiments
Batch S tud ies
Growth Rate Studies were conducted to determine the growth rate of P
aeruginosa under experimental conditions Table 3 (Appendix A) The specific growth
rate (I was found to be 0467 hr1
Experiment specific growth rate (h r1)I 04802 05023 04444 04436Average 0467plusmn0025Table 3 Specific growth rate for P a eru g in osa grown at room temperature with SOOppm
glucose fully aerated
Susceptibility S tu d ies In addition susceptibility studies were done on
ciprofloxacin Hoechst 33342 and Fas teethreg (Appendices BC and D) The
ciprofloxacin tests confirmed the published M IC90 of l(igml The Hoechst stain (33342)
were shown not to inhibit growth at 10 |_igml Table 4 summarizes the results of the
Hoechst 33342 susceptibility tests Results from the Fasteethreg susceptibility studies show
no negative effects on P a eru g in o sa
Hoechst 33342 concentration (pgml) Growth inhibited0 No5 No10 No50 YesTable 4 Summary of Hoechst 33342 studies
29
Flow Cell Experimental Protocol
The concentration of resuspended bacteria used to challenge the test polymers was
roughly 5 x IO8 cellsml The flow rate to the parallel plate flow cell was maintained at
approximately 10 mlmin for the duration of each experiment Samples were taken for
total counts and viable counts from both the system influent and the effluent at t = 0 2 4
and 6 hours for every experiment Only effluent samples were collected after t = 6 hours
Effluent samples were also used to determine if any ciprofloxacin eluted from the test
polymers containing the antibiotic All the experiments were earned out at room
temperature in the medium previously described
Flow Cell Experiments
The ability of a polymer to affect bacterial adherence and colonization was examined
in flow cell experiments run on four different formulations of a poly (ether) urethane (PEU)
base material The control material (BP) was a PEU base matrix (Biospantrade) containing
poly (ethylene glycol) (PEG) as a pore forming agent
The materials tested included (I) triglym e BP coated with triethylene glycol
dimethyl ether (triglyme) (2) ciprotriglym e BP made up of equal parts PEG and
ciprofloxacin coated with triglyme (3) BM A BP coated with a layer of n-
butylmethacrylate (BMA) underneath the triglyme coating and (4) ciproBM A BP made
up of equal parts PEG and ciprofloxacin coated with BMA followed by triglyme (Table
5) The triglyme coating was used to control the release rates of the model antibiotic
ciprofloxacin
30
Polym er FormulationBPControl BiospanlivV PEG (poly ethylene glycol)triglyme Triethylene glycol dimethyl ether coated BPciprotriglyme BP made with equal parts PEG and ciprofloxacin coated with triglymeBMA BP coated with n-butylmethacrylate followed by a coating of tryiglmeCiproBMA BP made with equal parts PEG and ciprofloxacin coated with BMA
followed by a coating of triglyme
Table 5 Description of polymers used in flow cell experiments
Three samples of each polymer were tested A good representation of the events at
the polymer surface is provided by image analysis (IA) as it is obtained from pictures of
the stained cells on the surface Figures 6 and 7 illustrate the attachment and growth of
P aeruginosa on the control polymer over the course of an experiment Figure 8
displays the differences in cell density on three different polymers after 24 hours in the
flow cell A significant decrease in bacterial adhesion and colonization was evident when
the test polymers were compared to the BP polymer at the end of the experiments and over
the entire run using pictures taken for TA (figures 6 7 and 8)
The graphs generated from the image analysis data (figures 9 10 and 11) were
obtained from a single run for each polymer Each experiment was however replicated
three times The error bars were obtained because at least three different fields of view
were taken for each time point from which the average cell density and the standard
deviation were calculated (Appendix E)
Figure 6 BiospanControl time course of cell adhesion
t=0 hours t=2 hours
t=4 hours t=6 hours
Figure 7 ControlBiospan polymer bacterial colonization
t=24 hours
Figure 8 Comparison of the extent of colonization of different polymers at t=24 hours
triglyme Cipro-triglyme
34
CNlt
EE
0)O
pound(AC0)O
100E+06
100E+05
100E+04
100E+03
100E+02
100E+01
100E+00 J -
I III bullbullbullbullbullbullbullbullbull Ce -
Control STrigIyme 0 ciproAriglyme S BMA S ciproBMA
Polymers
Figure 9 Dhiect counts of cell density on the polymer surface after 24 hours (L-R) Control triglyme ciprotriglyme BMA ciproBMA
Figure 9 clearly shows that the coatings of triglyme and BMA + triglyme reduce
bacterial colonization by at least half when compared to the BP control It can also be seen
from Figure 9 that the addition of ciprofloxacin to the polymer formulation decreases
bacterial colonization by at least two orders of magnitude Note that the y-axis on figure
9 is a logarithmic scale
35
60E+05
50E+05
40E+05
30E+05
20E+05
10E+05
OOE+OO I r
-10E+05
tim e (hrs
mdash Control
-laquo~-trigiyme
A ciprotriqlyme
FigurelO Time course cell colonization curve of control triglyme ciprotriglyme obtained from image analysis
Figure 10 shows that bacterial attachment and colonization to the control polymer is much
greater than to either the triglyme or ciprotriglyme polymer Analysis of the data in
Appendix E will show the same trend for BMA and ciproBMA At t = 6 hours the feed
was switched from a medium containing ~5 x IO8 cellsml with no glucose to a sterile feed
of complete medium plus 500 ppm glucose Therefore any increase in cell density can be
attributed to growth Slightly more growth can be seen on the triglyme than on the
ciprotriglyme over the course of the experiment however neither of these polymers
exhibits the growth found on the control polymer
36
Figure 11 reveals that bacteria are attaching to the triglyme and ciprotiiglmc
polymers but not to the same extent as to the BP control polymer The bacteria attach to
the control polymer at a rale ol 114 x IO4 ccllsmnrhr while the rates of attachment to the
triglyme and the ciprolriglymc are significantly lower 66 cel I smm 2Zhr and 537
C ellsZm m 2Zhr respectively While the attachment rate is greater on the ciprolriglymc than on
the triglyme The rale of growth is greater on the triglyme than on the ciprolriglymc It can
80E+04
70E+04
60E+04
E 50E+04
40E+04
30E+04
20E+04
10E+04
00E+00
-10E+04
time (hrs)
Control
triglyme
A ciprotriqlyme
Figure 11 Attachment rate differences are evident within the first 6 hours of the flow cell experiments The control polymer demonstrates a much more rapid attachment rate than either triglyme or ciprotriglyme
be seen from figure 10 that the control polymer exhibits an exponential rale of growth
from 1=16-24 hours that is significantly higher than either triglyme or ciprolryglmc Whal
37
is not readily seen is the fact that triglyme exhibits a faster growth rate than the
ciprotriglyme 181 x IO3 cellsmm2hr versus 27 cellsmm2hr
Total counts of the effluent found in Appendix F back up the imagae analysis
results ( figures 1213) F igure 12 shows that for the first six hours ~5xlO8 cellsml
are being pumped through the flow cell Once the supply of cells is cut off at t=6 hours
cells can still be seen in the effluent implying that growth of new cells is taking place in the
flow cell system
140E+09
120E+09
T=100E+09
S800E+08
S600E+08
agt400E+08
200E+08
000E+000 2 4 6 8 1012 141 6 1 8 20 22 24 26
mdash Control Triglyme
Ciprotriglyme- -x- - BMA
ciproBMA
time (hrsF igure 12 Total counts made with Acridine Orange From t=0-6 hours a feed
composed of a bacterial suspension in medium without a carbon source was pumped through the flow cell after t=6 hous the feed was switched to sterile complete medium
Figure 13 obtained from total cell counts displays the same trend with regard to
the amount of cell density on the polymer surface after 24 hours as figure 9 which was
made from direct count data The control polymer exhibits the highest cell density after
24 hours The effluent data does not demonstrate as much of a difference between
polymers as the image analysis data which may be explained by the growth and sloughing
of bacteria in the effluent tubing It is to be expected that the samples collected from the
Den
sity
(ce
lls
mm
A2)
38
effluent would have higher cell counts since there is more surface area available for cell
growth
100E+08 T
100E+07
100E+06
100E+05
100E+04
100E+03
100E+02
100E+01
100E+00Polym ers
I n Control | s Triglyme | ^Ciprotriglyme I SBMA I sciproBMA
Figure 13 Calculated cell density on the ldquotestrdquo polymers using total cell count (acridine orange) data Note that it follows the same trend as the image analysis data
Figure 14 shows that viable cells are being pumped through the flow cell while
figure 15 demonstrates that the concentration of ciprofloxacin at the polymer surface is
high enough to have a noticable effect on the density of bacteria on the polymer (Appendix
G - Plate Count Data)
39
Effluent viability data from t = 0-24hours
100E+10
100E+09
100E+08
j 100E+07 -
100E+06 -
100E+05
100E+04
time (hrs)
mdashmdash Control triglyme
bull-c ip ro tr ig ly m eBMA
-bull- ciproBMA
Figure 14 Plate count data from effluent samples taken from the polymer flow cells during the course of the experiments shows that viable cells are going through the flow cell
As stated previously total counts and viable counts are not considered to be as
accurate as direct counts The effect of the extra surface area available for cell adhesion and
growth provided by the tubing was not factored into the results Subsequent sloughing
andor entrapment of cells in this region of the flow cell setup could affect the cell
concentration data collected Figure 16 demonstrates the variation obtained from the
den
sity
(cf
um
mA2
)40
concentration data collected Figure 16 demonstrates the variation obtained from the
100E+06
SxltltSSSxgtxv-v
mm
I B
reg Control reg triglyme 0 ciprotriglyme 0 BMA Q ciproBMA
Polymers
Figure 15 Cell densities on polymers calculated from plate count data No colonies were found on any of the plates made for the ciproBMA polymer (L-R) Control triglyme ciprotriglyme BMA ciproBMA
same polymer using different techniques As stated previously the results obtained from IA
are considered to he the most accurate since they are taken from the polymer surface and
not the effluent
cell
dens
ity (c
ells
or c
fum
m2)
41
100E+07
100E+06
100E+05
100E+04
100E+03
100E+02
100E+01
100E+00 Plate counts Total counts IA
I
Figure 16 demonstrates the variations in bacterial density on the triglyme polymer after twenty four hours using image analysis (IA) acridine orange staining of the effluent and plate counts of the effluent
C iprofloxacin re lease
The extra surface area could also factor into the amount of ciprofloxacin detected in
the effluent (table 6) of the polymers incorporating ciprofloxacin In one millileter of
effluent roughly 3 ug of ciprofloxacin should be detected It should be noted that all of
the polymers containing ciprofloxacin still retained significant amounts of ciprofloxacin
This is to be expected given that the initial loading of ciprofloxacin was 04g Additionally
42
an earlier study found that these polymers continue to elute ciprofloxacin for up to 128
hours in a well stirred flask (Kwok CS et al 997) The erratic release of ciprofloxacin
seen in table 6 may be due to the interaction of the antibiotic with cells growing in the
effluent tubing ciprofloxacin degradation resulting
Experiment Time (hours) Cipro cone (figml) of points above detectionCiprotriglym e
O 35 plusmn21 2
2 17 I4 5 I6 4 I8 ND O18 ND O21 18 I24 5 + 5 2
CiproBM A O 6 plusmn 5 32 I I4 ND O6 ND O8 29 I18 2 I21 ND O24 ND O
Table 6 Ciprofloxacin concentrations in effluent ND = not detectable
from light exposure pulsating flow unforeseen release behavior or damage to polymer
coating Appendix H expands on the mathematical theory behind the controlled-release
of a drug from a one-dimensional slab under flow conditions
Overall the flow cells experiments showed that ciprofloxacin could successfully be
incorporated into BiospantradePEG polymers and still maintain its efficacy In addition
they demonstrated that cell adhesion and colonization of opaque materials could be
monitored continuously for up to 24 hours under Jlow conditions The results involving
the triglyme and BMA coatings were also encouraging
43
SUMMARY
The research conducted for this study involved exposing planktonic Pseudomonas
aeruginosa to 10 |igml of the DNA stain Hoechst 33342 for 3 hours The cell
suspension was then washed and resuspended in fresh complete medium minus glucose
the carbon source Every two hours for six hours a fresh batch of resuspended cells was
pumped over a ldquotestrdquo polymer in a flow cell being monitored microscopically for bacterial
attachment After six hours the flow was switch from the cell suspension to complete
medium plus glucose in order to observe cell adhesion and growth over the 24 hour run
Pictures were taken periodically over the course of the experiment and examined by image
analysis to detect changes in bacteria cell density on the surface of the ldquotestrdquo polymer The
results obtained from image analysis were for the most part confirmed by total and viable
cell counts performed on effluent samples Within the limitations and scope of this work
the results show that
1) Both the BMA coating and the triglyme coating can cut bacterial adhesion and
colonization in half
2) The addition of the ciprofloxacin to the polymer matrix decreases bacterial adhesion and
colonization by at least two orders of magnitude when compared with the control
3) Hoechst 33342 can be used at lOugml without interfering with P aeruginosa growth
patterns
4) Hoechst 33342 enables bacterial adhesion and biofilm formation on an opaque surface
to be monitored in a flow cell system for up to 24 hours
The results of this research indicate that it would be worthwhile to pursue
development of the ldquotestrdquo polymers for use as biomedical materials Further investigation
into how well image analysis correlates with actual bacterial cell adhesion and colonization
44
is also suggested from these results It would be interesting to run a set of experiments on
a substratum comparing image analysis and destructive sampling in which the flow cell is
broken down and the substratum is removed at every time point In addition a better
indication of the long-term performance of these materials could be gained by conducting
tests over a longer period of time a week or more Likewise the exposure of the material
to proteins before andor during bacterial challenge would provide more realistic test
conditions Dealings with industry have shown that the types of adhesion and colonization
experiments conducted in this study are among the initial steps in gaining approval from the
FDA
45
BIBLIOGRAPHY
Ackart WB Camp RL Wheelwright WL and JS Byck A n tim ic r o b ia l P o ly m e r s Journal of Biomedical Materials Research V 9 p 55 - 68 1975)
Baker RW Controlled Release of Biologically Active A gents John Wiley amp Sons New York NY 1987
Bellido F and REW Hancock S u s c e p t ib i l i ty a n d R e s is ta n c e o f P s e u d o m o n a s a e ru g in o sa to A n tim ic r o b ia l A g e n ts P s e u d o m a n a s a e r u g i n o s a as an Opportunistic Pathogen eds M Campa M Bendinelli and H Friedman Plenum Press New York NY p 321- 348 1993
Bird RB Stewart WE and EN Lightfoot Transport Phenomena John Wiley amp Sons New York NY p 495 - 625 I960
Blanchard CR B io m a te r ia ls B o d y P a r ts o f the F u tu re lthttpwwwswiiorg3pubsttodayfallimplanthtmgt June 4 1996
Bondi A B a s ic P h a m a c o lo g ic T ec h n iq u es f o r E va lu a tin g A n tim ic r o b ia l A g e n ts I Animal and Clinical Pharm acologic Techniques in Drug Evaluation eds JH Nodine and PE Siegler Year Book Medical Chicago IL p 440 - 450 1964
Bryers JD M o d e lin g b io ftlm a cc u m u la tio n Physiological Models in Microbiology V o l rsquol l ed Brazin MJ and Prossser JL CRC Press Boca Raton FE p1091
1988
Byun Y Jacobs HA and Sung Wan Kim M ec h a n ism o f th ro m b in in a c tiv a tio n b y im m o b il iz e d h e p a r in Journal of Biomedical Materials Research V 30 p 423 - 427 1996
Carballo J CM Ferreiros and MT Criado Im p o r ta n c e o f experim en ta l d e s ig n in th e e v a lu a tio n o f th e in flu en ce o f p r o te in s in b a c te r ia l a d h e re n c e to p o ly m e r s Medical Microbiology and Immunology V 180 p 149-155 1991
Characklis WG and KC Marshall eds Biofilms J Wiley amp Sons New York NY 1990
Ciprofloxacin Ciproreg Ciproreg IV C loxanreg Clinical Pharmacology Online lthttpwwwcponlinegsmcomscriplsfullmonoshowmonopl7mononum=I 12gtMay 19 1997
Clinical Applications of Biomalerials NIH Consens Statement 1982 Nov 1-3 [cited 1997 August 21] 4(5)1-19 httptextnlmnihgovnihcdcwww34txthtml
46
May 27 1996
Craig and Ebert Pseudomonas aeruginosa Infections amp Treatment p 467-491
Dankert J Hogt AH and J Feijen Biomedical Polymers Bacterial Adhesion Colonization and Infection CRC Critical Reviews in B iocom patibility V 2 p 219-301 1986
Doi K Nakayama Y and T Matsuda Novel compliant and tissue-permeable microporous polyurethane vascular prosthesis fabrication using an excimer laser ablation technique Journal o f Biomedical M aterials Research V 31 p 27 - 33 1996
Eginton PJ et al The influence o f substratum properties on the attachment o f bacterial cells Colloids and Surfaces B B io in terfaces V 5 p 153-159 1995
Farber BF and AG Wolff Salicylic acid prevents the adherence of bacteria and yeast to silastic catheters Journal o f Biomedical Materials Research V 2 7 p 5 9 9 - 6021993
Fan LT and SK Singh Controlled Release a Quantitative Treatments Springer-Verlag New York NY 1989
Francois P et al Physical and biological effects o f a surface coating procedure on polyurethane catheters Biom aterials V 17 p 667 - 678 1996
Golomb G and A Shplgelman Prevention o f bacterial colonization on polyurethane in vitro incorporated antibacterial agent Journal o f Biomedical Materials Research V 25 p 937 - 952 1991
Greenfeld et al Decreased bacterial adherence and biofilm formation on chlorhexidince and silver sulfadiazine-impregnated central venous catheters implanted in swine Critical Care Medicine V 23 p 894 - 900 1995
Gristina AG Biomaterial-Centered Infection Microbial Adhesion Versus Tissue Integration Science V237 p1588-1595 Sept 1987
Gristina AG Implant Failure and the Immuno-Incompentent Fibro-InflammatoryZone
Clinical Orthopaedics And Related Research V298 p106-118 1994
Gristina AG et al Cell biology and molecular mechanisms in artificial device infections The International Journal of Artificial Organs V16 p755- 764 1993
Gristina AG et al The Glycocalyx Biofilm Microbes and Resistant Infection Seminars in Arthroplasty V5 p160-170 October 1994
47
Gristina AG Naylor PT and Q Myrvik The Race for the Surface Microbes Tissue Cells and Biomaterials Molecular M echanisms o f M icrobial Adhesion eds Switalski L Hook M and E Beachey Springer-Verlag New York NY 1989
Gristina AG Passive Local Immunotherapy ldquoPLIrdquo to Prevent Biomaterial and Wound Infection Frank N Nelson Lecture Nov 11 1997
Hanker JS and BL Giammara Biomaterials and Biomedical Devices S cien ce V 242 p885-892 Nov 11 1988
Holt JG et al B ergeyrsquos Manual of Determinative B acterio logy 9th ed Williams amp Wilkins Baltimore MD p 93 - 941994
Hulshoff JEG et al Evaluation of plasma-spray and magnetron-sputter Ca-P- coated implants An in vivo experiment using rabbits Journal o fBiomedical Materials Research V 31 p 329 - 337 1996
Jansen B and W Kohnen Prevention o f biofilm formation by polymer modificationJournal of Industrial Microbiology V 15 p391-396 1995
Kaibara et al Promotion and control o f selective adhesion and proliferation o f endothelial cells on polymer surface by carbon deposition Journals o fBiomedical Material Research V 31 p 429 - 435 1996
Kost J and R Danger Controlled release of bioactive agents Trends in B iotechnology V2 p47-51 1984
Kwok CS et al Design of Infection-resistant Polymers I Fabrication and Formulation in the process of submitting 1997
Kydonieus A ed Treatise on Controlled Drug Delivery Fundam entals Optimization Applications M arcelDekker Inc New York NY 1992
Danger RS and DL Wise eds Medical Applications of Controlled R e lea se Volume I CRC Press Inc Boca Raton PD 1984
Danger RS and DL Wise eds Medical Applications of Controlled R e lea se Volume II Applications and Evaluation CRC Press Inc Boca Raton PD 1984
Danger RS and N A Peppas Present and future application of biomaterials in controlled drug delivery systems Biomaterials V 2 p 244 -246 1981
Lazarus SM et al A Hydrophilic Polymer-Coated Antimicrobial Urethral CatheterJournal of Biomedical Materials Research V 5 p 129 - 138 1971
Lee S-D et al Artificial cornea surface modification o f silicone rubber membrane by graft polymerization o f pHEMA via glow discharge B iom aterials V 17 p
4 8
587 - 5951996
Lindhout T etal Antithrombinactivity o f surface-bound heparin studied underflow conditions Journal of Biom edical Materials Research V 29 p 1255 - 1266 1995
Lohmann D Controlled Release-recent progress in polymeric drug delivery systems M acromol Symp V 100 p25-30 1995
Manual of Industrial M icrobiology and Biotechnology p30 1986
Massia SP and JA Hubbell Human endothelial cell interactions with surface- coupled adhesion peptides on a nonadhesive glass substrate and two polymeric biomaterials Journal of Biom edical Materials R esearch V 25 p 223- 242 1991
Materials Science Materials for medicine Britanica Onlinelthttpwwwebcom 180cgi-bingDocF=macro5004232htmgt [Accessed Nov 20 1997]
Miles AA Misra SS and JO Irwin The Estimation o f the Bactericidal Power o f the Blood Journal of Hygiene V 38 p 732-749 1938
Paulsson M Gouda I Larm O and A Ljungh Adherence o f coagulase-negative staphylococci to heparin and other glycosaminoslycans immobilized on polymer surfaces Journal of Biomedical M aterials Research V 28 p 311 - 317 1994
Portoles M Refojo MF and F-L Leong Poloxamer 407 as a bacterial abhesive for hydrogel contact lenses Journal o f Biomedical M aterials Research V 28 p 303 - 309 1994
Price JS Tencer AF Arm DM and GA Bohach Controlled release o f antibiotics from coated orthopedic implants Journal o f Biom edical Materials Research V 30 p281-286 1996
Robinson JR and VHL Lee Controlled Drug Delivery Fundamentals and Applications 2nd ed Marcel Dekker Inc New York NY 1987
Rushton DN Brindley GS Polkey CE and GV Browning Implant infections and antibiotic-impregnated silicone rubber coating Journal of N eu ro lo g y Neurosurgery and Psychiatry V 52 p 223-229 1989
Ryu GH et al Antithrombogenicity o f lumbrokinase-immobilized polyurethane Journal of Biomedical M aterials Research V 28 p 1069-1077 1994
Schlichting H Boundary-Layer T heory translated by J Kestin 7 ed McGraw- Hill New York NY p 596-615 1979
49
Seyral P Zannier A JN Argenson and D Raoult The r e le a s e in v itro o f v a n c o m y c in a n d to b ra n y c in f r o m a c ry lic b o n e cem en t Journal o fAntimicrobial Chemotherapy V 33 p 337 - 339 1994
Strachan CJL The p r e v e n tio n o f o r th o p a e d ic im p la n t a n d v a sc u la r g ra ft in f e c t io n s Journal o f Hospital Infection V 30 (Supplement) p 54-63 1995
Suljak JP e t a l B a c te r ia l a d h e s io n to d en ta l am algam a n d th re e res in c o m p o s i te s Journal of Dentistry V23 p171-176 1995
Sullam PM Payan DG Dazin PF and FH Valone B in d in g o f V irid a n s G rou p S tr e p to c o c c i to H u m a n P la te le ts a Q u a n tita tiv e A n a ly s is Infection and Immunity V 58 p 3802-3806 Nov 1990
Tebbs SE Sawyer A and TSJ Elliot In flu en ce o f su rfa ce m o rp h o lo g y on in v i t r o b a c te r ia l a d h e re n c e to c e n tra l ven o u s c a th e te r s British Journal o f Anaesthesia V 72 p 587-591 1994
Thomsberry C and JC Sherris Section XI Laboratory Tests in Chemotherapy General Considerations Manual of Clinical Microbiology eds EH Lennette A Balows W J Hausler and HJ Shadomy 4th ed American Society for Microbiology Washington DC p 959 -977
Wang I Anderson JM and RE Marchant P la te le t -m e d ia te d a d h e s io n o f S ta p h y lo c o c c u s e p id e r m id is to h yd ro p h o b ic N H L B I re fe ren ce p o ly e th y le n e Journal o f Biomedical Materials Research V 27 p 1119-1128 1993
Weber W J and F A DiiGiano Process Dynamics in Environmental S ystem s John Wiley amp Sons Inc p 390 - 398 1996
William SK e t al F o rm a tio n o f a m u ltila y e r ce llu la r lin ing on a p o ly u r e th a n e v a s c u la r g r a f t f o l lo w in g en d o th e lia l ce ll s o d d in g Journal of B iom edical M aterials Research V 26 p 103-117 1992
Wolfson JS and DC Hooper eds Quinolone Antimicrobial A gents American Society for Microbiology Washington DC 1989
Yu Jian-Lin et al F ib ro n e c tin on the S urface o f B ilia ry D ra in M a te r ia ls - A R o le in B a c te r ia l A d h e r e n c e Journal of Surgical Research V 59 p 596-600 1995
APPENDICES
51
APPENDIX A
Growth Rate Experiments
52Growth Curves (500 ppm Glucose) Room Temperaturetime count cone (cellsml) average std dev Specific growth rate
0 28 159E+06 711E+06 687E+06 048046690552 295E+06
296 168E+071 40 227E+06 785E+06 408E+06
210 119E+07165 936E+06
2 28 159E+06 204E+06 766E+0525 142E+0655 312E+06
3 281 159E+07 138E+07 156E+06216 123E+07233 132E+07
45 98 556E+07 550E+07 212E+06
101 573E+0792 522E+07
6 177 100E+08 736E+07 206E+0789 505E+07
123 698E+077 290 165E+08 122E+08 318E+07
198 112E+08156 885E+07
8 56 318E+08 210E+08 820E+0721 119E+0834 193E+08
9 114 647E+08 522E+08 779E+0782 465E+0893 528E+0879 448E+08
10 141 800E+08 749E+08 930E+07109 619E+08146 828E+08
11 282 160E+09 115E+09 284E+08206 117E+09172 976E+08150 851 E+08
12 200 113E+09 110E+09 329E+07186 106E+09195 111E+09
13 76 216E+09 277E+09 107E+0975 213E+09
163 462E+0976 216E+09
14 127 360E+09 340E+09 356E+08102 289E+09130 369E+09
53
15 273 775E+09 817E+09 318E+08300 851 E+09291 826E+09
16 287 163E+10 155E+10 765E+08278 158E+10255 145E+10
17 295 167E+10 145E+10 191 E+09213 121E+10260 148E+10
18 313 178E+10 163E+10 120E+09- --------
261 148E+10 - -------- -------286 162E+10
54
time count Cone (cellsml) average std dev Specific growth rateO 20 113E+06 271 E+06 191 E+06 050174225
109 619E+0657 323E+0617 965E+0536 204E+06
123 121 687E+06 746E+06 767E+05
117 664E+06137 777E+06151 857E+06
456 160 908E+06 128E+07 351 E+06
309 175E+07210 119E+07
7 35 199E+0728 159E+0738 216E+07
89 78 443E+08 485E+08 268E+07
87 494E+0891 516E+0886 488E+08
101112 69 392E+08 400E+08 147E+07
73 414E+0867 380E+0873 414E+08
13 107 607E+08 649E+08 549E+07128 726E+08 --108 613E+08
14 64 182E+09 131E+09 292E+0840 113E+0939 111E+0942 119E+09
15 64 182E+09 182E+09 401 E+0766 187E+0964 182E+0962 176E+09
1617 121 343E+09 362E+09 142E+08
129 366E+09133 377E+09
18 364 207E+10 227E+10 146E+091
55411 233E+10424 241 E+10
19 375 213E+10 217E+10 350E+08390 221 E+10384 218E+10
20 98 556E+10 680E+10 179E+1080 454E+10
155 880E+10146 828E+10
56
time count Cone (cellsml) average std dev Specific growth rateO 23 522E+06 639E+06 114E+06 0443703052
27 613E+0637 840E+0630 681 E+0622 499E+0630 681 E+06
11 119 135E+10 119E+10 165E+09119 135E+1090 102E+1090 102E+10
12 45 102E+10 934E+09 231E+0926 590E+0932 726E+0938 863E+0954 123E+1052 118E+10
13 49 111E+10 126E+10 131E+0948 109E+1059 134E+1061 138E+1054 123E+1063 143E+10
14 135 306E+10 302E+10 250E+09128 291 E+10150 340E+10120 272E+10
15 167 379E+10 368E+10 166E+09168 381 E+10152 345E+10 J Z
16 239 542E+10 495E+10 619E+09201 456E+10250 567E+10183 415E+10
17 57 647E+10 726E+10 960E+0977 874E+1056 636E+1066 749E+10
18 86 976E+10 102E+11 804E+0982 931 E+10
101 115E+11 -90 102E+11
19 121 137E+11 121 E+11 182E+10124 141 E+11
57
92 104E+1189 101E+11
20 89 101E+11 107E+11 830E+0996 109E+11
105 119E+1186 976E+10
21 101 115E+11 124E+11 104E+10122 138E+11114 129E+11100 113E+11
22 67 760E+10 111E+11 216E+10115 131E+1197 110E+11
112 127E+11
58
time count Cone (cellsmi) average std dev Specific growth rate averageO 25 142E+06 127E+06 434E+05 0443600055 0467378
22 125E+0632 182E+06 std dev
9 511E+05 00248917 965E+0529 165E+06
12 62 281 E+07 421 E+07 779E+0693 422E+0786 390E+07
116 527E+07108 490E+0791 413E+07
14 33 150E+08 156E+08 339E+0737 168E+0826 118E+0833 150E+0828 127E+0849 222E+08
155 39 177E+08 239E+08 810E+0731 141E+0888 399E+0854 245E+0851 232E+0853 241 E+08
175 61 277E+08 261 E+08 657E+0745 204E+0851 232E+0849 222E+08 - - Z
88 399E+0851 232E+08
225 136 309E+10 274E+10 247E+09114 259E+10112 254E+10
59
APPENDIX B
FASTEETHreg SUSCEPTIBILITY
6 0
time 01g260E+04
005280E+04 240E+04
Glucose Abs0008
640E+04 140E+05 170E+04 0016370E+05 770E+05 220E+04 0033
125 198E+06 310E+06 220E+05 0071145 890E+06 194E+06 330E+05 0146245 160E+08 200E+08 160E+07 0266
110E+08 180E+08 160E+07 100 0405275 170E+08 170E+08 190E+07 200 0408
time 0 05g 0025g217E+04 330E+04 110E+05
Fasteeth MIC Study I518E+05 760E+05 230E+05
125 194E+06 185E+06 410E+05314E+06 147E+06 816E+05
165 660E+06 100E+07 178E+06195 192E+07 880E+06 242E+06225 430E+07 140E+07 180E+07255 119E+09 292E+07 130E+07
time 157E-02
200E+08
150E+08
I 100E+08U
500E+07
000E+00
7 X
V
I I
01g
005
C ~
233E+04 133E+0510 15 20 25 30time (hours)
194E+06 566E+06880E+06 746E+06226E+07 120E+07125E+08 120E+08133E+08 703E+08
time Control 450E-02121E+05 152E+05140E+05 264E+06197E+06 246E+06
185 362E+06 919E+06457E+06 211E+07461E+07 234E+08
IhU 200E+07
100E+07
000E+00
250E+08
200E+08
150E+08
1 00E+08
500E+07
OOOE+OO
I
I
Z1
Control
450E-02
500E+07
400E+07
300E+07
F a s te e th MIC Il
I
y -
Jlt3
0 05g
0025g
C
10 15 20 25timefhrs)
Fasteeth MIC III
157E-02
C
time (hrs)
APP ENDlX C
Hoechst 33342
me control s1 S2 S3O 162E+05 149E+05 118E+05 139E+05
195 477E+06 443E+07 317E+07 883E+04OOOE+OO
O 134E+04 159E+04 280E+04 194E+0414 210E+06 520E+05 380E+05 945E+0416 228E+06 313E+06 604E+06 294E+0519 763E+06 980E+06 169E+07 207E+0523 263E+07 133E+08 883E+07 967E+04
5ugml10ugmlSOugml
Hoechst 33342 MIC no wash
-control
-5ugml
-10ugml -50ugml
time (hrs)
time control s1 S2 S3O 162E+05 149E+05 118E+05 139E+05
195 477E+06 443E+07 317E+07 883E+04OOOE+OO
O 134E+04 159E+04 280E+04 194E+0414 210E+06 520E+05 380E+05 945E+0416 228E+06 313E+06 604E+06 294E+0519 763E+06 980E+06 169E+07 207E+0523 263E+07 133E+08 883E+07 967E+04
5ugmllOugml50ugml
Hoechst 33342 MIC no wash
control -5ugml bull10ugml 50ugml
time control A B3 129E+05 129E+05 139E+05
15 104E+06 100E+05 169E+0616 645E+06 227E+05 122E+062022
423E+06 113E+05 254E+06106E+07 160E+06 158E+07
24 707E+07 109E+07 175E+07
Hoescht MIC - incubate in stain for 3 hrs then wash
800E+07700E+07600E+07500E+07400E+07300E+07200E+07100E+07OOOE+OO
MIC w wash
DLO
800E+07
600E+07
400E+07
200E+07
000E+00
- controlbullA
-B
O 10 20 30
time(hrs)
200E+07180E+07160E+07140E+07120E+07100E+07800E+06600E+06400E+06200E+06000E+00
65
APPENDIX D
C iprofloxacin
66
Ciprofloxacin MIC study Plate countstime count (1ugml) cfuml average std dev count (1 ugml) cfuml
0 96 960E+04 962E+04 530E+03 21 210E+0496 960E+04 28 280E+04
105 105E+05 22 220E+0410 100E+059 900E+049 900E+04
155 67 670E+04 865E+04 266E+04 3 300E+0385 850E+04 2 200E+0377 770E+04 2 200E+03
5 500E+0411 110E+0513 130E+05
17 76 760E+04 687E+04 220E+04 20 200E+0465 650E+04 27 270E+0441 410E+04 20 200E+0411 110E+055 500E+047 700E+04
20 31 310E+04 230E+04 128E+04 13 130E+0433 330E+04 0 000E+00
5 500E+03 0 000E+0022 0 ND 0
0 00 0
24 0 ND 00 00 0
time 1 ugml std dev 01 ugml std dev control std dev0 720E+04 345E+04 566E+04 263E+04 593E+04 170E+03
155 584E+04 452E+04 510E+06 168E+06 903E+06 419E+0517 532E+04 283E+04 380E+06 221E+06 153E+07 963E+0520 137E+04 137E+04 670E+06 381 E+06 963E+07 741 E+0622 0 0 254E+07 587E+06 377E+07 450E+0624 0 0 920E+06 440E+06 377E+07 450E+06
67
average std dev count (01 ugml) cfuml average std dev count (01 ugml)237E+04 309E+03 75 750E+04 783E+04 340E+03 20
83 830E+04 2077 770E+04 14
8 800E+048 800E+046 600E+04
233E+03 471 E+02 66 660E+06 3677 770E+06 3056 560E+06 41
223E+04 330E+03 56 560E+06 587E+06 602E+05 15153 530E+06 17167 670E+06 155
17 13
14433E+03 613E+03 TNTC 119
TNTC 53TNTC 29
215 215E+07 232E+07 362E+06 253189 189E+07 256247 247E+07 235
19 190E+07 2127 270E+07 2828 280E+07 42
Bad plate 60Bad plate 110Bad plate 17
5- - 7
68
cfum average std dev count (control) cfuml average std dev200E+04 180E+04 283E+03 61 610E+04 593E+04 170E+03200E+04 60 600E+04140E+04 57 570E+04
360E+06 357E+06 450E+05 96 960E+06 903E+06 419E+05300E+06 89 890E+06410E+06 86 860E+06
151E+06 153E+06 148E+05 166 166E+07 153E+07 963E+05171E+06 150 150E+07155E+06 143 143E+07170E+06130E+06140E+06119E+07 670E+06 381 E+06 86 860E+07 670E+07 300E+07530E+06 103 103E+08290E+06 100 100E+08253E+07 276E+07 680E+06 34 340E+07 X256E+07 35 350E+07235E+07 44 440E+07210E+07280E+07420E+07600E+06 920E+06 440E+06 34 340E+07 377E+07 450E+06110E+07 35 350E+07170E+07 44 440E+07500E+06700E+06
I
I
69
APPENDIX F
Flow Cell Experiments Image Analysis
70
IMAGE ANALYSIS
Images of the polymers were taken using a CCD camera They were then analyzed
using Image Pro Plus The analysis of each image was automatically saved as an Excel
file generating 48 Excel sheets per experiment Since a hard copy of this information
would be too bulking to include in the Appendices a disk with all of the data will be kept
with a copy of this thesis at the Chemical Engineering Department and at the Center for
Biofilm Engineering
The spreadsheet are labeled with the time at which the image was taken die field of
view (eg A b c etc) parameters measured (eg Area ave dia width length) For
every field of view taken two spreadsheets were generated One consisted of the
parameters measured and the other gave the dimensions of the field of view (length x
width)
At the beginning of each experiment an image of a micrometer was taken in order to
calibrate all of the measurements for the experiment Cell numbers were calculated by
summing the area values of one field of view and dividing by 075 for a high end value or
50 for a low end value These values were than averaged to get the average values and
standard deviations The above values were obtained from B ergey rsquos Manual o f
Determinative Microbiology which gave the width of P aeruginosa at 05-1Ojim and
the length as 15-50pm This method for calculating cell numbers was found to be
accurate as actual cell numbers could be counted for the early time points They fell within
the range calculated by the above method
The files are listed as
Control
Triglyme
71
Ciprotriglyme
BMA
CiproBMA
The graphs found in the thesis text were made from the above files and then
converted into data which was easier to handle The files from which the graphs were
made are
Endpoint
Curves
APPENDIX F
Flow Cell Experiments Total CountsAO
cell
con
e(o
ellm
iEffluent counts over a 24
hour time period - Comparison
150E+09
000E+00
mdash- Control
Triglyme bull Ciprotriglyme
- BMA -bull- ciproBMA
CU
den
sity
(ce
lls
mm
A2)
100E+07
100E+06
100E+05
100E+04
100E+03
100E+02
100E+01
H ControlHTrigIyme^CiprotriglymeHBMAHciproBMA
Polymers100E+00
cell
con
e (
cell
sm
l)Effluent data t=0-8 Total counts
140E+09
120E+09
100E+09
800E+08
600E+08
400E+08
200E+08
000E+00
mdash Control Triglyme
-Ciprotriglyme - x~ BMA -^c ip roB M A
time (hrs)
76Control AO countstime (in) cell count cellsml average std Dev
0 100 454E+08 491 E+08 134E+0874 336E+08
110 499E+08101 458E+08172 781 E+0882 372E+08
125 567E+08165 749E+08132 599E+08108 490E+0860 272E+08
113 513E+0897 440E+0893 422E+0890 409E+08
2 107 486E+08 730E+08 152E+08167 758E+08154 699E+08111 504E+08167 758E+08196 890E+08204 926E+08
180 817E+084 113 513E+08 678E+08 171E+08
108 490E+08172 781 E+08
82 372E+08125 567E+08132 599E+08165 749E+08167 758E+08204 926E+08180 817E+08196 890E+08
6 0 0 0 00000
77
area (mmA2)72578 714E+02 441 E+016550376102
Polymercount cone
33 150E+08 201 E+08 660E+0750 227E+0841 186E+0847 213E+08
455 103E+08430 976E+07450 102E+08
62 281 E+0854 245E+0859 268E+0848 218E+0865 295E+0851 232E+08
density845E+06 277E+06
78
time (out) cell count cellsml average std Dev time (out) average std Dev0 65 295E+08 373E+08 780E+07 0 373E+08 780E+07
74 336E+08 2 303E+08 123E+08111 504E+08 4 209E+08 800E+0777 350E+08 6 262E+08 698E+07
109 495E+08 8 162E+08 088 399E+08 16 159E+07 116E+0653 241 E+08 18 232E+07 089 404E+08 20 304E+07 901E+0673 331 E+08 21 407E+07 082 372E+08 24 714E+07 213E+07
2 101 458E+08 303E+08 123E+08103 468E+08 Control101 458E+0830 136 E+08 0 491 E+08 134E+0835 159E+08 2 730E+08 152E+0844 200E+08 4 678E+08 171 E+0860 272E+08 6 0 068 309E+08 8 0 058 263E+08 16 0 0
4 30 136E+08 209E+08 800E+07 18 0 035 159E+08 20 0 028 127E+08 21 0 044 200E+08 24 0 019 863E+0744 200E+0869 313E+0872 327E+08 time in-out66 300E+08 0 000E+0054 245E+08 2 000E+00
6 39 177E+08 262E+08 698E+07 4 -262E+0860 272E+08 6 226E+0856 254E+08 8 162E+0867 304E+08 16 159E+0738 173E+08 18 232E+07
46 209E+08 20 304E+0744 200E+08 21 407E+0772 327E+08 24 714E+0788 399E+0867 304E+08
16 62 141E+07 159E+07 116E+0669 157E+0766 150E+0776 173E+0769 157E+0770 159E+0773 166E+07
79
ff l 184E+0768 154E+0767 152E+07
20 161 365E+07 304E+07 901 E+06158 359E+07196 445E+0798 222E+0791 207E+07
100 227E+0724 206 468E+07 714E+07 213E+07
121 275E+07219 497E+07217 493E+07360 817E+07270 613E+07420 953E+07280 636E+07430 976E+07390 885E+07320 726E+07360 817E+07430 976E+07380 863E+07
80
Triglyme AO countstime (in) count cellsml average std Dev
0 77 350E+08 517E+08 224E+0883 377E+0878 354E+0867 304E+0888 399E+08
115 522E+0896 436E+0888 399E+0883 377E+08
195 885E+08208 944E+08188 853E+08
2 99 449E+08 765E+08 251 E+08120 545E+08102 463E+08130 590E+08138 626E+08136 617E+08133 604E+08232 105E+09265 120E+09260 118E+09197 894E+08190 863E+08190 863E+08
4 238 108E+09 708E+08 307E+08225 102E+09215 976E+08100 454E+0864 291 E+0899 449E+08
124 563E+0898 445E+08
194 881 E+08188 853E+08151 685E+08176 799E+08
6 0 0 0 00 00 00 00 00 00 0
81
Polymercount cone
35 794E+07 353E+07 341 E+0741 931 E+0737 840E+0734 772E+0736 817E+0744 200E+0734 154E+0725 113E+0729 132E+0732 145E+0712 545E+0627 123E+0719 863E+0615 681 E+0614 636E+06
density117E+06 113E+06
area94558 907E+02 544E+019458883024
82
time (out) average std Dev time in-out0 676E+08 970E+07 0 500E+082 463E+08 118E+08 2 302E+084 477E+08 294E+08 4 231 E+086 550E+08 262E+08 6 550E+088 349E+07 302E+07 8 349E+07
16 284E+07 0 16 284E+0718 268E+07 238E+07 18 268E+0720 241 E+07 0 20 241 E+0721 228E+07 116E+07 21 228E+0724 223E+07 196E+07 24 223E+07
triglyme
time (in)0 517E+08 224E+082 765E+08 251 E+084 708E+08 307E+086 0 08 0 0
16 0 018 0 020 0 021 0 024 0 0
83
time (out) count cellsml average std Dev0 130 590E+08 678E+08 970E+07
136 617E+08157 713E+08150 681 E+08123 558E+08148 672E+08128 581 E+08140 636E+08172 781 E+08152 690E+08205 931 E+08152 690E+08
2 150 681 E+08 463E+08 118E+0867 304E+08
101 458E+08100 454E+0863 286E+0896 436E+0899 449E+08
100 454E+08110 499E+0871 322E+08
130 590E+08136 617E+08157 713E+08150 681 E+08
4 28 127E+08 477E+08 294E+0818 817E+0738 173E+0823 104E+0826 11ampE+08
127 577E+08134 608E+08115 522E+08128 581 E+08150 681 E+08120 545E+08205 931 E+08145 658E+08215 976E+08
6 47 213E+08 550E+08 262E+0849 222E+0849 222E+0859 268E+0858 263E+08
164 744E+08
84
219 994E+08180 817E+08175 794E+08191 867E+08127 577E+08134 608E+08115 522E+08128 581 E+08
8 16 726E+07 349E+07 302E+0710 454E+0718 817E+0720 908E+0716 726E+072 908E+064 182E+074 182E+075 227E+074 182E+07
18 9 204E+07 268E+07 238E+071 227E+067 159E+070 000E+000 000E+00
99 449E+07142 645E+07128 581 E+07108 490E+07165 749E+0727 123E+0730 136E+0733 150E+0737 168E+0730 136E+07
21 8 182E+07 228E+07 116E+0720 454E+0710 227E+0712 272E+0719 431E+0727 123E+0730 136E+0733 150E+0737 168E+0730 136E+07
24 25 113E+07 223E+07 196E+0711 499E+0622 999E+0623 104E+0716 726E+06
85
19 863E+0626 118E+0723 104E+0725 113E+0718 817E+0614 318E+0722 499E+0727 613E+0716 363E+0727 613E+07
Cel
l con
e (
cells
ml)
Acridine Orange effluent counts t= 8-24hours
180E+08 160E+08 140E+08 120E+08 100E+08 800E+07 600E+07 400E+07 200E+07 000E+00
8 12 16 20 24
mdash diamsmdash Control
- Ciprotriglyme - -x- -B MA - X - ciproBMA
time (hours)
87
Ciprotriglyme AO countstime (in) count cellsml average std Dev
0 110 499E+08 932E+08 329E+08106 481 E+08115 522E+08144 654E+08141 640E+08157 143E+09113 103E+09119 108E+09103 935E+08105 953E+08147 133E+09136 123E+09 bull146 133E+09
2 115 104E+09 985E+08 202E+08105 953E+08102 926E+0898 890E+08
129 117E+09132 120E+09140 127E+09121 110E+09128 116E+09150 681 E+08184 835E+08131 595E+08
4 213 967E+08 954E+08 481 E+08242 110E+09
13 590E+07251 114E+09132 599E+08168 153E+09
13 118E+0844 399E+08
154 140E+09190 173E+09115 104E+09132 120E+09132 120E+0998 890E+08
6 0 0
88
Polymercount cone
84 953E+06 701 E+06 441 E+0650 567E+0655 624E+0642 477E+0667 760E+06
140 159E+0799 112E+0796 109E+0797 110E+07
107 121E+079 204E+068 182E+06
10 227E+0610 227E+068 182E+06
area94352 941E+02 276E+019064997397
density 223E+05 141 E+05
89
time (out) average std Dev0 754E+08 210E+082 919E+08 207E+084 942E+08 388E+086 292E+08 273E+088 128E+07 216E+06
16 705E+06 bull 018 561 E+06 406E+0620 947E+06 021 114E+07 573E+0624 184E+07 774E+06
Ciprotriglyme
time (in)0 932E+08 329E+082 985E+08 202E+084 954E+08 481 E+086 0 08 0 0
16 0 018 0 020 0 021 0 024 0 0
90
time (out) count cellsml average std Dev0 120 545E+08 754E+08 210E+08
130 590E+08153 695E+08156 708E+0852 472E+0851 463E+0889 808E+08
118 107E+0981 735E+08
111 101E+0996 872E+08
119 108E+092 92 835E+08 919E+08 207E+08
78 708E+0869 626E+0883 754E+0890 817E+08
103 935E+08135 123E+09143 130E+09134 122E+09117 106E+09191 867E+08167 758E+08Ig 844E+08
4 186 844E+08 942E+08 388E+08241 109E+09289 131E+09243 110E+09159 144E+09177 161E+0931 281 E+0820 182E+08
102 926E+08103 935E+0880 726E+0899 899E+0899 899E+08
6 92 835E+08 292E+08 273E+0865 590E+0882 744E+0865 590E+0854 490E+08
21 191 E+0826 236E+0817 154E+08
91
25 227E+0820 182E+08
133 302E+07113 256E+0793 211E+07
114 259E+07134 304E+07
8 68 154E+07 128E+07 216E+0652 118E+0744 999E+0675 170E+0748 109E+0757 129E+0766 150E+0750 113E+0752 118E+0751 116E+07
18 44 999E+06 561 E+06 406E+0657 129E+0734 772E+0637 840E+0635 794E+06
8 182E+066 136E+065 113E+068 182E+06
13 295E+0621 71 161E+07 114E+07 573E+06
94 213E+0779 179E+0777 175E+0729 658E+0631 704E+0628 636E+0625 567E+0630 681 E+0661 138E+0761 138E+0752 118E+0764 145E+07
3 681E+0524 35 794E+06 184E+07 774E+06
45 102E+0756 127E+0738 863E+06
53 120E+07182 207E+07205 233E+07
92
235 267E+07240 272E+07220 250E+0771 806E+06
200 227E+07195 221E+07265 301 E+07
93BMA total counts Acric ine Orange BMAtime(in) count cone (cellsml) average std dev time (in) ave std dev
0 134 122E+09 826E+08 249E+08 0 826E+08 249E+08146 133E+09 2 610E+08 276E+08130 118E+09 4 731 E+08 382E+0869 626E+08 6 0 069 626E+0891 826E+0872 654E+08 time (out)66 599E+08 0 853E+08 155E+0872 654E+08 2 612E+08 177E+0883 754E+08 4 456E+08 282E+0878 708E+08 6 288E+08 208E+0882 744E+08 8 137E+07 934E+06
2 12 109E+08 610E+08 276E+08 16 445E+07 049 445E+08 18 523E+07 175E+0738 345E+08 20 720E+07 062 563E+08 21 818E+07 379E+0760 545E+08 24 853E+07 340E+07
115 104E+09109 990E+08122 111E+0964 581 E+0876 690E+0849 445E+0852 472E+0866 599E+08
4 73 663E+08 731 E+08 382E+0881 735E+0898 890E+0870 636E+0873 663E+08
131 119E+09115 104E+09141 128E+09147 133E+0929 263E+0829 263E+0838 345E+0821 191E+08
6 00000000
94
0
Polymercount cone
125 567E+07 895E+07 418E+07140 636E+07100 454E+07115 522E+07137 622E+07139 631 E+07150 681 E+07270 123E+08380 173E+08360 163E+08 density250 113E+08 298E+06 139E+06200 908E+07
area87061 901 E+02 21217235669140691703
95
time(out) count cone (cellsml) average std devC 82 754E+0E 853E+08 155E+08
7E 708E+0E86 781 E+0893 844E+0881 735E+0882 744E+0877 699E+0892 835E+08
121 110E+09116 105E+09125 113E+09
2 92 835E+08 612E+08 177E+0876 690E+08
109 990E+0892 835E+0860 545E+0855 499E+0863 572E+0872 654E+0847 427E+0843 390E+0844 399E+0867 608E+0856 508E+08
4 47 427E+08 456E+08 282E+0852 472E+0859 536E+0860 545E+0836 327E+0897 881 E+0830 272E+0850 454E+08
115 104E+09104 944E+08
19 173E+0814 127E+0828 254E+0822 200E+0821 191 E+08
6 16 145E+08 288E+08 201 E+0815 136E+0813 118E+0821 191 E+0816 145E+0855 499E+0840 363E+0845 409E+08
96
85 772E+0873 663E+0820 182E+0820 182E+0820 182E+0820 182E+0817 154E+08
8 6 136E+07 137E+07 934E+060 000E+005 113E+074 908E+061 227E+06
27 245E+0728 254E+0726 236E+07
18 77 699E+07 523E+07 175E+0773 663E+0783 754E+0773 663E+0772 654E+0768 617E+0717 386E+0719 431 E+0715 340E+0712 272E+0712 272E+07
21 310 704E+07 818E+07 379E+07300 681 E+07140 318E+07230 522E+07210 477E+07285 129E+08290 132E+08340 154E+08 - -
250 113E+08123 558E+07136 617E+07144 654E+07
24 107 486E+07 853E+07 340E+07108 490E+07112 508E+07270 123E+08250 113E+08320 145E+08260 118E+08148 672E+07153 695E+07150 681 E+07
97
ciproBMA AO counts
time (in) count cone average std dev0 74 672E+08 673E+08 19E+08
100 908E+0880 726E+08
112 102E+0956 508E+0869 626E+08
108 981 E+0871 645E+0886 781 E+0876 69E+0838 345E+0852 472E+0856 508E+0860 545E+08
2 44 399E+08 897E+08 61 E+0851 463E+0825 227E+0832 291 E+0841 372E+08
103 935E+0893 844E+0899 899E+08
219 199E+09192 174E+09188 171E+09
4 92 835E+08 726E+08 178E+0878 708E+08
102 926E+0897 881 E+08
102 926E+0884 763E+0886 781 E+0879 717E+08
106 962E+0856 508E+0848 436E+0854 49E+0856 508E+08
_
i
98
Polymercount cone
139 316E+07 541 E+07 463E+07114 259E+07125 284E+07134 304E+07280 127E+08290 132E+08250 113E+08
79 179E+0773 166E+0779 179E+07
area88181 870E+02 125E+018760685282
density187E+06 160E+06
99
time (in) ave std devO 673E+08 190E+082 897E+08 610E+084 726E+08 128E+086 0 0
time (out)0 700E+08 146E+082 652E+08 311E+084 524E+08 227E+086 350E+08 127E+088 545E+06 286E+06
16 101E+07 018 113E+07 430E+0620 281 E+07 0
21 365E+07 201 E+0724 682E+07 510E+07
100
time (out) count cone average std dev0 71 645E+08 7E+08 146E+08
71 645E+0876 69E+0899 899E+08
103 935E+0884 763E+0891 826E+0865 59E+0860 545E+0851 463E+08
2 30 272E+08 652E+08 311 E+0842 381 E+0824 218E+0831 281 E+0823 209E+08
130 118E+0966 599E+0866 599E+0890 817E+0897 881 E+0867 608E+0888 799E+08
113 103E+09104 944E+08107 971 E+08
4 83 754E+08 524E+08 227E+0872 654E+0884 763E+0890 817E+0866 599E+0857 518E+0889 808E+0867 608E+0830 272E+0820 182E+0834 309E+0828 254E+08
mdash30 272E+08
6 39 354E+08 35E+08 123E+0846 418E+0854 49E+0859 536E+0852 472E+0818 163E+08
101
30 272E+0825 227E+0835 318E+0848 436E+0852 472E+0840 363E+0828 254E+0814 127E+08
8 17 386E+06 545E+06 286E+0611 250E+0612 272E+0623 104E+07
9 409E+0616 726E+0620 908E+06
8 363E+0618 35 159E+07 113E+07 430E+06
37 168E+0736 163E+0734 772E+0627 613E+0639 885E+0654 123E+0728 636E+06
21 300 681 E+07 365E+07 201 E+07275 624E+07300 681 E+07255 579E+07275 624E+07
85 193E+0767 152E+0779 179E+0770 159E+0793 211 E+0770 318E+0761 277E+0750 227E+0748 218E+0778 354E+07
24 42 191 E+07 682E+07 510E+0757 259E+0770 318E+0767 304E+0749 222E+07
270 123E+08305 138E+08385 175E+08270 123E+08
102
74 336E+07124 563E+0775 340E+07
165 749E+07
103
APPENDIX G
Flow Cell Experiments Viable CountsPlate Counts
104
Plate counts were conducted by placing ten 10 microliter drops of properly diluted
effluent and influent on plate count agar plates and incubating overnight at room
temperature before counting Several serial dilutions were made for each sample to ensure
that countable plates 3 to 300 colonies were obtained Only viable cells would develop
into colonies on the plates therefore the counts performed in this manner are classified as
viable counts or plate counts
105
Control Plate counttime (in) count cone (cellsml) average std dev
0 159 159E+07 936E+06 628E+06193 193E+07188 188E+0768 680E+0664 640E+0658 580E+0632 320E+0648 480E+0632 320E+06
2 298 298E+07 374E+07 852E+06289 289E+07329 329E+07
54 540E+0739 390E+0740 400E+07
4 79 790E+06 330E+07 328E+07111 111E+0798 980E+0692 920E+0786 860E+0723 230E+0721 210E+0713 130E+07
6 0
time (in) ave cone std dev time (out) ave cone std dev0 936E+06 628E+06 0 249E+06 222E+062 374E+07 852E+06 2 993E+06 293E+064 330E+07 328E+07 4 208E+07 922E+066 0 0 6 111E+07 0
8 147E+07 016 113E+05 235E+0418 281E+05 020 449E+05 417E+0521 371 E+05 024 138E+05 109E+05
Polymer | 130E+06
106
area average std dev72578 7139433333 44072296550376102
density537E+04 548E+04 3474333595E+04512E+04
107
time(out) count cone (cellsml) average std dev0 49 490E+06 249E+06 222E+06
50 500E+0667 670E+06
7 700E+056 600E+05
9 900E+0517 170E+068 800E+05
11 110E+062 125 125E+07 993E+06 293E+06
122 122E+07119 119E+07
9 900E+0610 100E+074 400E+06
4 30 300E+07 208E+07 922E+0633 330E+0731 310E+07
104 104E+0794 940E+06
106 106E+0721 210E+0721 210E+0713 130E+07
6 no data
16 71 710E+04 113E+05 235E+04105 105E+05120 120E+05
15 150E+0511 110E+0512 120E+05
20 24 240E+04 449E+05 417E+0526 260E+0453 530E+0477 770E+0589 890E+0593 930E+05
24 17 170E+05 138E+05 109E+0526 260E+05
I 29 290E+05
108
26 260E+0459 590E+0420 200E+04
Polymer 10 100E+06 130E+06 551 E+0513 130E+0613 130E+0658 580E+0556 560E+05
119 119E+06 -
171 171E+06161 161 E+06244 244E+06
109
triglyme Plate countstime (in) count cone (cellsml) average std dev
0 167 167E+08 108E+08 700E+07184 184E+08182 182E+0831 310E+0737 370E+0747 470E+07
2 86 bull 860E+07 522E+07 334E+0778 780E+0774 740E+07
120 120E+07112 112E+07
4 159 159E+08 562E+07 489E+07116 116E+08145 145E+07244 244E+07224 224E+07
42 420E+0732 320E+0739 390E+07
6 000
time (in) ave cone std dev0 108E+08 700E+072 522E+07 334E+074 562E+07 489E+076 0 0
lt Z
Polymer density782E+06 441 E+06 248E+05
248E+05area Average 283E+05
94558 90723333339458883024
time (out) average std dev
no
O 882E+07 714E+072 336E+07 125E+074 821E+07 139E+076 214E+07 439E+078 223E+06 125E+05
16 326E+06 018 352E+06 246E+0620 773E+06 021 984E+06 105E+0724 299E+06 101 E+06
Polymer 50 500E+06 782E+0661 610E+0662 620E+06
108 108E+0747 470E+0615 150E+0716 160E+0713 130E+07
331 331 E+06281 281 E+06301 301 E+06
97 970E+0660 600E+06
I l l
time (out) count cone (cellsml) average std dev0 167 167E+08 882E+07 714E+07
136 136E+08173 173E+08176 176E+07186 186E+07168 168E+07
2 51 510E+07 336E+07 125E+0747 470E+0746 460E+0740 400E+0752 520E+0734 340E+07
177 177E+07188 188E+07213 213E+07
24 240E+0725 250E+0726 260E+07
4 77 770E+07 821 E+07 139E+0797 970E+07
104 104E+0860 600E+0767 670E+0791 910E+0778 780E+0783 830E+07
6 48 480E+06 214E+07 439E+07-34 340E+06 r
35 350E+0630 300E+06
ave 28 280E+06260E+05 34 340E+06
stddev 129 129E+081626657 8 22 220E+06 223E+06 125E+05
24 240E+0621 210E+06
18 153 153E+06 352E+06 246E+06225 225E+06198 198E+06
112
22 220E+0615 150E+0616 160E+0662 620E+0660 600E+0684 840E+06
21 179 179 E+06 984E+06 105E+07275 275E+06247 247E+0622 220E+07
3 300E+0627 270E+07
441 E+06 24 254 254E+06 299E+06 101 E+06240 240E+06264 264E+06
30 300E+0637 370E+0658 580E+0620 200E+0631 310E+0616 160E+06
279 279E+06338 338E+06297 297E+06
113
ciprotriglyme Plate countstime (in) count cone (cfuml) average std dev time (out)
0 15 150E+08 654E+08 307E+08 013 130E+0843 430E+0889 890E+0887 870E+0882 820E+0884 840E+0884 840E+0892 920E+08
2 96 960E+08 103E+09 48E+0881 810E+08
116 116E+09164 164E+09169 169E+09 2184 184E+0954 540E+0897 970E+08
128 128E+093 300E+085 500E+087 700E+08
4 55 550E+08 918E+08 363E+0831 310E+0890 900E+0814 140E+0910 100E+09 44 400E+08
90 900E+0899 990E+08
115 115E+09100 100E+0980 800E+08
162 162E+096 0 0
6
time (Out) average std dev0 506E+06 553E+062 121E+09 944E+084 192E+08 166E+086 121E+08 112E+08 I8 140E+06 116E+06
16 900E+05 0 I18 774E+05 980E+05 I
20 120E+06 0 |21 141E+06 110E+06 i
114
24 1642+06 1902+06 8
density773698491 7761707346 2284489805303975749509738
18area
94352 9412+02 2762+019064997397
21
Polymercount cone (cfuml) average std dev
23 2302+03 2432+03 9982+0236 3602+0330 3002+03
2 2002+034 4002+033 3002+032 2002+031 1002+031 1002+03
24
115
count cone (cfuml) average std dev23 2302+04 5062+06 5532+0621 2102+0420 2002+04
114 1142+07103 1032+07120 1202+07
10 1002+0713 1302+079 9002+060 0002+000 0002+000 0002+000 0002+00
87 8702+08 1212+09 9442+0892 9202+08
190 1902+09102 1022+0975 7502+0896 9602+0872 7202+0891 9102+08
167 1672+096 6002+082 2002+08
40 4002+0957 5702+08 1922+08 1662+0825 2502+0836 3602+08
128 1282+0893 9302+07
168 1682+0856 5602+0748 4802+0755 5502+0748 4802+07 1212+08 1132+0851 5102+0790 9002+07
149 1492+08180 1802+08162 1622+08261 260E+0812 i 1202+0839 3902+0870 7002+0539 3902+0565 6502+05
116
3 300E+05 140E+06 116E+0615 150E+0645 450E+0689 890E+05
127 127E+06127 127E+0610 100E+0614 140E+065 500E+058 800E+05 774E+05 918E+05
19 190E+0629 290E+06
199 199E+05225 225E+05213 213E+0523 230E+0525 250E+0525 250E+0536 360E+05 141 E+06 110E+0692 920E+0594 940E+0553 530E+0582 820E+0567 670E+05
8 800E+058 800E+05
10 100E+06169 169E+06142 142E+0624 240E+0645 450E+0629 290E+0625 250E+04 164E+06 190E+0629 290E+0452 520E+046 600E+048 800E+041 100E+04
139 139E+0610 100E+0638 380E+0662 620E+0632 320E+0621 210E+0634 340E+06
117
BMA Plate counts
time (in) count cone (cfuml) average std devO 53 530E+07 974E+07 377E+07
59 590E+0759 590E+0784 840E+07
123 123E+08139 - 139E+08
9 900E+0717 170E+0810 100E+08
2 23 230E+07 357E+07 441 E+0723 230E+0720 200E+07
165 165E+0838 380E+0673 730E+06
231 231 E+0724 240E+0739 390E+0729 290E+07
4 17 170E+07 171 E+07 575E+0619 190E+0711 110E+07
220 220E+07213 213E+07228 228E+07
21 210E+0716 160E+0726 260E+07
6 600E+0612 120E+0711 110E+07
6 0 0
118
time(out) average std dev0 499E+07 154E+072 413E+07 179E+074 577E+07 526E+076 129E+07 496E+068 149E+06 912E+05
16 428E+06 018 498E+06 414E+0620 635E+06 021 704E+06 394E+0624 106E+07 225E+06
=
119
Polymercount cone average std dev
27 270E+06 117E+07 13381334127 127E+0732 320E+0743 430E+0739 390E+0640 400E+0636 360E+06 density41 41 OEf 06 404E+05 391 E+0559 590E+06 385E+0554 540E+06 384E+05
area average std dev87061 900566667 21217235669140691703
120
time (out) count cone (cfuml) average std dev0 40 400E+07 499E+07 154E+07
35 350E+0750 500E+0781 810E+0770 700E+0757 570E+07
408 408E+07386 386E+07367 367E+07
2 37 370E+07 413E+07 179E+0725 250E+0736 360E+0765 650E+0777 770E+0734 340E+0725 250E+0731 310E+07
4 46 460E+07 577E+07 526E+0733 330E+0732 320E+07
158 158E+0892 920E+07
130 130E+0813 130E+079 900E+066 600E+06
6 92 920E+06 129E+07 496E+0672 720E+0688 880E+06
9 900E+067 700E+067 700E+06 - -
169 169E+07192 192E+07191 191E+0720 200E+0714 140E+0724 240E+07
101 101E+07119 119E+07149 149E+07
10 100E+0712 120E+07
11 110E+078 46 460E+05 149E+06 912E+05
13 bull130E+05|
121
13 130E+05191 191E+06217 217E+06244 244E+06
18 180E+0624 240E+0620 200E+06
18 46 460E+06 498E+06 414E+0654 540E+0646 460E+06
3 300E+064 400E+06
18 180E+0738 380E+0655 550E+0652 520E+0622 220E+0613 130E+0622 220E+06
21 26 260E+06 704E+06 394E+0631 310E+0644 440E+06
3 300E+063 300E+063 300E+06
93 930E+0699 990E+06
106 106E+0716 160E+07
8 800E+067 700E+06
62 620E+0671 710E+0675 750E+06
8 800E+0615 150E+07
3 300E+0624 90 900E+06 106E+07 225E+06
89 890E+0690 900E+0613 130E+0713 130E+0711 110E+07
111 111E+0797 970E+0E
107 107E+07V 140E+077
i 5 130E+07
122
15 150E+0787 870E+0680 800E+06
124 124E+077 700E+06
10 100E+078 800E+06
123ciproBMA Plate countstime (in) count cone (cfuml) average std devO 80 800E+07 490E+07 212E+07
64 640E+0777 770E+0742 420E+0755 550E+0753 530E+0726 260E+0723 230E+0721 210E+07
2 31 310E+07 592E+07 235E+0731 310E+0743 430E+0759 590E+0764 640E+07
114 114E+0867 670E+0764 640E+0760 600E+07
4 75 750E+07 572E+07 206E+0770 700E+0786 860E+0742 420E+0738 380E+0732 320E+07
6 000
II
1 2 4
time(out) average std dev0 444E+07 154E+072 478E+07 203E+074 404E+07 198E+076 236E+07 125E+078 185E+05 104E+05
16 284E+06 018 328E+06 557E+0620 374E+06 021 386E+06 528E+0624 210E+06 580E+05
PolymerPlates were all blank for every dilution
11
~
125
15time (out) count cone (cfuml) average std dev
0 31 310E+07 427E+07 153E+0728 280E+0737 370E+0749 490E+0749 490E+0749 490E+0779 790E+0733 330E+07
2 29 290E+07 478E+07 203E+0725 250E+0717 170E+0767 670E+0781 810E+0768 680E+0745 450E+0748 480E+0750 500E+07
4 52 520E+07 404E+07 198E+0750 500E+0756 560E+0755 550E+0772 720E+07
147 147E+07143 143E+0728 280E+0722 220E+07
6 24 240E+07 236E+07 125E+0749 490E+07
138 138E+07126 126E+07150 150E+07
12 120E+0716 160E+0713 130E+0742 420E+0734 340E+0728 280E+07
8 11 110E+05 185E+05 104E+0524 240E+0532 320E+0580 800E+04
117 117E+0591 910E+0434 340E+05
18 56 560E+04 328E+06 557E+0660 600E+04
126
57 570E+046 600E+044 400E+049 900E+04
82 820E+0581 810E+0585 850E+0515 150E+0611 110E+067 700E+05
152 152E+07137 137E+07142 142E+07
21 183 183E+07 386E+06 528E+06111 111E+07126 126E+07186 186E+06159 159E+06148 148E+06
10 100E+0616 160E+0615 150E+0666 660E+0584 840E+0561 610E+0522 220E+0610 100E+0615 150E+06
24 22 220E+06 210E+06 580E+0524 240E+06
131 131E+06167 167E+06141 141E+0620 200E+06 - -
28 280E+0630 300E+06
127
APPENDIX H
M athematical Theory
128
M ATHEM ATICAL THEORY
Kwok (1997) used Basmadjian and Sefton to determine that the drug concentration
immediately next to the polymer in a tube was
CZCNkill rD ) = A [ (xr0)ReSc]13 where (xroReSc)lt104-103
Cs - surface concentration (|igcm5)
Nkill - minimum killing release rate (|Jgcm2s)
R0 - effective hydraulic radius (cm)D - diffusivity of ciprofloxacin in fluid (cnfs)A - constant for geometry x - axial distance from the entrance (cm)
Re - Reynoldrsquos number Sc - Schmidt number
Laminar flow with constant velocity v was used estimate Nkill as 57 x 10J pgcnrs
using the equation above
The ciprofloxacin impregnated polymers were assumed to behave as if dissolution
into a falling film was occurring allowing Pickrsquos second law of diffusion to be modified as
follows
Pickrsquos second law of diffusion
MciZMt = Dip M2CiZMx2
does not adequately model the controlled-release of ciprofloxacin as it does not take into
consideration the fluid flow over the polymer and results in a t12 release rate A better
129
equation would be
vz(x) McMz = Dip M2CiZMx2
where fluid flow is assumed to be occur in the z direction and diffusion is assumed to be in
the x direction The following boundary conditions should be sufficient for the situation
encountered in the flow cell over the first 24 hours
I) O gt Il O at N Il O
2) O gt Il O at y mdash co
3) O gtIl O pound at
OIlThe solution therefore is
CaZCao = erfc [yZ(4DzZvmax)]
130
APPENDIX I
Polymer Surface Area Measurements
131
POLYMER Date of experiment Surface area (mnV)Control 6997 72578
62897 6550372697 76102
Triglyme 8897 9455881097 9458882297 83026
Ciprotriglyme 81697 9064982497 9739782997 94352
BMA 83197 870619797 9140692197 91703
CiproBMA 9597 8818191497 8760691997 85282
MONTANA STATE UNIVERSITY LIBRARIES
3 1762 10302039 O
1
i

6
Within this EPS matrix the cells continue to grow divide and die Occasionally chunks
of the biofilm will detach as a result of either shear forces or weaken of the bonds holding
them to the substratum (Characklis 1990)
Surface M odification
Eveiy natural and synthetic surface has unique physical and chemical properties that
can influence cellular adhesion By modifying the biomaterial surface the fundamental
processes governing biofilm formation can be altered Several review articles discuss these
processes in detail (Cristina et al 1994 Cristina Naylor and Myrvik 1992 Bryers
1988 Characklis 1990 Dankeit Hogt and Feijen 1986) and acknowledge the similarities
between bacterial colonization and tissue integration In many situations host cells are
actually competing with bacteria to colonize the biomaterial surface Thus many surface
modifications are aimed at intentionally promoting natural tissue adhesion while others are
directed at preventing bacterial adhesion
M odifications Host Cell A dhesion
Techniques focused on promoting tissue integration range from endothelial cell
sodding to glow plasma discharge modification (Williams et al 1992 Massia and
Hubbell 1991) The coating of silicone rubber membranes with poly (2-hydroxy ethyl
methacrylate) (poly HEMA) by glow plasma discharge has shown encouraging results in
vitro with regard to the attachment and growth of corneal epithelial cells bringing the
development of an artificial cornea one step closer to reality (Lee et at 1996)
7
Hydroxylapatite (HA) coatings of bone implants have already proven effective at promoting
faster and greater bone adaptation and improving implant fixation Better techniques of
applying the calcium phosphate to the implant are being examined including plasma spray
heat-treated plasma spray and magnetron-sputter (Hulshoff et al 1996) Carbon
deposition excimer laser ablation and photochemical coatings are being examined as ways
of promoting and controlling endothelial cell proliferation (Kaibara et al 1996 Doi
Nakayama and Matsuda 1996) Surface modifications may also decrease the binding of
host proteins such as thrombin and anti thrombin III thereby lowering the potential to form
blood clots which can promote bacterial adhesion A common method of accomplishing
this is by immobilizing heparin on the surface (Byun Jacobs and Kim 1996 Paulsson
Gouda Larm and Ljungh 1994 Lindhout et al 1995)
M odifications Bacterial Cell A dhesion
Methods for inhibiting bacterial colonization range from antithrombogenic coatings
to the incorporation of antimicrobial substances such as silver or quaternary amine salts (
Wang Anderson and Marchant 1993 Ryu et al 1994 Jansen and Kohnen 1995)
Heparin is only one of the substances used to coat surfaces which have been shown to
decrease bacterial adhesion due to protein-mediated adhesion Poly(vinyl pyrrolidone)
(PVP) coatings which inhibit the adsorption of fibrinogen to the surface have also exhibited
decreased bacterial adhesion (Francois et al 1996) Reductions in bacterial adhesion to
silastic catheters coated with salicylic acid a nonsteroidal anti-inflammatory drug have
been demonstrated in vitro (Farber and Wolff 1993) Coatings of hydrophilic polymers
such as polyethylene glycol (PEG) have shown potential for inhibiting implant-related
infections (Portoles Refojo and Leong 1994) Latex catheters coated with
8
glycomethacrylate gel another hydrophilic polymer have also demonstrated the ability to
reduce infection The reduction was enhanced by the incorporation cephalothin an
antibiotic (Lazarus et al 1971) The elution of an antimicrobial from the implant is one
of the most popular and oldest methods of dealing with biomaterial-centered infections
illustrated by the use of antibiotic impregnated bone cement (Strachan 1995 Seyral et al
1994) As already seen however the incorporation of antibiotics and other antimicrobials
has also been studied with regard to various polymer systems (Rushton et al 1989
Ackart et al 1975 Golomb and Shplgelman 1991 Greenfeld et al 1995) As
knowledge about the immune system increases so does the potential for developing new
substances that can coat biomaterials or be released from them to provide protection against
bacterial colonization as witnessed by development of passive local immunotherapy
(Gristina 1997)
Controlled Release
Controlled release of antibiotics at the site of implantation is one of the more
common approaches to preventing infection and is being used successfully in orthopedic
surgery A recent US survey showed that 27 of responding hospitals commonly use
antibiotic impregnated bone cement for joint replacement surgery (Strachan 1995)
However the use of bone cement is not recommended in younger active people
Consequently the controlled release of antibiotics from coated implants is under
investigation (Price et al 1995) Thus it can be seen that there are several different types
of controlled release systems
9
Controlled Release System s
Controlled release devices are classified by the method that controls the release of
the substance of concern The most common classifications are diffusion controlled
systems chemical reaction systems and solvent activated systems There are several
excellent books and articles that cover this subject in depth (Langer and Wise 1984 Kost
and Langer 1984 Fan and Singh 1989 Baker 1987 Lohmann 1995 Kydonieus 1992
Robinson and Lee 1987) so only a brief overview will be given here
Controlled release systems can be designed to produce release rate profiles that
enhance the efficacy of the desired agent This is in contrast to sustained release devices
which allow the substance of concern to be effective longer but are dependent on
environmental factors when it comes to the amount and the rate of release
The three most common release profiles achieved by controlled release devices are
(I) zero-order release (2) first-order release and (3) t 12 release shown graphically in
figure 2 Zero-order release is the most desired release rate and is most easily obtained
by using diffusion controlled release systems (Kost and Langer 1984 Lohmann 1995)_
D iffusion Controlled D ev ices There are two general types of diffusion
controlled systems (I) matrix or monolithic and (2) reservoir The rate limiting step in
both systems is the diffusion of the drug through the polymer matrix which may be
described by (l)F ickrsquos first law of diffusion and (2) Pickrsquos second law of diffusion also
called the diffusion equation (Bird Stewart and Lightfooi 1960) For a one dimensional
system they may be written as
10
Release rate kinetic
^ first-order release
square-root of time release
zero-order release
Figure 2 Zero-order first-order and square-root of time release patterns from contolled-release devices
( 1 ) Ji = - D ip raquo d c d x
(2) bCjbt = Djp trcb2
Ji - mass flux of solute (drug) i
Ci - concentration of solute i
x - position of release
t - time
Djp - solute diffusion coefficient through the polymer
11
Equation (I) is commonly used to simulate the release rates from reservoir devices
The diffusion coefficient is a measure of the mobility of the individual solute molecules
through the reservoir membrane and is considered concentration independent The
concentration gradient in the membrane is represented by dCdx The negative sign reflects
the movement of solute down the concentration gradient toward more dilute regions If the
membrane is saturated with solute a burst effect may be seen which causes an initial spike
of solute A lag effect occurs when the solute must first permeate the membrane before it is
released (Baker 1987 Langer and Peppas 1981)
Equation (2) is obtained by combining equation (I) with the continuity equation for
mass transfer assuming no reaction and zero velocity Equation (2) describes transient
diffusion in membranes The diffusion coefficient is considered to be concentration
dependent It results in the square root of time release rate for simple geometries such as a
one-dimensional slab (Baker 1987 Langer and Peppas 1981) Detailed discussions on
the applications assumptions and solutions of both these equations can be found in the
literature (Langer and Wise 1984 Kost and Langer 1984 Fan and Singh 1989 Baker
1987 Lohmann 1995 Kydonieus 1992 Robinson and Lee 1987 Langer and Peppas
1981)
Monolithic devices are made by mixing the substance of concern with the polymeric
material to form a solution from which the finished product is manufactured The drug to
be released may be dissolved or dispersed (supersaturated) in the resulting polymer
depending on how much is ldquoloadedrdquo into the carrier polymer Examples of monolithic
devices include flea collars and antibiotic loaded bone cement
Examples of reservoir systems include nitroglycerin skin patches Norplanttrade a
subcutaneous birth control device and Ocusertrx1 a contact lens like device used to neat
glaucoma In these types of systems the substance of interest is surrounded by an inert
12
membrane which may be either porous or non-porous If the membrane is porous the
drug simply diffuses through the pores but if the membrane is non-porous the drug must
first dissolve in the membrane structure before it can diffuse along and between the
segments of the membrane Reservoir systems are known for the ease with which they can
be designed to achieve zero-order release rates
Both monolithic and reservoir diffusion controlled systems are rate limited by the
diffusion of the drug through the polymer Tlie choice of polymer and the resulting effect
on the diffusion and partition coefficient of the substance of concern as well as the
geometry of the device will influence drug release rates (Kost and Langer 1984 Lohmann
1995)
Chem ically Controlled S ystem s When the substance of concern is encased
in a biodegradable non-diffusive polymer the resulting reservoir device is classified as a
chemical reaction system As seen in the diffusion controlled devices there are two basic
types of biodegradable devices (I) reservoir and (2) monolithic The release rates of these
systems are strongly influenced by the erosion of the polymer In the ideal case surface
erosion would be the only factor affecting the release rate however this system has yet to
be designed (Kost and Langer 1984 Lohmann 1995)
A second category of chemical reaction controlled release is chemical
immobilization In this type of system the substance of concern may be chemically bound
to the polymer carrier backbone or it may he part of the backbone The release rate is then
influenced by the enzymatic or hydrolytic cleavage of the appropriate bonds (Kost and
Langer 1984 Lohmann 1995)
13
Solvent Activated S y s te m s The last class of controlled release devices to
be mentioned here are the solvent controlled systems These fall into two categories (I)
swelling controlled and (2) osmotically regulated In both types the substance of concern
is either dissolved or dispersed within the polymer but it is unable to diffuse through the
polymer matrix until activated In the case of the swelling controlled system the solvent is
absorbed by the matrix causing the polymer to swell and allowing the active agent to
diffuse out In the osmotic system the solvent permeates the polymer-drug system due to
osmotic pressure which promotes release Release may occur by either simple Fickian
diffusion or by non-Fickian diffusion Detailed analysis of these and other controlled
release systems can be found in the references cited previously
A dvantages Controlled release systems offers several advantages over
conventional drug delivery systems The major advantage when dealing with biomaterial
centered infections is increased efficacy of the drug The drug can be administered at the
biomaterial site thereby allowing the therapeutic levels to be maintained locally while
decreasing the systemic drug level This will minimize side effects and improve
pharmokinetics In addition the effective drug level can be sustained for an extended
period of time (Kost and Danger 1984 Lohmann 1995)
The use in joint replacement surgery of antibiotic impregnated bone cement
combined with a polymer coating such as poly-L-lactic acid polymer (PLLA) has proven
popular for its ability to prevent infections as well as aid in joint fixation (Strachan 1995)
Controlled release of antibiotics from biomaterials is less common however in operations
involving other types of implants Nonetheless research in being done into this method of
inhibiting bacterial colonization A British study showed that antibiotic impregnated
silicone rubber coatings of implanted stimulator devices significantly decreased
14
postoperative infection when compared with systemic antibiotic prophylaxis (Rushton e t
al 1989) One of the newer antibiotics receiving attention as a treatment for biomaterial-
centered infections is ciprofloxacin
C iprofloxacin
Ciprofloxacin is a Iluorinated quinolone antimicrobial agent It is active against a
broad range of bacteria ranging from aerobic gram-negative bacteria to aerobic gramshy
positive bacteria Anaerobic bacteria however are not affected by ciprofloxacin It was
approved by the Food and Drug Administration in October 1987 (Wolfson and Hooper
1989 cponline 1997)
Like other quinolone agents ciprofloxacin is a synthetic antimicrobial which mainly
effects DNA gyrase the bacterial topoisomerase II The gyrase is a two subunit enzyme
responsible for regulating the supercoiling of DNA during replication and transcription
The A subunit of the gyrase introduces nicks in the DNA that allow the B subunit to twist
the single stranded DNA (ssDNA) around its complementary strand of DNA The A
subunit of the gyrase then seals the nicks It is believed that ciprofloxacin and the other
quinolones interfere with the A subunit preventing it from sealing the nicks Bactericidal
levels of quinolones do not affect mammalian topoisomerase enzymes The exact bacterial
killing mechanism is not known but detailed discussions about the mechanisms of
quinolones action can be found in WolfSon and Hooper (1989) It is known that both slow
growing and fast growing organisms are inhibited by ciprofloxacin and that a prolonged
post-antibiotic effect is exhibited by fluoroquinolones (Wolfson and Hooper 1989
cponline 1997 Craig and Ebert 1991 Cam pa Bendinelli and Friedman 1993)
15
Ciprofloxacin has the lowest minimum inhibitory concentration (MIC) of the
quinolones The MIC90 for P aeruginosa in vitro is between 025 (igml and I jigml
Thus ninety percent of the P aeruginosa strains will be inhibited at these low
concentrations (Craig and Ebert 1991 Campa Bendinelli and Friedman 1993) Due to
its wide antimicrobial range and low MIC ciprofloxacin was chosen as a model antibiotic
for incorporation into the test PEU polymers
16
MATERIALS AND METHODS
Bacteria and Cultures
Pseudomonas aeruginosa (ERC-I) was obtained from the National Science
Foundation Engineering Research Center for Biofilm Engineering Montana State
University Bozeman MT Cultures of P aeruginosa were stored as frozen stocks
maintained in a solution of 2 peptone and 20 glycerol at -70degC
Solutions
M edium
A minimal salts medium with glucose as the sole carbon source was used for
culturing bacteria A one liter solution consisted of 05g glucose 256g Na2HPO4 208 g
KH2PO 4 IOg NH4Cl Olg CaCl2 05g MgSO4 and 002ml of a trace metals solution
The trace metal solution was composed of 05 CuSO4-SH2O 05 ZnSO4-VH2O 05
FeSO4-VH2O and 02 MnCl2-4H20 all in a weight per volume ratio dissolved in 10
concentrated HCl (Manual of Industrial Microbiology and Biotechnology 1986) The trace
metals solution was autoclaved separately from the nutrient medium as was a 5M CaCl2
solution and a 2SM MgSO4 solution The glucose trace metals CaCl2 and MgSO4 were
all added to the sterile medium by injection through a septum after the medium had been
brought to room temperature All solutions were filler sterilized through a 02 |im sterile
syringe tip filter (Coming) before addition to the medium AU solutions were made using
Nanopure water (Bamstead ultrapure water system Nanopure system) and autoclaved in
glass containers at 121degC for 15 minutes per liter
17
CvtologicaI Stains
A 005 solution of Acridine Orange used for epifluorescent total cell counts was
filter sterilized using an autoclaved filter apparatus Hoechst 33342 (Sigma) was obtained
in IOOmg quantities and stored in a O0C freezer until a fresh solution was needed Then
IOml of sterile nanopure water were added through a 02 jam sterile syringe tip filter to
dissolve the powder Once the Hoechst solution was made it was kept in the refrigerator
All stains were stored in light sensitive bottles and made at fresh at least once a month
C iprofloxacin
Ciprofloxacin hydrochloride was obtained from Miles Inc as 867 fag
ciprofloxacinmg A 10000 fagml stock solution was made by dissolving 1153 mg of
powder in 10 ml of sterile nanopure water Tlte stock solution was stored in a light
sensitive glass container in the refrigerator for up to one year as per the supplierrsquos
recommendations
D etection A Milton Roy Spectronic 1201 spectrophotometer was used to
determine the proper wavelength for detecting ciprofloxacin Effluent samples were
collected from the flow cell filtered through a 02 (am sterile syringe tip filter (Corning)
and stored in amber microcentrifuge tubes kept in a 0degC freezer until analysis A Milton
Roy Spectronic 601 set at 339 nm was used to determine the concentration of ciprofloxacin
in the effluent from the flow cell_
18
Reactors and Flow Cell Systems
Continuouslvrstirred Tank Reactor (CSTR)
A CSTR was designed to provide a constant supply of Pseudomonas aeruginosa
at room temperature (230+3degC) in exponential growth A 125 ml filter flask was equipped
with an inlet outlet aerator and injection port to build the CSTR The arm of the filter
flask was situated so that overflow occurred when a volume of 128 ml was reached
Table I lists the parameters used for sizing the CSTR At steady-state operation tire
specific growth rate p is assumed to be equivalent to the dilution rate D Figure 3
shows a schematic of the chemostat setup The outlet lube from CSTR was connected to a
Specific growth rate (|_t) 0467+ 0025 hr1 (Appendix A)Volume (V) 128 mlVolumetric flow rate (Q) 10 mlminTable I Parameters used for sizing of biologic reactor
waste jug unless cells were needed for an experiment in which case the CSTR was
connected to a collection vessel A fresh clean sterile collection flask was used for every
experiment The setup was dismantled cleaned and sterilized at least once every two
weeks
Flow C ell
A schematic of the flow cell used to evaluate the test materials can be seen in figure
4 The polymer sample (P) was placed on a clear polycarbonate base which had entrance
and exit stainless steel portals milled into it A white FDA vinylnitrile rubber (D) gasket
19
Collectionvessel
CSTR
Figure 3 CSTR setup used to grow P aeruginosa continuously
was used to equalize sealing pressure around the polymer sample as the assembly was
screwed together A thin gauge natural latex rubber (C) gasket was clamped between the
test sample and coverglass (B) to form the flow channel The coverglass was glued over a
hole in the clear polycarbonate cover using the denture adhesive Fasteethreg Table 2
lists the dimensions of the flow channel and various hydrodynamic parameters AU of
the materials used in the flow cell were sterilized by dipping the components in 70 ethyl
20
Figure 4 Flow cell schematic (A) clear polycarbonate cover with hole through center for viewing (B) 2 glass coverslip (C) thin gauge natural latex gasket (D) white FDA vinylnitrile rubber sealing gasket (E) clear polycarbonate base (P) test
polymer
alcohol rinsing with sterile nanopure water and exposing to UV light for at least 15
minutes The test polymers were not exposed to UV The How cell was assembled
under a laminar flow hood to ensure sterility
Table 2 Flow channel dimensions and hydraulic parameters
width (w) 16 mmlength (I) 44 mmdepth (d) 08 mmarea (A) 128 mmwetted perimeter (P) 336 mmhydraulic radius (Rh) 04 mmReynolds number (Rp) 2 1entrance length (Lp) 01 mmwall shear stress (Jfl) 203 dynecnri
21
Microscope Setup and Techniques
Polym er A nalysis
The polymer samples were tested for bacterial adhesion and growth using an image
analysis system seen in figure 5 For the first six hours of the experiment approximately
5 x IO8 cellsml of stained Pseudomonas aeruginosa were flowed over the test polymer at
a rate of 10 mlmin For the remainder of the experiment complete medium without
bacteria was pumped through the flow cell
Hoechst 33342 Staining Procedure P aeruginosa in log growth were
collected and stained with lOpgml of Hoechst 33342 Once the stain was added to the
cells the flask containing the mixture was wrapped in foil and put on an insulated stir plate
for three hours After three hours the suspension was poured into a sterile centrifuge bottle
and centrifuged at 10000 xg for 15 minutes in a 20degC centrifuge (Sorvall Instruments
Dupont model RC5C GSA rotor) The liquid was then poured off and the cells were
resuspended in sterile complete medium minus the glucose The cells were washed twice
more before placing them in a sterile 125 ml Erienmeyer flask with a stir bar at a
concentration of approximately 5 x 10s cellsml This procedure was repeated every two
hours until the flow cell feed was switched to complete medium only at hour six
Cell V isualization At t=0 the flow cell was place on the stage of an
Olympus BH-2 Epi-Illumination UV upright microscope equipped with Olympus filter
combinations encompassing the ultra-violet violet blue and green regions of the
spectrum A 40x Nikon water immersion objective was used since the flow channel was
22
greater than 0100 mm in depth A minimum of three fields was captured by an Optronics
OPDEI-470OT cooled color CCD camera The resulting image was processed by a Targa
64+ analog digital converter (ADC) card and stored on computer until the image could be
analyzed using Image Pro Plustrade Images were taken every two hours until t=6 hours
when the feed was switched from the cell suspension to sterile complete medium The
remaining four time points captured were (I) t=7 or 8 hours (2) t=16 or 18 hours (3)
t=20 or 21 hours and (4) t=24 hours
Waste
Figure 5 Experimental setup Feed container = cell suspension t=0-6 hrs after t=6 hrs feed = complete medium Flow rate through flow cell 10 mlmin
23
Cell density calculations Tlie software system Image Pro Plus was used to
determine the density of cells on the polymer surface At the beginning each experiment an
image of a micrometer was taken to allow for the calibration of cell size and image area
Actual cell counts could be obtained at the early time points Cell density calculations were
then simply a matter of dividing cell count by the viewing area At time points greater than
8 hours the area occupied by cells was used to give a range for the cellular density This
was accomplished by dividing the area covered by the high and low published values for P
aeruginosa cell area (Holt 1994) to calculate cell numbers This method proved to be valid
as the cells numbers obtained at the early time points fell within the high and low range of
cell numbers calculated using area covered
In addition samples from both the inlet and outlet of the flow cell were collected for
total cell counts and viable cell counts Total counts and viable counts were also conducted
on a sample of the solution in which the polymer was placed at the end of the experiment
Before any sample was removed for these tests the polymer was sonicated for 30 seconds
to remove adherent bacteria This allowed for the calculation of cell density on the polymer
using total cell counts and viable cell counts
Total Cell C ounts A portion of each sample collected from the inlet outlet
and sonicated polymer solution was used to determine total cell counts One milliliter of
005 Acridine orange was combined with one milliliter of 2 glutaraldehyde and the
appropriate dilution of sample This solution was poured over a black polycarbonate
membrane (pore size 022 pm and 25 mm diameter Fisher Scientific) placed in a cell free
glass Millipore filter apparatus Suction was applied to trap the cells on the membrane
The membrane was mounted on a slide by putting a drop of oil (non-drying immersion oil
type FF) on a microscope slide placing the membrane cell side up on top of the oil drop
24
followed by a second drop of oil and covering with a glass cover slip The slide was
examined under fluorescent microscopy Bacteria were counted using an Reichert-Jung
Microstar IV model UV microscope with a mercury lamp and a Reicheit IOOx oil
immersion objective Total counts ( cellsgrid) were then converted to total cellsml using
the following conversion
total cells (cell count) (dilution) (conversion factor) ml ~ sample volume
where the conversion factor was 227 x 10
Viable Counts A part of the cell suspension sample was used to make serial
dilution for plating onto plate count agar (Difco Laboratories) plates A I(K) pl multipipetor
(Rainin epd 2) was used to dispense ten 10 pi drops of properly diluted cell suspension
onto a plate This procedure was performed in triplicate for each dilution plated Plates
were incubated at room temperature for 24 hours Drops that contained between 3 and 30
colonies were counted and converted to colony forming units (cfu)ml by taking into
account the dilution factor (Miles etal 1938)
Susceptibility and Adhesion Effect Studies
C iprofloxacin
Growth curves carried out in batch were used to determine the susceptibility of
increasing concentrations of ciprofloxacin on P aeruginosa These tests were not carried
out as most traditional MIC assays Studies here were performed as per the procedures of
25
Nodine and Siegler 1964 Lennette et al 1985 starting with a cell concentration of IO6
cellsml P aeruginosa was grown in separate batch cultures which contained various
concentrations of ciprofloxacin At time points ranging from t=0 to t=24 hours samples
were taken for viable counts
Hoechst Stain 1333421
Susceptibility studies were also conducted on Hoechst 33342 to ensure that the
stain did not interfere with normal cell growth The studies were conducted in the same
manner as the ciprofloxacin tests Concentrations of Hoechst stain examined ranged from
Ojagml (control) to 50|igml
Fasteethreg
Studies were also carried out to ensure that the denture adhesive Fasteethreg used
to glue the coverglass to the polycarbonate cover of the flow cell had no negative effect on
the growth of bacteria These studies were conducted in the same manner as those for
ciprofloxacin and the Hoechst stain
Hoechst Stain Effects on P a e r u g in o s a Adhesion
Tests were performed to determine whether the Hoechst stain interferes with the
normal adherence of the cells to a surface The flow cell was assembled without a polymer
sample and an untreated cell suspension was run through the cell for four hours Since the
base of the flow cell is a clear polycarbonate light microscopy could be used to monitor
cell adhesion using video recording Experiments were also carried out using stained cells
still in the staining liquid and stained cells that had been washed and resuspended in
ldquocleanrdquo medium
2 6
The possibility of ciprofloxacin and Hoechst interfering with each other was also
investigated Plate counts were used as in the susceptibility studies Microscope slides
were also made and any change in staining ability was noted
Tubing
All of the tubing used was FDA approved MasterFlex (Cole Palmer) for use with
either pharmaceuticals or food Tubing used included Pharmedreg size 1314 and 16
Norprenereg Food size 13 and 14 and Tygonreg Food size 14 Before each use it was
sterilized by autoclaving at 121degC for 15 minutes
Biom aterial Fabrication
BP Control Polym er
A poly (ether) urethane (Biospantrade) poly ethylene glycol (PEG) film (BP) was
prepared for use as a control The method of fabrication was as follows (I) 20 ml of
deionized water was used to dissolve 2 g of PEG (Polyscience) (2) the resulting solution
was lyophilized and the powder was sieved to obtain 90 pm or smaller particles (3) this
powder was mixed with a 24 Biospantrade solution (Polymer Technology Group Inc) (4)
the polymer solution was degassed transferred to a Teflon mold (Chemware) and
incubated at 60degC for one day and finally (5) the film was dried completely in a vacuum
chamber
27
Test Polym ers
The test polymers were manufactured by the same procedure except the
ciprofloxacin containing films also had an equal amount of ciprofloxacin added in step (I)
In addition the test polymers were coated with either triethylene glycol dimethyl ether
(triglyme) or tiiglyme plus n-butylmethacrylate (BMA) by glow discharge plasma
deposition (GDPD)
Note All test materials were fabricated at the University of Washington by Connie
Kwok
2 8
RESULTS AND DISCUSSION
Pseudomonas aerueinosa Growth Experiments
Batch S tud ies
Growth Rate Studies were conducted to determine the growth rate of P
aeruginosa under experimental conditions Table 3 (Appendix A) The specific growth
rate (I was found to be 0467 hr1
Experiment specific growth rate (h r1)I 04802 05023 04444 04436Average 0467plusmn0025Table 3 Specific growth rate for P a eru g in osa grown at room temperature with SOOppm
glucose fully aerated
Susceptibility S tu d ies In addition susceptibility studies were done on
ciprofloxacin Hoechst 33342 and Fas teethreg (Appendices BC and D) The
ciprofloxacin tests confirmed the published M IC90 of l(igml The Hoechst stain (33342)
were shown not to inhibit growth at 10 |_igml Table 4 summarizes the results of the
Hoechst 33342 susceptibility tests Results from the Fasteethreg susceptibility studies show
no negative effects on P a eru g in o sa
Hoechst 33342 concentration (pgml) Growth inhibited0 No5 No10 No50 YesTable 4 Summary of Hoechst 33342 studies
29
Flow Cell Experimental Protocol
The concentration of resuspended bacteria used to challenge the test polymers was
roughly 5 x IO8 cellsml The flow rate to the parallel plate flow cell was maintained at
approximately 10 mlmin for the duration of each experiment Samples were taken for
total counts and viable counts from both the system influent and the effluent at t = 0 2 4
and 6 hours for every experiment Only effluent samples were collected after t = 6 hours
Effluent samples were also used to determine if any ciprofloxacin eluted from the test
polymers containing the antibiotic All the experiments were earned out at room
temperature in the medium previously described
Flow Cell Experiments
The ability of a polymer to affect bacterial adherence and colonization was examined
in flow cell experiments run on four different formulations of a poly (ether) urethane (PEU)
base material The control material (BP) was a PEU base matrix (Biospantrade) containing
poly (ethylene glycol) (PEG) as a pore forming agent
The materials tested included (I) triglym e BP coated with triethylene glycol
dimethyl ether (triglyme) (2) ciprotriglym e BP made up of equal parts PEG and
ciprofloxacin coated with triglyme (3) BM A BP coated with a layer of n-
butylmethacrylate (BMA) underneath the triglyme coating and (4) ciproBM A BP made
up of equal parts PEG and ciprofloxacin coated with BMA followed by triglyme (Table
5) The triglyme coating was used to control the release rates of the model antibiotic
ciprofloxacin
30
Polym er FormulationBPControl BiospanlivV PEG (poly ethylene glycol)triglyme Triethylene glycol dimethyl ether coated BPciprotriglyme BP made with equal parts PEG and ciprofloxacin coated with triglymeBMA BP coated with n-butylmethacrylate followed by a coating of tryiglmeCiproBMA BP made with equal parts PEG and ciprofloxacin coated with BMA
followed by a coating of triglyme
Table 5 Description of polymers used in flow cell experiments
Three samples of each polymer were tested A good representation of the events at
the polymer surface is provided by image analysis (IA) as it is obtained from pictures of
the stained cells on the surface Figures 6 and 7 illustrate the attachment and growth of
P aeruginosa on the control polymer over the course of an experiment Figure 8
displays the differences in cell density on three different polymers after 24 hours in the
flow cell A significant decrease in bacterial adhesion and colonization was evident when
the test polymers were compared to the BP polymer at the end of the experiments and over
the entire run using pictures taken for TA (figures 6 7 and 8)
The graphs generated from the image analysis data (figures 9 10 and 11) were
obtained from a single run for each polymer Each experiment was however replicated
three times The error bars were obtained because at least three different fields of view
were taken for each time point from which the average cell density and the standard
deviation were calculated (Appendix E)
Figure 6 BiospanControl time course of cell adhesion
t=0 hours t=2 hours
t=4 hours t=6 hours
Figure 7 ControlBiospan polymer bacterial colonization
t=24 hours
Figure 8 Comparison of the extent of colonization of different polymers at t=24 hours
triglyme Cipro-triglyme
34
CNlt
EE
0)O
pound(AC0)O
100E+06
100E+05
100E+04
100E+03
100E+02
100E+01
100E+00 J -
I III bullbullbullbullbullbullbullbullbull Ce -
Control STrigIyme 0 ciproAriglyme S BMA S ciproBMA
Polymers
Figure 9 Dhiect counts of cell density on the polymer surface after 24 hours (L-R) Control triglyme ciprotriglyme BMA ciproBMA
Figure 9 clearly shows that the coatings of triglyme and BMA + triglyme reduce
bacterial colonization by at least half when compared to the BP control It can also be seen
from Figure 9 that the addition of ciprofloxacin to the polymer formulation decreases
bacterial colonization by at least two orders of magnitude Note that the y-axis on figure
9 is a logarithmic scale
35
60E+05
50E+05
40E+05
30E+05
20E+05
10E+05
OOE+OO I r
-10E+05
tim e (hrs
mdash Control
-laquo~-trigiyme
A ciprotriqlyme
FigurelO Time course cell colonization curve of control triglyme ciprotriglyme obtained from image analysis
Figure 10 shows that bacterial attachment and colonization to the control polymer is much
greater than to either the triglyme or ciprotriglyme polymer Analysis of the data in
Appendix E will show the same trend for BMA and ciproBMA At t = 6 hours the feed
was switched from a medium containing ~5 x IO8 cellsml with no glucose to a sterile feed
of complete medium plus 500 ppm glucose Therefore any increase in cell density can be
attributed to growth Slightly more growth can be seen on the triglyme than on the
ciprotriglyme over the course of the experiment however neither of these polymers
exhibits the growth found on the control polymer
36
Figure 11 reveals that bacteria are attaching to the triglyme and ciprotiiglmc
polymers but not to the same extent as to the BP control polymer The bacteria attach to
the control polymer at a rale ol 114 x IO4 ccllsmnrhr while the rates of attachment to the
triglyme and the ciprolriglymc are significantly lower 66 cel I smm 2Zhr and 537
C ellsZm m 2Zhr respectively While the attachment rate is greater on the ciprolriglymc than on
the triglyme The rale of growth is greater on the triglyme than on the ciprolriglymc It can
80E+04
70E+04
60E+04
E 50E+04
40E+04
30E+04
20E+04
10E+04
00E+00
-10E+04
time (hrs)
Control
triglyme
A ciprotriqlyme
Figure 11 Attachment rate differences are evident within the first 6 hours of the flow cell experiments The control polymer demonstrates a much more rapid attachment rate than either triglyme or ciprotriglyme
be seen from figure 10 that the control polymer exhibits an exponential rale of growth
from 1=16-24 hours that is significantly higher than either triglyme or ciprolryglmc Whal
37
is not readily seen is the fact that triglyme exhibits a faster growth rate than the
ciprotriglyme 181 x IO3 cellsmm2hr versus 27 cellsmm2hr
Total counts of the effluent found in Appendix F back up the imagae analysis
results ( figures 1213) F igure 12 shows that for the first six hours ~5xlO8 cellsml
are being pumped through the flow cell Once the supply of cells is cut off at t=6 hours
cells can still be seen in the effluent implying that growth of new cells is taking place in the
flow cell system
140E+09
120E+09
T=100E+09
S800E+08
S600E+08
agt400E+08
200E+08
000E+000 2 4 6 8 1012 141 6 1 8 20 22 24 26
mdash Control Triglyme
Ciprotriglyme- -x- - BMA
ciproBMA
time (hrsF igure 12 Total counts made with Acridine Orange From t=0-6 hours a feed
composed of a bacterial suspension in medium without a carbon source was pumped through the flow cell after t=6 hous the feed was switched to sterile complete medium
Figure 13 obtained from total cell counts displays the same trend with regard to
the amount of cell density on the polymer surface after 24 hours as figure 9 which was
made from direct count data The control polymer exhibits the highest cell density after
24 hours The effluent data does not demonstrate as much of a difference between
polymers as the image analysis data which may be explained by the growth and sloughing
of bacteria in the effluent tubing It is to be expected that the samples collected from the
Den
sity
(ce
lls
mm
A2)
38
effluent would have higher cell counts since there is more surface area available for cell
growth
100E+08 T
100E+07
100E+06
100E+05
100E+04
100E+03
100E+02
100E+01
100E+00Polym ers
I n Control | s Triglyme | ^Ciprotriglyme I SBMA I sciproBMA
Figure 13 Calculated cell density on the ldquotestrdquo polymers using total cell count (acridine orange) data Note that it follows the same trend as the image analysis data
Figure 14 shows that viable cells are being pumped through the flow cell while
figure 15 demonstrates that the concentration of ciprofloxacin at the polymer surface is
high enough to have a noticable effect on the density of bacteria on the polymer (Appendix
G - Plate Count Data)
39
Effluent viability data from t = 0-24hours
100E+10
100E+09
100E+08
j 100E+07 -
100E+06 -
100E+05
100E+04
time (hrs)
mdashmdash Control triglyme
bull-c ip ro tr ig ly m eBMA
-bull- ciproBMA
Figure 14 Plate count data from effluent samples taken from the polymer flow cells during the course of the experiments shows that viable cells are going through the flow cell
As stated previously total counts and viable counts are not considered to be as
accurate as direct counts The effect of the extra surface area available for cell adhesion and
growth provided by the tubing was not factored into the results Subsequent sloughing
andor entrapment of cells in this region of the flow cell setup could affect the cell
concentration data collected Figure 16 demonstrates the variation obtained from the
den
sity
(cf
um
mA2
)40
concentration data collected Figure 16 demonstrates the variation obtained from the
100E+06
SxltltSSSxgtxv-v
mm
I B
reg Control reg triglyme 0 ciprotriglyme 0 BMA Q ciproBMA
Polymers
Figure 15 Cell densities on polymers calculated from plate count data No colonies were found on any of the plates made for the ciproBMA polymer (L-R) Control triglyme ciprotriglyme BMA ciproBMA
same polymer using different techniques As stated previously the results obtained from IA
are considered to he the most accurate since they are taken from the polymer surface and
not the effluent
cell
dens
ity (c
ells
or c
fum
m2)
41
100E+07
100E+06
100E+05
100E+04
100E+03
100E+02
100E+01
100E+00 Plate counts Total counts IA
I
Figure 16 demonstrates the variations in bacterial density on the triglyme polymer after twenty four hours using image analysis (IA) acridine orange staining of the effluent and plate counts of the effluent
C iprofloxacin re lease
The extra surface area could also factor into the amount of ciprofloxacin detected in
the effluent (table 6) of the polymers incorporating ciprofloxacin In one millileter of
effluent roughly 3 ug of ciprofloxacin should be detected It should be noted that all of
the polymers containing ciprofloxacin still retained significant amounts of ciprofloxacin
This is to be expected given that the initial loading of ciprofloxacin was 04g Additionally
42
an earlier study found that these polymers continue to elute ciprofloxacin for up to 128
hours in a well stirred flask (Kwok CS et al 997) The erratic release of ciprofloxacin
seen in table 6 may be due to the interaction of the antibiotic with cells growing in the
effluent tubing ciprofloxacin degradation resulting
Experiment Time (hours) Cipro cone (figml) of points above detectionCiprotriglym e
O 35 plusmn21 2
2 17 I4 5 I6 4 I8 ND O18 ND O21 18 I24 5 + 5 2
CiproBM A O 6 plusmn 5 32 I I4 ND O6 ND O8 29 I18 2 I21 ND O24 ND O
Table 6 Ciprofloxacin concentrations in effluent ND = not detectable
from light exposure pulsating flow unforeseen release behavior or damage to polymer
coating Appendix H expands on the mathematical theory behind the controlled-release
of a drug from a one-dimensional slab under flow conditions
Overall the flow cells experiments showed that ciprofloxacin could successfully be
incorporated into BiospantradePEG polymers and still maintain its efficacy In addition
they demonstrated that cell adhesion and colonization of opaque materials could be
monitored continuously for up to 24 hours under Jlow conditions The results involving
the triglyme and BMA coatings were also encouraging
43
SUMMARY
The research conducted for this study involved exposing planktonic Pseudomonas
aeruginosa to 10 |igml of the DNA stain Hoechst 33342 for 3 hours The cell
suspension was then washed and resuspended in fresh complete medium minus glucose
the carbon source Every two hours for six hours a fresh batch of resuspended cells was
pumped over a ldquotestrdquo polymer in a flow cell being monitored microscopically for bacterial
attachment After six hours the flow was switch from the cell suspension to complete
medium plus glucose in order to observe cell adhesion and growth over the 24 hour run
Pictures were taken periodically over the course of the experiment and examined by image
analysis to detect changes in bacteria cell density on the surface of the ldquotestrdquo polymer The
results obtained from image analysis were for the most part confirmed by total and viable
cell counts performed on effluent samples Within the limitations and scope of this work
the results show that
1) Both the BMA coating and the triglyme coating can cut bacterial adhesion and
colonization in half
2) The addition of the ciprofloxacin to the polymer matrix decreases bacterial adhesion and
colonization by at least two orders of magnitude when compared with the control
3) Hoechst 33342 can be used at lOugml without interfering with P aeruginosa growth
patterns
4) Hoechst 33342 enables bacterial adhesion and biofilm formation on an opaque surface
to be monitored in a flow cell system for up to 24 hours
The results of this research indicate that it would be worthwhile to pursue
development of the ldquotestrdquo polymers for use as biomedical materials Further investigation
into how well image analysis correlates with actual bacterial cell adhesion and colonization
44
is also suggested from these results It would be interesting to run a set of experiments on
a substratum comparing image analysis and destructive sampling in which the flow cell is
broken down and the substratum is removed at every time point In addition a better
indication of the long-term performance of these materials could be gained by conducting
tests over a longer period of time a week or more Likewise the exposure of the material
to proteins before andor during bacterial challenge would provide more realistic test
conditions Dealings with industry have shown that the types of adhesion and colonization
experiments conducted in this study are among the initial steps in gaining approval from the
FDA
45
BIBLIOGRAPHY
Ackart WB Camp RL Wheelwright WL and JS Byck A n tim ic r o b ia l P o ly m e r s Journal of Biomedical Materials Research V 9 p 55 - 68 1975)
Baker RW Controlled Release of Biologically Active A gents John Wiley amp Sons New York NY 1987
Bellido F and REW Hancock S u s c e p t ib i l i ty a n d R e s is ta n c e o f P s e u d o m o n a s a e ru g in o sa to A n tim ic r o b ia l A g e n ts P s e u d o m a n a s a e r u g i n o s a as an Opportunistic Pathogen eds M Campa M Bendinelli and H Friedman Plenum Press New York NY p 321- 348 1993
Bird RB Stewart WE and EN Lightfoot Transport Phenomena John Wiley amp Sons New York NY p 495 - 625 I960
Blanchard CR B io m a te r ia ls B o d y P a r ts o f the F u tu re lthttpwwwswiiorg3pubsttodayfallimplanthtmgt June 4 1996
Bondi A B a s ic P h a m a c o lo g ic T ec h n iq u es f o r E va lu a tin g A n tim ic r o b ia l A g e n ts I Animal and Clinical Pharm acologic Techniques in Drug Evaluation eds JH Nodine and PE Siegler Year Book Medical Chicago IL p 440 - 450 1964
Bryers JD M o d e lin g b io ftlm a cc u m u la tio n Physiological Models in Microbiology V o l rsquol l ed Brazin MJ and Prossser JL CRC Press Boca Raton FE p1091
1988
Byun Y Jacobs HA and Sung Wan Kim M ec h a n ism o f th ro m b in in a c tiv a tio n b y im m o b il iz e d h e p a r in Journal of Biomedical Materials Research V 30 p 423 - 427 1996
Carballo J CM Ferreiros and MT Criado Im p o r ta n c e o f experim en ta l d e s ig n in th e e v a lu a tio n o f th e in flu en ce o f p r o te in s in b a c te r ia l a d h e re n c e to p o ly m e r s Medical Microbiology and Immunology V 180 p 149-155 1991
Characklis WG and KC Marshall eds Biofilms J Wiley amp Sons New York NY 1990
Ciprofloxacin Ciproreg Ciproreg IV C loxanreg Clinical Pharmacology Online lthttpwwwcponlinegsmcomscriplsfullmonoshowmonopl7mononum=I 12gtMay 19 1997
Clinical Applications of Biomalerials NIH Consens Statement 1982 Nov 1-3 [cited 1997 August 21] 4(5)1-19 httptextnlmnihgovnihcdcwww34txthtml
46
May 27 1996
Craig and Ebert Pseudomonas aeruginosa Infections amp Treatment p 467-491
Dankert J Hogt AH and J Feijen Biomedical Polymers Bacterial Adhesion Colonization and Infection CRC Critical Reviews in B iocom patibility V 2 p 219-301 1986
Doi K Nakayama Y and T Matsuda Novel compliant and tissue-permeable microporous polyurethane vascular prosthesis fabrication using an excimer laser ablation technique Journal o f Biomedical M aterials Research V 31 p 27 - 33 1996
Eginton PJ et al The influence o f substratum properties on the attachment o f bacterial cells Colloids and Surfaces B B io in terfaces V 5 p 153-159 1995
Farber BF and AG Wolff Salicylic acid prevents the adherence of bacteria and yeast to silastic catheters Journal o f Biomedical Materials Research V 2 7 p 5 9 9 - 6021993
Fan LT and SK Singh Controlled Release a Quantitative Treatments Springer-Verlag New York NY 1989
Francois P et al Physical and biological effects o f a surface coating procedure on polyurethane catheters Biom aterials V 17 p 667 - 678 1996
Golomb G and A Shplgelman Prevention o f bacterial colonization on polyurethane in vitro incorporated antibacterial agent Journal o f Biomedical Materials Research V 25 p 937 - 952 1991
Greenfeld et al Decreased bacterial adherence and biofilm formation on chlorhexidince and silver sulfadiazine-impregnated central venous catheters implanted in swine Critical Care Medicine V 23 p 894 - 900 1995
Gristina AG Biomaterial-Centered Infection Microbial Adhesion Versus Tissue Integration Science V237 p1588-1595 Sept 1987
Gristina AG Implant Failure and the Immuno-Incompentent Fibro-InflammatoryZone
Clinical Orthopaedics And Related Research V298 p106-118 1994
Gristina AG et al Cell biology and molecular mechanisms in artificial device infections The International Journal of Artificial Organs V16 p755- 764 1993
Gristina AG et al The Glycocalyx Biofilm Microbes and Resistant Infection Seminars in Arthroplasty V5 p160-170 October 1994
47
Gristina AG Naylor PT and Q Myrvik The Race for the Surface Microbes Tissue Cells and Biomaterials Molecular M echanisms o f M icrobial Adhesion eds Switalski L Hook M and E Beachey Springer-Verlag New York NY 1989
Gristina AG Passive Local Immunotherapy ldquoPLIrdquo to Prevent Biomaterial and Wound Infection Frank N Nelson Lecture Nov 11 1997
Hanker JS and BL Giammara Biomaterials and Biomedical Devices S cien ce V 242 p885-892 Nov 11 1988
Holt JG et al B ergeyrsquos Manual of Determinative B acterio logy 9th ed Williams amp Wilkins Baltimore MD p 93 - 941994
Hulshoff JEG et al Evaluation of plasma-spray and magnetron-sputter Ca-P- coated implants An in vivo experiment using rabbits Journal o fBiomedical Materials Research V 31 p 329 - 337 1996
Jansen B and W Kohnen Prevention o f biofilm formation by polymer modificationJournal of Industrial Microbiology V 15 p391-396 1995
Kaibara et al Promotion and control o f selective adhesion and proliferation o f endothelial cells on polymer surface by carbon deposition Journals o fBiomedical Material Research V 31 p 429 - 435 1996
Kost J and R Danger Controlled release of bioactive agents Trends in B iotechnology V2 p47-51 1984
Kwok CS et al Design of Infection-resistant Polymers I Fabrication and Formulation in the process of submitting 1997
Kydonieus A ed Treatise on Controlled Drug Delivery Fundam entals Optimization Applications M arcelDekker Inc New York NY 1992
Danger RS and DL Wise eds Medical Applications of Controlled R e lea se Volume I CRC Press Inc Boca Raton PD 1984
Danger RS and DL Wise eds Medical Applications of Controlled R e lea se Volume II Applications and Evaluation CRC Press Inc Boca Raton PD 1984
Danger RS and N A Peppas Present and future application of biomaterials in controlled drug delivery systems Biomaterials V 2 p 244 -246 1981
Lazarus SM et al A Hydrophilic Polymer-Coated Antimicrobial Urethral CatheterJournal of Biomedical Materials Research V 5 p 129 - 138 1971
Lee S-D et al Artificial cornea surface modification o f silicone rubber membrane by graft polymerization o f pHEMA via glow discharge B iom aterials V 17 p
4 8
587 - 5951996
Lindhout T etal Antithrombinactivity o f surface-bound heparin studied underflow conditions Journal of Biom edical Materials Research V 29 p 1255 - 1266 1995
Lohmann D Controlled Release-recent progress in polymeric drug delivery systems M acromol Symp V 100 p25-30 1995
Manual of Industrial M icrobiology and Biotechnology p30 1986
Massia SP and JA Hubbell Human endothelial cell interactions with surface- coupled adhesion peptides on a nonadhesive glass substrate and two polymeric biomaterials Journal of Biom edical Materials R esearch V 25 p 223- 242 1991
Materials Science Materials for medicine Britanica Onlinelthttpwwwebcom 180cgi-bingDocF=macro5004232htmgt [Accessed Nov 20 1997]
Miles AA Misra SS and JO Irwin The Estimation o f the Bactericidal Power o f the Blood Journal of Hygiene V 38 p 732-749 1938
Paulsson M Gouda I Larm O and A Ljungh Adherence o f coagulase-negative staphylococci to heparin and other glycosaminoslycans immobilized on polymer surfaces Journal of Biomedical M aterials Research V 28 p 311 - 317 1994
Portoles M Refojo MF and F-L Leong Poloxamer 407 as a bacterial abhesive for hydrogel contact lenses Journal o f Biomedical M aterials Research V 28 p 303 - 309 1994
Price JS Tencer AF Arm DM and GA Bohach Controlled release o f antibiotics from coated orthopedic implants Journal o f Biom edical Materials Research V 30 p281-286 1996
Robinson JR and VHL Lee Controlled Drug Delivery Fundamentals and Applications 2nd ed Marcel Dekker Inc New York NY 1987
Rushton DN Brindley GS Polkey CE and GV Browning Implant infections and antibiotic-impregnated silicone rubber coating Journal of N eu ro lo g y Neurosurgery and Psychiatry V 52 p 223-229 1989
Ryu GH et al Antithrombogenicity o f lumbrokinase-immobilized polyurethane Journal of Biomedical M aterials Research V 28 p 1069-1077 1994
Schlichting H Boundary-Layer T heory translated by J Kestin 7 ed McGraw- Hill New York NY p 596-615 1979
49
Seyral P Zannier A JN Argenson and D Raoult The r e le a s e in v itro o f v a n c o m y c in a n d to b ra n y c in f r o m a c ry lic b o n e cem en t Journal o fAntimicrobial Chemotherapy V 33 p 337 - 339 1994
Strachan CJL The p r e v e n tio n o f o r th o p a e d ic im p la n t a n d v a sc u la r g ra ft in f e c t io n s Journal o f Hospital Infection V 30 (Supplement) p 54-63 1995
Suljak JP e t a l B a c te r ia l a d h e s io n to d en ta l am algam a n d th re e res in c o m p o s i te s Journal of Dentistry V23 p171-176 1995
Sullam PM Payan DG Dazin PF and FH Valone B in d in g o f V irid a n s G rou p S tr e p to c o c c i to H u m a n P la te le ts a Q u a n tita tiv e A n a ly s is Infection and Immunity V 58 p 3802-3806 Nov 1990
Tebbs SE Sawyer A and TSJ Elliot In flu en ce o f su rfa ce m o rp h o lo g y on in v i t r o b a c te r ia l a d h e re n c e to c e n tra l ven o u s c a th e te r s British Journal o f Anaesthesia V 72 p 587-591 1994
Thomsberry C and JC Sherris Section XI Laboratory Tests in Chemotherapy General Considerations Manual of Clinical Microbiology eds EH Lennette A Balows W J Hausler and HJ Shadomy 4th ed American Society for Microbiology Washington DC p 959 -977
Wang I Anderson JM and RE Marchant P la te le t -m e d ia te d a d h e s io n o f S ta p h y lo c o c c u s e p id e r m id is to h yd ro p h o b ic N H L B I re fe ren ce p o ly e th y le n e Journal o f Biomedical Materials Research V 27 p 1119-1128 1993
Weber W J and F A DiiGiano Process Dynamics in Environmental S ystem s John Wiley amp Sons Inc p 390 - 398 1996
William SK e t al F o rm a tio n o f a m u ltila y e r ce llu la r lin ing on a p o ly u r e th a n e v a s c u la r g r a f t f o l lo w in g en d o th e lia l ce ll s o d d in g Journal of B iom edical M aterials Research V 26 p 103-117 1992
Wolfson JS and DC Hooper eds Quinolone Antimicrobial A gents American Society for Microbiology Washington DC 1989
Yu Jian-Lin et al F ib ro n e c tin on the S urface o f B ilia ry D ra in M a te r ia ls - A R o le in B a c te r ia l A d h e r e n c e Journal of Surgical Research V 59 p 596-600 1995
APPENDICES
51
APPENDIX A
Growth Rate Experiments
52Growth Curves (500 ppm Glucose) Room Temperaturetime count cone (cellsml) average std dev Specific growth rate
0 28 159E+06 711E+06 687E+06 048046690552 295E+06
296 168E+071 40 227E+06 785E+06 408E+06
210 119E+07165 936E+06
2 28 159E+06 204E+06 766E+0525 142E+0655 312E+06
3 281 159E+07 138E+07 156E+06216 123E+07233 132E+07
45 98 556E+07 550E+07 212E+06
101 573E+0792 522E+07
6 177 100E+08 736E+07 206E+0789 505E+07
123 698E+077 290 165E+08 122E+08 318E+07
198 112E+08156 885E+07
8 56 318E+08 210E+08 820E+0721 119E+0834 193E+08
9 114 647E+08 522E+08 779E+0782 465E+0893 528E+0879 448E+08
10 141 800E+08 749E+08 930E+07109 619E+08146 828E+08
11 282 160E+09 115E+09 284E+08206 117E+09172 976E+08150 851 E+08
12 200 113E+09 110E+09 329E+07186 106E+09195 111E+09
13 76 216E+09 277E+09 107E+0975 213E+09
163 462E+0976 216E+09
14 127 360E+09 340E+09 356E+08102 289E+09130 369E+09
53
15 273 775E+09 817E+09 318E+08300 851 E+09291 826E+09
16 287 163E+10 155E+10 765E+08278 158E+10255 145E+10
17 295 167E+10 145E+10 191 E+09213 121E+10260 148E+10
18 313 178E+10 163E+10 120E+09- --------
261 148E+10 - -------- -------286 162E+10
54
time count Cone (cellsml) average std dev Specific growth rateO 20 113E+06 271 E+06 191 E+06 050174225
109 619E+0657 323E+0617 965E+0536 204E+06
123 121 687E+06 746E+06 767E+05
117 664E+06137 777E+06151 857E+06
456 160 908E+06 128E+07 351 E+06
309 175E+07210 119E+07
7 35 199E+0728 159E+0738 216E+07
89 78 443E+08 485E+08 268E+07
87 494E+0891 516E+0886 488E+08
101112 69 392E+08 400E+08 147E+07
73 414E+0867 380E+0873 414E+08
13 107 607E+08 649E+08 549E+07128 726E+08 --108 613E+08
14 64 182E+09 131E+09 292E+0840 113E+0939 111E+0942 119E+09
15 64 182E+09 182E+09 401 E+0766 187E+0964 182E+0962 176E+09
1617 121 343E+09 362E+09 142E+08
129 366E+09133 377E+09
18 364 207E+10 227E+10 146E+091
55411 233E+10424 241 E+10
19 375 213E+10 217E+10 350E+08390 221 E+10384 218E+10
20 98 556E+10 680E+10 179E+1080 454E+10
155 880E+10146 828E+10
56
time count Cone (cellsml) average std dev Specific growth rateO 23 522E+06 639E+06 114E+06 0443703052
27 613E+0637 840E+0630 681 E+0622 499E+0630 681 E+06
11 119 135E+10 119E+10 165E+09119 135E+1090 102E+1090 102E+10
12 45 102E+10 934E+09 231E+0926 590E+0932 726E+0938 863E+0954 123E+1052 118E+10
13 49 111E+10 126E+10 131E+0948 109E+1059 134E+1061 138E+1054 123E+1063 143E+10
14 135 306E+10 302E+10 250E+09128 291 E+10150 340E+10120 272E+10
15 167 379E+10 368E+10 166E+09168 381 E+10152 345E+10 J Z
16 239 542E+10 495E+10 619E+09201 456E+10250 567E+10183 415E+10
17 57 647E+10 726E+10 960E+0977 874E+1056 636E+1066 749E+10
18 86 976E+10 102E+11 804E+0982 931 E+10
101 115E+11 -90 102E+11
19 121 137E+11 121 E+11 182E+10124 141 E+11
57
92 104E+1189 101E+11
20 89 101E+11 107E+11 830E+0996 109E+11
105 119E+1186 976E+10
21 101 115E+11 124E+11 104E+10122 138E+11114 129E+11100 113E+11
22 67 760E+10 111E+11 216E+10115 131E+1197 110E+11
112 127E+11
58
time count Cone (cellsmi) average std dev Specific growth rate averageO 25 142E+06 127E+06 434E+05 0443600055 0467378
22 125E+0632 182E+06 std dev
9 511E+05 00248917 965E+0529 165E+06
12 62 281 E+07 421 E+07 779E+0693 422E+0786 390E+07
116 527E+07108 490E+0791 413E+07
14 33 150E+08 156E+08 339E+0737 168E+0826 118E+0833 150E+0828 127E+0849 222E+08
155 39 177E+08 239E+08 810E+0731 141E+0888 399E+0854 245E+0851 232E+0853 241 E+08
175 61 277E+08 261 E+08 657E+0745 204E+0851 232E+0849 222E+08 - - Z
88 399E+0851 232E+08
225 136 309E+10 274E+10 247E+09114 259E+10112 254E+10
59
APPENDIX B
FASTEETHreg SUSCEPTIBILITY
6 0
time 01g260E+04
005280E+04 240E+04
Glucose Abs0008
640E+04 140E+05 170E+04 0016370E+05 770E+05 220E+04 0033
125 198E+06 310E+06 220E+05 0071145 890E+06 194E+06 330E+05 0146245 160E+08 200E+08 160E+07 0266
110E+08 180E+08 160E+07 100 0405275 170E+08 170E+08 190E+07 200 0408
time 0 05g 0025g217E+04 330E+04 110E+05
Fasteeth MIC Study I518E+05 760E+05 230E+05
125 194E+06 185E+06 410E+05314E+06 147E+06 816E+05
165 660E+06 100E+07 178E+06195 192E+07 880E+06 242E+06225 430E+07 140E+07 180E+07255 119E+09 292E+07 130E+07
time 157E-02
200E+08
150E+08
I 100E+08U
500E+07
000E+00
7 X
V
I I
01g
005
C ~
233E+04 133E+0510 15 20 25 30time (hours)
194E+06 566E+06880E+06 746E+06226E+07 120E+07125E+08 120E+08133E+08 703E+08
time Control 450E-02121E+05 152E+05140E+05 264E+06197E+06 246E+06
185 362E+06 919E+06457E+06 211E+07461E+07 234E+08
IhU 200E+07
100E+07
000E+00
250E+08
200E+08
150E+08
1 00E+08
500E+07
OOOE+OO
I
I
Z1
Control
450E-02
500E+07
400E+07
300E+07
F a s te e th MIC Il
I
y -
Jlt3
0 05g
0025g
C
10 15 20 25timefhrs)
Fasteeth MIC III
157E-02
C
time (hrs)
APP ENDlX C
Hoechst 33342
me control s1 S2 S3O 162E+05 149E+05 118E+05 139E+05
195 477E+06 443E+07 317E+07 883E+04OOOE+OO
O 134E+04 159E+04 280E+04 194E+0414 210E+06 520E+05 380E+05 945E+0416 228E+06 313E+06 604E+06 294E+0519 763E+06 980E+06 169E+07 207E+0523 263E+07 133E+08 883E+07 967E+04
5ugml10ugmlSOugml
Hoechst 33342 MIC no wash
-control
-5ugml
-10ugml -50ugml
time (hrs)
time control s1 S2 S3O 162E+05 149E+05 118E+05 139E+05
195 477E+06 443E+07 317E+07 883E+04OOOE+OO
O 134E+04 159E+04 280E+04 194E+0414 210E+06 520E+05 380E+05 945E+0416 228E+06 313E+06 604E+06 294E+0519 763E+06 980E+06 169E+07 207E+0523 263E+07 133E+08 883E+07 967E+04
5ugmllOugml50ugml
Hoechst 33342 MIC no wash
control -5ugml bull10ugml 50ugml
time control A B3 129E+05 129E+05 139E+05
15 104E+06 100E+05 169E+0616 645E+06 227E+05 122E+062022
423E+06 113E+05 254E+06106E+07 160E+06 158E+07
24 707E+07 109E+07 175E+07
Hoescht MIC - incubate in stain for 3 hrs then wash
800E+07700E+07600E+07500E+07400E+07300E+07200E+07100E+07OOOE+OO
MIC w wash
DLO
800E+07
600E+07
400E+07
200E+07
000E+00
- controlbullA
-B
O 10 20 30
time(hrs)
200E+07180E+07160E+07140E+07120E+07100E+07800E+06600E+06400E+06200E+06000E+00
65
APPENDIX D
C iprofloxacin
66
Ciprofloxacin MIC study Plate countstime count (1ugml) cfuml average std dev count (1 ugml) cfuml
0 96 960E+04 962E+04 530E+03 21 210E+0496 960E+04 28 280E+04
105 105E+05 22 220E+0410 100E+059 900E+049 900E+04
155 67 670E+04 865E+04 266E+04 3 300E+0385 850E+04 2 200E+0377 770E+04 2 200E+03
5 500E+0411 110E+0513 130E+05
17 76 760E+04 687E+04 220E+04 20 200E+0465 650E+04 27 270E+0441 410E+04 20 200E+0411 110E+055 500E+047 700E+04
20 31 310E+04 230E+04 128E+04 13 130E+0433 330E+04 0 000E+00
5 500E+03 0 000E+0022 0 ND 0
0 00 0
24 0 ND 00 00 0
time 1 ugml std dev 01 ugml std dev control std dev0 720E+04 345E+04 566E+04 263E+04 593E+04 170E+03
155 584E+04 452E+04 510E+06 168E+06 903E+06 419E+0517 532E+04 283E+04 380E+06 221E+06 153E+07 963E+0520 137E+04 137E+04 670E+06 381 E+06 963E+07 741 E+0622 0 0 254E+07 587E+06 377E+07 450E+0624 0 0 920E+06 440E+06 377E+07 450E+06
67
average std dev count (01 ugml) cfuml average std dev count (01 ugml)237E+04 309E+03 75 750E+04 783E+04 340E+03 20
83 830E+04 2077 770E+04 14
8 800E+048 800E+046 600E+04
233E+03 471 E+02 66 660E+06 3677 770E+06 3056 560E+06 41
223E+04 330E+03 56 560E+06 587E+06 602E+05 15153 530E+06 17167 670E+06 155
17 13
14433E+03 613E+03 TNTC 119
TNTC 53TNTC 29
215 215E+07 232E+07 362E+06 253189 189E+07 256247 247E+07 235
19 190E+07 2127 270E+07 2828 280E+07 42
Bad plate 60Bad plate 110Bad plate 17
5- - 7
68
cfum average std dev count (control) cfuml average std dev200E+04 180E+04 283E+03 61 610E+04 593E+04 170E+03200E+04 60 600E+04140E+04 57 570E+04
360E+06 357E+06 450E+05 96 960E+06 903E+06 419E+05300E+06 89 890E+06410E+06 86 860E+06
151E+06 153E+06 148E+05 166 166E+07 153E+07 963E+05171E+06 150 150E+07155E+06 143 143E+07170E+06130E+06140E+06119E+07 670E+06 381 E+06 86 860E+07 670E+07 300E+07530E+06 103 103E+08290E+06 100 100E+08253E+07 276E+07 680E+06 34 340E+07 X256E+07 35 350E+07235E+07 44 440E+07210E+07280E+07420E+07600E+06 920E+06 440E+06 34 340E+07 377E+07 450E+06110E+07 35 350E+07170E+07 44 440E+07500E+06700E+06
I
I
69
APPENDIX F
Flow Cell Experiments Image Analysis
70
IMAGE ANALYSIS
Images of the polymers were taken using a CCD camera They were then analyzed
using Image Pro Plus The analysis of each image was automatically saved as an Excel
file generating 48 Excel sheets per experiment Since a hard copy of this information
would be too bulking to include in the Appendices a disk with all of the data will be kept
with a copy of this thesis at the Chemical Engineering Department and at the Center for
Biofilm Engineering
The spreadsheet are labeled with the time at which the image was taken die field of
view (eg A b c etc) parameters measured (eg Area ave dia width length) For
every field of view taken two spreadsheets were generated One consisted of the
parameters measured and the other gave the dimensions of the field of view (length x
width)
At the beginning of each experiment an image of a micrometer was taken in order to
calibrate all of the measurements for the experiment Cell numbers were calculated by
summing the area values of one field of view and dividing by 075 for a high end value or
50 for a low end value These values were than averaged to get the average values and
standard deviations The above values were obtained from B ergey rsquos Manual o f
Determinative Microbiology which gave the width of P aeruginosa at 05-1Ojim and
the length as 15-50pm This method for calculating cell numbers was found to be
accurate as actual cell numbers could be counted for the early time points They fell within
the range calculated by the above method
The files are listed as
Control
Triglyme
71
Ciprotriglyme
BMA
CiproBMA
The graphs found in the thesis text were made from the above files and then
converted into data which was easier to handle The files from which the graphs were
made are
Endpoint
Curves
APPENDIX F
Flow Cell Experiments Total CountsAO
cell
con
e(o
ellm
iEffluent counts over a 24
hour time period - Comparison
150E+09
000E+00
mdash- Control
Triglyme bull Ciprotriglyme
- BMA -bull- ciproBMA
CU
den
sity
(ce
lls
mm
A2)
100E+07
100E+06
100E+05
100E+04
100E+03
100E+02
100E+01
H ControlHTrigIyme^CiprotriglymeHBMAHciproBMA
Polymers100E+00
cell
con
e (
cell
sm
l)Effluent data t=0-8 Total counts
140E+09
120E+09
100E+09
800E+08
600E+08
400E+08
200E+08
000E+00
mdash Control Triglyme
-Ciprotriglyme - x~ BMA -^c ip roB M A
time (hrs)
76Control AO countstime (in) cell count cellsml average std Dev
0 100 454E+08 491 E+08 134E+0874 336E+08
110 499E+08101 458E+08172 781 E+0882 372E+08
125 567E+08165 749E+08132 599E+08108 490E+0860 272E+08
113 513E+0897 440E+0893 422E+0890 409E+08
2 107 486E+08 730E+08 152E+08167 758E+08154 699E+08111 504E+08167 758E+08196 890E+08204 926E+08
180 817E+084 113 513E+08 678E+08 171E+08
108 490E+08172 781 E+08
82 372E+08125 567E+08132 599E+08165 749E+08167 758E+08204 926E+08180 817E+08196 890E+08
6 0 0 0 00000
77
area (mmA2)72578 714E+02 441 E+016550376102
Polymercount cone
33 150E+08 201 E+08 660E+0750 227E+0841 186E+0847 213E+08
455 103E+08430 976E+07450 102E+08
62 281 E+0854 245E+0859 268E+0848 218E+0865 295E+0851 232E+08
density845E+06 277E+06
78
time (out) cell count cellsml average std Dev time (out) average std Dev0 65 295E+08 373E+08 780E+07 0 373E+08 780E+07
74 336E+08 2 303E+08 123E+08111 504E+08 4 209E+08 800E+0777 350E+08 6 262E+08 698E+07
109 495E+08 8 162E+08 088 399E+08 16 159E+07 116E+0653 241 E+08 18 232E+07 089 404E+08 20 304E+07 901E+0673 331 E+08 21 407E+07 082 372E+08 24 714E+07 213E+07
2 101 458E+08 303E+08 123E+08103 468E+08 Control101 458E+0830 136 E+08 0 491 E+08 134E+0835 159E+08 2 730E+08 152E+0844 200E+08 4 678E+08 171 E+0860 272E+08 6 0 068 309E+08 8 0 058 263E+08 16 0 0
4 30 136E+08 209E+08 800E+07 18 0 035 159E+08 20 0 028 127E+08 21 0 044 200E+08 24 0 019 863E+0744 200E+0869 313E+0872 327E+08 time in-out66 300E+08 0 000E+0054 245E+08 2 000E+00
6 39 177E+08 262E+08 698E+07 4 -262E+0860 272E+08 6 226E+0856 254E+08 8 162E+0867 304E+08 16 159E+0738 173E+08 18 232E+07
46 209E+08 20 304E+0744 200E+08 21 407E+0772 327E+08 24 714E+0788 399E+0867 304E+08
16 62 141E+07 159E+07 116E+0669 157E+0766 150E+0776 173E+0769 157E+0770 159E+0773 166E+07
79
ff l 184E+0768 154E+0767 152E+07
20 161 365E+07 304E+07 901 E+06158 359E+07196 445E+0798 222E+0791 207E+07
100 227E+0724 206 468E+07 714E+07 213E+07
121 275E+07219 497E+07217 493E+07360 817E+07270 613E+07420 953E+07280 636E+07430 976E+07390 885E+07320 726E+07360 817E+07430 976E+07380 863E+07
80
Triglyme AO countstime (in) count cellsml average std Dev
0 77 350E+08 517E+08 224E+0883 377E+0878 354E+0867 304E+0888 399E+08
115 522E+0896 436E+0888 399E+0883 377E+08
195 885E+08208 944E+08188 853E+08
2 99 449E+08 765E+08 251 E+08120 545E+08102 463E+08130 590E+08138 626E+08136 617E+08133 604E+08232 105E+09265 120E+09260 118E+09197 894E+08190 863E+08190 863E+08
4 238 108E+09 708E+08 307E+08225 102E+09215 976E+08100 454E+0864 291 E+0899 449E+08
124 563E+0898 445E+08
194 881 E+08188 853E+08151 685E+08176 799E+08
6 0 0 0 00 00 00 00 00 00 0
81
Polymercount cone
35 794E+07 353E+07 341 E+0741 931 E+0737 840E+0734 772E+0736 817E+0744 200E+0734 154E+0725 113E+0729 132E+0732 145E+0712 545E+0627 123E+0719 863E+0615 681 E+0614 636E+06
density117E+06 113E+06
area94558 907E+02 544E+019458883024
82
time (out) average std Dev time in-out0 676E+08 970E+07 0 500E+082 463E+08 118E+08 2 302E+084 477E+08 294E+08 4 231 E+086 550E+08 262E+08 6 550E+088 349E+07 302E+07 8 349E+07
16 284E+07 0 16 284E+0718 268E+07 238E+07 18 268E+0720 241 E+07 0 20 241 E+0721 228E+07 116E+07 21 228E+0724 223E+07 196E+07 24 223E+07
triglyme
time (in)0 517E+08 224E+082 765E+08 251 E+084 708E+08 307E+086 0 08 0 0
16 0 018 0 020 0 021 0 024 0 0
83
time (out) count cellsml average std Dev0 130 590E+08 678E+08 970E+07
136 617E+08157 713E+08150 681 E+08123 558E+08148 672E+08128 581 E+08140 636E+08172 781 E+08152 690E+08205 931 E+08152 690E+08
2 150 681 E+08 463E+08 118E+0867 304E+08
101 458E+08100 454E+0863 286E+0896 436E+0899 449E+08
100 454E+08110 499E+0871 322E+08
130 590E+08136 617E+08157 713E+08150 681 E+08
4 28 127E+08 477E+08 294E+0818 817E+0738 173E+0823 104E+0826 11ampE+08
127 577E+08134 608E+08115 522E+08128 581 E+08150 681 E+08120 545E+08205 931 E+08145 658E+08215 976E+08
6 47 213E+08 550E+08 262E+0849 222E+0849 222E+0859 268E+0858 263E+08
164 744E+08
84
219 994E+08180 817E+08175 794E+08191 867E+08127 577E+08134 608E+08115 522E+08128 581 E+08
8 16 726E+07 349E+07 302E+0710 454E+0718 817E+0720 908E+0716 726E+072 908E+064 182E+074 182E+075 227E+074 182E+07
18 9 204E+07 268E+07 238E+071 227E+067 159E+070 000E+000 000E+00
99 449E+07142 645E+07128 581 E+07108 490E+07165 749E+0727 123E+0730 136E+0733 150E+0737 168E+0730 136E+07
21 8 182E+07 228E+07 116E+0720 454E+0710 227E+0712 272E+0719 431E+0727 123E+0730 136E+0733 150E+0737 168E+0730 136E+07
24 25 113E+07 223E+07 196E+0711 499E+0622 999E+0623 104E+0716 726E+06
85
19 863E+0626 118E+0723 104E+0725 113E+0718 817E+0614 318E+0722 499E+0727 613E+0716 363E+0727 613E+07
Cel
l con
e (
cells
ml)
Acridine Orange effluent counts t= 8-24hours
180E+08 160E+08 140E+08 120E+08 100E+08 800E+07 600E+07 400E+07 200E+07 000E+00
8 12 16 20 24
mdash diamsmdash Control
- Ciprotriglyme - -x- -B MA - X - ciproBMA
time (hours)
87
Ciprotriglyme AO countstime (in) count cellsml average std Dev
0 110 499E+08 932E+08 329E+08106 481 E+08115 522E+08144 654E+08141 640E+08157 143E+09113 103E+09119 108E+09103 935E+08105 953E+08147 133E+09136 123E+09 bull146 133E+09
2 115 104E+09 985E+08 202E+08105 953E+08102 926E+0898 890E+08
129 117E+09132 120E+09140 127E+09121 110E+09128 116E+09150 681 E+08184 835E+08131 595E+08
4 213 967E+08 954E+08 481 E+08242 110E+09
13 590E+07251 114E+09132 599E+08168 153E+09
13 118E+0844 399E+08
154 140E+09190 173E+09115 104E+09132 120E+09132 120E+0998 890E+08
6 0 0
88
Polymercount cone
84 953E+06 701 E+06 441 E+0650 567E+0655 624E+0642 477E+0667 760E+06
140 159E+0799 112E+0796 109E+0797 110E+07
107 121E+079 204E+068 182E+06
10 227E+0610 227E+068 182E+06
area94352 941E+02 276E+019064997397
density 223E+05 141 E+05
89
time (out) average std Dev0 754E+08 210E+082 919E+08 207E+084 942E+08 388E+086 292E+08 273E+088 128E+07 216E+06
16 705E+06 bull 018 561 E+06 406E+0620 947E+06 021 114E+07 573E+0624 184E+07 774E+06
Ciprotriglyme
time (in)0 932E+08 329E+082 985E+08 202E+084 954E+08 481 E+086 0 08 0 0
16 0 018 0 020 0 021 0 024 0 0
90
time (out) count cellsml average std Dev0 120 545E+08 754E+08 210E+08
130 590E+08153 695E+08156 708E+0852 472E+0851 463E+0889 808E+08
118 107E+0981 735E+08
111 101E+0996 872E+08
119 108E+092 92 835E+08 919E+08 207E+08
78 708E+0869 626E+0883 754E+0890 817E+08
103 935E+08135 123E+09143 130E+09134 122E+09117 106E+09191 867E+08167 758E+08Ig 844E+08
4 186 844E+08 942E+08 388E+08241 109E+09289 131E+09243 110E+09159 144E+09177 161E+0931 281 E+0820 182E+08
102 926E+08103 935E+0880 726E+0899 899E+0899 899E+08
6 92 835E+08 292E+08 273E+0865 590E+0882 744E+0865 590E+0854 490E+08
21 191 E+0826 236E+0817 154E+08
91
25 227E+0820 182E+08
133 302E+07113 256E+0793 211E+07
114 259E+07134 304E+07
8 68 154E+07 128E+07 216E+0652 118E+0744 999E+0675 170E+0748 109E+0757 129E+0766 150E+0750 113E+0752 118E+0751 116E+07
18 44 999E+06 561 E+06 406E+0657 129E+0734 772E+0637 840E+0635 794E+06
8 182E+066 136E+065 113E+068 182E+06
13 295E+0621 71 161E+07 114E+07 573E+06
94 213E+0779 179E+0777 175E+0729 658E+0631 704E+0628 636E+0625 567E+0630 681 E+0661 138E+0761 138E+0752 118E+0764 145E+07
3 681E+0524 35 794E+06 184E+07 774E+06
45 102E+0756 127E+0738 863E+06
53 120E+07182 207E+07205 233E+07
92
235 267E+07240 272E+07220 250E+0771 806E+06
200 227E+07195 221E+07265 301 E+07
93BMA total counts Acric ine Orange BMAtime(in) count cone (cellsml) average std dev time (in) ave std dev
0 134 122E+09 826E+08 249E+08 0 826E+08 249E+08146 133E+09 2 610E+08 276E+08130 118E+09 4 731 E+08 382E+0869 626E+08 6 0 069 626E+0891 826E+0872 654E+08 time (out)66 599E+08 0 853E+08 155E+0872 654E+08 2 612E+08 177E+0883 754E+08 4 456E+08 282E+0878 708E+08 6 288E+08 208E+0882 744E+08 8 137E+07 934E+06
2 12 109E+08 610E+08 276E+08 16 445E+07 049 445E+08 18 523E+07 175E+0738 345E+08 20 720E+07 062 563E+08 21 818E+07 379E+0760 545E+08 24 853E+07 340E+07
115 104E+09109 990E+08122 111E+0964 581 E+0876 690E+0849 445E+0852 472E+0866 599E+08
4 73 663E+08 731 E+08 382E+0881 735E+0898 890E+0870 636E+0873 663E+08
131 119E+09115 104E+09141 128E+09147 133E+0929 263E+0829 263E+0838 345E+0821 191E+08
6 00000000
94
0
Polymercount cone
125 567E+07 895E+07 418E+07140 636E+07100 454E+07115 522E+07137 622E+07139 631 E+07150 681 E+07270 123E+08380 173E+08360 163E+08 density250 113E+08 298E+06 139E+06200 908E+07
area87061 901 E+02 21217235669140691703
95
time(out) count cone (cellsml) average std devC 82 754E+0E 853E+08 155E+08
7E 708E+0E86 781 E+0893 844E+0881 735E+0882 744E+0877 699E+0892 835E+08
121 110E+09116 105E+09125 113E+09
2 92 835E+08 612E+08 177E+0876 690E+08
109 990E+0892 835E+0860 545E+0855 499E+0863 572E+0872 654E+0847 427E+0843 390E+0844 399E+0867 608E+0856 508E+08
4 47 427E+08 456E+08 282E+0852 472E+0859 536E+0860 545E+0836 327E+0897 881 E+0830 272E+0850 454E+08
115 104E+09104 944E+08
19 173E+0814 127E+0828 254E+0822 200E+0821 191 E+08
6 16 145E+08 288E+08 201 E+0815 136E+0813 118E+0821 191 E+0816 145E+0855 499E+0840 363E+0845 409E+08
96
85 772E+0873 663E+0820 182E+0820 182E+0820 182E+0820 182E+0817 154E+08
8 6 136E+07 137E+07 934E+060 000E+005 113E+074 908E+061 227E+06
27 245E+0728 254E+0726 236E+07
18 77 699E+07 523E+07 175E+0773 663E+0783 754E+0773 663E+0772 654E+0768 617E+0717 386E+0719 431 E+0715 340E+0712 272E+0712 272E+07
21 310 704E+07 818E+07 379E+07300 681 E+07140 318E+07230 522E+07210 477E+07285 129E+08290 132E+08340 154E+08 - -
250 113E+08123 558E+07136 617E+07144 654E+07
24 107 486E+07 853E+07 340E+07108 490E+07112 508E+07270 123E+08250 113E+08320 145E+08260 118E+08148 672E+07153 695E+07150 681 E+07
97
ciproBMA AO counts
time (in) count cone average std dev0 74 672E+08 673E+08 19E+08
100 908E+0880 726E+08
112 102E+0956 508E+0869 626E+08
108 981 E+0871 645E+0886 781 E+0876 69E+0838 345E+0852 472E+0856 508E+0860 545E+08
2 44 399E+08 897E+08 61 E+0851 463E+0825 227E+0832 291 E+0841 372E+08
103 935E+0893 844E+0899 899E+08
219 199E+09192 174E+09188 171E+09
4 92 835E+08 726E+08 178E+0878 708E+08
102 926E+0897 881 E+08
102 926E+0884 763E+0886 781 E+0879 717E+08
106 962E+0856 508E+0848 436E+0854 49E+0856 508E+08
_
i
98
Polymercount cone
139 316E+07 541 E+07 463E+07114 259E+07125 284E+07134 304E+07280 127E+08290 132E+08250 113E+08
79 179E+0773 166E+0779 179E+07
area88181 870E+02 125E+018760685282
density187E+06 160E+06
99
time (in) ave std devO 673E+08 190E+082 897E+08 610E+084 726E+08 128E+086 0 0
time (out)0 700E+08 146E+082 652E+08 311E+084 524E+08 227E+086 350E+08 127E+088 545E+06 286E+06
16 101E+07 018 113E+07 430E+0620 281 E+07 0
21 365E+07 201 E+0724 682E+07 510E+07
100
time (out) count cone average std dev0 71 645E+08 7E+08 146E+08
71 645E+0876 69E+0899 899E+08
103 935E+0884 763E+0891 826E+0865 59E+0860 545E+0851 463E+08
2 30 272E+08 652E+08 311 E+0842 381 E+0824 218E+0831 281 E+0823 209E+08
130 118E+0966 599E+0866 599E+0890 817E+0897 881 E+0867 608E+0888 799E+08
113 103E+09104 944E+08107 971 E+08
4 83 754E+08 524E+08 227E+0872 654E+0884 763E+0890 817E+0866 599E+0857 518E+0889 808E+0867 608E+0830 272E+0820 182E+0834 309E+0828 254E+08
mdash30 272E+08
6 39 354E+08 35E+08 123E+0846 418E+0854 49E+0859 536E+0852 472E+0818 163E+08
101
30 272E+0825 227E+0835 318E+0848 436E+0852 472E+0840 363E+0828 254E+0814 127E+08
8 17 386E+06 545E+06 286E+0611 250E+0612 272E+0623 104E+07
9 409E+0616 726E+0620 908E+06
8 363E+0618 35 159E+07 113E+07 430E+06
37 168E+0736 163E+0734 772E+0627 613E+0639 885E+0654 123E+0728 636E+06
21 300 681 E+07 365E+07 201 E+07275 624E+07300 681 E+07255 579E+07275 624E+07
85 193E+0767 152E+0779 179E+0770 159E+0793 211 E+0770 318E+0761 277E+0750 227E+0748 218E+0778 354E+07
24 42 191 E+07 682E+07 510E+0757 259E+0770 318E+0767 304E+0749 222E+07
270 123E+08305 138E+08385 175E+08270 123E+08
102
74 336E+07124 563E+0775 340E+07
165 749E+07
103
APPENDIX G
Flow Cell Experiments Viable CountsPlate Counts
104
Plate counts were conducted by placing ten 10 microliter drops of properly diluted
effluent and influent on plate count agar plates and incubating overnight at room
temperature before counting Several serial dilutions were made for each sample to ensure
that countable plates 3 to 300 colonies were obtained Only viable cells would develop
into colonies on the plates therefore the counts performed in this manner are classified as
viable counts or plate counts
105
Control Plate counttime (in) count cone (cellsml) average std dev
0 159 159E+07 936E+06 628E+06193 193E+07188 188E+0768 680E+0664 640E+0658 580E+0632 320E+0648 480E+0632 320E+06
2 298 298E+07 374E+07 852E+06289 289E+07329 329E+07
54 540E+0739 390E+0740 400E+07
4 79 790E+06 330E+07 328E+07111 111E+0798 980E+0692 920E+0786 860E+0723 230E+0721 210E+0713 130E+07
6 0
time (in) ave cone std dev time (out) ave cone std dev0 936E+06 628E+06 0 249E+06 222E+062 374E+07 852E+06 2 993E+06 293E+064 330E+07 328E+07 4 208E+07 922E+066 0 0 6 111E+07 0
8 147E+07 016 113E+05 235E+0418 281E+05 020 449E+05 417E+0521 371 E+05 024 138E+05 109E+05
Polymer | 130E+06
106
area average std dev72578 7139433333 44072296550376102
density537E+04 548E+04 3474333595E+04512E+04
107
time(out) count cone (cellsml) average std dev0 49 490E+06 249E+06 222E+06
50 500E+0667 670E+06
7 700E+056 600E+05
9 900E+0517 170E+068 800E+05
11 110E+062 125 125E+07 993E+06 293E+06
122 122E+07119 119E+07
9 900E+0610 100E+074 400E+06
4 30 300E+07 208E+07 922E+0633 330E+0731 310E+07
104 104E+0794 940E+06
106 106E+0721 210E+0721 210E+0713 130E+07
6 no data
16 71 710E+04 113E+05 235E+04105 105E+05120 120E+05
15 150E+0511 110E+0512 120E+05
20 24 240E+04 449E+05 417E+0526 260E+0453 530E+0477 770E+0589 890E+0593 930E+05
24 17 170E+05 138E+05 109E+0526 260E+05
I 29 290E+05
108
26 260E+0459 590E+0420 200E+04
Polymer 10 100E+06 130E+06 551 E+0513 130E+0613 130E+0658 580E+0556 560E+05
119 119E+06 -
171 171E+06161 161 E+06244 244E+06
109
triglyme Plate countstime (in) count cone (cellsml) average std dev
0 167 167E+08 108E+08 700E+07184 184E+08182 182E+0831 310E+0737 370E+0747 470E+07
2 86 bull 860E+07 522E+07 334E+0778 780E+0774 740E+07
120 120E+07112 112E+07
4 159 159E+08 562E+07 489E+07116 116E+08145 145E+07244 244E+07224 224E+07
42 420E+0732 320E+0739 390E+07
6 000
time (in) ave cone std dev0 108E+08 700E+072 522E+07 334E+074 562E+07 489E+076 0 0
lt Z
Polymer density782E+06 441 E+06 248E+05
248E+05area Average 283E+05
94558 90723333339458883024
time (out) average std dev
no
O 882E+07 714E+072 336E+07 125E+074 821E+07 139E+076 214E+07 439E+078 223E+06 125E+05
16 326E+06 018 352E+06 246E+0620 773E+06 021 984E+06 105E+0724 299E+06 101 E+06
Polymer 50 500E+06 782E+0661 610E+0662 620E+06
108 108E+0747 470E+0615 150E+0716 160E+0713 130E+07
331 331 E+06281 281 E+06301 301 E+06
97 970E+0660 600E+06
I l l
time (out) count cone (cellsml) average std dev0 167 167E+08 882E+07 714E+07
136 136E+08173 173E+08176 176E+07186 186E+07168 168E+07
2 51 510E+07 336E+07 125E+0747 470E+0746 460E+0740 400E+0752 520E+0734 340E+07
177 177E+07188 188E+07213 213E+07
24 240E+0725 250E+0726 260E+07
4 77 770E+07 821 E+07 139E+0797 970E+07
104 104E+0860 600E+0767 670E+0791 910E+0778 780E+0783 830E+07
6 48 480E+06 214E+07 439E+07-34 340E+06 r
35 350E+0630 300E+06
ave 28 280E+06260E+05 34 340E+06
stddev 129 129E+081626657 8 22 220E+06 223E+06 125E+05
24 240E+0621 210E+06
18 153 153E+06 352E+06 246E+06225 225E+06198 198E+06
112
22 220E+0615 150E+0616 160E+0662 620E+0660 600E+0684 840E+06
21 179 179 E+06 984E+06 105E+07275 275E+06247 247E+0622 220E+07
3 300E+0627 270E+07
441 E+06 24 254 254E+06 299E+06 101 E+06240 240E+06264 264E+06
30 300E+0637 370E+0658 580E+0620 200E+0631 310E+0616 160E+06
279 279E+06338 338E+06297 297E+06
113
ciprotriglyme Plate countstime (in) count cone (cfuml) average std dev time (out)
0 15 150E+08 654E+08 307E+08 013 130E+0843 430E+0889 890E+0887 870E+0882 820E+0884 840E+0884 840E+0892 920E+08
2 96 960E+08 103E+09 48E+0881 810E+08
116 116E+09164 164E+09169 169E+09 2184 184E+0954 540E+0897 970E+08
128 128E+093 300E+085 500E+087 700E+08
4 55 550E+08 918E+08 363E+0831 310E+0890 900E+0814 140E+0910 100E+09 44 400E+08
90 900E+0899 990E+08
115 115E+09100 100E+0980 800E+08
162 162E+096 0 0
6
time (Out) average std dev0 506E+06 553E+062 121E+09 944E+084 192E+08 166E+086 121E+08 112E+08 I8 140E+06 116E+06
16 900E+05 0 I18 774E+05 980E+05 I
20 120E+06 0 |21 141E+06 110E+06 i
114
24 1642+06 1902+06 8
density773698491 7761707346 2284489805303975749509738
18area
94352 9412+02 2762+019064997397
21
Polymercount cone (cfuml) average std dev
23 2302+03 2432+03 9982+0236 3602+0330 3002+03
2 2002+034 4002+033 3002+032 2002+031 1002+031 1002+03
24
115
count cone (cfuml) average std dev23 2302+04 5062+06 5532+0621 2102+0420 2002+04
114 1142+07103 1032+07120 1202+07
10 1002+0713 1302+079 9002+060 0002+000 0002+000 0002+000 0002+00
87 8702+08 1212+09 9442+0892 9202+08
190 1902+09102 1022+0975 7502+0896 9602+0872 7202+0891 9102+08
167 1672+096 6002+082 2002+08
40 4002+0957 5702+08 1922+08 1662+0825 2502+0836 3602+08
128 1282+0893 9302+07
168 1682+0856 5602+0748 4802+0755 5502+0748 4802+07 1212+08 1132+0851 5102+0790 9002+07
149 1492+08180 1802+08162 1622+08261 260E+0812 i 1202+0839 3902+0870 7002+0539 3902+0565 6502+05
116
3 300E+05 140E+06 116E+0615 150E+0645 450E+0689 890E+05
127 127E+06127 127E+0610 100E+0614 140E+065 500E+058 800E+05 774E+05 918E+05
19 190E+0629 290E+06
199 199E+05225 225E+05213 213E+0523 230E+0525 250E+0525 250E+0536 360E+05 141 E+06 110E+0692 920E+0594 940E+0553 530E+0582 820E+0567 670E+05
8 800E+058 800E+05
10 100E+06169 169E+06142 142E+0624 240E+0645 450E+0629 290E+0625 250E+04 164E+06 190E+0629 290E+0452 520E+046 600E+048 800E+041 100E+04
139 139E+0610 100E+0638 380E+0662 620E+0632 320E+0621 210E+0634 340E+06
117
BMA Plate counts
time (in) count cone (cfuml) average std devO 53 530E+07 974E+07 377E+07
59 590E+0759 590E+0784 840E+07
123 123E+08139 - 139E+08
9 900E+0717 170E+0810 100E+08
2 23 230E+07 357E+07 441 E+0723 230E+0720 200E+07
165 165E+0838 380E+0673 730E+06
231 231 E+0724 240E+0739 390E+0729 290E+07
4 17 170E+07 171 E+07 575E+0619 190E+0711 110E+07
220 220E+07213 213E+07228 228E+07
21 210E+0716 160E+0726 260E+07
6 600E+0612 120E+0711 110E+07
6 0 0
118
time(out) average std dev0 499E+07 154E+072 413E+07 179E+074 577E+07 526E+076 129E+07 496E+068 149E+06 912E+05
16 428E+06 018 498E+06 414E+0620 635E+06 021 704E+06 394E+0624 106E+07 225E+06
=
119
Polymercount cone average std dev
27 270E+06 117E+07 13381334127 127E+0732 320E+0743 430E+0739 390E+0640 400E+0636 360E+06 density41 41 OEf 06 404E+05 391 E+0559 590E+06 385E+0554 540E+06 384E+05
area average std dev87061 900566667 21217235669140691703
120
time (out) count cone (cfuml) average std dev0 40 400E+07 499E+07 154E+07
35 350E+0750 500E+0781 810E+0770 700E+0757 570E+07
408 408E+07386 386E+07367 367E+07
2 37 370E+07 413E+07 179E+0725 250E+0736 360E+0765 650E+0777 770E+0734 340E+0725 250E+0731 310E+07
4 46 460E+07 577E+07 526E+0733 330E+0732 320E+07
158 158E+0892 920E+07
130 130E+0813 130E+079 900E+066 600E+06
6 92 920E+06 129E+07 496E+0672 720E+0688 880E+06
9 900E+067 700E+067 700E+06 - -
169 169E+07192 192E+07191 191E+0720 200E+0714 140E+0724 240E+07
101 101E+07119 119E+07149 149E+07
10 100E+0712 120E+07
11 110E+078 46 460E+05 149E+06 912E+05
13 bull130E+05|
121
13 130E+05191 191E+06217 217E+06244 244E+06
18 180E+0624 240E+0620 200E+06
18 46 460E+06 498E+06 414E+0654 540E+0646 460E+06
3 300E+064 400E+06
18 180E+0738 380E+0655 550E+0652 520E+0622 220E+0613 130E+0622 220E+06
21 26 260E+06 704E+06 394E+0631 310E+0644 440E+06
3 300E+063 300E+063 300E+06
93 930E+0699 990E+06
106 106E+0716 160E+07
8 800E+067 700E+06
62 620E+0671 710E+0675 750E+06
8 800E+0615 150E+07
3 300E+0624 90 900E+06 106E+07 225E+06
89 890E+0690 900E+0613 130E+0713 130E+0711 110E+07
111 111E+0797 970E+0E
107 107E+07V 140E+077
i 5 130E+07
122
15 150E+0787 870E+0680 800E+06
124 124E+077 700E+06
10 100E+078 800E+06
123ciproBMA Plate countstime (in) count cone (cfuml) average std devO 80 800E+07 490E+07 212E+07
64 640E+0777 770E+0742 420E+0755 550E+0753 530E+0726 260E+0723 230E+0721 210E+07
2 31 310E+07 592E+07 235E+0731 310E+0743 430E+0759 590E+0764 640E+07
114 114E+0867 670E+0764 640E+0760 600E+07
4 75 750E+07 572E+07 206E+0770 700E+0786 860E+0742 420E+0738 380E+0732 320E+07
6 000
II
1 2 4
time(out) average std dev0 444E+07 154E+072 478E+07 203E+074 404E+07 198E+076 236E+07 125E+078 185E+05 104E+05
16 284E+06 018 328E+06 557E+0620 374E+06 021 386E+06 528E+0624 210E+06 580E+05
PolymerPlates were all blank for every dilution
11
~
125
15time (out) count cone (cfuml) average std dev
0 31 310E+07 427E+07 153E+0728 280E+0737 370E+0749 490E+0749 490E+0749 490E+0779 790E+0733 330E+07
2 29 290E+07 478E+07 203E+0725 250E+0717 170E+0767 670E+0781 810E+0768 680E+0745 450E+0748 480E+0750 500E+07
4 52 520E+07 404E+07 198E+0750 500E+0756 560E+0755 550E+0772 720E+07
147 147E+07143 143E+0728 280E+0722 220E+07
6 24 240E+07 236E+07 125E+0749 490E+07
138 138E+07126 126E+07150 150E+07
12 120E+0716 160E+0713 130E+0742 420E+0734 340E+0728 280E+07
8 11 110E+05 185E+05 104E+0524 240E+0532 320E+0580 800E+04
117 117E+0591 910E+0434 340E+05
18 56 560E+04 328E+06 557E+0660 600E+04
126
57 570E+046 600E+044 400E+049 900E+04
82 820E+0581 810E+0585 850E+0515 150E+0611 110E+067 700E+05
152 152E+07137 137E+07142 142E+07
21 183 183E+07 386E+06 528E+06111 111E+07126 126E+07186 186E+06159 159E+06148 148E+06
10 100E+0616 160E+0615 150E+0666 660E+0584 840E+0561 610E+0522 220E+0610 100E+0615 150E+06
24 22 220E+06 210E+06 580E+0524 240E+06
131 131E+06167 167E+06141 141E+0620 200E+06 - -
28 280E+0630 300E+06
127
APPENDIX H
M athematical Theory
128
M ATHEM ATICAL THEORY
Kwok (1997) used Basmadjian and Sefton to determine that the drug concentration
immediately next to the polymer in a tube was
CZCNkill rD ) = A [ (xr0)ReSc]13 where (xroReSc)lt104-103
Cs - surface concentration (|igcm5)
Nkill - minimum killing release rate (|Jgcm2s)
R0 - effective hydraulic radius (cm)D - diffusivity of ciprofloxacin in fluid (cnfs)A - constant for geometry x - axial distance from the entrance (cm)
Re - Reynoldrsquos number Sc - Schmidt number
Laminar flow with constant velocity v was used estimate Nkill as 57 x 10J pgcnrs
using the equation above
The ciprofloxacin impregnated polymers were assumed to behave as if dissolution
into a falling film was occurring allowing Pickrsquos second law of diffusion to be modified as
follows
Pickrsquos second law of diffusion
MciZMt = Dip M2CiZMx2
does not adequately model the controlled-release of ciprofloxacin as it does not take into
consideration the fluid flow over the polymer and results in a t12 release rate A better
129
equation would be
vz(x) McMz = Dip M2CiZMx2
where fluid flow is assumed to be occur in the z direction and diffusion is assumed to be in
the x direction The following boundary conditions should be sufficient for the situation
encountered in the flow cell over the first 24 hours
I) O gt Il O at N Il O
2) O gt Il O at y mdash co
3) O gtIl O pound at
OIlThe solution therefore is
CaZCao = erfc [yZ(4DzZvmax)]
130
APPENDIX I
Polymer Surface Area Measurements
131
POLYMER Date of experiment Surface area (mnV)Control 6997 72578
62897 6550372697 76102
Triglyme 8897 9455881097 9458882297 83026
Ciprotriglyme 81697 9064982497 9739782997 94352
BMA 83197 870619797 9140692197 91703
CiproBMA 9597 8818191497 8760691997 85282
MONTANA STATE UNIVERSITY LIBRARIES
3 1762 10302039 O
1
i
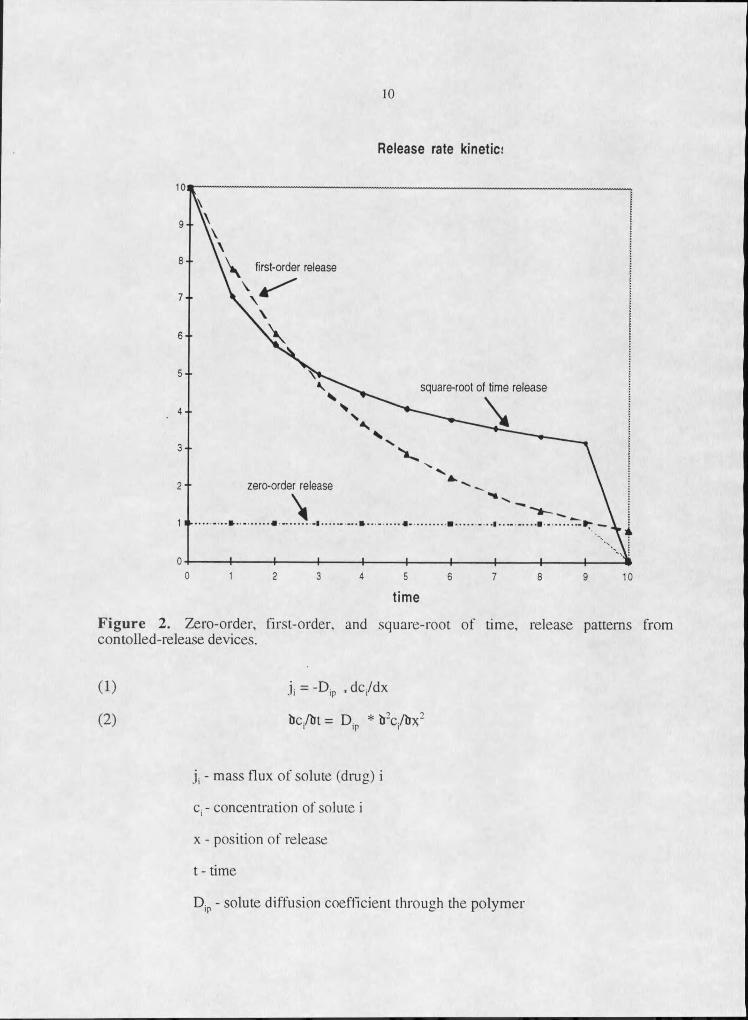