Embed Size (px)
Citation preview
IM A COMPARISON OF THE MILITARY AND CIVILIANHEALTH SYSTEMS
Mordechai E. Lando
t Professional Paper No. 57
December 1970
CENTER FOR NAVAL ANALYSES1401 Wilson Boulevard
Arlington, Viiginia 22209
DOD
rA22 11
IS Rproduced byNATIONAL TECHNICALINFORMATION SERVICE L
Sopfifel V&. 22151

A Comparison of the Military and Civilian Health Systems
Mordechai E. Lando, B.A
(Ph.D. candidate, Columbia University)
Economist, Center for Naval Analyses
This paper is brsed on a study, "Health Services inthe All Volunteer Armed Forces" prepared for the President'sCommission on an All Volunteer Armed Force (The GatesCommission). I wish to thank my collegues at the Center forNaval Analyses and on the sta2E of the President's Commissionfoz their advice and comments on the study. In particular3: am greatly indebted to Mr. Robert Epley for his conscien-tious efforts to estimate the costs of health services and toDean William Meckling, Executive Director of the Commission,for his incisive criticism. The Office of the DeputyAssistant Secretary of Defense for Health Affairs wasextremely helpful in providing me with data and guidance.

Abstract
This paper compares the civilian health system in
the U.S. to the military's prepaid (at zero price) hospital
based group practice system. The military system is fouind
to have higher per capita costs and to use a higher ratio
of health personnel to the population. Morbidity data
indicates that male civilians are in poorer health than
armed forces personnel. Despite lower morbidity rates,
hospital utilization is much higher in the military sector.
It is suggested that the military could decrease their
expenditureson health by -educing hospital utilization.

A Compariscn of the Military and Civilian Health Systems
I. Introduction
The daily press, magazines and learned journals
are continually discussing the crisis in the American
health system. l / Our health system is a patch quilt of
free enterprise, philanthropy ane government subsidy.
Most observers tend to forget that coexisting witn this
patch quilt is an independent "socialist" health system
providing medical services to an estimated ten million
Americans. This "socialist" system is the health services
system of the Department of Defense (DOD) which furnishes
medical care to active duty and retired personnel and
their dependents.
The Department of Defense provides free medical and
dental services to all active duty personnel. Free medical
and dental services are also available to retired personnel
on a space available basis. Dependents receive medical
services at no cost on a space available basis, but ar,
ineligible for dental services unless domiciled overseas
or in domestic areas certified to have a shortage of
civilian dentists.
1*

How well does this military system, whit-h essentially
is a prepaid (in this case free) hospital based group
practice perform relative to the civilian sector? This
study compares the costs of the Defense Department system
to those prevailing in the civilian sector, and finds
higher costs in the military sector. Morbidity 'tes for
both sectors are compared and found lower for the military
sector. This may be the result of the military devoting
more resources to health care, but the available data
precludes one from concluding tLat this is so.
II. Resources
The Department of Defense budgeted an estimated 2
billion dollars in Fiscal Year (FY) 1970 to provide health
services to a population of approximately 10 millicni active
duty personnel, retired personnel and dependents. Tables
I and II contain the relevant data on facilities, manpower,
expenditures and the eligible population.2/
Preliminary cost work done at CNA indicates that the
budgetary expenditures for medical care are not $2b, but
rather approximately $3.2b. The differen-e is mainly a
2
2

result of the way the armed forces budgeting system
operates. The $2b estimate is for expenditures under
Program VIII -- Training, Medical, and Other General
Personnel Activities. However, health service expend-
itures are frequently :harged, for valid reasonnq to
programs other than Program VIII. For example, base
dispensaries and frequently base hospitals may be
charged to the bases budget rather than the medical
budget. Other differences arise as a result of differing
costing methodologies, particularly in regard to fringe
benefits and pensions.
It must, however, be borne in mind that even the
$3.25b figure represents expenditures rather than the
true factor costs. As a result of the draft, the price
of manpower to the Armed Forces is much below the true
factor cost. Using the true factor costs involved in
providing health services would probably raise the figure
to approximately $4b.
3

TABLE I
DEPARTMENT OF DEFENSEMEDICAL SERVICES
FACILITIES:
HOSPITALS 242
DISPENSARIES, LARGE REPORTING Over 450
PLUS LABORATORIES, DENTAL CLINICS AND OTHER ACTIVITIES
MANPOWER !
MEDICAL CORPS 15,972
DENTAL CORPS 6,717
NURSE CORPS 11,321
MEDICAL SERVICE CORPS 9,397
BIOMEDICAL SCIENCE CORPS 1,043
ARMY MEDICAL SPECIALIST 613
VETERINARY CORPS 1,040
ENLISTED 109,027
CIVIL SERVICE* 47.665
TOTAL 202,795
EXPENDITURES (FY'70 EST.): (IN MILLIONS)
HEALTH RESEARCH 104.3
TRAINING AND EDUCATION 132.3
CONSTRUCTION 63.0
DIRFCT HOSPITAL & MEDICAL SERVICES 1,476.8
INDIRECT HOSPITAL & MEDICAL SERVICES 209.8
PREVENTION - CONTROL OF HEALTH PROBLEMS 21.5
TOTAL 2,007.7
Note: *includes U.S. and Foreign Hires, direct and indirectfor Army.
Manpower as of 31 Dec 68
Source: office of the Deputy Assistant Secretary of Defensefor Health Affairs
4

TABLE II
POPULATION ELIGIBLE FOR CARE INARMED SERVICES MEDICAL FACILITIES
31 DECEMBER 1968
3.4 Million Active Duty Personnel
4.1 Million Dependents of Active Duty Personnel
2.5 Million Retired, Dependents of Retired and Dependentsof Dc--. MA mmbers
.025 to .035 Million Civilians Overseas and their Dependents
10,025,000 to 10,035,000
Source: same as table I
5

In addition to expenditures by DOD, the recipient
population also has out of pocket costs for health services.
These are for dental services and the co-insurance pro-
visions of the Civilian Health and Medical Programs of the
Uniformed Services (CHAMPUS).3/ In CY 1968 private per
capita expe'nditures on dental care in the U.S. was $16.53.--
If we assume that approximately half the recipient population
receive dental care outside DOD facilities then we can estimate
a per capita cost of $8.27 and a total cost of $82.7 million.
Another estimate is the figure of $220-240 million calcul-
ated by ODASD (HA) for the annual cost of a civilian dental
care program similar to the CHAMPUS medical care program.
No data is available on the cost of the co-insurance
feature of the CHAMPUS program, but preliminary estimates
indicate that this was about $26 m or $2.60 per capita in
FY 1969. Adding our estimate of $3.25b for DOD expenditures
to the estimate for dental care and co-insurance costs yields
an estimated per capita annual expenditures of $335-350 which
is greater than the figure of $294 per capita for the total
U.S. population in FY 1969.- / The gap increases if we use
the estimate for true factor costs in place of the budgetary
expenditures.
6

The data on per capita expenditures is difficult to
interpret until more is known about the relative quality
of medical care in the armed forces and the civilian sector.
In addition, military costs are inflated by the war in
Vietnam.
The Defense Department employs 34,000 physicians,
dentists and nurses. These represent about 22% of the
total military health personnel and about 17% of the total
manpower devoted by DOD to health services. There are 470
physicians and 198 dentists per 100,000 active duty personnel.
For the entire population served by the Defense Department
the physician rate is 160 per 100,000.-/ For the entire
U.S. population there were 151 active doctors per 100,000
persons in CY 1967.7/
There were 67 dentists per 100,000 members of the
Defense Department population. Since at least a third of
the population is ineligible for dental care, and others,
particularly retired peisonnel, do not avail themselves of
the services, the true ratio is probably over 100 dentists
per 100,000. Both these ratios are significantly above
the national figure of 56 per 100,000.-/
7

Another way of contrasting the relative distribution
of health personnel between the two sectors is to divide
the total population being serviced by the total number
of persons rendering health services, including in the
latter group para-professionals, orderlies, secretaries,
etc. For the DOD population this ratio is approximately
49.4 recipients p? provider. If the civilian sector in
1967 the commensurate ratio was 58.0 recipients per provider.-/
In summary, all the indexes used in this section indicate
that the military sector devotes more resources per capita
to health care than does the civilian sector. Or stated
differently the "socialist" DOD system is more expensive
than the civilian system.
III. Morbidity 0
The previous section discussed at some length the
inuts to the production of health services. In this section
an attempt will be made to get some indicators of the output
of health services. Various indexes will be used to contrast
health itatus in the military and civilian sectors. Unfor-
tunately, the data collected is often not directly comparable.
8hi

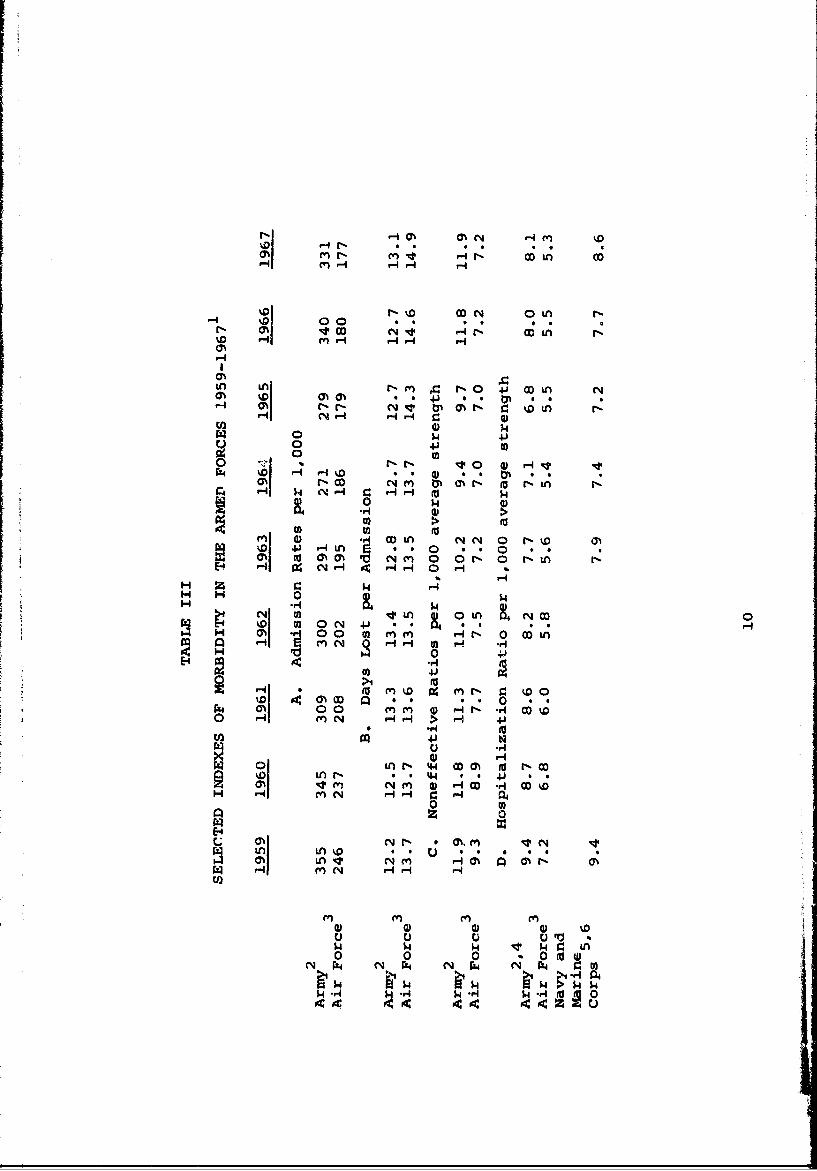
Table III shows that there are significant differences
between the Air Force and Army morbidity rates. Unfor-
tunately, comparable data is unavailable for the Navy
except in the case of hospitalization ratios. Admissions
to hospitals and quarters -- i.e., being excused from
duty fo-- medical reasons -- is more common in the Army.
exhe Army admissions ratio was about 50% above that for the
Air Force in the 1961-1963 period. Both services had a
decreasing rate after 1959. The Air Force rate seems to
have leveled off at approximately 180 per 1,000 during
the past few years. The Army rate dropped by 24% between
1959 and 1964, but has been increasing since. The increase
in the last two years was undoubtedly due to the war in
Vietnam; either because of decreasing draft medical standards
or an increasing proportion of men stationed in Southeast
Asia with concomitantly high non-battle morbidity rates.
On the average it appears that episodes of illness
were more frequent but less serious in the Army than the
Air Force. Thus, days lost per admission has consistently
been higher in the Air Force. However, the discrepancy in
9
rl -4O Ch O -4 M
r.D1 r-4 ~ H 0- H
%01 r-% DN oDL tn
r- D0 4 * 0 0 .N 00C41 -Hr. DLH "q H
%0
HA NA N-I H 4) CL
r I DI ar o' *, D 4) 0 0 @N* 0
00 14 4
to 0 ) 0
ON (a HyA0 c4( 0r-0 -n
0 $4N o) inL & 01 OD 0
%0 l HH 04 Hm N 0. H q t -
Ho H 0Hr M1 4.H
HI OHH CH Q~ H00 P- r rv-c HNq 0- 4J L
0) 4HHI rN 00M (d t00
W n - a*4 0 0 V0 * I0%~h **0 ) - D - D%r] 00 m HN *o*I CD r P0
I) LAN 4. 'D
u U uC r4jLN .044 we4 *
L 0 0 0 %. 0 0LA~HO~~ 'N YN~ H~ HH4
$4-4r4 $ rj $ o
9c Oc

TABLE III - (cont.)
1. All]. data refers to calendar year unless otherwise specified.
2. Excludes battle injuries.
3. Includes very small number of battle injuries.
4. For fiscal year.
5. Includes battle injuries.
6. Navy data is for Calendar year until 1963 and Fiscalyear thereafter.
Definitions:
Admission rate is total number of spells of illness per1,000 per year.
The admission rate multiplied by the days lost givestotal sick days per 1,000 per year.
This product divided by 365 gives the non-effective ratio,i.e., number of men per 1,000 ill on any given day.
The hospitalization ratio is the number of men per1,000 in the hospital on any given day.
Sources:
Army data from Annual Chart Book: Army MedicalDepartment, Department of the Army, Office of -neSurgeon General, Office of the Comptroller, 1970.
Air Force data from various Annual Reports of the USAFMedical Service Office of the Surgeon General, UnitedStates Air Force.
Navy data from Medical Statistics: U.S. Navy volumes95-99 and Statistics of Navy Medicine volumes 20-25,Office of the Surgeon General U.S. Navy.
11

admission rates is of greater relative importance than
the decrease in days lost per admission. Hence, the non-
effective rate for the Air Force is much smaller than it
is in the Army. Non-effective rates for both services
have dropped since 1959. The Air Force rate appears to
have leveled off at approximately 7.0 - 7.2 per thousand,
while the Army rate has been increasing since 1964 and in
1967 it equaled the 1959 rate.
The Air Force hospitalization rate is lower than the
rate for the other services. The Navy-Marine Corps data
includes battle injuries, but excludes Naval station
hospitals and thus, isn't comparable to the data for the
other services.
Some a priori reasons can be given for the apparent
better health of the Air Force. The Air Force applies much
more stringent medical standards to its applicants and thus,
has a healthier popul-tion to begin with. The Air Force
has a higher proportion of officers, This should reduce
illness since a smaller proportion of Air Force personnel
live in barracks where contagious diseases, particularly
12

upper respiratory infections, spread rapidly. Uniformed
personnel in the Air Force have a higher level of educa-
tional attainment than their Army counterparts, and
recent studies indicate that education is positively
correlated with health.i On the other hand, Air Force
personnel are older which should lead to increasing
disability. The causes listed above are meant to be
suggestive rather than conclusive. This is an area which
warrants further investigation.
Table IV compares sick days in the military to si.ck
days in the civilian sector. For the civilian sector two
measures are used. The one which would appear to be closest
to the military definition is work loss days, but this is
an understatement since the military data refers to a seven
day week rather than a five day week. Another measure of
illness in the civilian sector is restricted activity days
which may includes days in which one may have worked, but
was limited in his activity.
It should be noted that, unlike the other tables, the
Army data in table IV contains battle casualties. Initial
13
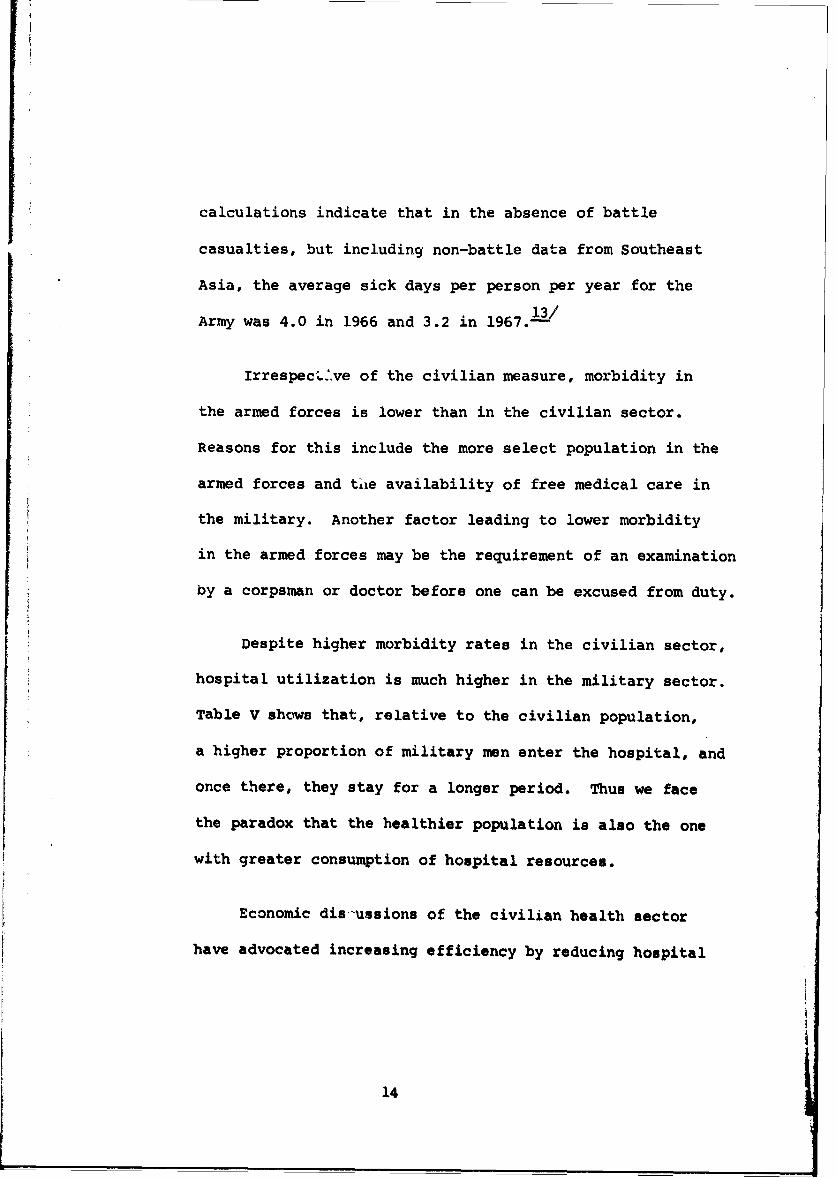
calculations indicate that in the absence of battle
casualties, but including non-battle data from Southeast
Asia, the average sick days per person per year for the
Army was 4.0 in 1966 and 3.2 in 1967.---/
Irrespec62.ve of the civilian measure, morbidity in
the armed forces is lower than in the civilian sector.
Reasons for this include the more select population in the
armed forces and thle availability of free medical care in
the military. Another factor leading to lower morbidity
in the armed forces may be the requirement of an examination
by a corpsman or doctor before one can be excused from duty.
Despite higher morbidity rates in the civilian sector,
hospital utilization is much higher in the military sector.
Table V shows that, relative to the civilian population,
a higher proportion of military men enter the hospital, and
once there, they stay for a longer period. Thus we face
the paradox that the healthier population is also the one
with greater consumption of hospital resources.
Economic dis-ussions of the civilian health sector
have advocated increasing efficiency by reducing hospital
114!
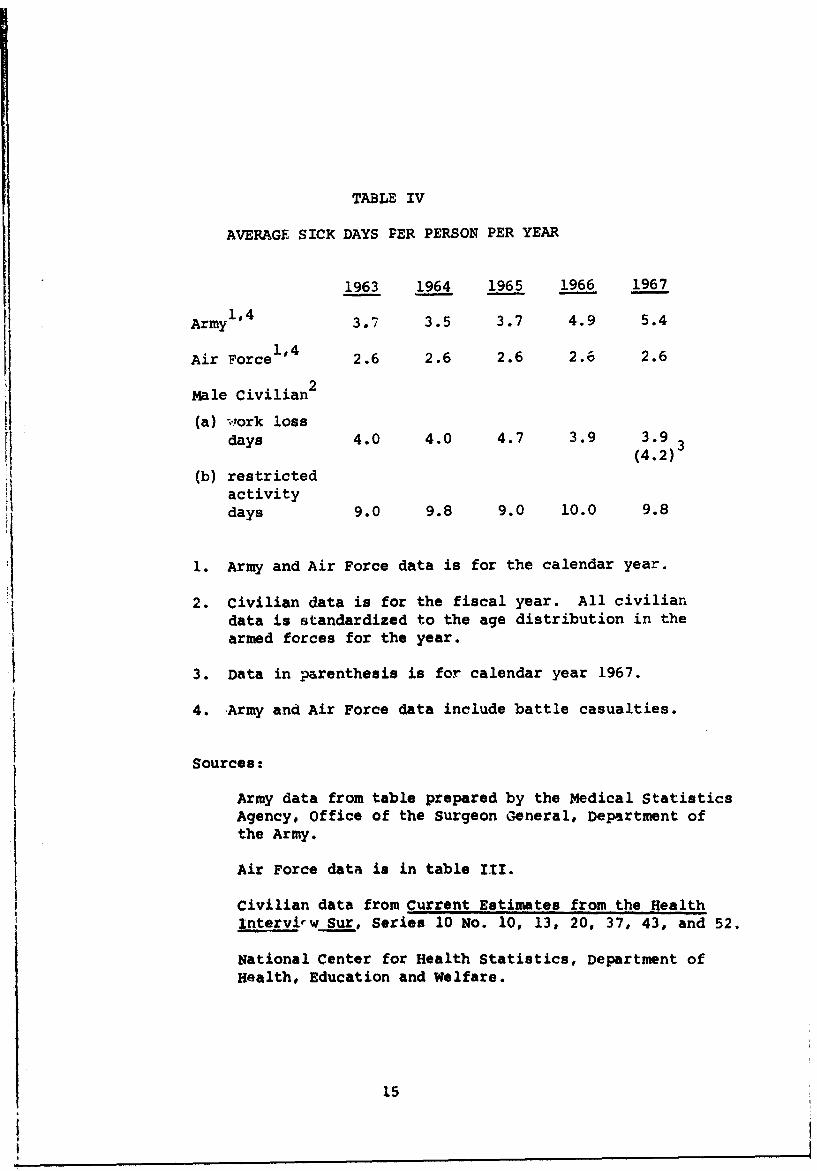
TABLE IV
AVERAGE SICK DAYS PER PERSON PER YEAR
1963 1964 1965 1966 1967
Army1'4 3.7 3.5 3.7 4.9 5.4
Air Force 1'4 2.6 2.6 2.6 2.6 2.6
Male Civilian2
(a) work lossdays 4.0 4.0 4.7 3.9 3.9
(4.2)
(b) restrictedactivitydays 9.0 9.8 9.0 10.0 9.8
1. Army and Air Force data is for the calendar year.
2. Civilian data is for the fiscal year. All civiliandata is standardized to the age distribution in thearmed forces for the year.
3. Data in parenthesis is for calendar year 1967.
4. Army and Air Force data include battle casualties.
Sources:
Army data from table prepared by the Medical StatisticsAgency, Office of the Surgeon General, Department ofthe Army.
Air Force data is in table III.
Civilian data from Current Estimates from the Healthinterv -w Sur, Series 10 No. 10, 13, 20, 37, 43, and 52.
National Center for Health Statistics, Department ofHealth, Education and Welfare.
ii
I 15
i

TABLE V
SELECTED INDEXES OF HOSPITAL USAGE
1963 1964 1965 1966 1967
A. Hospital Days per Hospital Admission4
Army1,2 14.7 13.7 13.6 12.4 13.3
Air Force3 10.7 11.0 11.7 11.6 11.4
1Civilian Males 11.1 9.3 8.1 8.6 9.2
B. Hospital Admissions per 100 Persons Per Year4
Army1 .2 29.8 27.4 27.0 31.9 32.91
Civilian Males 8.4 8.0 8.2 8.7 8.2
1. Data refers to fiscal year.
2. Army data includes battle casualties in Part A excludesthen in Part B.
3. Air Force data refers to uniformed personnel in all servicestreated in Air Force medical facilities and may i.ncludesome battle casualties.
4. For civilians, data is hospital discharges. This probablyleads to an understatement of the true civilian figures.
Sources: same as previous tablea.
16

usage and substituting ambulatory care. By these
standards, the military medical system appears inefficient.
However, it is argued that for a large proportion of the
active duty personnel, hospital usage is warranted since
they can't remain unattended in the barracks. In other
words, for many illnesses, particularly upper respiratory
infections, a civilian can remain at home tended by his
family, but a soldier, whose only home is the barracks,
must go to the hospital.
If this viewpoint is correct, then it is difficult to
understand why hospital days per admission are so much
highe~r in the armed forces. It would appear that the
hospital stay for those illnesses which do not require
hospitalization in the civilian sector, should be shorter,
on the average, than the stay for other, more severe illnesses.
Thus, the higher hospital utilization rate in the military
still requires explanation.
In fiscal year 1969 cost per patient aay in Army
hospitals was only 57% of the costs in non-federal short
term general hospitals. - If, indeed, many Army patients
17

require mainly hotel services and only a minimal amount
of medical services this may explain the relatively low
cost per patient day. This in turn seems to indicate that
it might be advisable for the armed forces to invest in
small infirmaries where moderately ill patients could
receive the hotel care they need. These infirmaries could
rely on medical corpsmen to dispense whatever medication
is required.
In summary, this section indicates that military
personnelare in better health than their civilian com-
patriots. There is no way of determining to what extent
this is due to starting out with a healthier population and
to what extent it is due to the greater per capita expenditure
discussed earlier. In addition, we noted that military
medical care is much more hospital intensive than in the
civilian economy. To re-emphasize this point; in the Air
Force in 1967, 74% of all those excused from duty were
hospitalized whereas in the civilian economy, hospital days
for wales 17-64 were only 26% of their work loss days.
18

FOOTNOTES
1. For examples of recent discussions of the cost indquality of medical care in the civilian sector Lee:Fred Anderson, "The Growing Pains of Medical Care",a three part essay in The New Republic beginningJanuary 17, 1970, and Fortune Magazine, January,1970 for an editorial and four articles on "OurAiling Medical System".
2. Unless otherwise stated all data in this section wasprovided by the Office of the Deputy Assistant.Secretary of Defense for Health Affairs and refers
to December 31, 1968.
3. The CHAMPUS program is dqcussed in detail in:Frank van Dyke, Military medicare, Columbia UniversitySchool of Public Health, June 1969.
4. Dorothy P. Rice and Barbara S. Cooper, "NationalHealth Expenditures, 1929-68", Social Security Bulletin,January, 1970, table 7.
5. Ibid, table 1.
6. The ratio for the military population is underestimatedsince dependents and retired personnel have the CHAMPUSoption.
7. Taken from p. 16 of Health *npoier: U.S. 1915-1967.National Center for Health Statistics, Nov. 1968.Their figure of 15b was reduced to account for 14,198inactive physicians.
8. Ibid, p. 31.
9. For the civilian sector assumed 3,410,600 persons employedin health fields (upper estimate from Htalth M2anpower,op. cit., p. 4) and total resident population of 197,854,000as per table 2, Statistical Abstract of the U.S., 1969,U.S. Bureau of the Census.
19

10. I am indebted to Mrs. Linda Miller and Mrs. KarenShipper for some of the calculations in this section.
II. On June 30, 1967, 15.1% of Air Force personnel wereofficers. The comparable proportion for the Army was9.9%. Selected Manpower Statistics, April 15, 1968.
12. Data on accessions for October 1966-September 1968indicate that 97% of Air Force accessione were highschool graduates as compared to 72% for the Army.School grades completed were 11.8 for the Army and12.5 for the Air Force. Project One Hundred Thousand,office of the Assistant Secretary of Defense (Manpowerand Reserve Officers), March 1969. For the effect ofeducation on health see Michael Grossman, The Demandfor Health unpublished Ph.D. dissertation, ColumbiaUniversity, 1969.
13. Annual Chart Book, op. cit.
14. See, for example, Report of the National AdvisoryCommission on Health ManLower, Nov. 1967, Washington,G.P.O. Vol. II Appendix IV, which argues that much ofthe increased efficiency of the Kaiser FoundationMedical Care Program is due to this type of substitution.
15. Annual Chart Book, op. cit.
20 j

INDEX OF PROFESSIONAL PAPERS
NO. SECTION TITLE AUTHOR(S)1 INS Static Models of Bank Credit Expansion Brown/Lloyd2 NAVWAG The Sex-Differential in Canadian Unem-
ployment Data Lando3 INS A Dynamic Inventory Model with Delivery Brown/Corcoran/
Lag and Repair Lloyd4 PiS A Moment Problem for Order Statistics Kadane5 INS Optimal Whereabouts Search Kadane
7 INS The Continental Shelf Issue at the UnitedNations: Quantitative Content Analysis Frieuneim
8 INS A Comparison of the Importance of Economicsversus Non-Economic Factors Affecting theResidential Housing Market During theTwoDecades Subsequent to World War II Rose
9 INS Existence of Excess Capacity at NavalShipyards Prior to Escalation of Hostilitiesin Southeast Asia in 1964 Rose
10 O EG Classified10 INS The Effect of Discrimination on Earnings:
Evidence from Military Test Score Results O'Neil12 INS Dynamic Models of Bank Credit Expansion
Under Certainty Brown/Lloyd14 INS Determination of the Optimal Investment
in End Products and Repair Resources Rose15 INS Computing the Expected End-product
Service Time using Extreme Value Propertiesof Sampling Distributions Rose
16 INS A Study of Reparable Item ResupplyActivities ose
17 INS An Incremental Production Function forthe End-item Repair Process Rose
18 INS Inventory and the Theory of the Firm Rose19 INS A Decomposed Network Computation for
End-product Repair Cost Curves Rose20 INS Inventory Models with a Type of Dependent
Demand and Forecasting with an Applicationto Repair Brown/Corcoran/
Lloyd

INDEX OF PROFESSIONAL PAPERS (Continucd)
NO. SECTION TITLE AUTHOR(S)
21 INS Resource Allocation in a Sequential SilvermanFlow Process
22 INS Israeli Reprisal Policy and the Limits Gorlinof U.S. Influence
23 INS An Aircraft Rework Cost-Benefit Model Rose
24 INS An Application of Network Analysis to the Sutton/LloydDetermination of Minimum Cost AircraftPipeline Factors
25 OEG An Approach to Semi- Markov Processes Saperstone
26 INS The Reliability of a Complex System with Brown/CorcoranSpares, Repair and Cannibalization
27 NAVWAG Validation of Combat Models Against Feldman/SimonHistorical Data
28 INS Quantitative Content Analysis of the Friedheim/KadaneUnited Nations Seabed Debates:Methouology and a Continental ShelfCare Study
29 OEG Controllability of Linear Oscillatory SaperstoneSystems using Positive Controls. I
30 INS The Effect of Social Policy on the Social DeVanyand Private Value of a Child
31 INS Time in the Budget of the Consumer DeVany
32 INS Fitting Korean War Data by Statistical OverholtMethods
33 IS A Theory of Household Demand and Labor DeVanySupply
34 INS The Covariance Matrix of the Limited In- Kadaneformation Estimator and the IdentificationTest: Comment
35 NAVWAG Full Employment and the New Economics- LandoA Comment
36 INS The Theory of Consumer Demand and DeVanyLabor Supply under a Time Constraint
37 INS Testing a Subset of the Overidentifving KadaneRestrictions

INDEX OF PROFESSIONAL PAPERS (Cont'd)
iNO. SECTION TITLE AUTHOR(S)38 OEG The Eigen Vectors of a Real Symmetric Saperstone
Matrix are Asymptotically Stable forSome Differential Equations
39 OEG Quasi-Residuated Mappings and Baer Hardy/BlythAssemblies
40 INS Evaluating Changes in the Health Care Silverman/Delivery System: An Application to ForstIntensive Care Monitoring
41 NAVWAG An Analysis of Crises De cision Making Piersall
42 NAVWAG Measured Mental Ability, Service SchoolAchievement and Job Performance Sullivan
43 INS 1964-67 Cyprus Crises - A Study ofSixth Fleet Crises Role Ferguson
44 INS Conflict and Integration in the Nea, SchickEast
45 INS Fixed Shortage Costs and the InventoryModel Brown
46 OEG A Coordination of Lattices by One-Sided Baer Assemblies Hardy
47 INS Resource Allocation in a SequentialFlow Process with an Application tothe Naval Resupply System Silverman
48 INS Writeup for B34TCNA a Step-Wise
Multiple Regression Program Gray
49 INS International Organizations and theUses of the Ocean Friedheim
50 INS Classified Ferguson
51 OEG Global Controllability of Linear Systemswith Positive Controls Saperstone
52 INS A Decision Theoretic Approach toMedical Diagnosis and Treatment Forst

INDEX OF PROFESSIONAL PAPERS (Contd)
NO. SECTION TITLE AUTHOR(S)
53 INS On Division of the Question Kadane
54 INS Analysis - Data Inputs and SensitivityTests in War Games Overholt
55 INS Optimal Management of Bank Reserves Brown
56 INS Cancelled
57 NAVWAG, A Comparison of the Military and CivilianHealth Systems Lando