Embed Size (px)
Citation preview
Trends in wages and earnings in India: Increasing wagedifferentials in a segmented labour market
Anup K. Karan ([email protected]) is a postgraduate in economics from Ranchi University,Jharkhand, and he has completed advanced training and research in international health from theHarvard School of Public Health (HSPH), Harvard University, Boston. Currently, he is working asan independent freelance researcher in the area of poverty, employment, and human development.Earlier, he has worked as a faculty member, Institute for Human Development, New Delhi, andassistant professor (Economics), Government Degree College, Government of Madhya Pradesh. MrKaran has more than 15 years of experience in research and teaching and he has been working asa consultant for several national and international organizations. He has published several researchpapers in different journals and books of repute. He has two published books to his credit,Liberalisation and labour: Labour flexibility in Indian Manufacturing and Children, school and work:Glimpses from India.
S. Sakthivel ([email protected]) is an economist currently working with the Public Health Foundationof India (PHFI), New Delhi. He was a Takemi Fellow (post-doctoral fellow at Harvard School ofPublic Health) and a Fulbright Scholar during 2006-07. He holds a PhD in health economics (1996-2001) from Jawaharlal Nehru University, New Delhi. Earlier, he was engaged as a health economistin the National Commission on Macroeconomics and Health (NCMH), Ministry of Health andFamily Welfare, New Delhi, during 2004-05. Mr Sakthivel has also served as a consultant with theNational Commission on Enterprises in the Unorganised Sector in India and as a fellow at the Institutefor Human Development (2005-06). Prior to that, he was engaged as a research associate at theInstitute of Economic Growth (2002-04). His areas of interest include health economics, laboureconomics and macroeconomics. He has published several articles in reputed national andinternational refereed journals.
The responsibility for the opinions expressed in this paper rests solely with the authors and publication doesnot constitute an endorsement by the International Labour Office of the opinions expressed in this paper, orof any products, processes or geographical designations mentioned in it.
Anup K. Karan & Sakthivel Selvaraj
Copyright © International Labour Organization 2008First published 2008
Publications of the International Labour Office enjoy copyright under Protocol 2 of the UniversalCopyright Convention. Nevertheless, short excerpts from them may be reproduced without authorization,on condition that the source is indicated. For rights of reproduction or translation, application shouldbe made to the ILO Publications (Rights and Permissions), International Labour Office, CH-1211 Geneva22, Switzerland or by email: [email protected]. The International Labour Office welcomes such applications.
Libraries, institutions and other users registered in the United Kingdom with the Copyright LicensingAgency, 90 Tottenham Court Road, London W1T 4LP [Fax: (+44) (0)20 7631 5500; email: [email protected]],in the United States with the Copyright Clearance Center, 222 Rosewood Drive, Danvers, MA 01923(Fax: (+1) (978) 750 4470; email: [email protected]] or in other countries with associated ReproductionRights Organizations, may make photocopies in accordance with the licences issued to them for thispurpose.
Trends in wages and earnings in India: Increasing wage differentials in a segmented labour marketSubregional Office New Delhi 2008
ISBN: 978-92-2-120888-4 (print)ISBN: 978-92-2-120889-1 (web pdf )
The designations employed in ILO publications, which are in conformity with United Nations practice,and the presentation of material therein do not imply the expression of any opinion whatsoever on thepart of the International Labour Office concerning the legal status of any country, area or territory or ofits authorities, or concerning the delimitation of its frontiers.
The responsibility for opinions expressed in signed articles, studies and other contributions rests solely withtheir authors, and publication does not constitute an endorsement by the International Labour Office ofthe opinions expressed in them.
Reference to names of firms and commercial products and processes does not imply their endorsementby the International Labour Office, and any failure to mention a particular firm, commercial product orprocess is not a sign of disapproval.
ILO publications can be obtained through major booksellers or ILO Subregional Office for South Asia,India Habitat Center, Theatre Court Road, 3rd Floor, Lodi Road, New Delhi-110 003. Catalogues or listsof new publications are available free of charges from the above address, or by email: [email protected].
Visit our website: www.ilo.org/publns, or www.ilo.org/india
Printed in India
Executive SummaryThis paper is an attempt to look at the structure and trends of wages and earnings in the Indian labourmarket in the last two decades. It aims to provide a comprehensive picture of the variations in wagepayments across different segments of the labour market and suggests policies to safeguard the interestof the most vulnerable in the labour market. It discusses the structure of the Indian workforce, the longterm and short term trends in the real daily wage rates, along with a comparative picture of the pre-and post-liberalization scenarios of daily wages.
The paper shows that among both regular and casual workers, there has been a fall in growth in wageswith increasing wage differential across different segments in the post-liberalization period. Female casualworkers not only receive lower wages than their male counterparts, the differential is quite stark. Genderdisparity of regular wages is on a rise in the rural sector. However, the overall gender differential in wagesis declining over the years, implying a higher wage growth for female workers as compared to maleworkers. Non-farm wages in rural areas is higher than agricultural wages and the difference has widenedduring the post-liberalization period. Wage growth in the informal non-farm sector has decelerated andcasual workers, particularly in the agricultural sector, have witnessed the slowest increase in wages duringthis period. Variation in wages across different industrial categories is more distinctive among urban casualworkers with male average daily wage rates varying less across sectors.
Further, the paper points out that the increase in labour productivity has not been translated intoincreased growth in real wages, particularly for casual workers. The need to enhance the educational andskill capabilities of workers to combat poverty is highlighted. It shows that the Indian labour markethas witnessed an overall setback in wage growth, particularly among the lower social strata of theworkforce. The Minimum wages Act is poorly implemented, particularly in rural areas, and a largeproportion of agricultural workers continue to get less than the prescribed minimum wages. Therefore,there is a need to make arrangements for the effective implementation of this Act. Overall, the paperargues that the low level of wages and the increasing wage differential across different segments of thelabour market have resulted in widespread poverty among workers, particularly casual workers.
iii

ForewordDuring the last one and a half decades, growth in employment and wages in India has been unsatisfactory.The overall economic growth has not been able to translate itself into an increment in the wages andearnings of the workforce. The present study, by Anup K. Karan and Sakthivel Selvaraj is an attemptto explore the levels of and trends in variations in wage payments across different segments of the labourmarket in India. It examines the structure of the Indian workforce, analyses the long term and shortterm trends in the real daily wage rates in both pre and post-liberalization phases in different states,highlights the inequality in wage payments within the different segments of the labour market, andassesses the magnitude of the working poor and incidence of poverty among different types of workers.
The findings of the paper show that the wage differential across different segments has been on the risein the post-liberalization period. Gender differentials continue to exist, but have been declining over theyears. Wage growth in the informal non-agriculture sector has decelerated and casual workers, particularlyin the agricultural sector, have witnessed the slowest increase in wages during the post-liberalizationperiod. The inequality in wage payment within each segment of the labour market also shows anincreasing trend during the post-liberalization period. Further, the increase in wages has lagged behindincrease in labour productivity all through the post-liberalization period. Education plays a very importantrole in ensuring higher wages for both regular and casual workers. The authors argue that the MinimumWages Act is still poorly implemented, particularly in rural areas, and a large proportion of agriculturalworkers continue to get less than minimum wages. All these have resulted in high incidence of povertyamong workers in general and casual workers in particular. The study highlights the need to enhancethe educational and skill capabilities of workers to combat poverty.
This paper is part of a series of studies that have been launched by the ILO, Delhi office, coordinatedby Sukti Dasgupta, Employment and Labour Market Policy Specialist, to analyse and understand thecurrent employment challenges in India.
Leyla Tegmo-ReddyDirector and ILO Representative in India
Sub Regional Office for South Asia, New DelhiInternational Labour Organization
v

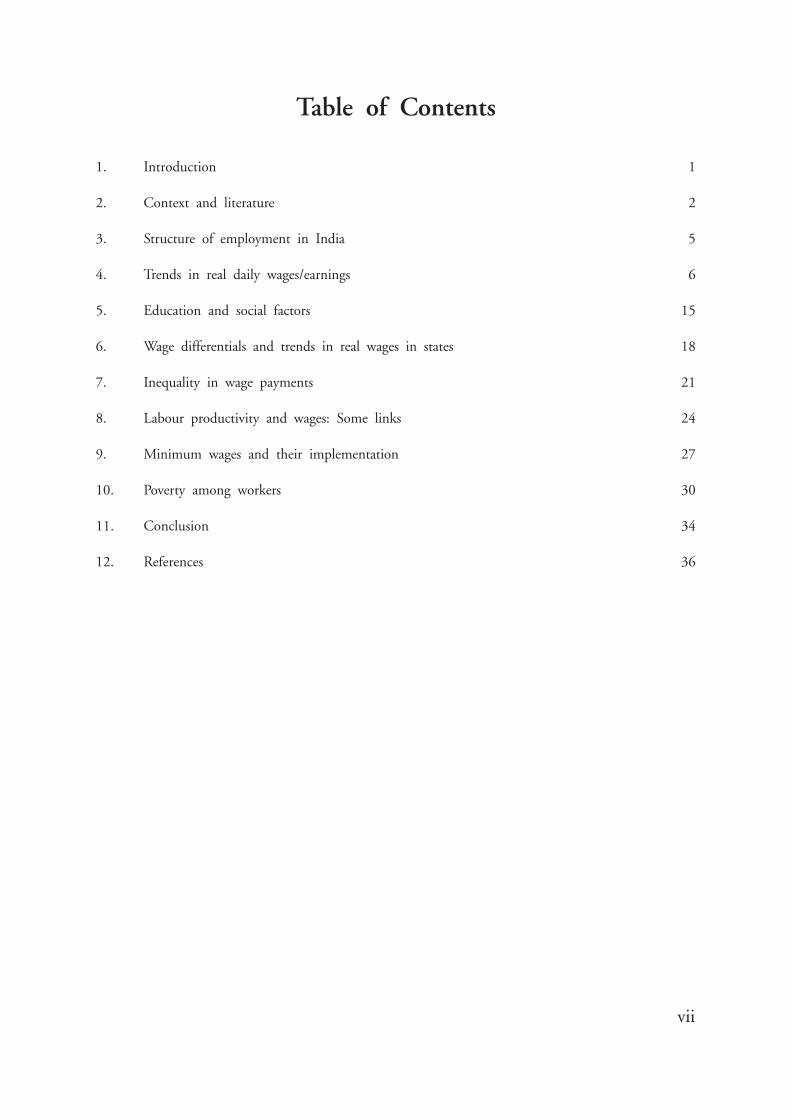
Table of Contents
1. Introduction 1
2. Context and literature 2
3. Structure of employment in India 5
4. Trends in real daily wages/earnings 6
5. Education and social factors 15
6. Wage differentials and trends in real wages in states 18
7. Inequality in wage payments 21
8. Labour productivity and wages: Some links 24
9. Minimum wages and their implementation 27
10. Poverty among workers 30
11. Conclusion 34
12. References 36
vii

AcknowledgementsThe authors would like to thank Manas Bhattacharya, Sukti Dasgupta, Sandip Sarkar, Himanshu, andAnoop Satapathy for their comments and suggestions on an earlier draft version of this paper in 2005.The authors would also like to thank the anonymous referees of this paper from the ILO for their detailedcomments and suggestions on the final draft of the paper. The usual disclaimers apply.

1ILO Subregional Office for South Asia, New Delhi
1. Introduction
The New Economic Policy initiated during the early 1990s and involving liberalization andglobalization of the domestic economy, was supposed to enhance the potential of investmentopportunities and usher into the Indian labour market a substantial increase in the income and earningsof workers. However, several studies provide ample evidence that despite a modest overall performanceby the Indian economy during the past one and a half decades,1 the extent to which economic progresshas translated into increased labour earnings and, consequently, poverty reduction, has been ratherdisappointing (Bhalla, 2002; Ghosh, 2004; Kijima and Lanjouw, 2005). Much of this concern arisesin relation to the rural workforce, which accounts for 75 per cent of the total workforce in India (Senand Ghosh, 1993; Nayyar, 1993; Bhalla, 1998; Sen, 1998). Accordingly, slow growth in labour earningsis one of the major reasons for the slower decline in poverty, particularly in the rural areas in the late1990s and early 2000s (Sen, 1998; Bhalla, 2002; Deaton and Dreze, 2002).
The level of earnings and wages of a workforce is considered a robust indicator of the livelihoodstatus of the population. Though in a general neo-classical framework, the level of wages and earningsof the workforce is determined by demand for and supply of labour, in developing countries, this isaffected largely by strict labour market dualism (Heckman and Hotz, 1986) and strong entry barriersacross different segments of the labour market. The Lewisian model of labour market dualism considersthe coexistence of traditional and modern sectors of employment as largely explaining the wagedifferentials in a developing economy. In India, the labour market dualism has been documented widelyin terms of formal-informal, employment status of workers, occupation types, sectors of employment,states and regions, etc. (Sen, 1994; Unni, 2001; Tendulkar, 2003; Das, 2003). Accordingly, wages andearnings of workers differ across different segments of the labour market (Sen, 1998).
Against this background, the present study, based on data from the National Sample SurveyOrganisation (NSSO),2 attempts to study the structure and trends of wages and earnings in the Indianlabour market and changes therein during the past two decades or so. In general, the paper providesa comparative scenario of the pre- and post-liberalization phases, covering the period from 1983 to 1993-94 and from 1993-94 to 2004-05, respectively. The present paper uses a segmented labour marketapproach to show the wage differentials across the different segments of the Indian labour market.Though the literature is replete with studies on wages and earnings in India, most of these studies arefocused on either agricultural wages or levels of wages and earnings in the manufacturing sector. Thereare very few studies that present a comprehensive picture of wage levels and the trends across differentsegments of the labour market. The present paper is a modest attempt in this direction. The rest ofthe paper is organized as follows:
After presenting a review of the relevant literature in Section 2, Section 3 presents a brief overviewof the structure of the workforce in India. Section 4 examines in detail the levels and trends in wages/earnings of workers. This section dissects long term and short term trends in the real daily wage ratesand presents a comparative picture of daily wages before and after liberalization. In Section 5, we discuss
1 Economic growth has accelerated substantially since the 1980s from a sluggish 'Hindu growth rate' of 3.5 per cent in the earlierdecades.
2 The National Sample Survey Organisation (NSSO) is a premier institution of the Government of India under the Ministry ofStatistics and Programme Implementation, which collects household data on the employment and unemployment situation in Indiaon a regular basis.
2 ILO Subregional Office for South Asia, New Delhi
in brief the role of two important factors, education and social groups, in wage fixation. Section 6of the paper presents a detailed analysis of the levels of and trends in real wages across the differentstates of India. Inequality in wage payments within the different segments of the labour market has beenpresented in Section 7. The link between labour productivity and wage payment has been explored inSection 8. The role of minimum wages in determining the prevailing wages has been studied in Section9, which also investigates the extent of implementation of minimum wages in different sectors. Section10 presents an assessment of the working poor and incidence of poverty among different types of workers.Lastly, Section 11 offers conclusions and policy recommendations.
Data source
In this paper, we have used unit record data collected by the National Sample SurveyOrganisation on Employment and Unemployment for four quinquennial rounds of survey in the 1980sand 1990s, and the latest round conducted in 2004-05. These survey rounds are: the 38th round of 1983;the 50th, 55th and 61st rounds of the agricultural years of 1993-94, 1999-2000 and 2004-05, respectively.The wage rates for casual workers in the non-agriculture informal sector have been calculated by usingthe unit data of the non-agricultural informal sector (NSSO, 55th round) survey of 1999-2000. Unlessmentioned otherwise, the source of all tables and graphs used in this paper is the NSSO database asmentioned in this paragraph.
2. Context and literature
Available studies on wages and earnings in India suggest that rural and, in particular, agriculturalwages have received the highest attention. During the 1970s and 1980s, the most notable of these studieswere done by Krishnaji (1971), Jose (1974 and 1988), Lal (1976), and Laxminarayan and Tyagi (1977).These studies analysed rural and agricultural wages, which reported a significant rise in the real agriculturalwages and in several states, particularly during the post green revolution period. During the 1980s, ruralwages are shown to have accelerated quite sharply in a number of the poorer states (Jose, 1988).
However, studies conducted during the 1990s revealed a reversal in the tendency of wage rise,wherein the growth of wages registered a deceleration (Bhalla, 1998; Sen, 1998). Deaton and Dreze(2002) note that according to recent estimates based on 'Agricultural Wages in India (AWI)', realagricultural wages were growing at about 5 per cent per year in the 1980s and 2.5 per cent per yearin the 1990s. But other recent studies do not support the trend of deceleration in real agricultural wages.Sharma (2001), for instance, using RLE (Rural Labour Enquiry, conducted by the NSSO) data,concluded that agricultural wages did not witness a decline during the 1990s contrary to the findingsof studies based on the AWI data. Sundaram (2001) also rejects the view that there has been a slowdownin the rate of growth of mean daily wage earnings of adult labourers during the 1990s. These differencesin findings are observed mainly on account of differences in data sources, which, in turn, differ in termsof coverage and definitions.3 In any case, as far as NSSO data is concerned, this does not support theargument of declining trends in wage increase over the years for casual workers as such. However, therehave been wide variations in the rate of growth of real wages across different segments of the labourmarket, while the studies reported a mixed trend of wage increase during the 1990s and later (Sen, 1994;
3 For details on the differences across various sources, see Himanshu (2005).

3ILO Subregional Office for South Asia, New Delhi
Parthasarthy, 1996; Bhalla, 1997; Unni, 1997; Sharma, 2001; Sundaram, 2001; Himanshu, 2005;Sundaram and Tendulkar, 2006).
Some studies also show that there has been impressive growth of wages and earnings duringthe 1990s. Bhalla and Das (2005), while exploring the trends in wages at the all-India and state levels,observe that there has been secular increase in wages all through the period of the 1980s and 1990s,and that the rate of increase has accelerated during the 1990s. Similarly, Sundaram and Tendulkar (2006)find acceleration in the real wages and earnings of the Indian labour force during the 1990s andspecifically mention that the "most vulnerable section of both rural and urban labour markets wascharacterized by a healthy growth in real daily earnings and reduction in male-female earningsdifferentials". However, these studies report acceleration in real wages during the 1990s, mainly at theaggregate level.
At the disaggregate levels, these studies show slow or no rise in rural casual real wages in general,and agricultural wages in particular, during the 1990s. Unni (2005) notes a mixed trend for informalsector workers both in terms of employment growth and increase in real wage earnings. She notes that"the process of reforms that allowed small firms to expand capacity, de-reserved products, and allowedthe inflow of new technologies, rejuvenated the unorganized manufacturing sector in the late 1990s.Many industries in the unorganized sector such as manufacture of machinery, motor vehicles andchemical products displayed fast growth of value added and labour productivity. The benefits of thisgrowth were transferred to the workers in the sector in terms of growth of employment, accompaniedby rapid rise of wage earnings per worker."
Unni also observes that "one of the negative outcomes of the policy changes (during the 1990s)was growing inequalities between various segments of the workers. The segment of the workforce thatbenefited the most was male skilled workers in regular employment. The urban workers also did betterthan their rural counterparts. There was increasing wage gap between the regular and casual, skilled andunskilled, and men and women workers."
Unni's observations are based on the unorganized manufacturing sector, which constitute up to32 per cent of total unorganized sector units and approximately 37 per cent of total unorganized sectoremployment. What remains to be explored is what the reform process has done for the informal non-manufacturing sector units and workers, particularly across the sectors of construction; trade and repairservices; transport, storage and communication services; and community and social services. These sectorsconstitute approximately 60 per cent of the total informal enterprises and approximately 52 per centof the total informal employment.
In general, literature shows that the recent economic growth has been accompanied bydeceleration in employment growth in the economy during the 1990s. This has been termed as the'jobless growth' phenomenon (Mahendradev, 2002; Ghose, 2004). Ghosh (2005) notes that "thedeceleration and even decline in organized sector employment was one of the more disturbing featuresof the period after 1990, especially given that industrial output increased manifold". In fact, slowemployment growth has been one of the most important reasons of increased labour productivity,particularly in the organized manufacturing sector, during the 1990s. Bhattacharya and Sakthivel, (2005)note that though employment elasticity has been positive for most of the employment sectors in thepost reform period, the growth in real wages has been rather shaky.
4 ILO Subregional Office for South Asia, New Delhi
Further, whatever employment growth has taken place during the 1990s has been largelyconcentrated in the urban unorganized sector (GOI, 2006; Unni and Rani, 2003). This has resultedin increased out-migration of rural labour on the one hand and declining working conditions in urbanareas on the other (Kundu, 1997 and 2002). Subsequently, this appears to have certainly helped employersto avoid many rules and regulations related to labour welfare in general and implementing minimumwages in particular (Unni, 2000; Deshpande et al., 2004).
Further, increased casualization of the workforce has reduced the bargaining power of labourin the post-liberalization era (Karan and Sarkar, 2003). As a result, increase in wages and earnings ofworkers has not been satisfactory as actual wages paid to workers, particularly in rural areas and in theurban unorganized sector, have not only been very low, but also, in many regions, even lower thanthe official minimum wages (Deshpande et al., 2004).
In a recent study, Saget (2006) shows that in the urban non-agriculture sector, most casualworkers do get minimum wages or even higher on a daily basis, but most of these workers work formore than 10 or even 12 hours a day for those wages. In fact, the phenomenon of 'jobless growth',coupled with slower increase in real wages, has led many scholars to believe that during the post-liberalization period, the rate of poverty reduction has been much lower than is claimed officially bygovernment agencies such as the Planning Commission.4 It is also observed that whatever povertyreduction has taken place during the 1990s has not contributed to equality.5
A review of these studies6 clearly indicates that though the average wages and earnings of theIndian workforce have increased in general during the 1990s, the growth in wages has not beencommensurate with overall economic growth, and large variation in wage rates are observed acrossdifferent segments of the labour markets. Low average wages and increasing wage differentials acrossdifferent segments of the labour market have led the benefits of the recent economic growth toconcentrate among the most secured job holders. A large section of the labour force, particularly dailywage earners and part of the self-employed, continue to face poverty. NCEUS (2007, p. 24) notes thathigh incidence of poverty among workers 'is an indicator of inadequate income levels and the extentof vulnerability of workers'. In the literature, poverty among the employed has generated great interestamong different researchers in recent years. Much of this concern, in fact, arises with respect toinequitable distribution of the fruits of development. In general, this lot of the working population hasbeen referred to as the 'labouring poor' and/or the 'working poor' (Sundaram and Tendulkar, 2002).They have been termed so mainly because despite being employed, their earnings are not sufficient tofight poverty.
Different estimates show that the proportion of the working poor to the total poor populationin India has been around 35 per cent, while the headcount ratio (HCR) of poverty among the working
4 The Planning Commission estimates show a high decline of 10 percentage points in rural poverty from 36 per cent in 1991 to26 per cent in 2001. Sundaram and Tendulkar's initial estimates (2001) also showed a 8.2 percentage point decline at the all Indialevel. Deaton and Dreze (2002) also show a decline of around 7 percentage points. These estimates were based on adjusted NSS(1999-2000) data in order to make it more comparable with the previous rounds.
5 Since major sources of data on consumption expenditure collected by the National Sample Survey Organization (NSSO) has lostdirect comparability in 1999-2000 with that of earlier years (Sundaram and Tendulkar, 2001; Deaton and Dreze, 2002; Sen andHimanshu, 2004; Mazumdar and Sarkar, 2004), the recent debate has been rather inconclusive, and the focus of debate has shiftedfrom comparing poverty trends to comparing levels of wages and earnings of the Indian workforce.
6 For a recent review, see Kingdon (1998).
5ILO Subregional Office for South Asia, New Delhi
population is around 30 per cent (Sundaram and Tendulkar, 2002). Further, it has been well documentedin literature that among different types of workers in India, the poverty ratio is the highest among casuallabourers (See, for example, Bhalla, Karan and Shobha, 2006) constituting the bulk of the total workingpoor. These two studies, however, use the NSSO data up to 1999-2000 and no similar estimates areavailable after that. NCEUS, (2007), utilizing the NSSO data from 2004-05, documents widespreadpoverty among unorganized sector workers. In any case, most of these studies note reduction not onlyin poverty ratio, but also the headcount of poverty among the workers in general and casual workersin particular, over the years. However, the existing literature mostly focuses on estimating the headcountratio and number of working poor and does not adequately address the issue of differential changes inpoverty reduction across different types of workers. In general, there may be a high correlation betweenrate of poverty reduction and growth of wages and earnings across different segments of workers.
3. Structure of employment in India
Broadly, the working population is divided into two main components - wage labour and non-wage labour. Wage labour consists of regular salary/wage earners and casual labourers. The non-wagecomponent consists of self-employed persons, which includes own-account workers, employers, andunpaid family workers. Regular paid employment can be considered as secure (Dickens and Lang, 1985),and self-employment as fairly secure, even though incomes from certain types of self-employment maybe irregular, inadequate, and uncertain. But for the typical casual worker, neither employment nor incomeis certain (Bhalla, 2002; Sundaram and Tendulkar, 2006).
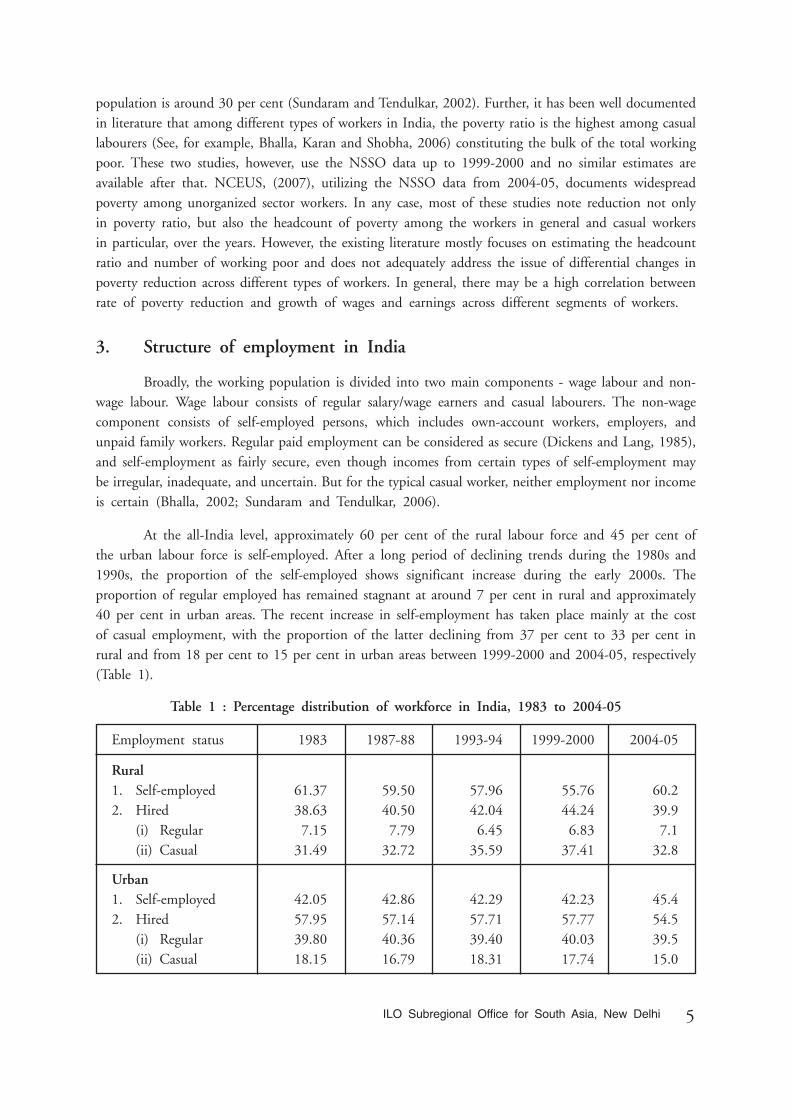
At the all-India level, approximately 60 per cent of the rural labour force and 45 per cent ofthe urban labour force is self-employed. After a long period of declining trends during the 1980s and1990s, the proportion of the self-employed shows significant increase during the early 2000s. Theproportion of regular employed has remained stagnant at around 7 per cent in rural and approximately40 per cent in urban areas. The recent increase in self-employment has taken place mainly at the costof casual employment, with the proportion of the latter declining from 37 per cent to 33 per cent inrural and from 18 per cent to 15 per cent in urban areas between 1999-2000 and 2004-05, respectively(Table 1).
Table 1 : Percentage distribution of workforce in India, 1983 to 2004-05
Employment status 1983 1987-88 1993-94 1999-2000 2004-05
Rural1. Self-employed 61.37 59.50 57.96 55.76 60.22. Hired 38.63 40.50 42.04 44.24 39.9
(i) Regular 7.15 7.79 6.45 6.83 7.1(ii) Casual 31.49 32.72 35.59 37.41 32.8
Urban1. Self-employed 42.05 42.86 42.29 42.23 45.42. Hired 57.95 57.14 57.71 57.77 54.5
(i) Regular 39.80 40.36 39.40 40.03 39.5(ii) Casual 18.15 16.79 18.31 17.74 15.0
6 ILO Subregional Office for South Asia, New Delhi
Though the proportion of self-employed in the Indian workforce shows a long term decliningtrend over the years, this group still constitutes the single largest share. This section of the workforcedoes not operate in the labour market for wages or earnings, but earn profits out of their own enterprises.A small proportion of them are exclusively employers, while a large section of them work as owners/employers cum workers. Further, an overwhelming proportion of these self-employed workers are smalland petty business holders, including small and marginal farmers, and many a time, their earning levelsare as low as those of casual workers. A large section of the self-employed persons resort to casual labourwork in order to supplement household income (Bhalla, Karan and Shobha, 2006). Needless to say, thelevel of earnings of most of the self-employed workers in the organized sector is much higher than thosein the unorganized sector.
The most dismal state of affairs in the Indian labour market can be located in the category ofcasual wage labourers. While their work contract is terminated and renewed on a daily basis, poor workingconditions and low wages yield them only poverty. Casual wage labour is not a homogeneous groupof workers. Urban casual labourers are better placed in comparison to their rural counterparts becauseof better job opportunities in the urban informal sector. In rural areas, casual workers are engaged largelyin agriculture at subsistence wages.
Further, among these three broad segments of the labour market, regular job markets, particularlyin the organized sector, have strong and strict entry barriers based on various pre-qualifications of thelabour force. In contrast, a large proportion of the self-employed and casual workforce keeps oscillatingbetween the two, depending on the job availability in these two markets.
4. Trends in real daily wages/earnings
The distinguishing feature of labour market duality in India can be located in the wage structureof the workers. The dichotomy in the wage structure is brought out here first in terms of casual-regularand sectoral wages. Rural-urban dualism is the most overriding characteristic across all the segments.Male-female differentials are also discussed in each of the sections.
4.1 Regular and casual wages
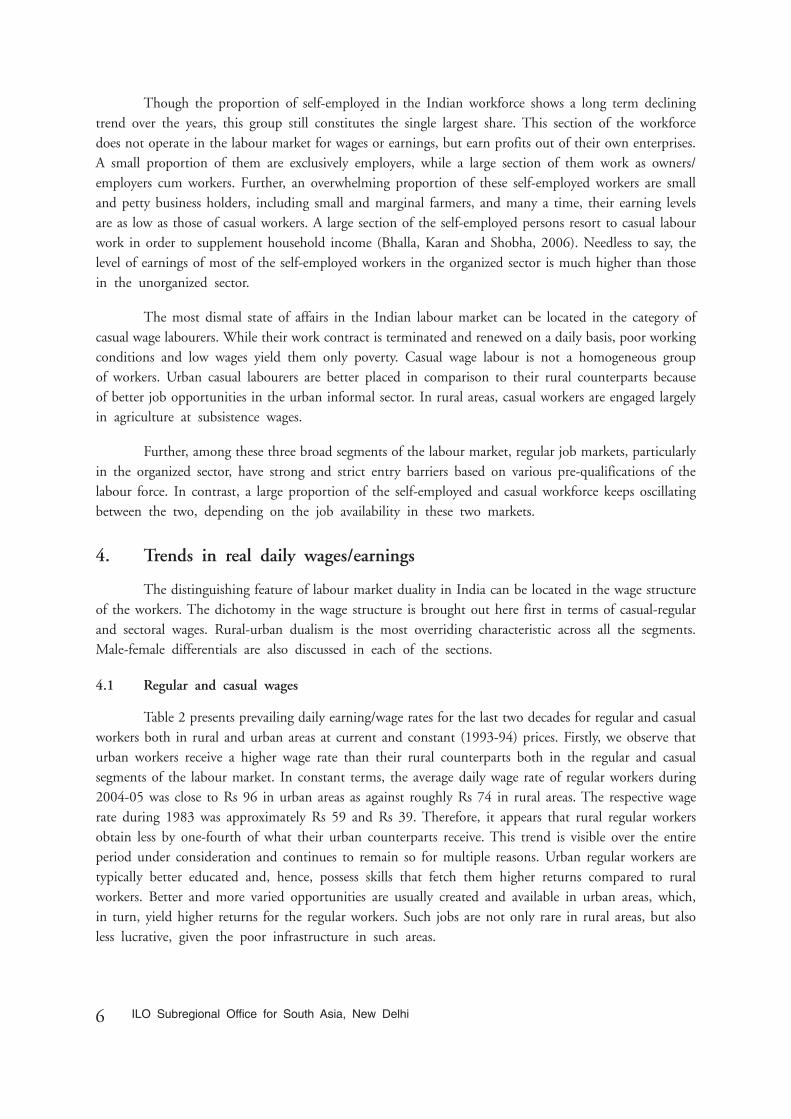
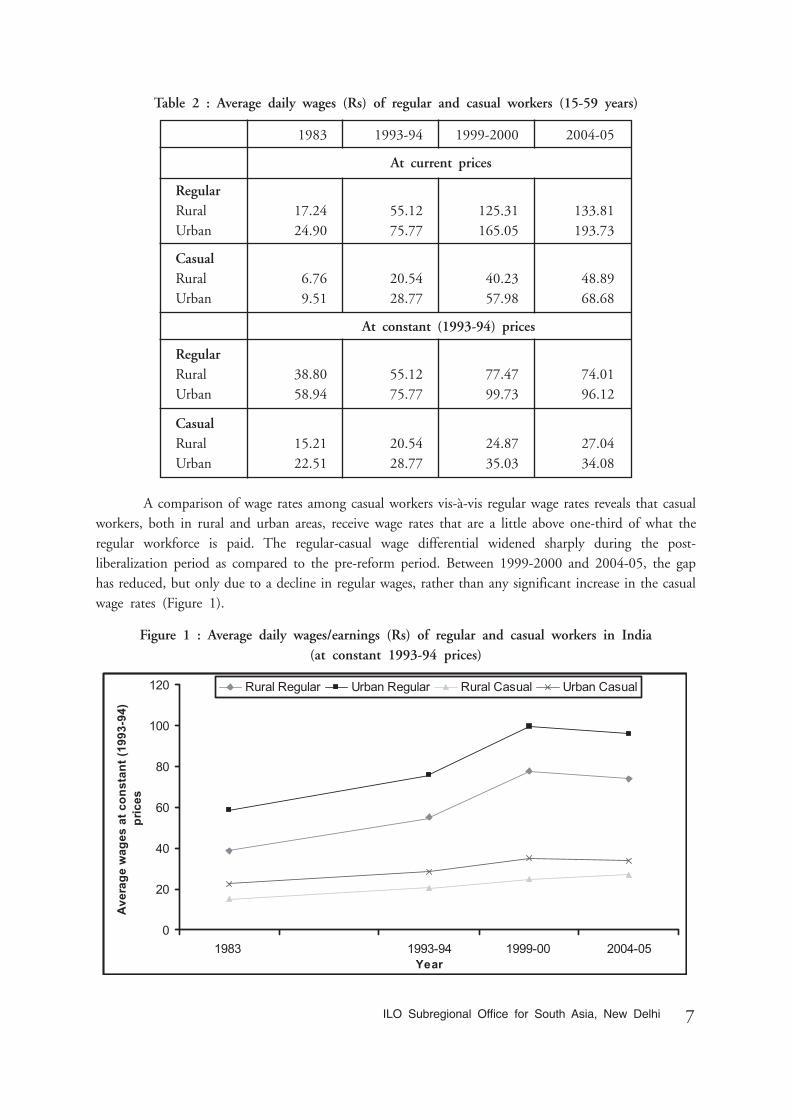
Table 2 presents prevailing daily earning/wage rates for the last two decades for regular and casualworkers both in rural and urban areas at current and constant (1993-94) prices. Firstly, we observe thaturban workers receive a higher wage rate than their rural counterparts both in the regular and casualsegments of the labour market. In constant terms, the average daily wage rate of regular workers during2004-05 was close to Rs 96 in urban areas as against roughly Rs 74 in rural areas. The respective wagerate during 1983 was approximately Rs 59 and Rs 39. Therefore, it appears that rural regular workersobtain less by one-fourth of what their urban counterparts receive. This trend is visible over the entireperiod under consideration and continues to remain so for multiple reasons. Urban regular workers aretypically better educated and, hence, possess skills that fetch them higher returns compared to ruralworkers. Better and more varied opportunities are usually created and available in urban areas, which,in turn, yield higher returns for the regular workers. Such jobs are not only rare in rural areas, but alsoless lucrative, given the poor infrastructure in such areas.
7ILO Subregional Office for South Asia, New Delhi
Table 2 : Average daily wages (Rs) of regular and casual workers (15-59 years)
1983 1993-94 1999-2000 2004-05
At current prices
RegularRural 17.24 55.12 125.31 133.81Urban 24.90 75.77 165.05 193.73
CasualRural 6.76 20.54 40.23 48.89Urban 9.51 28.77 57.98 68.68
At constant (1993-94) prices
RegularRural 38.80 55.12 77.47 74.01Urban 58.94 75.77 99.73 96.12
CasualRural 15.21 20.54 24.87 27.04Urban 22.51 28.77 35.03 34.08
A comparison of wage rates among casual workers vis-à-vis regular wage rates reveals that casualworkers, both in rural and urban areas, receive wage rates that are a little above one-third of what theregular workforce is paid. The regular-casual wage differential widened sharply during the post-liberalization period as compared to the pre-reform period. Between 1999-2000 and 2004-05, the gaphas reduced, but only due to a decline in regular wages, rather than any significant increase in the casualwage rates (Figure 1).
Figure 1 : Average daily wages/earnings (Rs) of regular and casual workers in India(at constant 1993-94 prices)
Figure 1: Average daily wages/earnings (Rs) of regular and casual workers in India
(at constant 1993-94 prices)
0
20
40
60
80
100
120
50-4002 00-999149-3991 3891Year
Ave
rage
wag
es a
t con
stan
t (19
93-9
4)
pric
es
Rural Regular Urban Regular Rural Casual Urban Casual
8 ILO Subregional Office for South Asia, New Delhi
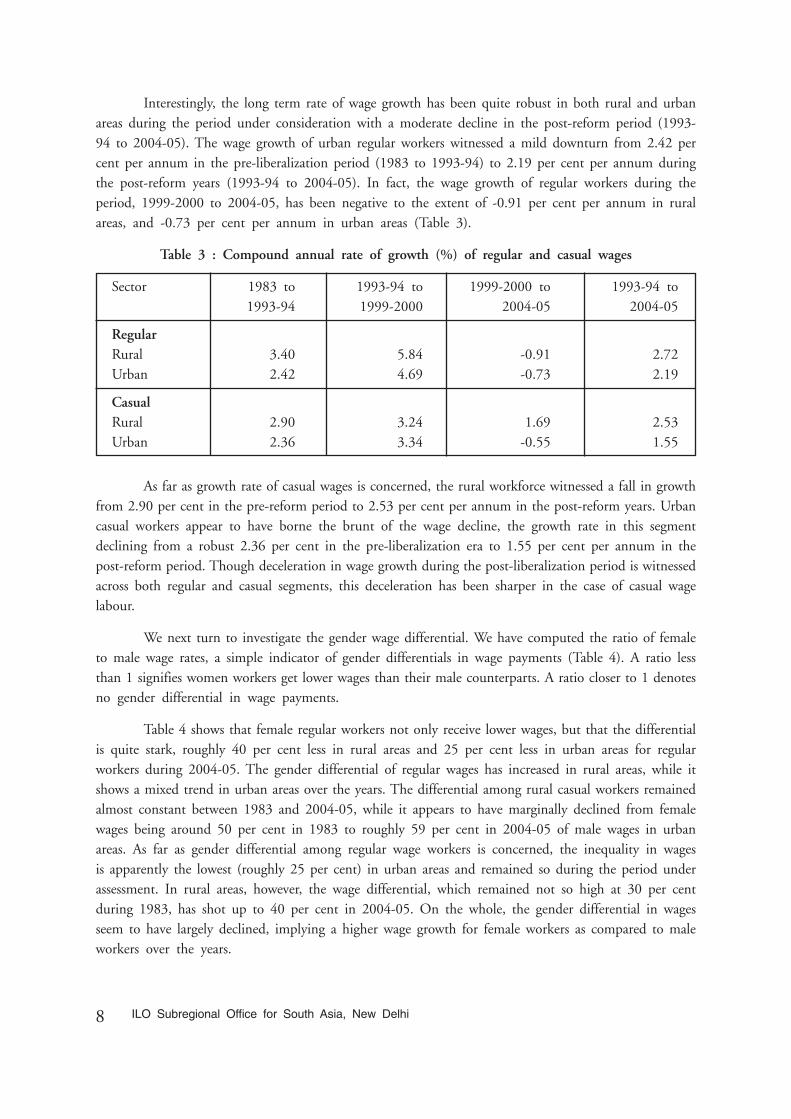
Interestingly, the long term rate of wage growth has been quite robust in both rural and urbanareas during the period under consideration with a moderate decline in the post-reform period (1993-94 to 2004-05). The wage growth of urban regular workers witnessed a mild downturn from 2.42 percent per annum in the pre-liberalization period (1983 to 1993-94) to 2.19 per cent per annum duringthe post-reform years (1993-94 to 2004-05). In fact, the wage growth of regular workers during theperiod, 1999-2000 to 2004-05, has been negative to the extent of -0.91 per cent per annum in ruralareas, and -0.73 per cent per annum in urban areas (Table 3).
Table 3 : Compound annual rate of growth (%) of regular and casual wages
Sector 1983 to 1993-94 to 1999-2000 to 1993-94 to1993-94 1999-2000 2004-05 2004-05
RegularRural 3.40 5.84 -0.91 2.72Urban 2.42 4.69 -0.73 2.19
CasualRural 2.90 3.24 1.69 2.53Urban 2.36 3.34 -0.55 1.55
As far as growth rate of casual wages is concerned, the rural workforce witnessed a fall in growthfrom 2.90 per cent in the pre-reform period to 2.53 per cent per annum in the post-reform years. Urbancasual workers appear to have borne the brunt of the wage decline, the growth rate in this segmentdeclining from a robust 2.36 per cent in the pre-liberalization era to 1.55 per cent per annum in thepost-reform period. Though deceleration in wage growth during the post-liberalization period is witnessedacross both regular and casual segments, this deceleration has been sharper in the case of casual wagelabour.
We next turn to investigate the gender wage differential. We have computed the ratio of femaleto male wage rates, a simple indicator of gender differentials in wage payments (Table 4). A ratio lessthan 1 signifies women workers get lower wages than their male counterparts. A ratio closer to 1 denotesno gender differential in wage payments.
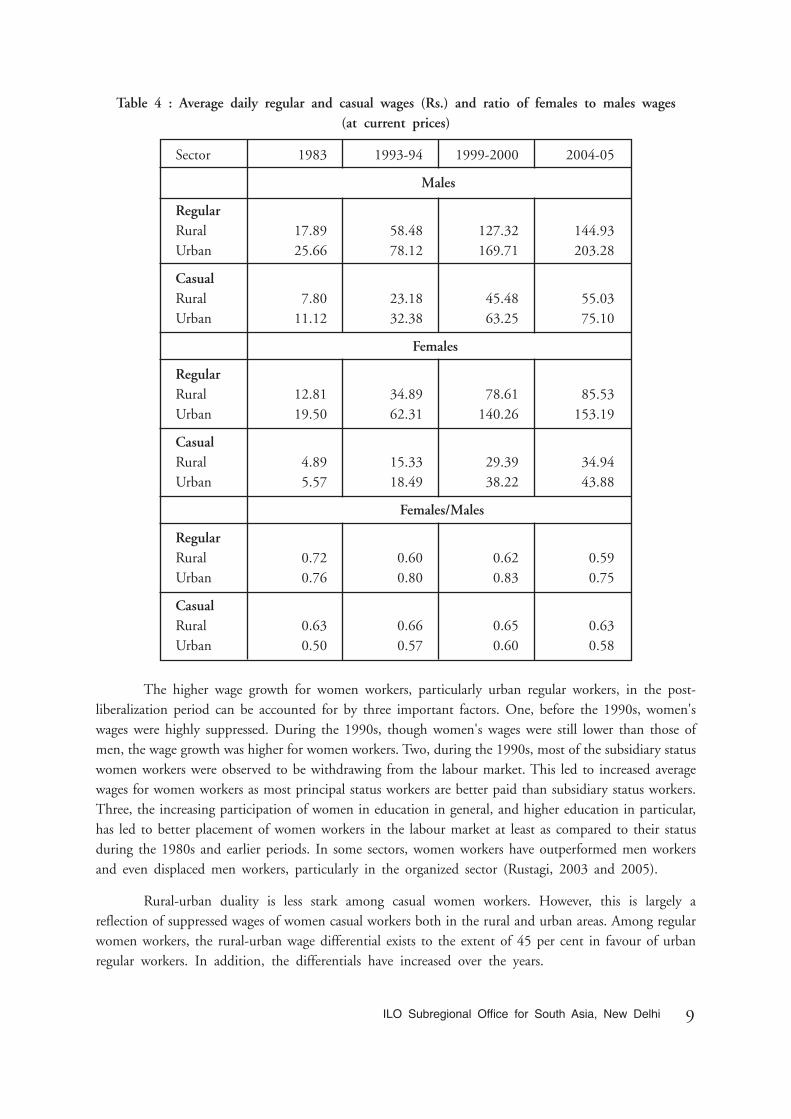
Table 4 shows that female regular workers not only receive lower wages, but that the differentialis quite stark, roughly 40 per cent less in rural areas and 25 per cent less in urban areas for regularworkers during 2004-05. The gender differential of regular wages has increased in rural areas, while itshows a mixed trend in urban areas over the years. The differential among rural casual workers remainedalmost constant between 1983 and 2004-05, while it appears to have marginally declined from femalewages being around 50 per cent in 1983 to roughly 59 per cent in 2004-05 of male wages in urbanareas. As far as gender differential among regular wage workers is concerned, the inequality in wagesis apparently the lowest (roughly 25 per cent) in urban areas and remained so during the period underassessment. In rural areas, however, the wage differential, which remained not so high at 30 per centduring 1983, has shot up to 40 per cent in 2004-05. On the whole, the gender differential in wagesseem to have largely declined, implying a higher wage growth for female workers as compared to maleworkers over the years.
9ILO Subregional Office for South Asia, New Delhi
Table 4 : Average daily regular and casual wages (Rs.) and ratio of females to males wages(at current prices)
Sector 1983 1993-94 1999-2000 2004-05
Males
RegularRural 17.89 58.48 127.32 144.93Urban 25.66 78.12 169.71 203.28
CasualRural 7.80 23.18 45.48 55.03Urban 11.12 32.38 63.25 75.10
Females
RegularRural 12.81 34.89 78.61 85.53Urban 19.50 62.31 140.26 153.19
CasualRural 4.89 15.33 29.39 34.94Urban 5.57 18.49 38.22 43.88
Females/Males
RegularRural 0.72 0.60 0.62 0.59Urban 0.76 0.80 0.83 0.75
CasualRural 0.63 0.66 0.65 0.63Urban 0.50 0.57 0.60 0.58
The higher wage growth for women workers, particularly urban regular workers, in the post-liberalization period can be accounted for by three important factors. One, before the 1990s, women'swages were highly suppressed. During the 1990s, though women's wages were still lower than those ofmen, the wage growth was higher for women workers. Two, during the 1990s, most of the subsidiary statuswomen workers were observed to be withdrawing from the labour market. This led to increased averagewages for women workers as most principal status workers are better paid than subsidiary status workers.Three, the increasing participation of women in education in general, and higher education in particular,has led to better placement of women workers in the labour market at least as compared to their statusduring the 1980s and earlier periods. In some sectors, women workers have outperformed men workersand even displaced men workers, particularly in the organized sector (Rustagi, 2003 and 2005).
Rural-urban duality is less stark among casual women workers. However, this is largely areflection of suppressed wages of women casual workers both in the rural and urban areas. Among regularwomen workers, the rural-urban wage differential exists to the extent of 45 per cent in favour of urbanregular workers. In addition, the differentials have increased over the years.

10 ILO Subregional Office for South Asia, New Delhi
4.2 Sectoral daily wages
The sectoral structure of the daily earnings/wages exemplifies further segmentation in the Indianlabour market. In general, workers in the government and organized sectors of employment are muchbetter paid than their private and unorganized sector counterparts. The wage differentials across thesectors of employment are higher in the case of urban regular workers as against casual workers. Thiscan perhaps be explained by education and skill-level differences among regular workers on the one hand,and concentration of a large informal sector in urban areas on the other. During 2004-05, higher wagesare reported among sectors such as mining and quarrying; public utilities such as electricity, gas andwater supply; and services including health and education (Table 5). It must be noticed that the meanwage rates in these sectors are among the highest because most of the regular workers in these sectorsare employed in state-owned (Central, state and local-level government) enterprises.
Table 5 : Average daily earnings/wages (Rs) for regular and casual workers in urban India,2004-05 (at current prices)
Sectors Males Females Persons
RegularAgriculture 104.80 79.59 99.72Mining & quarrying 359.41 186.30 352.09Manufacturing (15-22) 113.22 65.58 107.54Manufacturing (23-37) 189.41 102.16 182.20Public utilities 340.51 233.34 333.66Construction 171.47 191.75 172.95Trade, hotels & restaurants 103.47 104.53 103.53Transport, etc. 207.57 278.41 210.85Services (65-74) 360.15 304.07 350.07Services (75-93) 265.72 205.35 247.94
CasualAgriculture 56.60 34.65 46.68Mining & quarrying 77.28 36.84 72.31Manufacturing (15-22) 64.42 38.30 59.52Manufacturing (23-37) 76.51 45.44 70.78Public utilities 85.89 45.98 81.27Construction 85.17 57.41 81.87Trade, hotels & restaurants 61.99 41.18 59.56Transport, etc. 82.06 39.12 81.48Services (65-74) 90.99 32.34 86.37Services (75-93) 68.57 47.16 55.66
Notes: Figures in parentheses are NIC codes.
It is no surprise that on an average, government-level jobs fetch decent wages. If we considerservices (comprising the education and health sectors) vis-à-vis trade, hotels and restaurants, the formeris largely under a government dispensation, while the latter falls under private and unorganized
11ILO Subregional Office for South Asia, New Delhi
dominance. The current wage rate in the former is one and a half times (roughly 70 per cent) higherthan in the latter. Therefore, in sectors that are dominated by the government, wage levels are drivenby them even in the presence of private players in that particular sector. But in other sectors such astrade, hotels and restaurants; construction; manufacturing, etc., the presence of the private informal sectorsteers wage levels and their growth, which is generally observed to be on the lower side.
However, the same does not hold true in the case of urban casual workers. The gap betweenthe lowest and highest mean wage rates is around 30 per cent. The average daily wage appears to bethe lowest in trade, hotels and restaurants (of around Rs 60) as against the highest wage rates of casualworkers in the service sector (of roughly Rs 86). It is also interesting to note that wages of casual workersengaged in government jobs are in fact higher and act as a benchmark wage among similar workers.
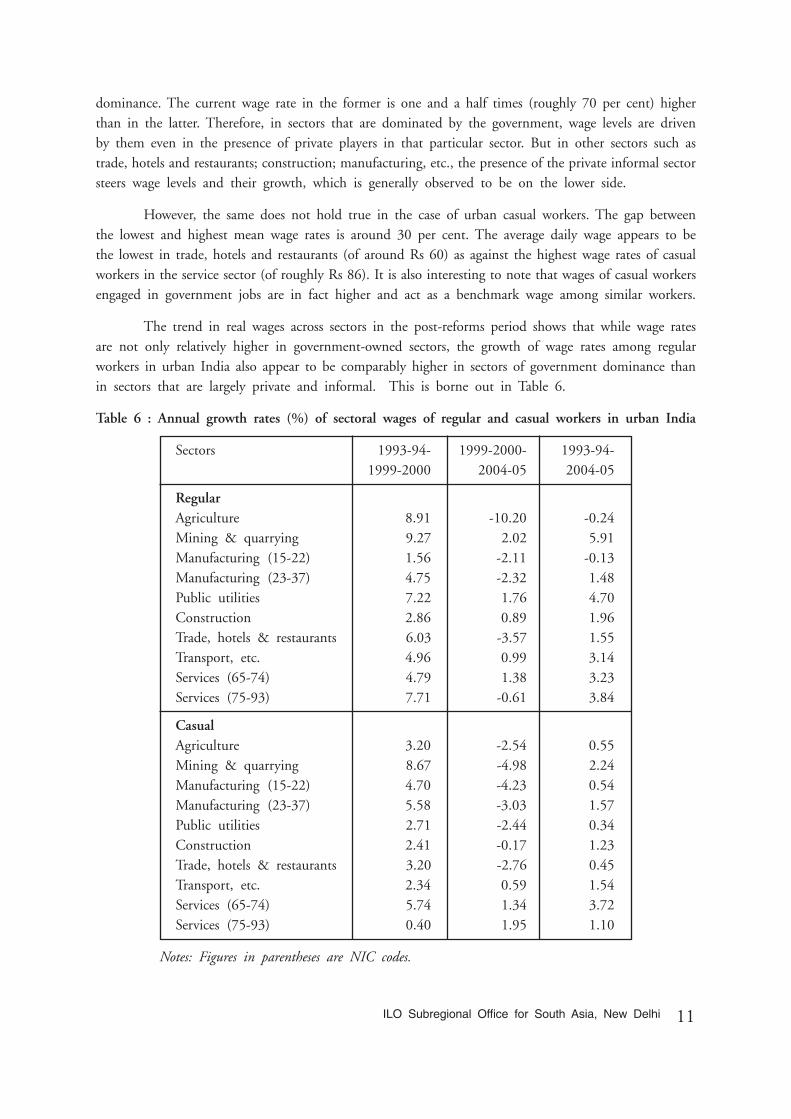
The trend in real wages across sectors in the post-reforms period shows that while wage ratesare not only relatively higher in government-owned sectors, the growth of wage rates among regularworkers in urban India also appear to be comparably higher in sectors of government dominance thanin sectors that are largely private and informal. This is borne out in Table 6.
Table 6 : Annual growth rates (%) of sectoral wages of regular and casual workers in urban India
Sectors 1993-94- 1999-2000- 1993-94-1999-2000 2004-05 2004-05
RegularAgriculture 8.91 -10.20 -0.24Mining & quarrying 9.27 2.02 5.91Manufacturing (15-22) 1.56 -2.11 -0.13Manufacturing (23-37) 4.75 -2.32 1.48Public utilities 7.22 1.76 4.70Construction 2.86 0.89 1.96Trade, hotels & restaurants 6.03 -3.57 1.55Transport, etc. 4.96 0.99 3.14Services (65-74) 4.79 1.38 3.23Services (75-93) 7.71 -0.61 3.84
CasualAgriculture 3.20 -2.54 0.55Mining & quarrying 8.67 -4.98 2.24Manufacturing (15-22) 4.70 -4.23 0.54Manufacturing (23-37) 5.58 -3.03 1.57Public utilities 2.71 -2.44 0.34Construction 2.41 -0.17 1.23Trade, hotels & restaurants 3.20 -2.76 0.45Transport, etc. 2.34 0.59 1.54Services (65-74) 5.74 1.34 3.72Services (75-93) 0.40 1.95 1.10
Notes: Figures in parentheses are NIC codes.

12 ILO Subregional Office for South Asia, New Delhi
In the post-reform years spanning 1993-94 to 2004-05, the highest growth in wage rates wererecorded in mining and quarrying, followed by public utilities and services, all these dominated largelyby government sectors. On the other hand, manufacturing wages appear to have declined sharply tonegative figures. Wage growth in trade, hotels and restaurants registered little more than 1.5 per centgrowth during the post-liberalization phase.
A similar trend is witnessed in the growth of inter-sectoral casual wages in urban India. Forurban casual workers, mining and quarrying and services are the only two sectors that show 2-3 percent annual growth rate in daily wages. In fact, except transport and services, all other sectors witnessednegative growth of daily wages during the period, 1999-2004. Although the growth for the entire post-reform period is positive, it has been negligible in most sectors. Most of these sectors are essentially privateand unorganized.
Agriculture and non-agriculture casual wages in rural India
Rural casual labour constitutes the single largest segment of the total workforce in India. Amongrural casual labourers, agricultural labourers occupy a predominant position. Due to this, the ruralagricultural wage rate is considered one of the most robust indicators of economic well-being, not onlyof agricultural labourers, but also the overall rural population (Deaton and Dreze, 2002). However,agricultural wages have not only been persistently lower than non-agricultural wages, the rate of increasein the former has lagged the latter (Figure 2). (For average daily wages in agriculture and non-agriculturein major states, see Appendix Table I).
Figure 2 : Average daily wages (Rs) of rural casual workers in farm and non-farm sectors(1983 to 2004-05) at constant 1993-94 prices
Figure 2 demonstrates that non-farm wages and their annual growth were higher than agriculturalwages during the period from 1983 to 1993-94, and this difference has only widened during the periodfrom 1993-94 to 2004-05. In fact, the higher rates of increase in the growth rates of casual wages during1993-94-1999-2000 (as discussed in the above paragraphs) are contributed to significantly by higher
Figure 2: Average daily wages (Rs) of rural casual workers in farm and non-farm
sectors ((1983 to 2004–05)) at constant 1993–94 pprices
0
5
10
15
20
25
30
35
40
50-4002 00-999149-3991 3891
Year
Ave
rage
cas
ual w
age
in r
ural
are
as a
t co
nsta
nt (1
993-
94) p
rice
s
Agriculture Non Agriculture

13ILO Subregional Office for South Asia, New Delhi
increase in the growth of non-agriculture wages; the growth of farm wages has decelerated during theentire post-reform period in comparison to the pre-reform period (Figure 2).
Among the various reasons for higher rise in real wages of non-agriculture activities are enhancedlabour productivity, public interventions through employment generation programmes, and betterimplementation of the Minimum Wages Act. In contrast, the agriculture sector continues to beovercrowded, leading to low labour productivity and poor implementation of the Minimum Wages Act.All these led to a lower growth in real wages in agriculture during the post-reform years (1993-94 to2004-05) as compared to that during the pre-reform period (Table 7).
Table 7 : Annual growth rates (%) of rural casual daily wages in farm and non-farm sectors
Sectors 1983 to 1993-94 to 1999-2000 to 1993 to1993-94 1999-2000 2004-05 2004
MalesAgriculture 2.50 2.48 1.23 1.91Non-agriculture 2.73 3.38 0.53 2.07
FemalesAgriculture 2.66 2.62 0.90 1.91Non-agriculture 3.17 4.74 1.37 2.07
The decline in the growth rates of agricultural wages during the post-liberalization years has beenhigher for female workers than for male workers. The ratio of rural agriculture to non-agriculture wagesfor male workers remained constant at around 0.70 throughout the period under consideration, but forfemale workers, it declined from 0.91 in 1983 to 0.75 in 2004-05. In fact, the increase in female non-farm wages has been steeper than male non-farm wages during the mid-1990s, leading to a higheragriculture-non-agriculture wage differential for female workers (Appendix Table II). The genderdifferential in farm and non-farm wage rates, and the annual growth therein, is clearly reflected in therespective female to male ratios of daily wages. While the female to male ratio of daily wages in agriculturehas remained constant at around 0.70 over the years, the ratio in non-agriculture has increased, indicatingdeclining gender differentials in this sector. Further, although the ratio of wages is less than one for allthe three points of time in agriculture as well as non-agriculture, the ratios of annual growth (Table7) is invariably more than one for all the segments (Appendix Table II).
Wages of casual workers in the informal sector
In view of the fast-expanding informal sector and informalization of workers in India, the dailywages of casual workers in the informal sector is an important factor that determines the standard ofliving, and extent and magnitude of poverty among casual workers in general, and urban casual workersin particular. Though the sectoral wages, as discussed in the foregoing section, provide enough evidenceto obtain an idea regarding informal sector wages, we have analysed the 1999-2000 non-agriculturalinformal sector enterprises data from the NSSO 55th round for a clearer understanding, particularlyfor informal sector casual wage earners.
The estimated average daily wage of casual workers in the informal sector in 1999-2000 is
14 ILO Subregional Office for South Asia, New Delhi
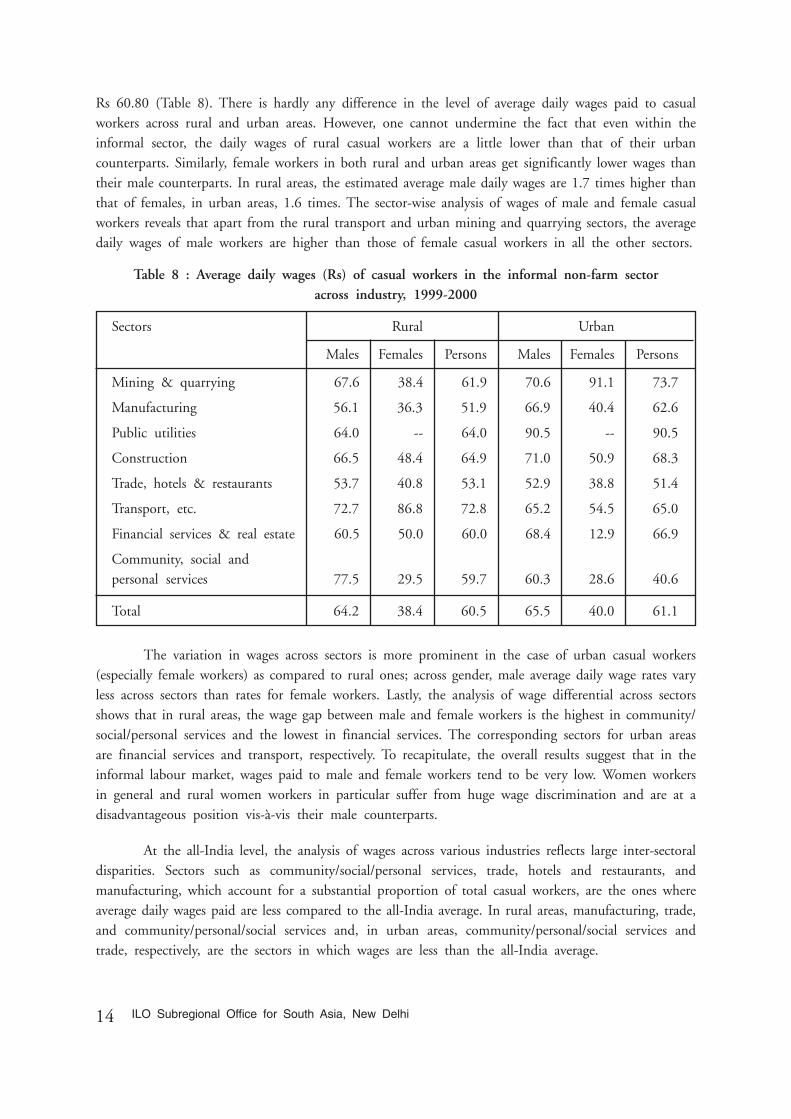
Rs 60.80 (Table 8). There is hardly any difference in the level of average daily wages paid to casualworkers across rural and urban areas. However, one cannot undermine the fact that even within theinformal sector, the daily wages of rural casual workers are a little lower than that of their urbancounterparts. Similarly, female workers in both rural and urban areas get significantly lower wages thantheir male counterparts. In rural areas, the estimated average male daily wages are 1.7 times higher thanthat of females, in urban areas, 1.6 times. The sector-wise analysis of wages of male and female casualworkers reveals that apart from the rural transport and urban mining and quarrying sectors, the averagedaily wages of male workers are higher than those of female casual workers in all the other sectors.
Table 8 : Average daily wages (Rs) of casual workers in the informal non-farm sectoracross industry, 1999-2000
Sectors Rural Urban
Males Females Persons Males Females Persons
Mining & quarrying 67.6 38.4 61.9 70.6 91.1 73.7
Manufacturing 56.1 36.3 51.9 66.9 40.4 62.6
Public utilities 64.0 -- 64.0 90.5 -- 90.5
Construction 66.5 48.4 64.9 71.0 50.9 68.3
Trade, hotels & restaurants 53.7 40.8 53.1 52.9 38.8 51.4
Transport, etc. 72.7 86.8 72.8 65.2 54.5 65.0
Financial services & real estate 60.5 50.0 60.0 68.4 12.9 66.9
Community, social andpersonal services 77.5 29.5 59.7 60.3 28.6 40.6
Total 64.2 38.4 60.5 65.5 40.0 61.1
The variation in wages across sectors is more prominent in the case of urban casual workers(especially female workers) as compared to rural ones; across gender, male average daily wage rates varyless across sectors than rates for female workers. Lastly, the analysis of wage differential across sectorsshows that in rural areas, the wage gap between male and female workers is the highest in community/social/personal services and the lowest in financial services. The corresponding sectors for urban areasare financial services and transport, respectively. To recapitulate, the overall results suggest that in theinformal labour market, wages paid to male and female workers tend to be very low. Women workersin general and rural women workers in particular suffer from huge wage discrimination and are at adisadvantageous position vis-à-vis their male counterparts.
At the all-India level, the analysis of wages across various industries reflects large inter-sectoraldisparities. Sectors such as community/social/personal services, trade, hotels and restaurants, andmanufacturing, which account for a substantial proportion of total casual workers, are the ones whereaverage daily wages paid are less compared to the all-India average. In rural areas, manufacturing, trade,and community/personal/social services and, in urban areas, community/personal/social services andtrade, respectively, are the sectors in which wages are less than the all-India average.
15ILO Subregional Office for South Asia, New Delhi
5. Education and social factors
As discussed in the beginning of this paper, an array of social and economic factors areresponsible for determining wage levels in developing countries. Though we have not attempted toreplicate the existing findings on the impact of these factors on wage determination, we have tried toshow the role of two important variables - education and social group affiliation of workers indetermining wage levels.
5.1 Wages across educational categories
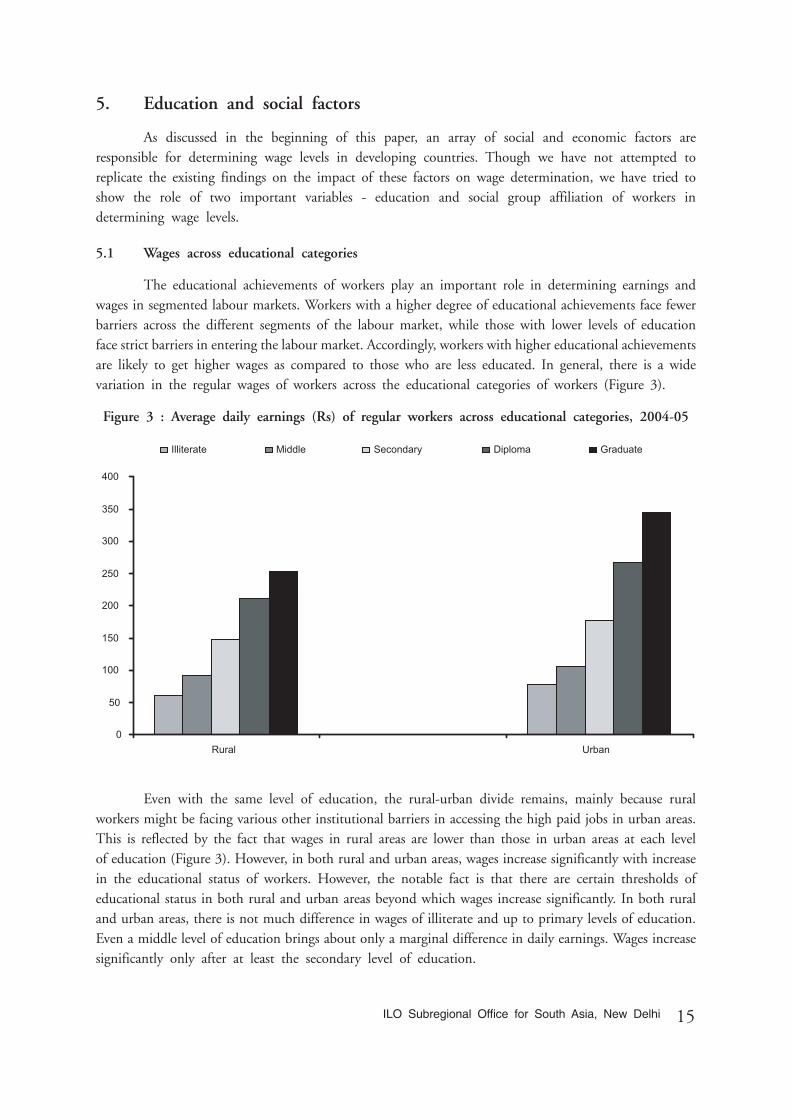
The educational achievements of workers play an important role in determining earnings andwages in segmented labour markets. Workers with a higher degree of educational achievements face fewerbarriers across the different segments of the labour market, while those with lower levels of educationface strict barriers in entering the labour market. Accordingly, workers with higher educational achievementsare likely to get higher wages as compared to those who are less educated. In general, there is a widevariation in the regular wages of workers across the educational categories of workers (Figure 3).
Figure 3 : Average daily earnings (Rs) of regular workers across educational categories, 2004-05
Even with the same level of education, the rural-urban divide remains, mainly because ruralworkers might be facing various other institutional barriers in accessing the high paid jobs in urban areas.This is reflected by the fact that wages in rural areas are lower than those in urban areas at each levelof education (Figure 3). However, in both rural and urban areas, wages increase significantly with increasein the educational status of workers. However, the notable fact is that there are certain thresholds ofeducational status in both rural and urban areas beyond which wages increase significantly. In both ruraland urban areas, there is not much difference in wages of illiterate and up to primary levels of education.Even a middle level of education brings about only a marginal difference in daily earnings. Wages increasesignificantly only after at least the secondary level of education.
0
50
100
150
200
250
300
350
400
Rural Urban
Illiterate Middle Secondary Diploma Graduate
16 ILO Subregional Office for South Asia, New Delhi
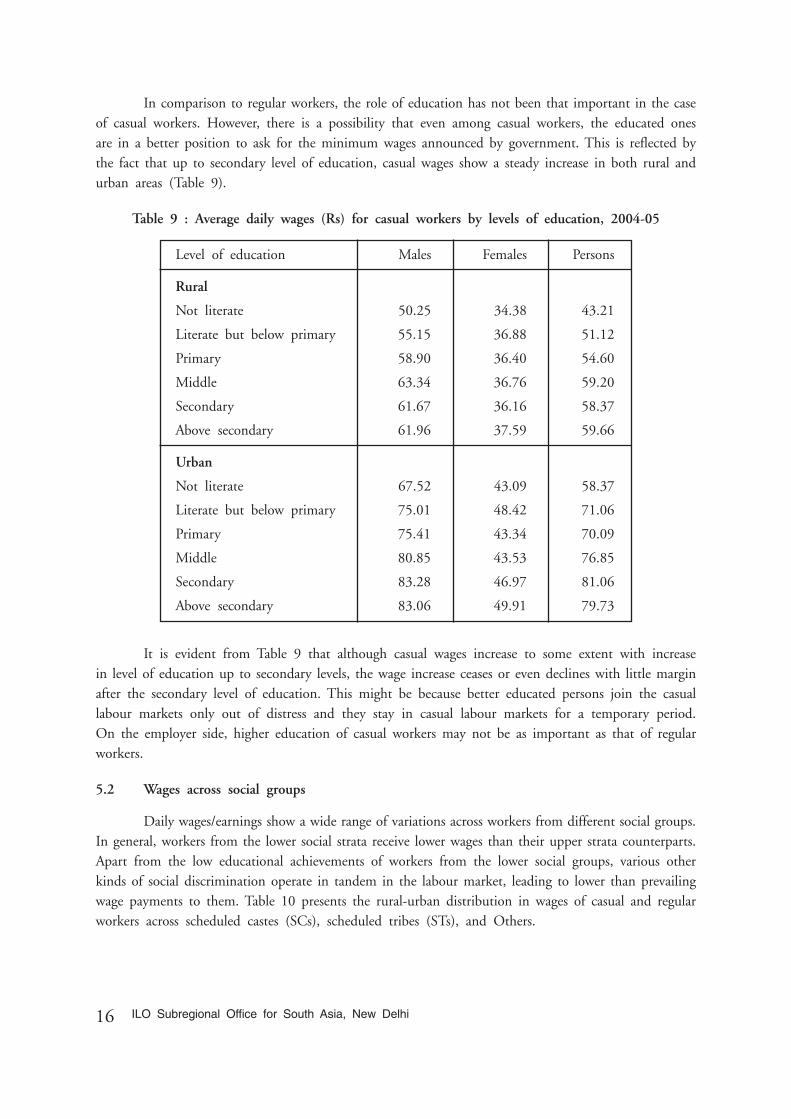
In comparison to regular workers, the role of education has not been that important in the caseof casual workers. However, there is a possibility that even among casual workers, the educated onesare in a better position to ask for the minimum wages announced by government. This is reflected bythe fact that up to secondary level of education, casual wages show a steady increase in both rural andurban areas (Table 9).
Table 9 : Average daily wages (Rs) for casual workers by levels of education, 2004-05
Level of education Males Females Persons
Rural
Not literate 50.25 34.38 43.21
Literate but below primary 55.15 36.88 51.12
Primary 58.90 36.40 54.60
Middle 63.34 36.76 59.20
Secondary 61.67 36.16 58.37
Above secondary 61.96 37.59 59.66
Urban
Not literate 67.52 43.09 58.37
Literate but below primary 75.01 48.42 71.06
Primary 75.41 43.34 70.09
Middle 80.85 43.53 76.85
Secondary 83.28 46.97 81.06
Above secondary 83.06 49.91 79.73
It is evident from Table 9 that although casual wages increase to some extent with increasein level of education up to secondary levels, the wage increase ceases or even declines with little marginafter the secondary level of education. This might be because better educated persons join the casuallabour markets only out of distress and they stay in casual labour markets for a temporary period.On the employer side, higher education of casual workers may not be as important as that of regularworkers.
5.2 Wages across social groups
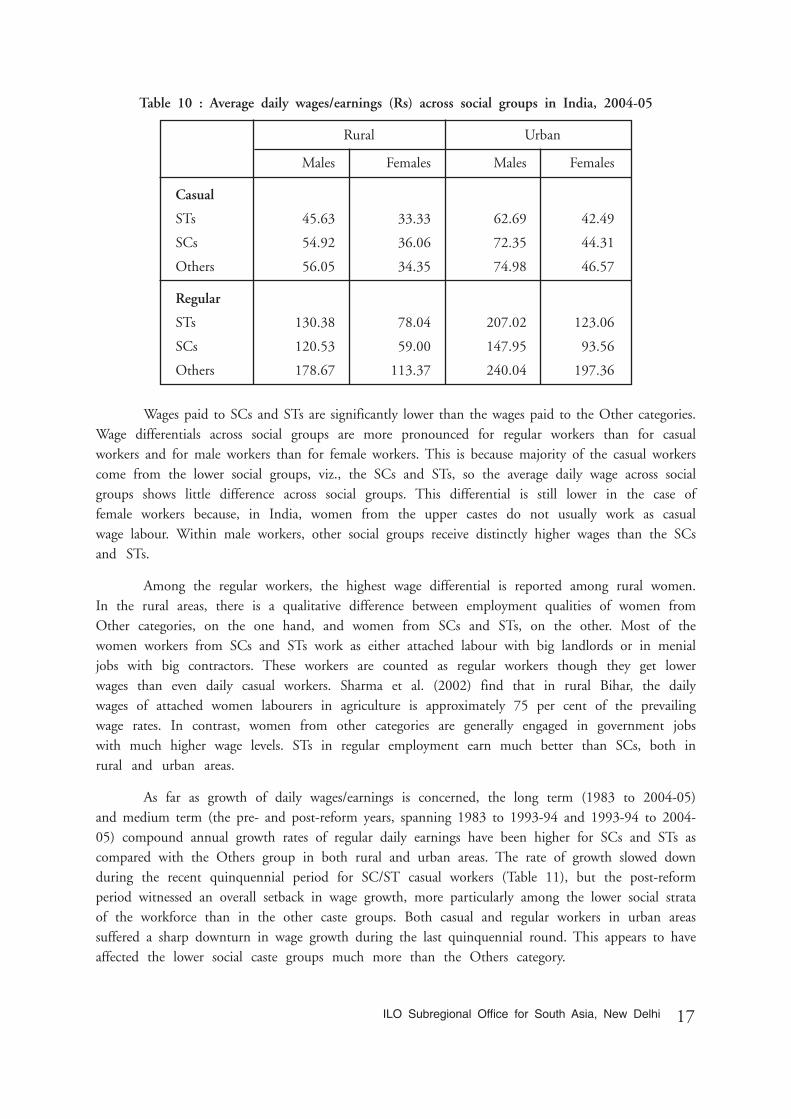
Daily wages/earnings show a wide range of variations across workers from different social groups.In general, workers from the lower social strata receive lower wages than their upper strata counterparts.Apart from the low educational achievements of workers from the lower social groups, various otherkinds of social discrimination operate in tandem in the labour market, leading to lower than prevailingwage payments to them. Table 10 presents the rural-urban distribution in wages of casual and regularworkers across scheduled castes (SCs), scheduled tribes (STs), and Others.
17ILO Subregional Office for South Asia, New Delhi
Table 10 : Average daily wages/earnings (Rs) across social groups in India, 2004-05
Rural Urban
Males Females Males Females
Casual
STs 45.63 33.33 62.69 42.49
SCs 54.92 36.06 72.35 44.31
Others 56.05 34.35 74.98 46.57
Regular
STs 130.38 78.04 207.02 123.06
SCs 120.53 59.00 147.95 93.56
Others 178.67 113.37 240.04 197.36
Wages paid to SCs and STs are significantly lower than the wages paid to the Other categories.Wage differentials across social groups are more pronounced for regular workers than for casualworkers and for male workers than for female workers. This is because majority of the casual workerscome from the lower social groups, viz., the SCs and STs, so the average daily wage across socialgroups shows little difference across social groups. This differential is still lower in the case offemale workers because, in India, women from the upper castes do not usually work as casualwage labour. Within male workers, other social groups receive distinctly higher wages than the SCsand STs.
Among the regular workers, the highest wage differential is reported among rural women.In the rural areas, there is a qualitative difference between employment qualities of women fromOther categories, on the one hand, and women from SCs and STs, on the other. Most of thewomen workers from SCs and STs work as either attached labour with big landlords or in menialjobs with big contractors. These workers are counted as regular workers though they get lowerwages than even daily casual workers. Sharma et al. (2002) find that in rural Bihar, the dailywages of attached women labourers in agriculture is approximately 75 per cent of the prevailingwage rates. In contrast, women from other categories are generally engaged in government jobswith much higher wage levels. STs in regular employment earn much better than SCs, both inrural and urban areas.
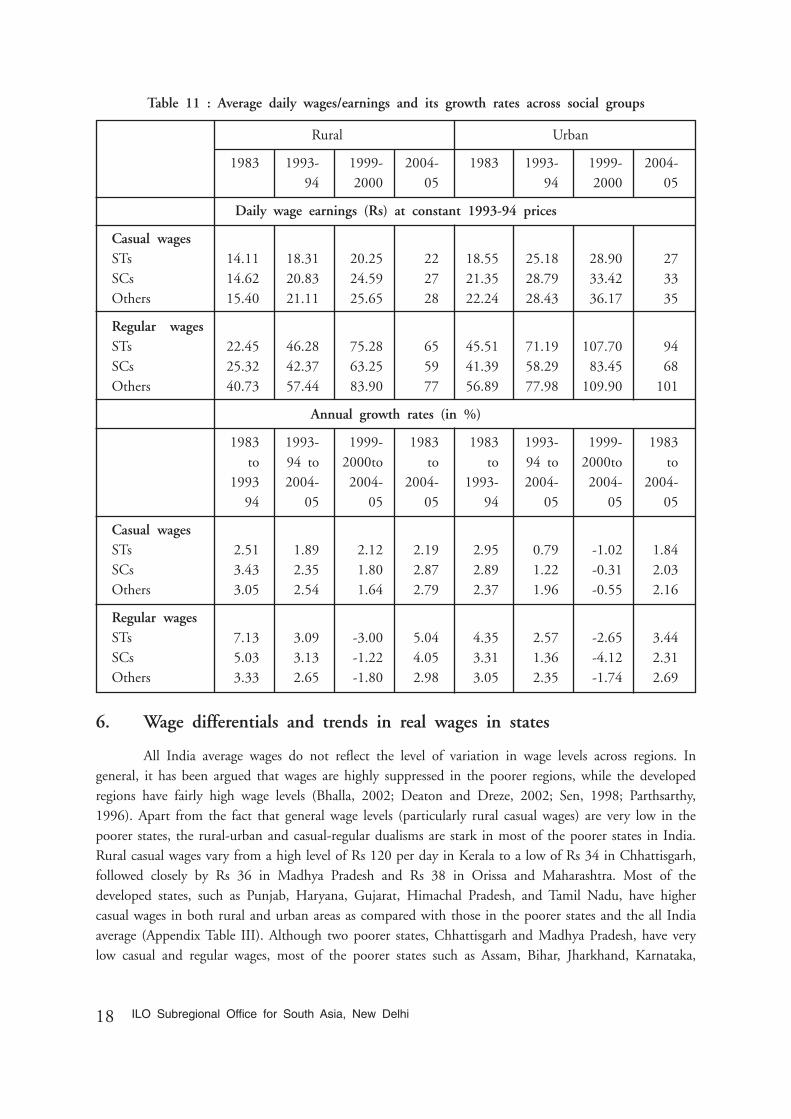
As far as growth of daily wages/earnings is concerned, the long term (1983 to 2004-05)and medium term (the pre- and post-reform years, spanning 1983 to 1993-94 and 1993-94 to 2004-05) compound annual growth rates of regular daily earnings have been higher for SCs and STs ascompared with the Others group in both rural and urban areas. The rate of growth slowed downduring the recent quinquennial period for SC/ST casual workers (Table 11), but the post-reformperiod witnessed an overall setback in wage growth, more particularly among the lower social strataof the workforce than in the other caste groups. Both casual and regular workers in urban areassuffered a sharp downturn in wage growth during the last quinquennial round. This appears to haveaffected the lower social caste groups much more than the Others category.
18 ILO Subregional Office for South Asia, New Delhi
Table 11 : Average daily wages/earnings and its growth rates across social groups
Rural Urban
1983 1993- 1999- 2004- 1983 1993- 1999- 2004-94 2000 05 94 2000 05
Daily wage earnings (Rs) at constant 1993-94 prices
Casual wagesSTs 14.11 18.31 20.25 22 18.55 25.18 28.90 27SCs 14.62 20.83 24.59 27 21.35 28.79 33.42 33Others 15.40 21.11 25.65 28 22.24 28.43 36.17 35
Regular wagesSTs 22.45 46.28 75.28 65 45.51 71.19 107.70 94SCs 25.32 42.37 63.25 59 41.39 58.29 83.45 68Others 40.73 57.44 83.90 77 56.89 77.98 109.90 101
Annual growth rates (in %)
1983 1993- 1999- 1983 1983 1993- 1999- 1983to 94 to 2000to to to 94 to 2000to to
1993 2004- 2004- 2004- 1993- 2004- 2004- 2004-94 05 05 05 94 05 05 05
Casual wagesSTs 2.51 1.89 2.12 2.19 2.95 0.79 -1.02 1.84SCs 3.43 2.35 1.80 2.87 2.89 1.22 -0.31 2.03Others 3.05 2.54 1.64 2.79 2.37 1.96 -0.55 2.16
Regular wagesSTs 7.13 3.09 -3.00 5.04 4.35 2.57 -2.65 3.44SCs 5.03 3.13 -1.22 4.05 3.31 1.36 -4.12 2.31Others 3.33 2.65 -1.80 2.98 3.05 2.35 -1.74 2.69
6. Wage differentials and trends in real wages in states
All India average wages do not reflect the level of variation in wage levels across regions. Ingeneral, it has been argued that wages are highly suppressed in the poorer regions, while the developedregions have fairly high wage levels (Bhalla, 2002; Deaton and Dreze, 2002; Sen, 1998; Parthsarthy,1996). Apart from the fact that general wage levels (particularly rural casual wages) are very low in thepoorer states, the rural-urban and casual-regular dualisms are stark in most of the poorer states in India.Rural casual wages vary from a high level of Rs 120 per day in Kerala to a low of Rs 34 in Chhattisgarh,followed closely by Rs 36 in Madhya Pradesh and Rs 38 in Orissa and Maharashtra. Most of thedeveloped states, such as Punjab, Haryana, Gujarat, Himachal Pradesh, and Tamil Nadu, have highercasual wages in both rural and urban areas as compared with those in the poorer states and the all Indiaaverage (Appendix Table III). Although two poorer states, Chhattisgarh and Madhya Pradesh, have verylow casual and regular wages, most of the poorer states such as Assam, Bihar, Jharkhand, Karnataka,
19ILO Subregional Office for South Asia, New Delhi
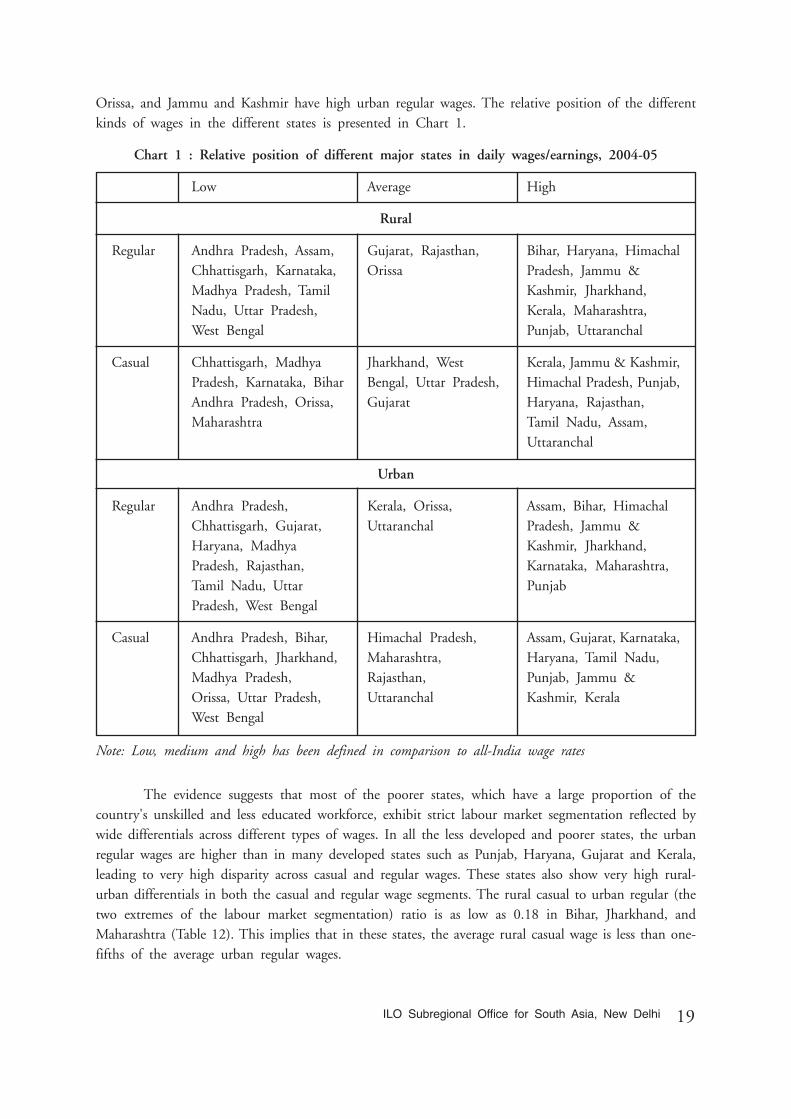
Orissa, and Jammu and Kashmir have high urban regular wages. The relative position of the differentkinds of wages in the different states is presented in Chart 1.
Chart 1 : Relative position of different major states in daily wages/earnings, 2004-05
Low Average High
Rural
Regular Andhra Pradesh, Assam, Gujarat, Rajasthan, Bihar, Haryana, HimachalChhattisgarh, Karnataka, Orissa Pradesh, Jammu &Madhya Pradesh, Tamil Kashmir, Jharkhand,Nadu, Uttar Pradesh, Kerala, Maharashtra,West Bengal Punjab, Uttaranchal
Casual Chhattisgarh, Madhya Jharkhand, West Kerala, Jammu & Kashmir,Pradesh, Karnataka, Bihar Bengal, Uttar Pradesh, Himachal Pradesh, Punjab,Andhra Pradesh, Orissa, Gujarat Haryana, Rajasthan,Maharashtra Tamil Nadu, Assam,
Uttaranchal
Urban
Regular Andhra Pradesh, Kerala, Orissa, Assam, Bihar, HimachalChhattisgarh, Gujarat, Uttaranchal Pradesh, Jammu &Haryana, Madhya Kashmir, Jharkhand,Pradesh, Rajasthan, Karnataka, Maharashtra,Tamil Nadu, Uttar PunjabPradesh, West Bengal
Casual Andhra Pradesh, Bihar, Himachal Pradesh, Assam, Gujarat, Karnataka,Chhattisgarh, Jharkhand, Maharashtra, Haryana, Tamil Nadu,Madhya Pradesh, Rajasthan, Punjab, Jammu &Orissa, Uttar Pradesh, Uttaranchal Kashmir, KeralaWest Bengal
Note: Low, medium and high has been defined in comparison to all-India wage rates
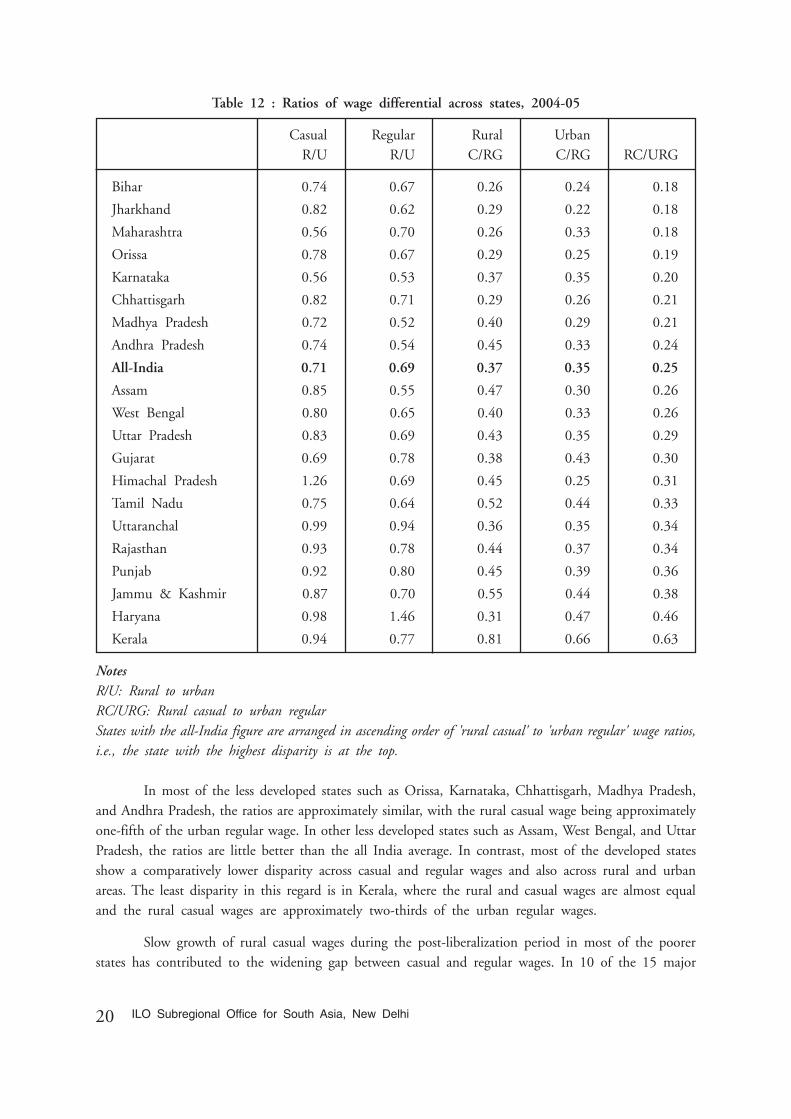
The evidence suggests that most of the poorer states, which have a large proportion of thecountry's unskilled and less educated workforce, exhibit strict labour market segmentation reflected bywide differentials across different types of wages. In all the less developed and poorer states, the urbanregular wages are higher than in many developed states such as Punjab, Haryana, Gujarat and Kerala,leading to very high disparity across casual and regular wages. These states also show very high rural-urban differentials in both the casual and regular wage segments. The rural casual to urban regular (thetwo extremes of the labour market segmentation) ratio is as low as 0.18 in Bihar, Jharkhand, andMaharashtra (Table 12). This implies that in these states, the average rural casual wage is less than one-fifths of the average urban regular wages.
20 ILO Subregional Office for South Asia, New Delhi
Table 12 : Ratios of wage differential across states, 2004-05
Casual Regular Rural UrbanR/U R/U C/RG C/RG RC/URG
Bihar 0.74 0.67 0.26 0.24 0.18
Jharkhand 0.82 0.62 0.29 0.22 0.18
Maharashtra 0.56 0.70 0.26 0.33 0.18
Orissa 0.78 0.67 0.29 0.25 0.19
Karnataka 0.56 0.53 0.37 0.35 0.20
Chhattisgarh 0.82 0.71 0.29 0.26 0.21
Madhya Pradesh 0.72 0.52 0.40 0.29 0.21
Andhra Pradesh 0.74 0.54 0.45 0.33 0.24
All-India 0.71 0.69 0.37 0.35 0.25
Assam 0.85 0.55 0.47 0.30 0.26
West Bengal 0.80 0.65 0.40 0.33 0.26
Uttar Pradesh 0.83 0.69 0.43 0.35 0.29
Gujarat 0.69 0.78 0.38 0.43 0.30
Himachal Pradesh 1.26 0.69 0.45 0.25 0.31
Tamil Nadu 0.75 0.64 0.52 0.44 0.33
Uttaranchal 0.99 0.94 0.36 0.35 0.34
Rajasthan 0.93 0.78 0.44 0.37 0.34
Punjab 0.92 0.80 0.45 0.39 0.36
Jammu & Kashmir 0.87 0.70 0.55 0.44 0.38
Haryana 0.98 1.46 0.31 0.47 0.46
Kerala 0.94 0.77 0.81 0.66 0.63
NotesR/U: Rural to urbanRC/URG: Rural casual to urban regularStates with the all-India figure are arranged in ascending order of 'rural casual' to 'urban regular' wage ratios,i.e., the state with the highest disparity is at the top.
In most of the less developed states such as Orissa, Karnataka, Chhattisgarh, Madhya Pradesh,and Andhra Pradesh, the ratios are approximately similar, with the rural casual wage being approximatelyone-fifth of the urban regular wage. In other less developed states such as Assam, West Bengal, and UttarPradesh, the ratios are little better than the all India average. In contrast, most of the developed statesshow a comparatively lower disparity across casual and regular wages and also across rural and urbanareas. The least disparity in this regard is in Kerala, where the rural and casual wages are almost equaland the rural casual wages are approximately two-thirds of the urban regular wages.
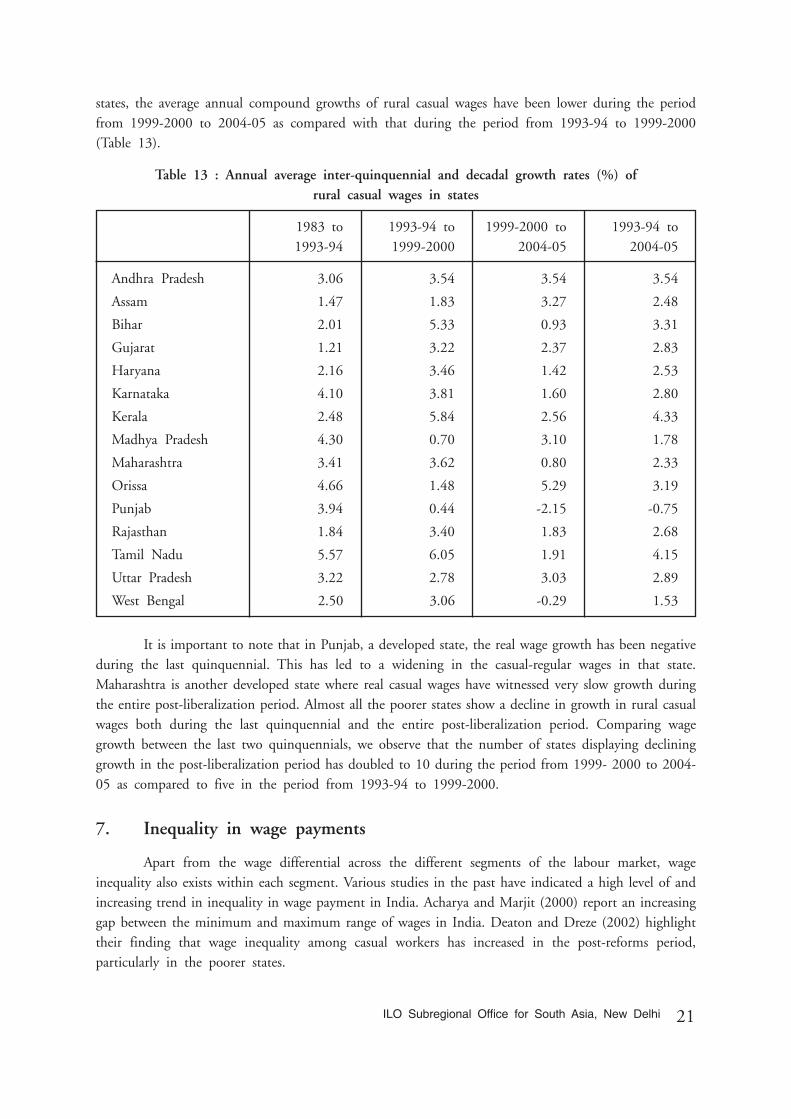
Slow growth of rural casual wages during the post-liberalization period in most of the poorerstates has contributed to the widening gap between casual and regular wages. In 10 of the 15 major
21ILO Subregional Office for South Asia, New Delhi
states, the average annual compound growths of rural casual wages have been lower during the periodfrom 1999-2000 to 2004-05 as compared with that during the period from 1993-94 to 1999-2000(Table 13).
Table 13 : Annual average inter-quinquennial and decadal growth rates (%) ofrural casual wages in states
1983 to 1993-94 to 1999-2000 to 1993-94 to1993-94 1999-2000 2004-05 2004-05
Andhra Pradesh 3.06 3.54 3.54 3.54
Assam 1.47 1.83 3.27 2.48
Bihar 2.01 5.33 0.93 3.31
Gujarat 1.21 3.22 2.37 2.83
Haryana 2.16 3.46 1.42 2.53
Karnataka 4.10 3.81 1.60 2.80
Kerala 2.48 5.84 2.56 4.33
Madhya Pradesh 4.30 0.70 3.10 1.78
Maharashtra 3.41 3.62 0.80 2.33
Orissa 4.66 1.48 5.29 3.19
Punjab 3.94 0.44 -2.15 -0.75
Rajasthan 1.84 3.40 1.83 2.68
Tamil Nadu 5.57 6.05 1.91 4.15
Uttar Pradesh 3.22 2.78 3.03 2.89
West Bengal 2.50 3.06 -0.29 1.53
It is important to note that in Punjab, a developed state, the real wage growth has been negativeduring the last quinquennial. This has led to a widening in the casual-regular wages in that state.Maharashtra is another developed state where real casual wages have witnessed very slow growth duringthe entire post-liberalization period. Almost all the poorer states show a decline in growth in rural casualwages both during the last quinquennial and the entire post-liberalization period. Comparing wagegrowth between the last two quinquennials, we observe that the number of states displaying declininggrowth in the post-liberalization period has doubled to 10 during the period from 1999- 2000 to 2004-05 as compared to five in the period from 1993-94 to 1999-2000.
7. Inequality in wage payments
Apart from the wage differential across the different segments of the labour market, wageinequality also exists within each segment. Various studies in the past have indicated a high level of andincreasing trend in inequality in wage payment in India. Acharya and Marjit (2000) report an increasinggap between the minimum and maximum range of wages in India. Deaton and Dreze (2002) highlighttheir finding that wage inequality among casual workers has increased in the post-reforms period,particularly in the poorer states.
22 ILO Subregional Office for South Asia, New Delhi
Galbraith et al. (2004) compute inequality measures using grouped data (grouped by industryand by industry and state) relating to earnings (calculated as the annual wage bill divided by the numberof workers) in the organized manufacturing sector. In a more recent study, Dutta (2005) calculatesinequality on the basis of individual record data and presents different types of measures of inequality;however, this analysis considers all types of workers taken together. In addition, it identifies various factorsassociated with wage inequality in India. However, none of these studies provide enough insights on theissue of wage inequality as most of these studies are either based on grouped data or do not provide enoughdis-aggregation in order to obtain a clear idea about inequality in different segments of the labour markets.
In the following section, we attempt to compute 'wage inequality measures' using data onindividual wage rates for all workers engaged in regular or casual wage employment separately and formale and female workers in all economic sectors, including agriculture, organized and unorganizedmanufacturing, and services. The levels of and trends in wage/earnings inequality among regular andcasual workers are examined by using Gini coefficient measures separately for rural and urban settings.
7.1 Trends in inequality
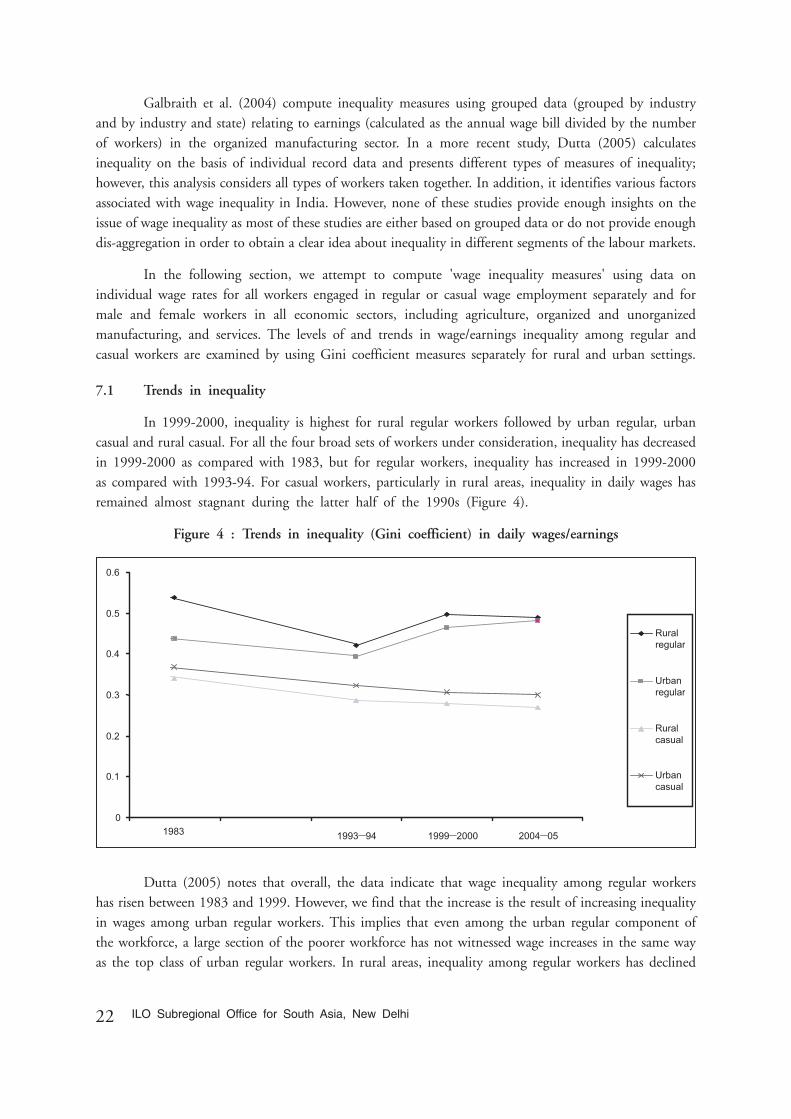
In 1999-2000, inequality is highest for rural regular workers followed by urban regular, urbancasual and rural casual. For all the four broad sets of workers under consideration, inequality has decreasedin 1999-2000 as compared with 1983, but for regular workers, inequality has increased in 1999-2000as compared with 1993-94. For casual workers, particularly in rural areas, inequality in daily wages hasremained almost stagnant during the latter half of the 1990s (Figure 4).
Figure 4 : Trends in inequality (Gini coefficient) in daily wages/earnings
Dutta (2005) notes that overall, the data indicate that wage inequality among regular workershas risen between 1983 and 1999. However, we find that the increase is the result of increasing inequalityin wages among urban regular workers. This implies that even among the urban regular component ofthe workforce, a large section of the poorer workforce has not witnessed wage increases in the same wayas the top class of urban regular workers. In rural areas, inequality among regular workers has declined
0
0.1
0.2
0.3
0.4
0.5
0.6
1983 1993–94 1999–2000 2004–05
Ruralregular
Urbanregular
Ruralcasual
Urbancasual

23ILO Subregional Office for South Asia, New Delhi
in 1999-2000 as compared with 1983, although it has increased as compared with 1993-94. This patternis reversed for casual workers, though there is some disagreement among the different measures ofinequality. However, in the post-reforms period (1993-94 to 1999-2000), there is no sign of increasinginequality in any significant way among casual workers, particularly among the rural casual workforce.The Gini coefficient has stagnated at around 0.27 in rural areas and 0.29 in urban areas for male casualworkers since the early 1990s. Among female casual workers, the inequality shows a marginal declinein rural areas in the post-reforms period. The inequality among rural casual female workers has alsodeclined from 0.31 in 1983 to 0.24 in 1999-2000.
7.2 Inequality in male and female wages
Most of the rise in inequality in the daily earnings of regular workers during the latter half ofthe 1990s is contributed by the increasing inequality among female regular workers in both rural andurban areas. During this period, the inequality in daily earnings of regular male workers has risenmarginally. Among rural casual workers, the sustained decline in inequality of daily wages for femaleworkers is worth noting (Table 14).
Table 14 : Measures of inequality (Gini coefficient) for regular and casualdaily wages/earnings, 1983 to 2004-05
1983 1993-94 1999-2000 2004-05
Persons
RegularRural 0.5378 0.4218 0.4985 0.4889Urban 0.4381 0.3928 0.4637 0.4815
CasualRural 0.3399 0.2851 0.2794 0.2706Urban 0.3688 0.3221 0.3078 0.3008
Males
RegularRural 0.5280 0.4028 0.4282 0.4661Urban 0.4290 0.3803 0.4527 0.4640
CasualRural 0.3235 0.2676 0.2651 0.2505Urban 0.3317 0.2917 0.2850 0.2762
Females
RegularRural 0.5743 0.4849 0.7546 0.5488Urban 0.4921 0.4570 0.5163 0.5463
CasualRural 0.3079 0.2538 0.2376 0.2316Urban 0.3277 0.3097 0.3080 0.2908
24 ILO Subregional Office for South Asia, New Delhi
The main reason for the decline in inequality of wages among rural casual female workers isthat earlier, casual wages for females were highly suppressed, and increasingly now, the gender bias inwages is coming down. As has been mentioned earlier, a recent phenomenon in this regard has beenthe gradual withdrawal of the subsidiary status female workforce from the labour market, where wageswere low, particularly in the poorer and less developed states. Essentially, this signifies the increasingshare of women workers in better paid jobs as compared with the earlier period. However, owing tothe withdrawal of the subsidiary status female workforce from the labour market, the overall female labourparticipation rate has declined and those who continue in the labour market work for comparativelyhigher wages.
8. Labour productivity and wages: Some links
Labour productivity is commonly defined as output per worker. Due to paucity of reliabledata on production and employment from the same source in India, conventionally, labour productivityis calculated as gross/net national/domestic product per worker. In this section, we follow a similarapproach to measure labour productivity and changes therein. In the Indian context, many scholarshave studied the relationship between employment, wages and labour productivity. Goldar (Goldar,2004) shows that the declining share of wages in registered manufacturing is due to a decline (rise)in the relative marginal productivity of labour (capital). In a recent study, Bhattacharya and Sakthivel(2005) find that employment elasticity with respect to output is positive, but negative with respectto wages. These findings are in accordance with mainstream economic literature. On the basis oforganized manufacturing sector data from the Annual Survey of Industries (ASI), Goldar (2005) findsthat during the post-reforms period, there has been a widening gap between labour productivity andwage rates.
At the all-India level, labour productivity (calculated in terms of gross/net domestic productper worker) has increased during the 1990s. Sundaram (2001) shows that between 1993-94 and 1999-2000, labour productivity increased significantly in most sectors, except construction. The poorperformance in construction has been attributed to the influx of workers to this sector in recent years.However, the increase in labour productivity has not been translated into increased wage share and/or increased growth in real wages, particularly for casual workers. Mahendra Dev (2002) notes that"changes in wage rates appear to lag behind changes in labour productivity, particularly for non-agricultural activities".
Firstly, we note that during the period from 1993-94 to 1999-2000, labour productivity grewat the rate of little more than 6 per cent per annum, but slowed down to approximately 3 per centbetween 1999-2000 and 2004-05. However, the average growth of productivity has been above 4 percent per annum during the entire post-reforms period. As against this, the real wages during the sameperiod grew at the rate of less than 2.5 per cent per annum (approximately 2 per cent per annum forregular workers and slightly more than 2.5 per cent per annum for casual workers). This clearly showsthat during the 1990s, the growth of wages and earnings of workers has lagged behind the growth oflabour productivity. Though some of the productivity gain during the 1990s has been passed on to regularworkers in the organized sector, casual and other unorganized sector workers have not benefited at all.
25ILO Subregional Office for South Asia, New Delhi
Among casual workers, urban women workers have realized somewhat better growth in daily wages,reflecting a significantly better sharing of increased labour productivity vis-à-vis their male counterparts.However, as mentioned earlier, much of the increased labour productivity is being shared by womenworkers at the cost of job loss.
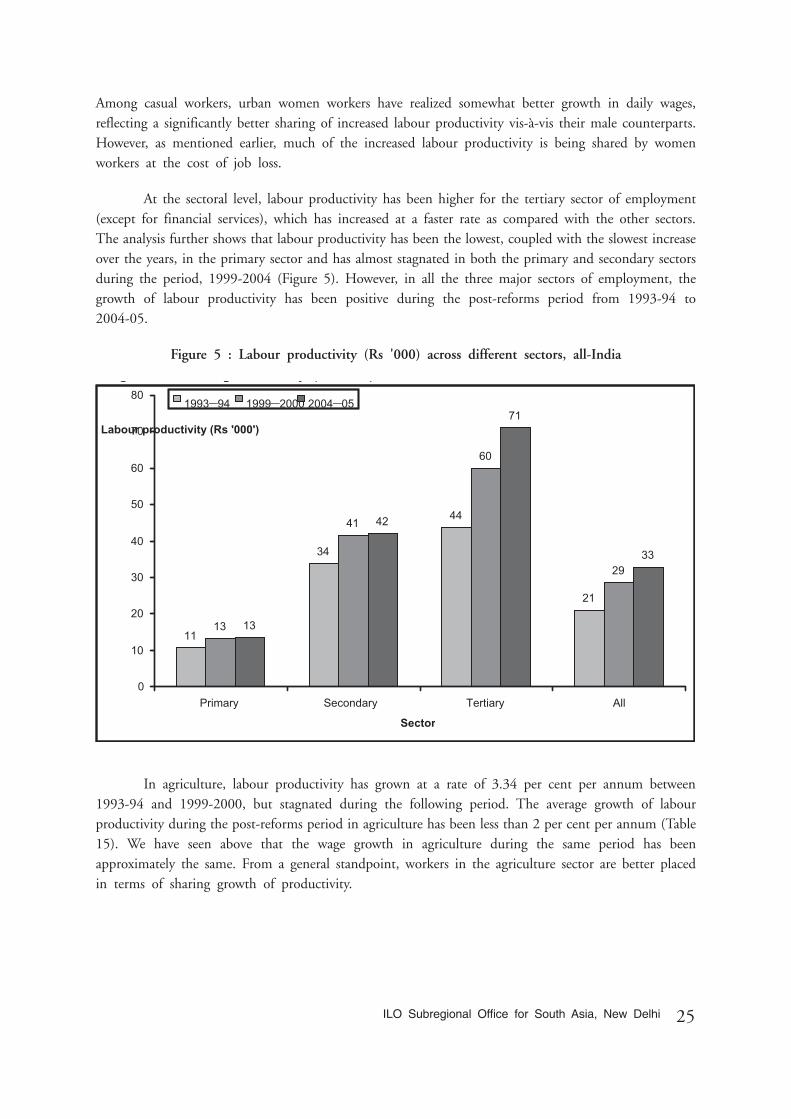
At the sectoral level, labour productivity has been higher for the tertiary sector of employment(except for financial services), which has increased at a faster rate as compared with the other sectors.The analysis further shows that labour productivity has been the lowest, coupled with the slowest increaseover the years, in the primary sector and has almost stagnated in both the primary and secondary sectorsduring the period, 1999-2004 (Figure 5). However, in all the three major sectors of employment, thegrowth of labour productivity has been positive during the post-reforms period from 1993-94 to2004-05.
Figure 5 : Labour productivity (Rs '000) across different sectors, all-India
In agriculture, labour productivity has grown at a rate of 3.34 per cent per annum between1993-94 and 1999-2000, but stagnated during the following period. The average growth of labourproductivity during the post-reforms period in agriculture has been less than 2 per cent per annum (Table15). We have seen above that the wage growth in agriculture during the same period has beenapproximately the same. From a general standpoint, workers in the agriculture sector are better placedin terms of sharing growth of productivity.
Figgure 5: Labour pproductivityy ((Rs ‘000)) across different sectors, all-India
11
34
44
21
13
41
60
29
13
42
71
33
0
10
20
30
40
50
60
70
80
Primary Secondary Tertiary All
Sector
Labour productivity (Rs '000')
1993–94 1999–2000 2004–05
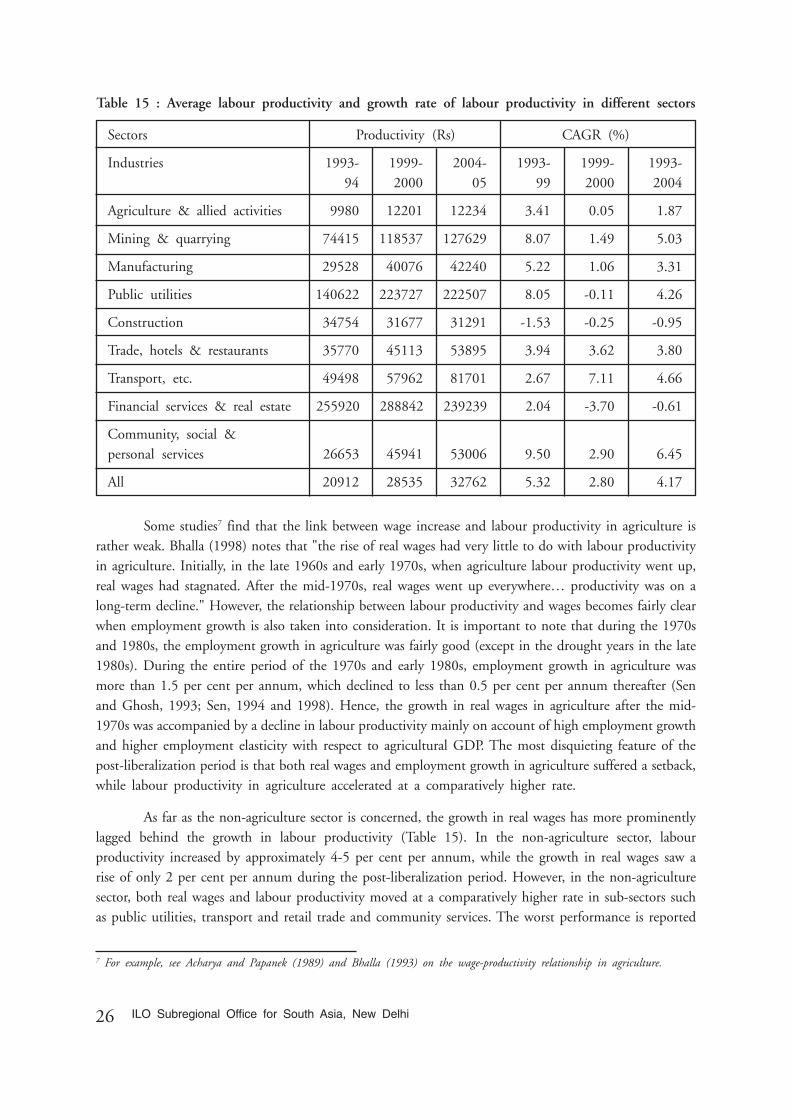
26 ILO Subregional Office for South Asia, New Delhi
Table 15 : Average labour productivity and growth rate of labour productivity in different sectors
Sectors Productivity (Rs) CAGR (%)
Industries 1993- 1999- 2004- 1993- 1999- 1993-94 2000 05 99 2000 2004
Agriculture & allied activities 9980 12201 12234 3.41 0.05 1.87
Mining & quarrying 74415 118537 127629 8.07 1.49 5.03
Manufacturing 29528 40076 42240 5.22 1.06 3.31
Public utilities 140622 223727 222507 8.05 -0.11 4.26
Construction 34754 31677 31291 -1.53 -0.25 -0.95
Trade, hotels & restaurants 35770 45113 53895 3.94 3.62 3.80
Transport, etc. 49498 57962 81701 2.67 7.11 4.66
Financial services & real estate 255920 288842 239239 2.04 -3.70 -0.61
Community, social &personal services 26653 45941 53006 9.50 2.90 6.45
All 20912 28535 32762 5.32 2.80 4.17
Some studies7 find that the link between wage increase and labour productivity in agriculture israther weak. Bhalla (1998) notes that "the rise of real wages had very little to do with labour productivityin agriculture. Initially, in the late 1960s and early 1970s, when agriculture labour productivity went up,real wages had stagnated. After the mid-1970s, real wages went up everywhere… productivity was on along-term decline." However, the relationship between labour productivity and wages becomes fairly clearwhen employment growth is also taken into consideration. It is important to note that during the 1970sand 1980s, the employment growth in agriculture was fairly good (except in the drought years in the late1980s). During the entire period of the 1970s and early 1980s, employment growth in agriculture wasmore than 1.5 per cent per annum, which declined to less than 0.5 per cent per annum thereafter (Senand Ghosh, 1993; Sen, 1994 and 1998). Hence, the growth in real wages in agriculture after the mid-1970s was accompanied by a decline in labour productivity mainly on account of high employment growthand higher employment elasticity with respect to agricultural GDP. The most disquieting feature of thepost-liberalization period is that both real wages and employment growth in agriculture suffered a setback,while labour productivity in agriculture accelerated at a comparatively higher rate.
As far as the non-agriculture sector is concerned, the growth in real wages has more prominentlylagged behind the growth in labour productivity (Table 15). In the non-agriculture sector, labourproductivity increased by approximately 4-5 per cent per annum, while the growth in real wages saw arise of only 2 per cent per annum during the post-liberalization period. However, in the non-agriculturesector, both real wages and labour productivity moved at a comparatively higher rate in sub-sectors suchas public utilities, transport and retail trade and community services. The worst performance is reported
7 For example, see Acharya and Papanek (1989) and Bhalla (1993) on the wage-productivity relationship in agriculture.
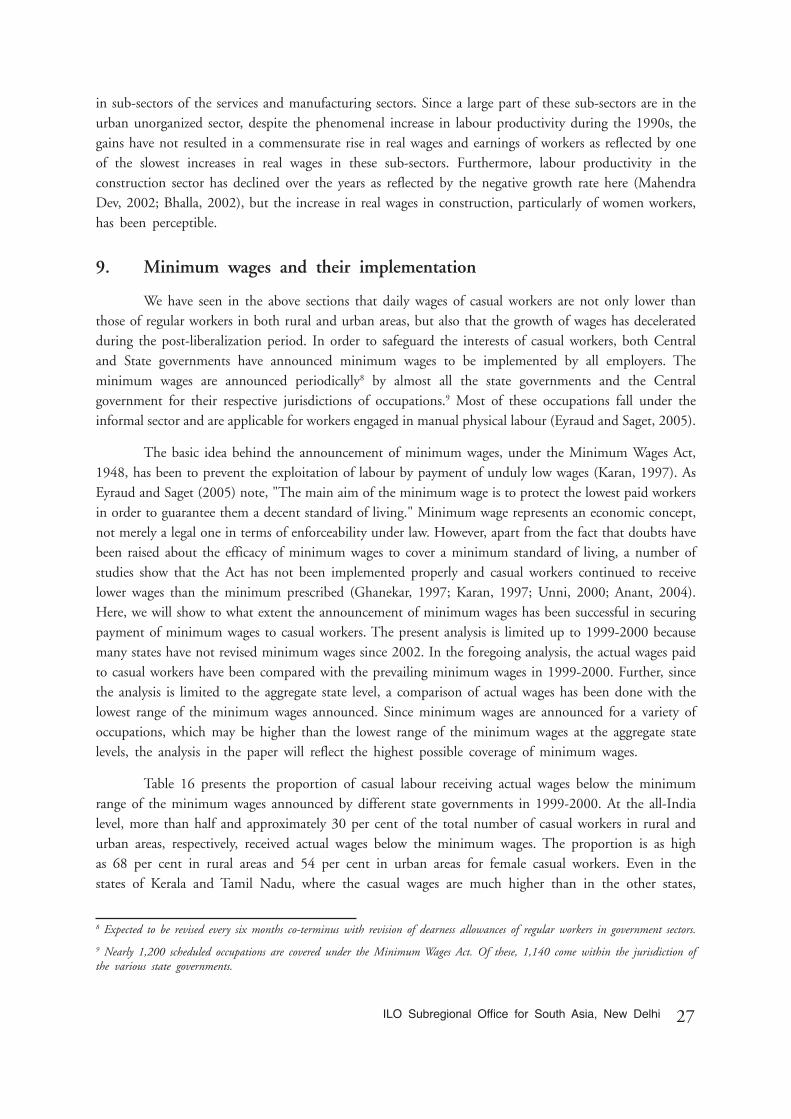
27ILO Subregional Office for South Asia, New Delhi
in sub-sectors of the services and manufacturing sectors. Since a large part of these sub-sectors are in theurban unorganized sector, despite the phenomenal increase in labour productivity during the 1990s, thegains have not resulted in a commensurate rise in real wages and earnings of workers as reflected by oneof the slowest increases in real wages in these sub-sectors. Furthermore, labour productivity in theconstruction sector has declined over the years as reflected by the negative growth rate here (MahendraDev, 2002; Bhalla, 2002), but the increase in real wages in construction, particularly of women workers,has been perceptible.
9. Minimum wages and their implementation
We have seen in the above sections that daily wages of casual workers are not only lower thanthose of regular workers in both rural and urban areas, but also that the growth of wages has deceleratedduring the post-liberalization period. In order to safeguard the interests of casual workers, both Centraland State governments have announced minimum wages to be implemented by all employers. Theminimum wages are announced periodically8 by almost all the state governments and the Centralgovernment for their respective jurisdictions of occupations.9 Most of these occupations fall under theinformal sector and are applicable for workers engaged in manual physical labour (Eyraud and Saget, 2005).
The basic idea behind the announcement of minimum wages, under the Minimum Wages Act,1948, has been to prevent the exploitation of labour by payment of unduly low wages (Karan, 1997). AsEyraud and Saget (2005) note, "The main aim of the minimum wage is to protect the lowest paid workersin order to guarantee them a decent standard of living." Minimum wage represents an economic concept,not merely a legal one in terms of enforceability under law. However, apart from the fact that doubts havebeen raised about the efficacy of minimum wages to cover a minimum standard of living, a number ofstudies show that the Act has not been implemented properly and casual workers continued to receivelower wages than the minimum prescribed (Ghanekar, 1997; Karan, 1997; Unni, 2000; Anant, 2004).Here, we will show to what extent the announcement of minimum wages has been successful in securingpayment of minimum wages to casual workers. The present analysis is limited up to 1999-2000 becausemany states have not revised minimum wages since 2002. In the foregoing analysis, the actual wages paidto casual workers have been compared with the prevailing minimum wages in 1999-2000. Further, sincethe analysis is limited to the aggregate state level, a comparison of actual wages has been done with thelowest range of the minimum wages announced. Since minimum wages are announced for a variety ofoccupations, which may be higher than the lowest range of the minimum wages at the aggregate statelevels, the analysis in the paper will reflect the highest possible coverage of minimum wages.
Table 16 presents the proportion of casual labour receiving actual wages below the minimumrange of the minimum wages announced by different state governments in 1999-2000. At the all-Indialevel, more than half and approximately 30 per cent of the total number of casual workers in rural andurban areas, respectively, received actual wages below the minimum wages. The proportion is as highas 68 per cent in rural areas and 54 per cent in urban areas for female casual workers. Even in thestates of Kerala and Tamil Nadu, where the casual wages are much higher than in the other states,
8 Expected to be revised every six months co-terminus with revision of dearness allowances of regular workers in government sectors.
9 Nearly 1,200 scheduled occupations are covered under the Minimum Wages Act. Of these, 1,140 come within the jurisdiction ofthe various state governments.
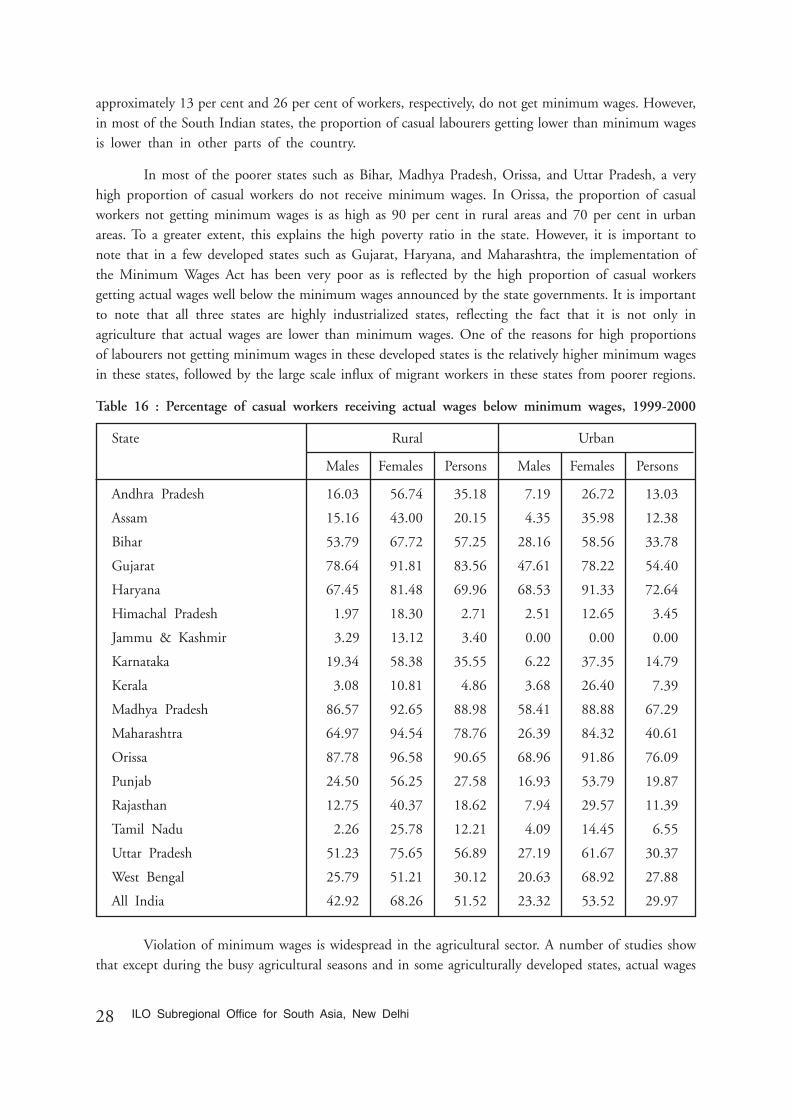
28 ILO Subregional Office for South Asia, New Delhi
approximately 13 per cent and 26 per cent of workers, respectively, do not get minimum wages. However,in most of the South Indian states, the proportion of casual labourers getting lower than minimum wagesis lower than in other parts of the country.
In most of the poorer states such as Bihar, Madhya Pradesh, Orissa, and Uttar Pradesh, a veryhigh proportion of casual workers do not receive minimum wages. In Orissa, the proportion of casualworkers not getting minimum wages is as high as 90 per cent in rural areas and 70 per cent in urbanareas. To a greater extent, this explains the high poverty ratio in the state. However, it is important tonote that in a few developed states such as Gujarat, Haryana, and Maharashtra, the implementation ofthe Minimum Wages Act has been very poor as is reflected by the high proportion of casual workersgetting actual wages well below the minimum wages announced by the state governments. It is importantto note that all three states are highly industrialized states, reflecting the fact that it is not only inagriculture that actual wages are lower than minimum wages. One of the reasons for high proportionsof labourers not getting minimum wages in these developed states is the relatively higher minimum wagesin these states, followed by the large scale influx of migrant workers in these states from poorer regions.
Table 16 : Percentage of casual workers receiving actual wages below minimum wages, 1999-2000
State Rural Urban
Males Females Persons Males Females Persons
Andhra Pradesh 16.03 56.74 35.18 7.19 26.72 13.03
Assam 15.16 43.00 20.15 4.35 35.98 12.38
Bihar 53.79 67.72 57.25 28.16 58.56 33.78
Gujarat 78.64 91.81 83.56 47.61 78.22 54.40
Haryana 67.45 81.48 69.96 68.53 91.33 72.64
Himachal Pradesh 1.97 18.30 2.71 2.51 12.65 3.45
Jammu & Kashmir 3.29 13.12 3.40 0.00 0.00 0.00
Karnataka 19.34 58.38 35.55 6.22 37.35 14.79
Kerala 3.08 10.81 4.86 3.68 26.40 7.39
Madhya Pradesh 86.57 92.65 88.98 58.41 88.88 67.29
Maharashtra 64.97 94.54 78.76 26.39 84.32 40.61
Orissa 87.78 96.58 90.65 68.96 91.86 76.09
Punjab 24.50 56.25 27.58 16.93 53.79 19.87
Rajasthan 12.75 40.37 18.62 7.94 29.57 11.39
Tamil Nadu 2.26 25.78 12.21 4.09 14.45 6.55
Uttar Pradesh 51.23 75.65 56.89 27.19 61.67 30.37
West Bengal 25.79 51.21 30.12 20.63 68.92 27.88
All India 42.92 68.26 51.52 23.32 53.52 29.97
Violation of minimum wages is widespread in the agricultural sector. A number of studies showthat except during the busy agricultural seasons and in some agriculturally developed states, actual wages

29ILO Subregional Office for South Asia, New Delhi
paid to casual workers are far below the minimum wages (Parthasarthy, 1998; Dash, 1996). Based onthe minimum range of the minimum wages announced by the Central and various state governments,the 1999-2000 NSSO data shows that more than 85 per cent of the workers who are not receivingminimum wages worked in the agriculture sector alone. Moreover, more than 90 per cent of the workersnot getting minimum wages belonged to rural areas. The proportion of casual workers not receivingminimum wages varied from a high of more than 55 per cent in agriculture to a low of approximately21 per cent in the construction and transport sectors. In all the non-agriculture sectors, the proportionis little more than 28 per cent (Table 17). However, it has to be remembered that since the presentcalculation is based on the minimum range of minimum wages, the real picture may be even worseif the sectoral minimum wages is taken into consideration.10
Table 17 : Proportion of casual workers not receiving minimum wages indifferent sectors, 1999-2000
Sectors of employment Rural Urban All
Agriculture, etc. 55.71 45.12 55.42
Mining & quarrying 26.17 15.72 24.62
Manufacturing 34.14 25.31 31.03
Public utilities 30.68 6.70 25.46
Construction 23.68 16.94 21.09
Trade, hotels & restaurants 37.08 33.84 35.24
Transport, etc. 20.59 23.61 21.10
Finance, business activities, etc. 38.66 29.59 34.25
Administration, education, commercial services 39.33 53.16 44.61
All non-agricultural activities 29.26 26.28 28.10
Total 51.10 29.58 48.54
Note: For calculating the proportion of workers not getting minimum wages only the lowest range of theminimum wages announced by different state governments and reported in the Ministry of Labour's AnnualReport have been considered.
Further, the nature of the problem with enforcement of minimum wages in rural and urbanareas is quite different. In rural areas, and particularly in agriculture, actual wages are lower than theminimum wages on a daily basis. As far as daily wages in urban areas and in most non-agricultureenterprises are concerned, employers generally comply with the minimum wages norm. However, mostof the workers work for much longer hours than stipulated in the Act. Hence, when calculated in termsof number of hours put in every day, a large proportion of the casual workers do not get minimumwages as per the norm.
In a recent study, Saget (2006) shows that in the urban non-agriculture sector, most casualworkers do get minimum wages or even higher on a daily basis, but most of them work for more than
10 In 1999, minimum wages were announced for more than 1,100 job categories falling under different sectors of employment. Byconsidering different levels of minimum wages in different sectors, the proportion of workers getting less than minimum wages willincrease as compared with what is shown in the present calculation.

30 ILO Subregional Office for South Asia, New Delhi
10, or even 12, hours a day for the same wage. Moreover, these workers do not get any benefit of leaveand/or compensation. Among the reasons for non-compliance with the norms of minimum wages relatedto working hours and leave, etc., are poor inspection of the enterprises, complexities of the minimumwage regulations, multiplicity of the rates, and inadequate efforts by the governments to popularize theexistence of rules and rates in this regard (Saget, 2006).
However, despite the various problems with the implementation of the Minimum Wages Act,the role of the Act in pushing actual wages up cannot be downplayed (Parthsarthy, 1998; MahendraDev, 1995; Saget, 2006). Nevertheless, there is urgent need to make arrangements for better and moreeffective implementation of the Minimum Wages Act.
10. Poverty among workers
Low level of wages, particularly of casual workers, and high and increasing wage differentialsacross different segments of labour markets has led to widespread poverty among the employed. Thissection, in addition to assessing the magnitude of the 'working poor' in India, attempts to analyse therelative position of different types of workers on the poverty map and changes therein over time.
The magnitude of the working poor and incidence of poverty among the employed in Indiacan be calculated by counting the employed persons belonging to poor and non-poor householdsseparately. Applying the Mixed Recall Period (MRP)11 on the Employment and Unemployment Survey(EUS)12 of the 61st Round of the NSSO, the poverty ratio during 2004-05 is estimated (24.4 per cent)to be somewhat 3 per cent higher than the poverty ratio calculated by the Planning Commission (21.8per cent, by using the MRP on consumption expenditure data of the same NSSO round). The UniformRecall Period (URP) consumption distribution data, however, reports a higher poverty ratio in both rural(28.3 per cent) and urban areas (25.7 per cent)13 (NCEUS, 2007). The EUS applying the MRP, however,estimates a higher poverty ratio in urban areas (25.4 per cent) than in rural areas (24.1 per cent). Basedon applying the MRP on the EUS data, our estimates of the poverty ratio among the employed is 21.6per cent14 (20.1 per cent in rural areas and 24.4 per cent in urban areas).
Some other recent estimates of the working poor in India, after carrying out the necessaryadjustments in EUS data to make it comparable with the CES data, show little lower incidence of povertyin general and among the employed in particular. NCEUS (2007) estimates of poverty among workersare 18.7 per cent in rural areas and 21 per cent in urban areas. Considering a poverty ratio of 21.6per cent among workers, the total number of working poor in India during 2004-05 is estimated to
11 The Planning Commission, based on the NSSO's 61st Round Consumer Expenditure Survey (CES), reported two poverty estimatesduring 2004-05. One is based on the Uniform Recall Period (URP) to compare with the period prior to 1999-2000, while theother is based on the Mixed Recall Period (MRP) mainly to compare (but not strictly) with 1999-2000.
12 In addition to the CES, which has been the basis of the official poverty ratio assessment by the Planning Commission, the Employmentand Unemployment Survey (EUS), conducted separately during the 61st Round of the NSSO, also provides consumption expendituredistribution by using an abridged version of the consumption expenditure schedule.
13 URP consumption distribution data reports a poverty ratio of 28.3 per cent in rural areas, 25.7 per cent in urban areas, and27.5 per cent for the country as a whole in 2004-05. The corresponding figures obtained from the MRP consumption distributiondata are much lower, such as 21.8 per cent in the rural areas, 21.7 per cent in the urban areas, and 21.8 per cent for the countryas a whole.
14 Since the workers' data is available in CES, we have used EUS data for calculating poverty among the employed.
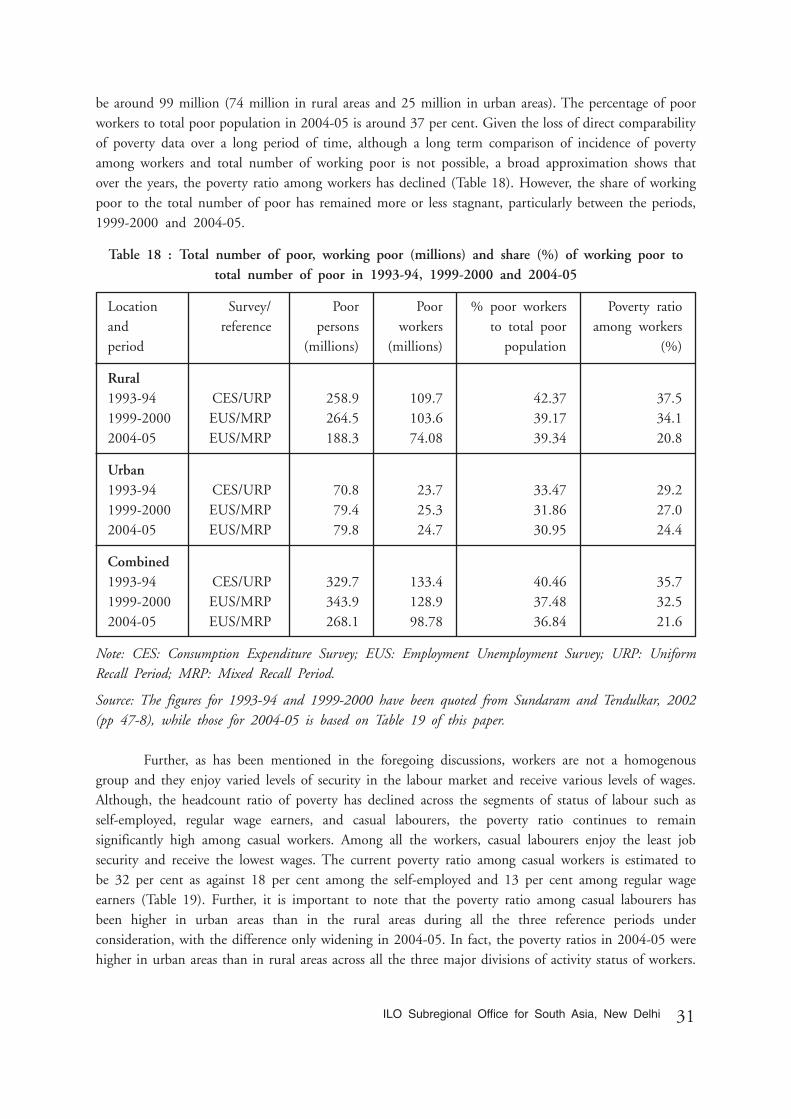
31ILO Subregional Office for South Asia, New Delhi
be around 99 million (74 million in rural areas and 25 million in urban areas). The percentage of poorworkers to total poor population in 2004-05 is around 37 per cent. Given the loss of direct comparabilityof poverty data over a long period of time, although a long term comparison of incidence of povertyamong workers and total number of working poor is not possible, a broad approximation shows thatover the years, the poverty ratio among workers has declined (Table 18). However, the share of workingpoor to the total number of poor has remained more or less stagnant, particularly between the periods,1999-2000 and 2004-05.
Table 18 : Total number of poor, working poor (millions) and share (%) of working poor tototal number of poor in 1993-94, 1999-2000 and 2004-05
Location Survey/ Poor Poor % poor workers Poverty ratioand reference persons workers to total poor among workersperiod (millions) (millions) population (%)
Rural1993-94 CES/URP 258.9 109.7 42.37 37.51999-2000 EUS/MRP 264.5 103.6 39.17 34.12004-05 EUS/MRP 188.3 74.08 39.34 20.8
Urban1993-94 CES/URP 70.8 23.7 33.47 29.21999-2000 EUS/MRP 79.4 25.3 31.86 27.02004-05 EUS/MRP 79.8 24.7 30.95 24.4
Combined1993-94 CES/URP 329.7 133.4 40.46 35.71999-2000 EUS/MRP 343.9 128.9 37.48 32.52004-05 EUS/MRP 268.1 98.78 36.84 21.6
Note: CES: Consumption Expenditure Survey; EUS: Employment Unemployment Survey; URP: UniformRecall Period; MRP: Mixed Recall Period.
Source: The figures for 1993-94 and 1999-2000 have been quoted from Sundaram and Tendulkar, 2002(pp 47-8), while those for 2004-05 is based on Table 19 of this paper.
Further, as has been mentioned in the foregoing discussions, workers are not a homogenousgroup and they enjoy varied levels of security in the labour market and receive various levels of wages.Although, the headcount ratio of poverty has declined across the segments of status of labour such asself-employed, regular wage earners, and casual labourers, the poverty ratio continues to remainsignificantly high among casual workers. Among all the workers, casual labourers enjoy the least jobsecurity and receive the lowest wages. The current poverty ratio among casual workers is estimated tobe 32 per cent as against 18 per cent among the self-employed and 13 per cent among regular wageearners (Table 19). Further, it is important to note that the poverty ratio among casual labourers hasbeen higher in urban areas than in the rural areas during all the three reference periods underconsideration, with the difference only widening in 2004-05. In fact, the poverty ratios in 2004-05 werehigher in urban areas than in rural areas across all the three major divisions of activity status of workers.
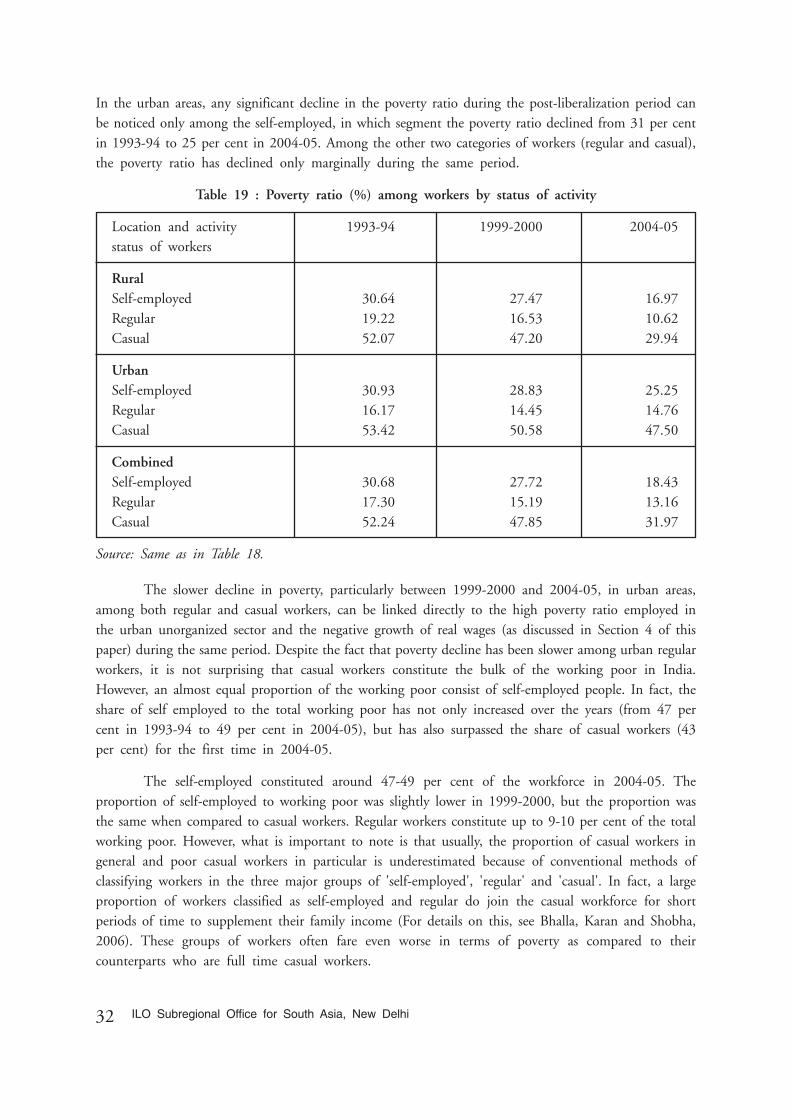
32 ILO Subregional Office for South Asia, New Delhi
In the urban areas, any significant decline in the poverty ratio during the post-liberalization period canbe noticed only among the self-employed, in which segment the poverty ratio declined from 31 per centin 1993-94 to 25 per cent in 2004-05. Among the other two categories of workers (regular and casual),the poverty ratio has declined only marginally during the same period.
Table 19 : Poverty ratio (%) among workers by status of activity
Location and activity 1993-94 1999-2000 2004-05status of workers
RuralSelf-employed 30.64 27.47 16.97Regular 19.22 16.53 10.62Casual 52.07 47.20 29.94
UrbanSelf-employed 30.93 28.83 25.25Regular 16.17 14.45 14.76Casual 53.42 50.58 47.50
CombinedSelf-employed 30.68 27.72 18.43Regular 17.30 15.19 13.16Casual 52.24 47.85 31.97
Source: Same as in Table 18.
The slower decline in poverty, particularly between 1999-2000 and 2004-05, in urban areas,among both regular and casual workers, can be linked directly to the high poverty ratio employed inthe urban unorganized sector and the negative growth of real wages (as discussed in Section 4 of thispaper) during the same period. Despite the fact that poverty decline has been slower among urban regularworkers, it is not surprising that casual workers constitute the bulk of the working poor in India.However, an almost equal proportion of the working poor consist of self-employed people. In fact, theshare of self employed to the total working poor has not only increased over the years (from 47 percent in 1993-94 to 49 per cent in 2004-05), but has also surpassed the share of casual workers (43per cent) for the first time in 2004-05.
The self-employed constituted around 47-49 per cent of the workforce in 2004-05. Theproportion of self-employed to working poor was slightly lower in 1999-2000, but the proportion wasthe same when compared to casual workers. Regular workers constitute up to 9-10 per cent of the totalworking poor. However, what is important to note is that usually, the proportion of casual workers ingeneral and poor casual workers in particular is underestimated because of conventional methods ofclassifying workers in the three major groups of 'self-employed', 'regular' and 'casual'. In fact, a largeproportion of workers classified as self-employed and regular do join the casual workforce for shortperiods of time to supplement their family income (For details on this, see Bhalla, Karan and Shobha,2006). These groups of workers often fare even worse in terms of poverty as compared to theircounterparts who are full time casual workers.
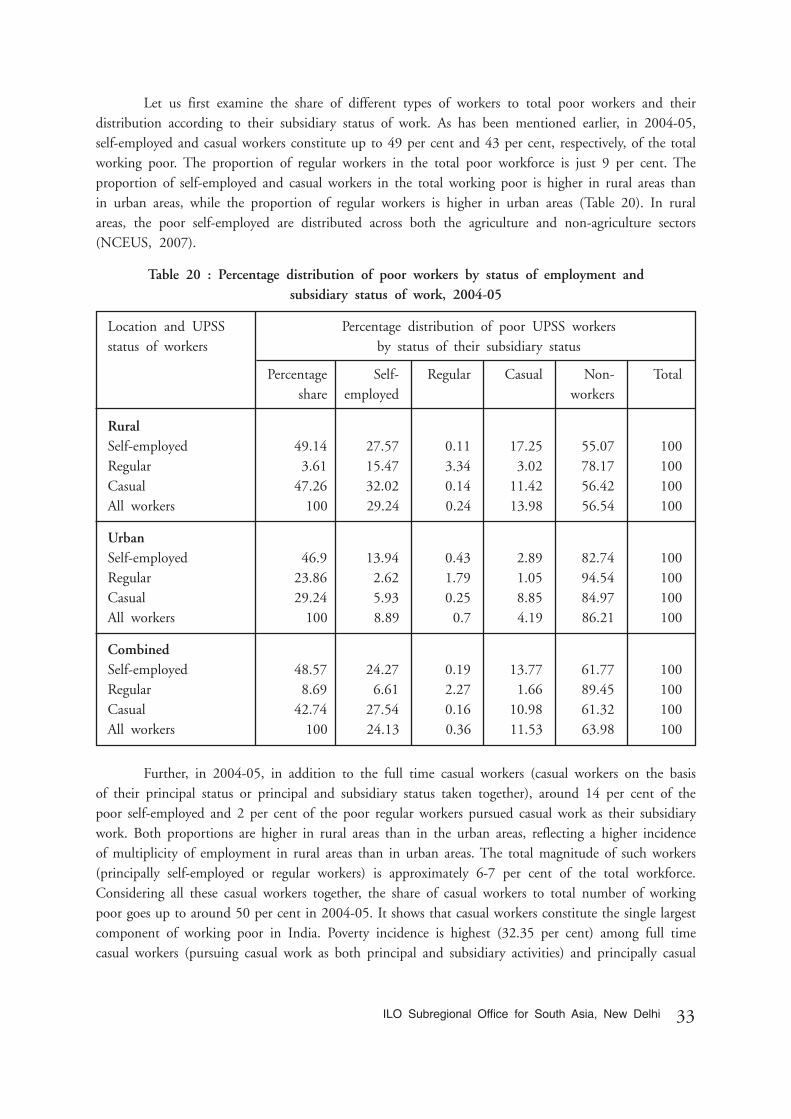
33ILO Subregional Office for South Asia, New Delhi
Let us first examine the share of different types of workers to total poor workers and theirdistribution according to their subsidiary status of work. As has been mentioned earlier, in 2004-05,self-employed and casual workers constitute up to 49 per cent and 43 per cent, respectively, of the totalworking poor. The proportion of regular workers in the total poor workforce is just 9 per cent. Theproportion of self-employed and casual workers in the total working poor is higher in rural areas thanin urban areas, while the proportion of regular workers is higher in urban areas (Table 20). In ruralareas, the poor self-employed are distributed across both the agriculture and non-agriculture sectors(NCEUS, 2007).
Table 20 : Percentage distribution of poor workers by status of employment andsubsidiary status of work, 2004-05
Location and UPSS Percentage distribution of poor UPSS workersstatus of workers by status of their subsidiary status
Percentage Self- Regular Casual Non- Totalshare employed workers
RuralSelf-employed 49.14 27.57 0.11 17.25 55.07 100Regular 3.61 15.47 3.34 3.02 78.17 100Casual 47.26 32.02 0.14 11.42 56.42 100All workers 100 29.24 0.24 13.98 56.54 100
UrbanSelf-employed 46.9 13.94 0.43 2.89 82.74 100Regular 23.86 2.62 1.79 1.05 94.54 100Casual 29.24 5.93 0.25 8.85 84.97 100All workers 100 8.89 0.7 4.19 86.21 100
CombinedSelf-employed 48.57 24.27 0.19 13.77 61.77 100Regular 8.69 6.61 2.27 1.66 89.45 100Casual 42.74 27.54 0.16 10.98 61.32 100All workers 100 24.13 0.36 11.53 63.98 100
Further, in 2004-05, in addition to the full time casual workers (casual workers on the basisof their principal status or principal and subsidiary status taken together), around 14 per cent of thepoor self-employed and 2 per cent of the poor regular workers pursued casual work as their subsidiarywork. Both proportions are higher in rural areas than in the urban areas, reflecting a higher incidenceof multiplicity of employment in rural areas than in urban areas. The total magnitude of such workers(principally self-employed or regular workers) is approximately 6-7 per cent of the total workforce.Considering all these casual workers together, the share of casual workers to total number of workingpoor goes up to around 50 per cent in 2004-05. It shows that casual workers constitute the single largestcomponent of working poor in India. Poverty incidence is highest (32.35 per cent) among full timecasual workers (pursuing casual work as both principal and subsidiary activities) and principally casual
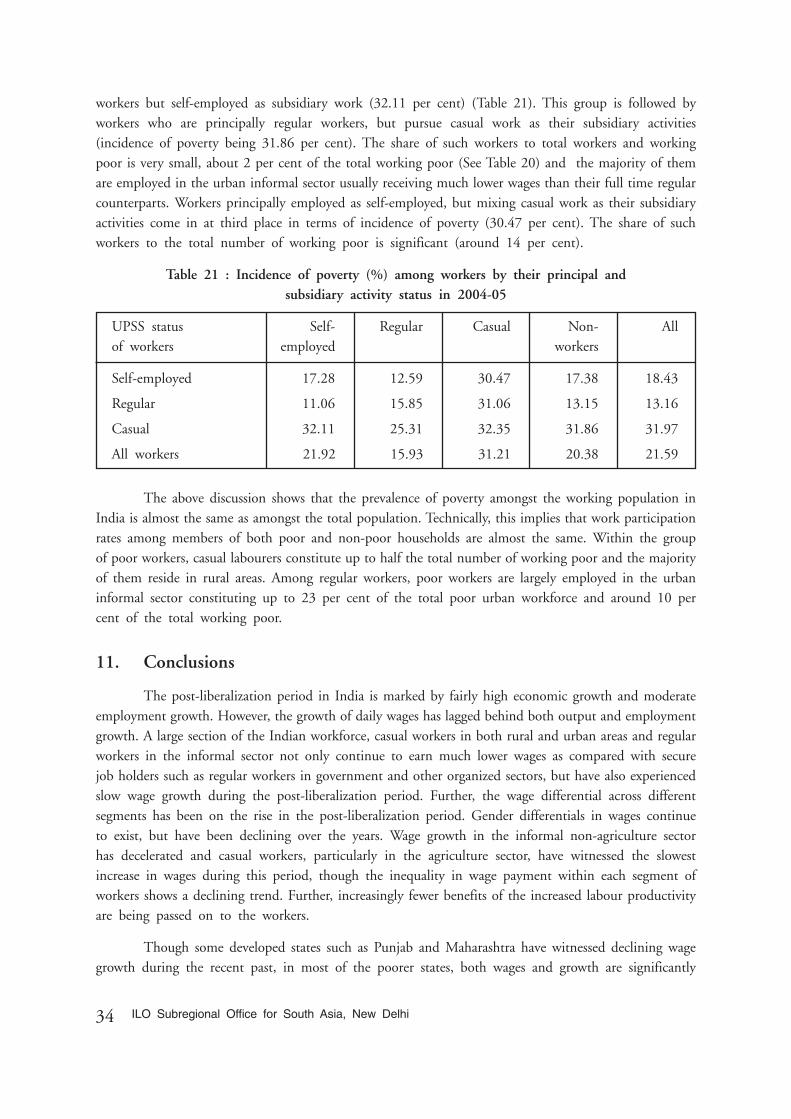
34 ILO Subregional Office for South Asia, New Delhi
workers but self-employed as subsidiary work (32.11 per cent) (Table 21). This group is followed byworkers who are principally regular workers, but pursue casual work as their subsidiary activities(incidence of poverty being 31.86 per cent). The share of such workers to total workers and workingpoor is very small, about 2 per cent of the total working poor (See Table 20) and the majority of themare employed in the urban informal sector usually receiving much lower wages than their full time regularcounterparts. Workers principally employed as self-employed, but mixing casual work as their subsidiaryactivities come in at third place in terms of incidence of poverty (30.47 per cent). The share of suchworkers to the total number of working poor is significant (around 14 per cent).
Table 21 : Incidence of poverty (%) among workers by their principal andsubsidiary activity status in 2004-05
UPSS status Self- Regular Casual Non- Allof workers employed workers
Self-employed 17.28 12.59 30.47 17.38 18.43
Regular 11.06 15.85 31.06 13.15 13.16
Casual 32.11 25.31 32.35 31.86 31.97
All workers 21.92 15.93 31.21 20.38 21.59
The above discussion shows that the prevalence of poverty amongst the working population inIndia is almost the same as amongst the total population. Technically, this implies that work participationrates among members of both poor and non-poor households are almost the same. Within the groupof poor workers, casual labourers constitute up to half the total number of working poor and the majorityof them reside in rural areas. Among regular workers, poor workers are largely employed in the urbaninformal sector constituting up to 23 per cent of the total poor urban workforce and around 10 percent of the total working poor.
11. Conclusions
The post-liberalization period in India is marked by fairly high economic growth and moderateemployment growth. However, the growth of daily wages has lagged behind both output and employmentgrowth. A large section of the Indian workforce, casual workers in both rural and urban areas and regularworkers in the informal sector not only continue to earn much lower wages as compared with securejob holders such as regular workers in government and other organized sectors, but have also experiencedslow wage growth during the post-liberalization period. Further, the wage differential across differentsegments has been on the rise in the post-liberalization period. Gender differentials in wages continueto exist, but have been declining over the years. Wage growth in the informal non-agriculture sectorhas decelerated and casual workers, particularly in the agriculture sector, have witnessed the slowestincrease in wages during this period, though the inequality in wage payment within each segment ofworkers shows a declining trend. Further, increasingly fewer benefits of the increased labour productivityare being passed on to the workers.
Though some developed states such as Punjab and Maharashtra have witnessed declining wagegrowth during the recent past, in most of the poorer states, both wages and growth are significantly
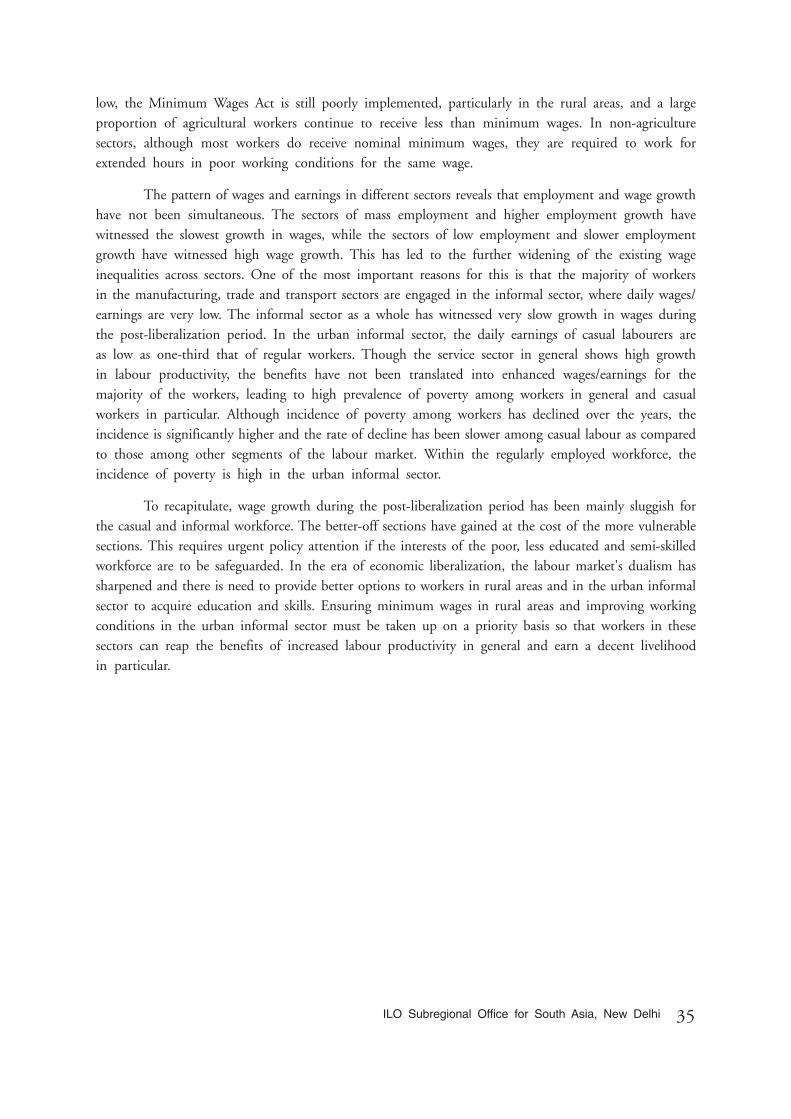
35ILO Subregional Office for South Asia, New Delhi
low, the Minimum Wages Act is still poorly implemented, particularly in the rural areas, and a largeproportion of agricultural workers continue to receive less than minimum wages. In non-agriculturesectors, although most workers do receive nominal minimum wages, they are required to work forextended hours in poor working conditions for the same wage.
The pattern of wages and earnings in different sectors reveals that employment and wage growthhave not been simultaneous. The sectors of mass employment and higher employment growth havewitnessed the slowest growth in wages, while the sectors of low employment and slower employmentgrowth have witnessed high wage growth. This has led to the further widening of the existing wageinequalities across sectors. One of the most important reasons for this is that the majority of workersin the manufacturing, trade and transport sectors are engaged in the informal sector, where daily wages/earnings are very low. The informal sector as a whole has witnessed very slow growth in wages duringthe post-liberalization period. In the urban informal sector, the daily earnings of casual labourers areas low as one-third that of regular workers. Though the service sector in general shows high growthin labour productivity, the benefits have not been translated into enhanced wages/earnings for themajority of the workers, leading to high prevalence of poverty among workers in general and casualworkers in particular. Although incidence of poverty among workers has declined over the years, theincidence is significantly higher and the rate of decline has been slower among casual labour as comparedto those among other segments of the labour market. Within the regularly employed workforce, theincidence of poverty is high in the urban informal sector.
To recapitulate, wage growth during the post-liberalization period has been mainly sluggish forthe casual and informal workforce. The better-off sections have gained at the cost of the more vulnerablesections. This requires urgent policy attention if the interests of the poor, less educated and semi-skilledworkforce are to be safeguarded. In the era of economic liberalization, the labour market's dualism hassharpened and there is need to provide better options to workers in rural areas and in the urban informalsector to acquire education and skills. Ensuring minimum wages in rural areas and improving workingconditions in the urban informal sector must be taken up on a priority basis so that workers in thesesectors can reap the benefits of increased labour productivity in general and earn a decent livelihoodin particular.
36 ILO Subregional Office for South Asia, New Delhi
References
Acharya, R.; Marjit, S. 2000. “Globalisation and inequality: An analytical perspective”, in Economic andPolitical Weekly (Mumbai, EPW Research Foundation), 23 Sep.
Acharya, S.; Papanek, G.F. 1989. “Agricultural linkages and poverty in India: A model for rural labourmarkets”, in Asian Centre Discussion Paper No. 39, (Boston, Centre for Asian DevelopmentStudies, Boston University), July.
Anant, T.C.A. 2004. “Labour market reforms in India”, Review paper presented at the Fifth AnnualGlobal Development Network Conference (New Delhi), 8-30 Jan.
Bhalla, Sheila. 2002. “India’s rural economy: issues and evidences”, Paper presented at internationalseminar on ‘Rural livelihood futures workshop, Organised by Ministry of Rural Development,Government of India, New Delhi and Overseas Development Institute, London (New Delhi),17-19 October.
–. 1998. “Trends in poverty, wages and employment in rural India”, in Radhakrishna; Sharma (eds.)Empowering rural labour in India: Market, state and mobilization (New Delhi, Institute forHuman Development).
–. 1997. “Trends in poverty, wages and employment in India”, in The Indian Journal of Labour Economics(New Delhi, The Indian Society of Labour Economics), Vol. 40, No. 2, Apr.-June,pp. 213-23.
–. 1993. The dynamics of wage determination and employment generation in Indian agriculture”, inIndian Journal of Agricultural Economics (Mumbai, Indian Society of Agricultural Economics),Vol. 48, No.3, July-Sep.
Bhalla, Sheila; Karan, Anup K.; Shobha, T. 2006. “Rural casual labourers, wages and poverty: 1983-1999–2000”, in Asha Kapoor Mehta; Andrew Shepherd (eds.) Chronic poverty and developmentpolicy in India (New Delhi, Sage Publications).
Bhalla, Surjit S.; Das, Tirthatonmoy. 2005. “Why be afraid of the truth? Poverty, inequality and growthin India, 1983–2000”, mimeo (New Delhi, Oxus Research and Investments).
Bhattacharya, B.B.; Sakthivel, S. 2005. “Employment, wage and output relationships in India: Acomparison of pre and post reform behaviour”, in The Indian Journal of Labour Economics (NewDelhi, The Indian Society of Labour Economics), Vol. 48, No. 2, Apr.-June.
Das, M.B. 2003. “Ethnicity and social exclusion in job outcomes in India: Summary of research findings”,mimeo (World Bank Institute).
Dash, J. 1996. “Minimum wages law: Agricultural labour and uniform minimum wages”, in The IndianJournal of Labour Economics (New Delhi, The Indian Society of Labour Economics), Vol. 39,No. 2.
Deaton, Angus; Dreze, Jean. 2002. “Poverty and inequality in India: A re- examination”, in Economicand Political Weekly (Mumbai, EPW Research Foundation), 7 Sep.
37ILO Subregional Office for South Asia, New Delhi
Deshpande, L.K.; Sharma, Alakh N.; Karan, Anup K.; Sarkar, Sandip. 2004. Liberalisation and labour:Labour flexibility in Indian manufacturing (New Delhi, Institute for Human Development).
Dickens, W.T.; Lang, K. 1985. “A test of dual labor market theory”, in American Economic Review(Nashville, American Economic Association), Vol. 75 (4), pp. 792-805.
Dutta, Puja Vasudeva. 2005. “Accounting for wage inequality in India”, in The Indian Journal of LabourEconomics (New Delhi, The Indian Society of Labour Economics), Vol. 48, No. 2, Apr.-June.
–. 2004. “Trade protection and inter-industry wages in India”, Working Paper 27 (Sussex, PovertyResearch Institute, University of Sussex).
Eyraud, Francois; Saget, Catherine. 2005. The fundamentals of minimum wage fixing (Geneva,International Labour Office).
Galbraith, J.K.; Roy Chowdhury, D.; Shrivastava, S. 2004. “Pay inequality in the Indian manufacturingsector, 1979–1998”, Working Paper 28, University of Texas Inequality Project.
Ghanekar, Jayanti. 1997. Sorry state of agricultural wage data: sources and methods of collection”, inEconomic and Political Weekly (Mumbai, EPW Research Foundation), Vol. 32, No. 19, 10-16May.
GOI, 2006. “Approach Paper to 11th Plan Document”, Planning Commission, Government of India,New Delhi
Goldar, B.; Banga, Rashmi. 2005. “Wage-productivity relationship in organised manufacturing in India:A state-wise analysis”, in The Indian Journal of Labour Economics (New Delhi, The Indian Societyof Labour Economics), Vol. 48, No. 2, Apr.-June.
Goldar, B.N. 2004. “Productivity trends in Indian manufacturing in the pre and post-reform periods”,Working Paper No. 137 (New Delhi, Indian Council for Research on International EconomicRelations, ICRIER).
Ghose, Ajit. 2004. “The employment challenge in India”, in Economic and Political Weekly (Mumbai,EPW Research Foundation), Vol. 39, No. 48, 27 Nov.-3 Dec.
Ghosh, Jayati. 2005. “Is India a success story of economic liberalisation”, Christian Aid Policy DiscussionPaper, Jawaharlal Nehru University (New Delhi).
Heckman, J.; Hotz, V. 1986. “An investigation of the labour market earnings of Panamanian males:Evaluating the sources of inequality”, in The Journal of Human Resources (US, The Universityof Wisconsin Press), Vol. 21 (4), pp. 507-42.
Himanshu. 2005. “Wages in rural India: Sources, trends and comparability”, in The Indian Journal ofLabour Economics (New Delhi, The Indian Society of Labour Economics), Vol. 48, No. 2, Apr.-June.
Jose, A.V. 1988. “Agricultural wages in India”, in Economic and Political Weekly (Mumbai, EPW ResearchFoundation), 25 June, pp. A46-A58.
38 ILO Subregional Office for South Asia, New Delhi
–. 1974. “Trends in real wage rates of agricultural labourers”, in Economic and Political Weekly (Mumbai,EPW Research Foundation), Review of Agriculture, Mar., pp. A25-A30.
Karan, Anup K. 1997. “Minimum wages and its implications in Madhya Pradesh”, in The Indian Journalof Labour Economics (New Delhi, The Indian Society of Labour Economics), ConferenceNumber, Vol. 41, No. 4.
Karan, Anup K.; Sarkar, Sandip. 2003. “Labour flexibility and industrial relations: A study of organisedmanufacturing sector in India”, in The Indian Journal of Labour Economics (New Delhi, TheIndian Society of Labour Economics), Vol. 42, No. 4.
Kijima, Yoko; Lanjouw, Peter. 2005. “Economic diversification and poverty in rural India”, in The IndianJournal of Labour Economics (New Delhi, The Indian Society of Labour Economics), Vol. 48,No. 2, Apr.-June.
Kingdon, G.G. 1998. “Does the labour market explain lower female schooling in India?”, in Journalof Development Studies (US, Routledge), 35 (1), pp. 39-65.
Krishnaji, N. 1971. “Wages of agricultural labour”, in Economic and Political Weekly (Mumbai, EPWResearch Foundation), Review of Agriculture, Sep., pp. A148-A151.
Kundu, Amitabh. 2002. “Urban informal sector in India: Macro trends and policy perspectives, issuesin development”, Discussion Paper No. 25, Development Policy Department (Geneva,International Labour Office).
–. 1997. “Trends and structure of employment in the 1990s: Implications for urban growth”, in Economicand Political Weekly (Mumbai, EPW Research Foundation), Vol. 32 (24).
Lal, Deepak. 1976. “Agricultural growth, real wages, and the rural poor in India”, in Economic andPolitical Weekly (Mumbai, EPW Research Foundation), Review of Agriculture, June, pp. A47-A61.
Laxminarayan, H and S.S. Tyagi. 1977, “Inter-State Variations in Types of Tenancy”, Economic andPolitical Weekly (Mumbai, EPW Research Foundation), Vol. 12, No. 39, Review of Agriculture,September 24.
Mahendradev, S. 2002. “Pro-poor growth in India: What do we know about the employment effectsof growth 1980–2000?” Working Paper No. 16 (London, Overseas Development Institute).
–. 1995. “India’s (Maharashtra) Employment Guarantee Scheme: Lessons from long experience”, inJoachim Von Braun (ed.): Employment for poverty reduction and food security (Washington, DC,International Food Policy Research Institute).
Mazumdar, Deepak; Sarkar, Sandip. 2004. “Reforms and employment elasticity in organised manufacturing”,in Economic and Political Weekly (Mumbai, EPW Research Foundation), Vol. 39, No. 28.
Nayyar, D. 1993.“Economic reforms in India: a critical assessment”. ILO-ARTEP Working Paper, NewDelhi.
NCEUS. 2007. “Report on conditions of work and promotion of livelihoods in the unorganised
39ILO Subregional Office for South Asia, New Delhi
sector” (New Delhi, National Commission for Enterprises in the Unorganised Sector,Government of India).
NSSO. 2006. “Employment and unemployment situation in India, 2004–05”, Report No. 515 (61/10/1) (New Delhi, National Sample Survey Organisation, Department of Statistics and ProgrammeImplementation, Government of India).
Parthsarthy, G. 1998. “Minimum wages in agriculture: A review of Indian experiences”, in Radhakrishna;Sharma (eds.) Empowering rural labour in India: Market, state and mobilisation (New Delhi,Institute for Human Development).
–. G. 1996. “Recent trends in wages and employment of agricultural labourers”, in Indian Journal ofAgricultural Economics (Mumbai, Indian Society of Agricultural Economics), Vol. 51, No. 2.
Rao, V.M. 1972. “Agricultural wages in India: A reliability analysis”, in Indian Journal of AgriculturalEconomics (Mumbai, Indian Society of Agricultural Economics), Vol. 27, No. 3, July-Sep.
Rustagi, Preet. 2005. “Understanding gender inequalities in wages and incomes in India”, in The IndianJournal of Labour Economics (New Delhi, The Indian Society of Labour Economics), Vol. 48,No. 2, Apr.-June.
–. 2003. Gender biases and discrimination against women: What do different indicators say? (New Delhi,UNIFEM).
Saget, Catherine. 2006. “Wage fixing in informal economy: Evidence from Brazil, India, Indonesia andSouth Africa”, Conditions of Work and Employment Series No. 16 (Geneva, InternationalLabour Office).
–. 2001. “Poverty reduction and decent work in developing countries: Do minimum wages help?”, inInternational Labour Review (Geneva, International Labour Office), Vol. 140, No. 3.
Sen, Abhijit. 1998. “Rural labour market and poverty”, in Radhakrishna; Sharma (eds.): Empowering rurallabour in India: Market, state and mobilization (New Delhi, Institute for Human Development).
–. 1994. “Rural labour markets and poverty”, in The Indian Journal of Labour Economics (New Delhi,The Indian Society of Labour Economics), Vol. 37, No. 4, Oct. –Dec., pp. 575-608.
Sen, Abhijit; Himanshu. 2004. “Poverty and inequality in India – I”, in Economic and Political Weekly(Mumbai, EPW Research Foundation), Vol. 39, No. 37.
Sen, Abhijit; Ghosh, Jayati. 1993. “Trends in rural employment and the poverty-employment linkages”(New Delhi, ILO-ARTEP).
Shariff, Abusaleh; Gumber, Anil. 1999. “Employment and wages in India: Pre and post reform scenario”,in The Indian Journal of Labour Economics (New Delhi, The Indian Society of LabourEconomics), Vol. 42, No. 2.
Sharma, Alakh N.; Karan, Anup K.; Sarkar, Sandip. 2002. Dynamics of employment, poverty and humandevelopment in Bihar, mimeo (New Delhi, Institute for Human Development).
40 ILO Subregional Office for South Asia, New Delhi
Sharma, H.R. 2001. “Employment and wage earnings of agricultural labourers: A state-wise analysis”,in The Indian Journal of Labour Economics (New Delhi, The Indian Society of LabourEconomics), Vol. 44, No. 1.
Sundaram, K. 2001. “Employment and poverty in the 1990s: Further results from NSSO 55th RoundEmployment and Unemployment Survey, 1999–2000”, in Economic and Political Weekly(Mumbai, EPW Research Foundation), 11 Aug., Vol. 36, No. 32.
Sundaram, K.; Tendulkar, Suresh D. 2006. “Changing structure of Indian workforce, quality ofemployment and real earnings, 1983–2000”, Paper presented at international seminar on ‘India:Meeting the Employment Challenge, Conference on Labour and Employment Issues in India’,organised by Institute for Human Development and supported by the World Bank (New Delhi),27-29 July.
–. 2002. “The working poor in India: Employment poverty linkages and employment policy options”,Issues in Employment and Poverty Discussion Paper 4 (Geneva, Recovery and ReconstructionDepartment, International Labour Office).
Tendulkar, S.D. 2003. “Organised labour market in India: Pre and post-reform period”, Paper preparedfor the Conference on Anti-Poverty and Social Policy, mimeo, (Alwar, India), 2-4 Jan.
Unni, Jeemol. 2005. “Wages and income in formal and informal sectors in India”, in Indian Journalof Labour Economics, (New Delhi, The Indian Society of Labour Economics), Vol. 48 (2), pp.311-317.
–. 2001. “Gender and informality in labour market in South Asia”, in Economic and Political Weekly(Mumbai, EPW Research Foundation), Vol. 36, No. 26.
–. 2000. “Employment trends and earnings in the informal sector”, Paper presented at internationalseminar on ‘India: Meeting the Employment Challenge, Conference on Labour and EmploymentIssues in India’, organised by Institute for Human Development and supported by the WorldBank (New Delhi), 27-29 July.
–. 1997. “Employment and wages among rural labourers: Some recent trends”, in Indian Journal ofAgricultural Economics (Mumbai, Indian Society of Agricultural Economics), Vol. 52, No. 1.
Unni, Jeemol; Rani, Uma. 2003. “Changing structure of workforce in unorganised manufacturing”, inIndian Journal of Labour Economics (New Delhi, The Indian Society of Labour Economics), Vol.46 (4), pp. 983-997.
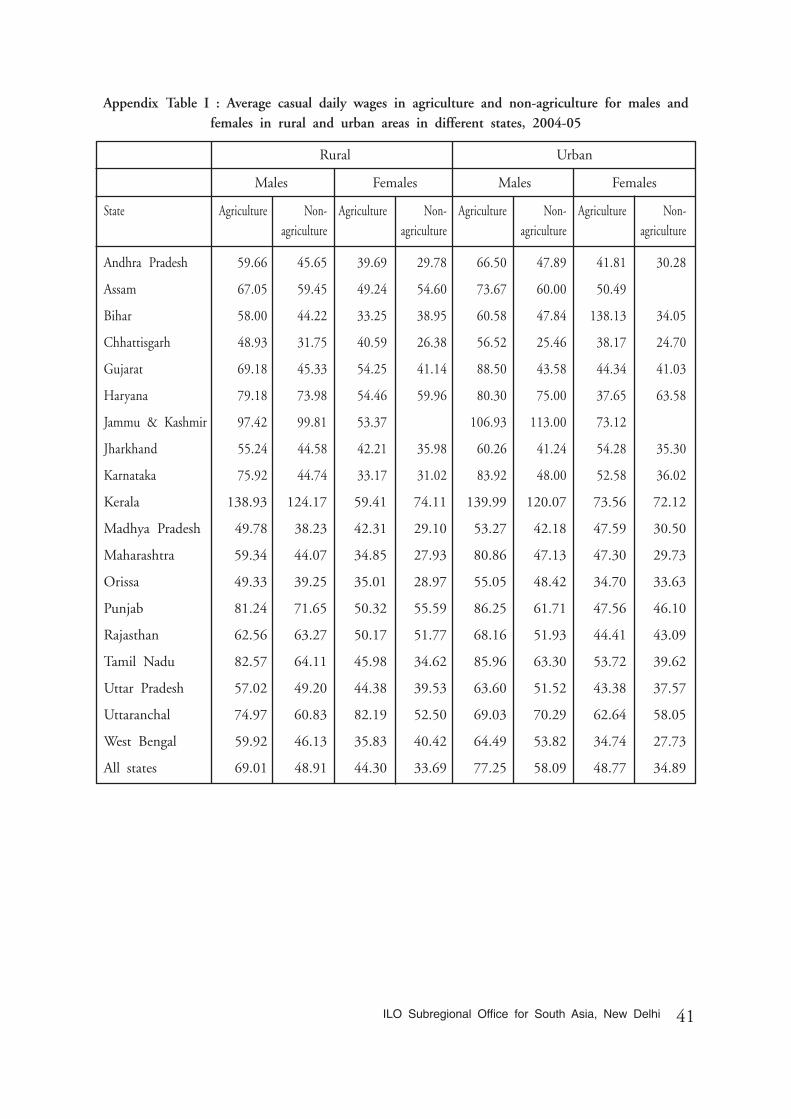
41ILO Subregional Office for South Asia, New Delhi
Appendix Table I : Average casual daily wages in agriculture and non-agriculture for males andfemales in rural and urban areas in different states, 2004-05
Rural Urban
Males Females Males Females
State Agriculture Non- Agriculture Non- Agriculture Non- Agriculture Non-agriculture agriculture agriculture agriculture
Andhra Pradesh 59.66 45.65 39.69 29.78 66.50 47.89 41.81 30.28
Assam 67.05 59.45 49.24 54.60 73.67 60.00 50.49
Bihar 58.00 44.22 33.25 38.95 60.58 47.84 138.13 34.05
Chhattisgarh 48.93 31.75 40.59 26.38 56.52 25.46 38.17 24.70
Gujarat 69.18 45.33 54.25 41.14 88.50 43.58 44.34 41.03
Haryana 79.18 73.98 54.46 59.96 80.30 75.00 37.65 63.58
Jammu & Kashmir 97.42 99.81 53.37 106.93 113.00 73.12
Jharkhand 55.24 44.58 42.21 35.98 60.26 41.24 54.28 35.30
Karnataka 75.92 44.74 33.17 31.02 83.92 48.00 52.58 36.02
Kerala 138.93 124.17 59.41 74.11 139.99 120.07 73.56 72.12
Madhya Pradesh 49.78 38.23 42.31 29.10 53.27 42.18 47.59 30.50
Maharashtra 59.34 44.07 34.85 27.93 80.86 47.13 47.30 29.73
Orissa 49.33 39.25 35.01 28.97 55.05 48.42 34.70 33.63
Punjab 81.24 71.65 50.32 55.59 86.25 61.71 47.56 46.10
Rajasthan 62.56 63.27 50.17 51.77 68.16 51.93 44.41 43.09
Tamil Nadu 82.57 64.11 45.98 34.62 85.96 63.30 53.72 39.62
Uttar Pradesh 57.02 49.20 44.38 39.53 63.60 51.52 43.38 37.57
Uttaranchal 74.97 60.83 82.19 52.50 69.03 70.29 62.64 58.05
West Bengal 59.92 46.13 35.83 40.42 64.49 53.82 34.74 27.73
All states 69.01 48.91 44.30 33.69 77.25 58.09 48.77 34.89

42 ILO Subregional Office for South Asia, New Delhi
Appendix Table II : Average rural casual daily wages for males and females in agriculture andnon-agriculture and ratios of inequalities for females to males and agriculture to non-agriculture
1983 1993-94 1999-2000 2004-05
Current prices
MalesAgriculture 7.4 21.59 40.45 48.07Non-agriculture 10.1 30.15 59.52 68.30
FemalesAgriculture 5.1 15.12 28.56 33.38Non-agriculture 5.59 17.46 37.29 44.62
Constant 1993-94 prices
MalesAgriculture 16.65 21.59 25.01 26.59Non-agriculture 22.73 30.15 36.80 37.78
FemalesAgriculture 11.48 15.12 17.66 18.46Non-agriculture 12.58 17.46 23.05 24.68
Ratios of inequalities
Females/malesAgriculture 0.69 0.70 0.71 0.69Non-agriculture 0.55 0.58 0.63 0.65
Agri/non-agricultureMales 0.73 0.72 0.68 0.70Females 0.91 0.87 0.77 0.75

43ILO Subregional Office for South Asia, New Delhi
Appendix Table III : Average regular and casual daily wages for males, females and persons inrural and urban areas in different states, 2004-05
Regular Casual
Rural Urban Rural Urban
States Males Females Persons Males Females Persons Males Females Persons Male Female Persons
Andhra Pradesh 106.23 56.61 93.81 183.34 132.05 172.18 50.3 30.88 42.13 64.71 36.29 56.99
Assam 145.51 73.83 128.82 249.81 151.31 232.51 62.59 53.29 60.18 73.73 56 70.49
Bihar 175.97 96.72 166.55 249.61 209.45 247.02 45.41 37.42 43.95 54.65 81.91 59.56
Chhattisgarh 122.7 79.69 115.61 180.2 69.03 161.93 37.6 28.55 34.07 47.62 32.43 41.32
Gujarat 132.8 108.25 129.38 173.64 110.74 165.8 52.8 43.17 49.72 83.46 46.35 71.95
Haryana 238.64 102.14 230.28 156.44 165.66 157.69 75.26 59.34 72.2 79.22 46.8 73.71
Himachal Pradesh 205.18 151.71 193.94 295.47 226.65 281.69 88.88 62 87.14 69.67 65.92 69.04
Jammu & Kashmir 180.79 111.84 175.46 259.46 196.4 251.04 100.24 53.39 96.14 111.82 81.01 110.57
Jharkhand 180.1 101.87 166.99 287.85 142.88 267.31 51.11 37.93 48.07 60.16 55.46 58.85
Karnataka 126.69 70.28 112.86 227.16 153.99 211.44 48.33 30.74 41.32 80.75 46.25 73.44
Kerala 163.8 119.85 146.83 203.04 170.9 191.03 134.86 65.75 119.51 137 66.96 126.81
Madhya Pradesh 103.16 31.49 88.44 184.07 104.78 168.83 38.58 30.53 35.76 51.55 42.02 49.57
Maharashtra 155.04 105.4 148.11 220.58 180.04 211.89 47.37 28.16 38.58 79.57 39.1 69.2
Orissa 139.93 93.81 133.62 211.93 144.3 198.71 42.29 29.65 38.45 54.41 33 49.51
Punjab 167.42 123.06 161.92 197.41 226.32 203.17 75.14 53.1 73.12 83.9 46.41 79.7
Rajasthan 146.59 87.41 140.14 184.26 156.16 180.24 64.33 52.03 62.12 69.15 48.26 66.53
Tamil Nadu 122.6 73.8 109.07 190.58 112.11 169.71 70.45 36.53 56.48 83.1 47.56 74.91
Uttaranchal 193.87 135.17 186.58 212.83 137.27 197.52 69.66 56.2 67.88 69.78 60.26 68.57
Uttar Pradesh 122.4 100.16 120.31 177.27 149.48 174.41 53.37 39.54 51.25 63.99 38.61 61.77
West Bengal 143.39 53.07 120.25 198.19 129.35 185.39 49.88 39.99 48.38 64 32.95 60.54
All-India 144.93 85.53 133.81 203.28 153.19 193.73 55.03 34.94 48.89 75.1 43.88 68.68