Embed Size (px)
Citation preview

Illinois State Water Survey Division SURFACE WATER SECTION
AT THE UNIVERSITY OF ILLINOIS
SWS Contract Report 413
SEDIMENTATION SURVEY OF DAWSON LAKE, MORAINE VIEW STATE PARK,
MC LEAN COUNTY, ILLINOIS
by
William P. Fitzpatrick
Prepared for the Illinois Department of Conservation
Champaign, Illinois February 1987
Illinois Department of Energy and Natural Resources
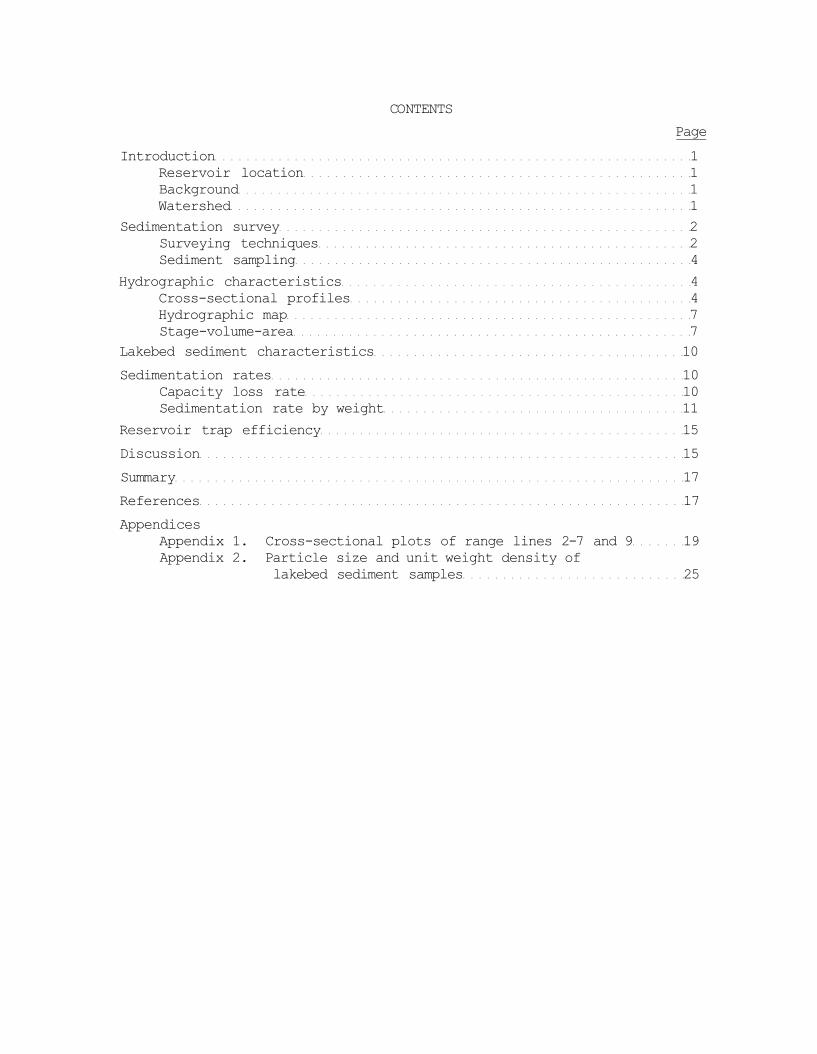
CONTENTS Page
Introduction 1 Reservoir location 1 Background 1 Watershed 1
Sedimentation survey 2 Surveying techniques 2 Sediment sampling 4
Hydrographic characteristics 4 Cross-sectional profiles 4 Hydrographic map 7 Stage-volume-area 7
Lakebed sediment characteristics 10 Sedimentation rates 10
Capacity loss rate 10 Sedimentation rate by weight 11
Reservoir trap efficiency 15 Discussion 15 Summary 17 References 17 Appendices
Appendix 1. Cross-sectional plots of range lines 2-7 and 9 19 Appendix 2. Particle size and unit weight density of
lakebed sediment samples 25

SEDIMENTATION SURVEY OF DAWSON LAKE, MORAINE VIEW STATE PARK, MC LEAN COUNTY, ILLINOIS by William P. Fitzpatrick
INTRODUCTION The Illinois State Water Survey, with the cooperation of the Illinois
Department of Conservation, conducted a sedimentation survey of Dawson Lake in May 1986. This report presents the results of the sedimentation survey analyses of the current volume of the lake, the volume loss rate, the sediment accumulation rate, and various hydrographic characteristics of the lake.
Reservoir Location Dawson Lake is located in Moraine View State Park in McLean County
approximately 14 miles southeast of Bloomington, Illinois. The lake and dam are located in sections 34, 35, 26, and 27 of Township 23 N. Range 4E. The dam is located on a small tributary of the North Fork Salt Creek in the Sangamon River basin, which is a tributary of the Illinois River basin.
Background The dam and spillways were designed by the Illinois Department of
Conservation and the consulting firm of Walter E. Hanson Company. Pautler Brothers Contractors, Inc., of Chester, Illinois, were the construction contractors. Construction of the dam was begun in June 1962 and completed on September 19, 1963 (U.S. Army Corps of Engineers, 1980).
The principal use of the lake is for recreation and wildlife habitat. The lake and the surrounding state park provide a variety of recreational activities such as fishing, boating, hiking, camping, and picnicking.
Watershed The watershed area of Dawson Lake is 2880 acres (4.5 square miles).
The lake and watershed are located in the Bloomington Ridged Plain of the Central Lowland Physiographic Province. This area is characterized by low broad moraine ridges separated by wide stretches of flat to gently
1

undulating till plains. The soils in the watershed were formed in loess deposits 4 to 6 feet thick. The loess deposits are underlain by Batestown Till of the Wedron Formation.
SEDIMENTATION SURVEY The field survey of the lake was conducted on May 5 to May 9, 1986.
This field survey involved performing a hydrographic survey of water depths, measurements of accumulated sediment thicknesses, and sampling of the lakebed sediment for particle size and density analysis.
Surveying Techniques The hydrographic survey was accomplished by establishing nine
permanent survey range lines across the lake as shown in figure 1. The range lines were marked at both ends by concrete survey monuments placed on the lakeshore as part of this survey. The survey monuments will provide a means of relocating the range lines for future surveys of the lake.
The range lines were established to provide a means of horizontal positioning of depth measurement points on the lake surface. The basic procedure for horizontal control was: 1) position the survey monuments on the lakeshore and locate the point on an aerial photograph, 2) attach a marked polypropylene cable between the monuments, 3) measure the total distance between the monuments and the distance to each depth measurement point. Water depth and sediment thickness measurements were measured from a boat by using a 2-inch-diameter aluminum sounding pole. An 8-inch-diameter sediment shoe was used on the end of the sounding pole. This sediment shoe was constructed so that it "floated" on the top of the loose sediment layers at the bottom of the lake. The shoe increased the precision of depth measurements by providing a sensitive measurement of the top of the sediment. The shoe was held to the pole by limiting guides at the base of the pole and was free to slide up and down the pole as the pole was pushed into the lakebed. The sounding pole was driven through the soft accumulated sediment to the firmer original valley bottom to provide a measurement of the original depth of the lake.
Additional depth measurements were made with a Lowrance sonar depth finder. The sonar depth finder was used to run supplemental cross sections
2

Figure 1. Dawson Lake plan view, showing survey range lines and lake segment numbers
3

of the lakebed to improve the precision of the contour mapping of the lake. The sonar was also used to supplement measurements made with the sounding pole. The continuous trace of the sonar was used to interpret bottom structure between discrete sounding pole measurements. The sounding pole measurements were used to calibrate the data obtained from the sonar runs and to correct for errors associated with boat drift and pitch as well as horizontal alignment. Fourteen cross sections were surveyed by means of the sonar technique (figure 2).
Sediment Sampling Following the sounding of the lake cross sections, samples of the
lakebed sediment were collected to determine 1) the particle size distribution, 2) the unit weight density, and 3) changes in the sediment over the lengths of the core samples. Cores of the lakebed sediment were obtained with a 3-foot-long, 2-inch-diameter sampler. Cores of the sediment were examined and subsampled in the workboat for density and particle-size samples. A total of 19 particle-size and 13 density samples were obtained.
HYDROGRAPHIC CHARACTERISTICS Data collected during the survey were analyzed to determine changes in
the cross-sectional areas of the lake, to develop a hydrographic contour map, and to develop the stage-volume relationship. The information on the changes in the cross-sectional areas of the lake was used to determine the sedimentation and volume loss rates of the lake.
Cross-Sectional Profiles Data on the current and original depths of the lake were used to
generate cross-sectional topographic profile plots of the lakebed. Figure 3 is a plot of the cross-sectional data obtained from range line 8 located in the upstream end of the lake. It can be seen in this plot that the old stream channel of the valley has accumulated more sediment than the old floodplain surfaces. This is typical of the depositional pattern of sediment in a lake in which the deeper portions tend to fill faster and the result is a gradual smoothing of the lakebed over time. Figure 4 is a plot
4

Figure 2. Locations of survey range lines, sonar lines, core samples, and survey monuments, Dawson Lake
5

Distance from monument 8E in feet
Figure 3. Cross-sectional plot of lakebed topography at range line 8
Distance from monument 1E In feet
Figure 4. Cross-sectional plot of lakebed topography at range line 1
6

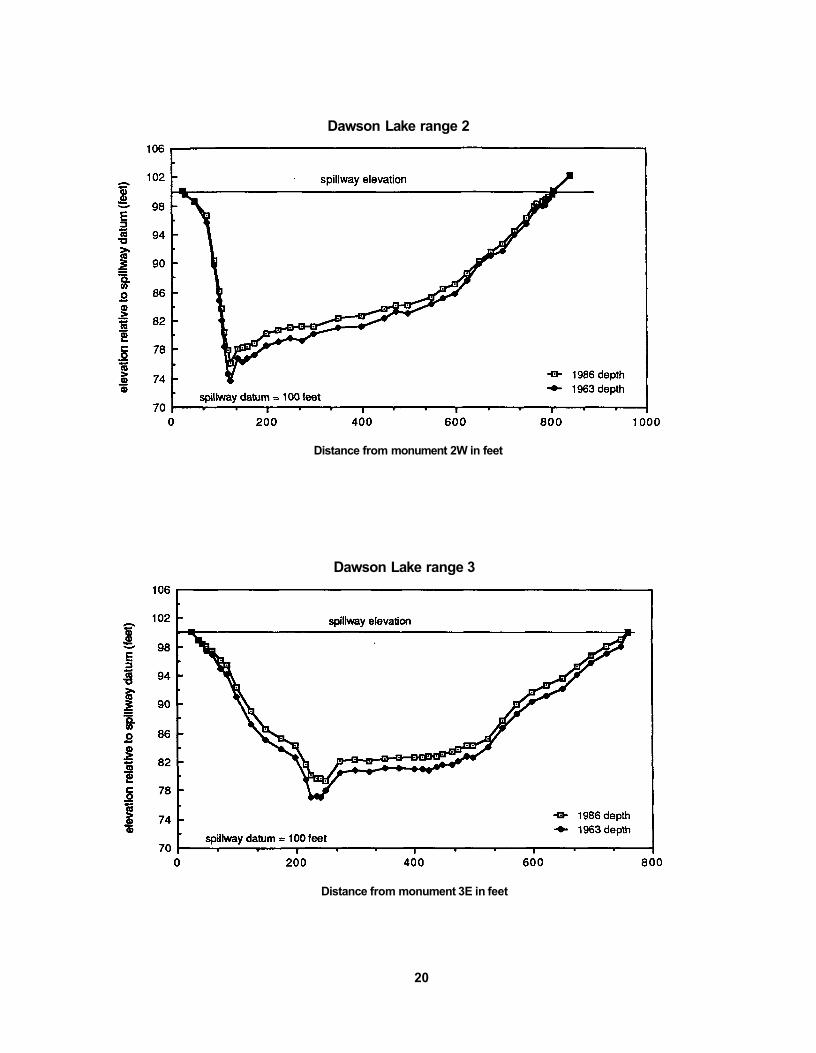
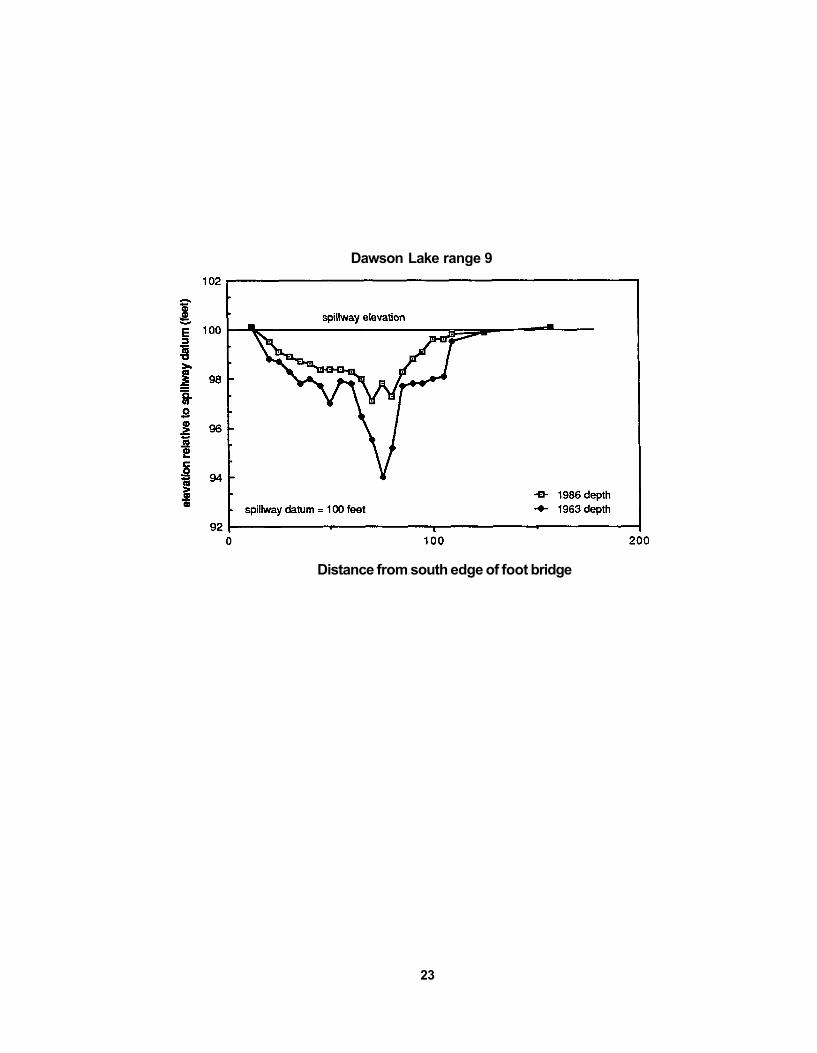
of the cross-sectional data from range 1 located in the downstream area of the lake near the dam. The sedimentation pattern at this cross section is typical of the deeper portions of the lake where the sediment thickness is less than the upstream areas and the maximum depth is decreasing much faster than the average depth. At range 1 the original average and maximum depths were 18.7 and 27.5 feet, respectively, while in 1986 these values were 17.6 and 25.6 feet, respectively. Plots of the cross-sectional data obtained from range lines 2-7 and 9 are presented in Appendix 1.
Hydrographic Map A contour map of the lakebed relative to the spillway elevation is
shown in figure 5. This map has a contour interval of 4 feet. From this map, it is seen that the deepest portion of the lake is the area near the dam. The maximum measured depth of the lake is 25.6 feet. It can also be seen in this map that the lakebed tends to smooth out in the upstream direction.
Stage-Volume-Area The contour map of the lake was used to analyze the relationship
between water level or stage in the lake and the capacity and area of the lake. The contours, drawn at 4-foot intervals, represent what the lake area would be if the pool level was drawn down to those elevations. Therefore the area enclosed by each contour represents the lake surface area at that contour elevation, and the stage-area relationship can be determined by measuring the area enclosed by each contour. In a similar manner the lake volume at each contour elevation can be determined by using the contour-volume technique. Figure 6 is a stage-volume-area diagram of the lake. It can be seen in this figure that the bulk of the lake's volume is contained in the top 8 feet of the lake. At a lake level at spillway elevation the lake's volume is 1475 acre-feet (481 million gallons), and at a lake level 8 feet below spillway elevation the volume is 614 acre-feet (200 million gallons). The stage-volume-area diagram in figure 6 can be used to determine the surface area and volume of the lake at various pool elevations.
7

Figure 5. 1986 hydrographic map of Dawson Lake

SURFACE AREA IN ACRES
LAKE VOLUME IN ACRE-FEET
Figure 6. 1986 stage-volume-area curves, Dawson Lake

LAKEBED SEDIMENT CHARACTERISTICS The lake sediment in Dawson Lake is predominantly silt. The simple
averages of all samples are: 49% silt, 38% clay, and 13% sand and gravel. Appendix 2 lists the results of particle size analyses of 19 lakebed samples. The samples show a general trend of increasing proportions of silt and clay from upstream to downstream. This trend is expected in lake sediment and is due to the relatively large volume of the lake and low velocities of flow that occur in the lake compared to those in the inflowing tributaries. The relatively low flow velocities of the lake cause the larger-sized sediment to tend to settle out near the inflowing tributaries, whereas the finer silts and clays, which are transported at lower velocities, are carried further into the lake.
The sediment in the lake has a higher average density than that in other lakes of this size. The high density is due to 1) a higher proportion of silt and sand in the sediment than in other Illinois lakes, and 2) aeration and compaction that result from lake pool drawdown caused by the periodic draining of the lake.
SEDIMENTATION RATES The amount of sediment in a lake can be measured in units of volume
and mass. The sediment volume corresponds to the water storage capacity displaced by the sediment. The sediment mass, as measured by sediment tonnage, is a measurement that is not dependent on the degree of compaction and is therefore a parameter that can be used to assess the absolute sediment accumulation. This measurement of sediment weight allows a direct comparison with other lakes. The weight of sediment in a lake is a function of sediment inflow and the trap efficiency of the lake. This parameter can be used to provide an estimate of the amount of eroded material transported to the lake and out of the watershed.
Capacity Loss Rate The sedimentation survey measured current and original water depths
relative to the spillway elevation across nine survey range lines. These survey range lines were used to divide the lake into ten segments for the purpose of calculating the current and original volume in each lake segment.
10
The methods used in the analysis are detailed in the SCS National Engineering Handbook. Section 3, Chapter 7 (SCS, 1968). To facilitate the calculation of the lake volume and the sediment tonnage, the computer program Primoid (Fitzpatrick et al., 1985), developed at the Illinois State Water Survey, was used on the CDC CYBER system at the University of Illinois.
Table 1 presents the segmental volumes and sediment accumulations in the lake for the year of construction (1963) and for 1986. It can be seen in this table that the original volume of the lake was 1619 acre-feet (528 million gallons) and that the 1986 volume was 1475 acre-feet (481 million gallons). The total volume loss was 144 acre-feet (46.9 million gallons). In general the upper segments of the lake have lost a greater percentage of their original volume than the downstream segments, which is typical of sediment deposition in a lake.
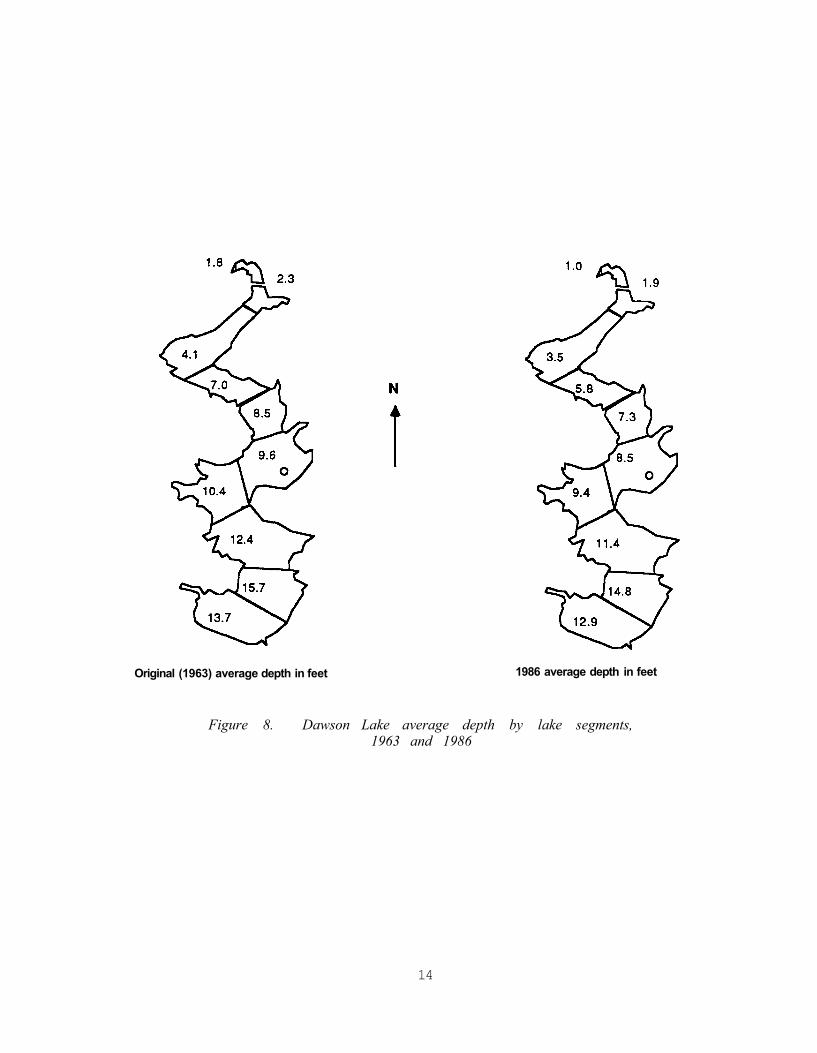
Figure 7 is a map of the lake showing the segmental volume losses for the period 1963-1986. This figure shows the higher segmental volume losses in the upper segments than in the lower downstream segments of the lake. Figure 8 presents the original and current average depth of the lake by segments. This figure shows that the downstream segments have lost approximately 1 foot of average depth, whereas the upper segments have lost an average of approximately 1/2 foot. In comparing the segmental lake volume losses in percentages and in feet it can be seen that the deeper downstream areas have lost more total depth but a lower percentage of their original volume. This discrepancy is the result of the much larger volume of the lower downstream segments.
Sedimentation Rate by Weight The sediment volume values, which are equivalent to the water capacity
loss rate, were combined with the results of the sediment density analyses to assess the weight of the deposited sediment. Thirteen density samples were obtained from the lakebed during the field survey. The locations and measured densities of these samples are listed in Appendix 2.
The goal of field sampling for density was to obtain a sample from an area of the lake that represents the average density of the sediment deposited there. Five of the samples were cut from the middle of sediment cores. Four sediment cores were subsampled at two locations to determine
11
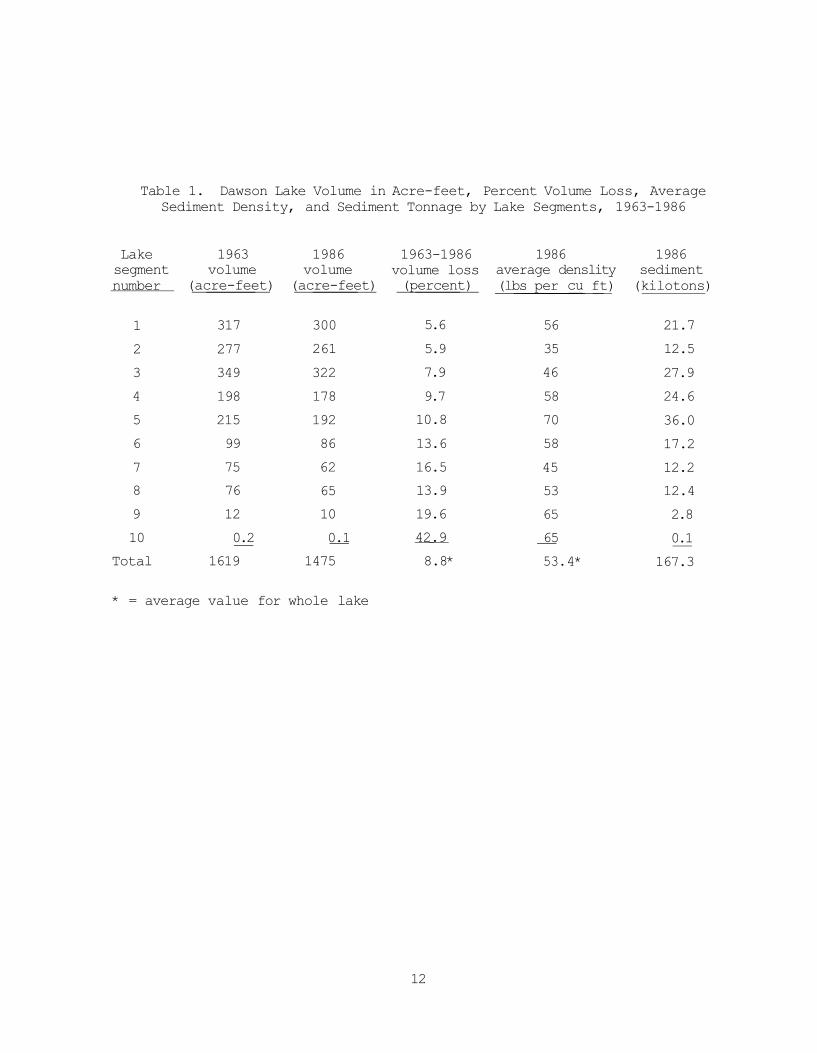
Table 1. Dawson Lake Volume in Acre-feet, Percent Volume Loss, Average Sediment Density, and Sediment Tonnage by Lake Segments, 1963-1986
* = average value for whole lake
12
Lake 1963 1986 1963-1986 1986 1986 segment volume volume volume loss average dens lity sediment number (acre-feet) (acre-feet) (percent) (lbs per cu ft) (kilotons)
1 317 300 5.6 56 21.7 2 277 261 5.9 35 12.5 3 349 322 7.9 46 27.9 4 198 178 9.7 58 24.6 5 215 192 10.8 70 36.0 6 99 86 13.6 58 17.2 7 75 62 16.5 45 12.2 8 76 65 13.9 53 12.4 9 12 10 19.6 65 2.8 10 0.2 0.1 42.9 65 0.1
Total 1619 1475 8.8* 53. 4* 167.3

Figure 7. Dawson Lake volume loss from 1963 to 1986, by lake segments
13
Original (1963) average depth in feet 1986 average depth in feet
Figure 8. Dawson Lake average depth by lake segments, 1963 and 1986
14

the changes in density with depth. This was performed where the sediment was thick enough for multiple subsamples. A total of ten sites in the lake were sampled for sediment density.
The average sediment density in 1986 was 53.4 pounds per cubic foot. This value is relatively high for lake sediment and is due to compaction and aeration of the sediment caused by draining of the lake. The average sediment densities used for each lake segment in determining the sediment tonnages are listed in table 1 together with the segmental volumes and total sediment tonnages.
RESERVOIR TRAP EFFICIENCY The trap efficiency of a reservoir is a measure of the proportion of
the total sediment load carried into the lake that is deposited in the lake. Brune (1953) and Dendy (1974) have developed methods of estimating the trap efficiency of lakes and reservoirs from the ratio of the average yearly inflow to the storage capacity. On the basis of these methods, it is estimated that the average trap efficiency of the lake is approximately 96%. This value is an approximation of the average proportion of sediment that will settle in the lake in an average year.
This survey determined that 167,300 tons of sediment had been deposited in the lake in the 22-1/2-year period since 1963, an average rate of 7436 tons per year. The trap efficiency ratio can be used to estimate the total amount of sediment delivered to the lake. The total sediment accumulation of 167,300 tons divided by the trap efficiency of 96% yields an estimated total inflow of 174,300 tons since 1963. The long-term average rate of sediment delivery to the lake is 7746 tons per year.
DISCUSSION This survey determined a long-term volume loss rate of 0.4% per year
for Dawson Lake. This rate is about average for lakes of this size in Illinois. On the basis of Water Survey records obtained from other sedimentation surveys, the range of volume loss rates in Illinois lakes is from 0.2% to 4.0% per year.
The range of values for sediment deposition in Illinois lakes is from 0.1 to 6.0 tons per acre of watershed per year. The measured rate for
15

Table 2. Data Summary from Sedimentation Survey of Dawson Lake
Lake constructed in 1963 Lake sedimentation survey performed in 1986
Time interval =22.5 years
Total volume in 1963 = 1619 acre-feet 528 million gallons
Total volume in 1986 = 1475 acre-feet 481 million gallons
Total volume loss = 144 acre-feet 46.9 million gallons 8.8 percent
Loss rate per year =6.4 acre-feet per year 2.1 million gallons per year 0.4% per year
Sedimentation rate = 167,300 tons total in 22.5 years 7,436 tons per year
20 tons per day
Watershed sediment delivery rate = 61 tons per acre in 22.5 years 2.7 tons per acre per year
Average depth: 1963 =10.2 feet 1986 - 9.3 feet
16

Dawson Lake of 2.6 tons per acre per year is about average for smaller lakes in the state. Smaller lakes tend to have higher per-acre sedimentation rates than larger lakes.
SUMMARY A sedimentation survey of Dawson Lake was conducted in 1986 to
determine the present capacity of the lake, as well as the sedimentation rate over the period since the lake's construction.
Dawson Lake's original storage capacity was 1619 acre-feet (528 million gallons) in 1963. In 1986 the storage capacity was 1475 acre-feet (481 million gallons), which represents a volume loss of 144 acre-feet (46.9 million gallons), a total loss of 9%. Between construction of the lake (in 1963) and 1986, 167,300 tons of sediment was deposited in the lake.
The upstream areas of the lake have lost a greater proportion of their original storage volume than the downstream areas, as shown in figure 7. The average sediment thickness is higher in the downstream areas; however, the larger volumes of the downstream areas have resulted in a lower percentage volume loss.
Table 2 is a summary of the results of this survey.
REFERENCES
Brune, G.M., 1953. Trap efficiency of reservoirs. American Geophysical Transactions 34(3): 407-418.
Dendy, F.E., 1974. Sediment trap efficiency of small reservoirs. Transactions of the ASAE, July: 898-908.
Fitzpatrick, William P., W.C. Bogner, and N.G. Bhowmik, 1985. Sedimentation investigation of Lake Springfield, Springfield, Illinois. Illinois State Water Survey Contract Report 363, May.
Soil Conservation Service, USDA, 1968. National Engineering Handbook, Section 3, Sedimentation, Chapters 1, 2, and 7.
U.S. Corps of Engineers, 1980. Illinois River Basin, Moraine View Dam, Dawson Lake, McLean County, Illinois. Inventory Number 00281. Inspection Report, National Dam Safety Program, Chicago, Illinois.
17

Appendix 1. Cross-Sectional Plots of Range Lines 2-7 and 9
19
Dawson Lake range 2
Distance from monument 2W in feet
Dawson Lake range 3
Distance from monument 3E in feet
20

Dawson Lake range 4
Distance from monument 4W in feet
Dawson Lake range 5
Distance from monument 5W in feet
21

Dawson Lake range 6
Distance from monument 6W in feet
Dawson Lake range 7
Distance from monument 7E in feet
22
Dawson Lake range 9
Distance from south edge of foot bridge
23

Appendix 2. Particle Size and Unit Weight Density of Lakebed Sediment Samples
25

Depth below lakebed to midpoint of Density
Range Sampling point sample (feet) % gravel % sand % silt % clay (lb/cu ft)
1 west 1/4 point 0.05 0.35 0.65
0 2 26 72 38.5 73.5
1.05 0 63 23 14 1 east 1/4 point 0.05 0 0 25 75
2 west 1/4 point 0.55 0.75
0 2 65 33 34.3
4 east 1/4 point 0.10 0.35
0 2 39 59 40.9
4 west 1/4 point 0.35 75.3 0.55 28 22 35 15
5 midpoint 0.05 0.55
0 1 50 49 74.9
6 west 1/4 point 0.05 0 1 47 53 0.75 9 21 53 17
6 east 1/4 point 0.05 0 4 68 28
7 east 1/4 point 0.10 0.45 1.45
0 1 57 43 33.4 29.7
1.65 0 2 56 42 7 west 1/4 point 0.05
0.45 0 1 60 40
58.5
8 east 1/4 point 0.05 0 2 60 38 8 west 1/4 point 0.05
0.55 0 2 65 33
41.5 1.45 1.75
0 7 64 29 64.4
9 midpoint 0.10 0.35
0 6 60 34 50.3
1.35 1.55
1 43 34 22 79.0
1.75 2 23 46 29
26