Embed Size (px)
Citation preview

Illinois report cardsAdvisory Committee Meeting
July 11, 2011

110711 IL report card ACM 3 vLTM.pptx 2
Draft – For discussion only
Cop
yrig
ht ©
201
1 by
The
Bos
ton
Con
sulti
ng G
roup
, Inc
. All
right
s re
serv
ed.
Agenda
Review "one-pager" report card
Share update on focus groups – schedule, coverage
Discuss additional areas for development of report card
Align on next steps

110711 IL report card ACM 3 vLTM.pptx 3
Draft – For discussion only
Cop
yrig
ht ©
201
1 by
The
Bos
ton
Con
sulti
ng G
roup
, Inc
. All
right
s re
serv
ed.
Analysis and benchmarking
Kicking off the refinement and validation phase
DevelopmentRefinement and
validationLegislation preparation
March -June July-August September-October
Define report card vision, approach
Strategic approach
Benchmark report cards across country, research best practices
Assess current IL evaluations and map data sources
Cost benefit analysis1
Outline potential research to assess usage, impact of report card
Develop calculation rubrics
Stakeholder engagement
1-1 and small group discussions with Advisory Comm. members, other stakeholders in education community2
Principal, teacher, administration focus groups
Family, community, student focus groups
Implementation support
Plan for implementation (roll out schedule, comm. plan) & use to improve school perf.
Deliverables
Input to legislation
We are here
Report card vision
Alpha version of report card
Evaluate link to education strategy and inputs for any evolution of strategy
Implementation plan
Input to legislation
Calculation rubrics
Beta version of report card
Link to education strategy
Legislature
1. For new metrics. 2. List of interviewees included in appendix
Key meetings P-20 P-20ACM

110711 IL report card ACM 3 vLTM.pptx 4
Draft – For discussion only
Cop
yrig
ht ©
201
1 by
The
Bos
ton
Con
sulti
ng G
roup
, Inc
. All
right
s re
serv
ed.
Recap: Three guiding questions for report cards to address
Report cards
Are students achieving quality outcomes?
Are students making progress toward quality outcomes?
Is the school/district environment conducive to enabling quality outcomes and progress?
1
2
3

110711 IL report card ACM 3 vLTM.pptx 5
Draft – For discussion only
Cop
yrig
ht ©
201
1 by
The
Bos
ton
Con
sulti
ng G
roup
, Inc
. All
right
s re
serv
ed.
Alpha version of high school report card developed for testing in focus groups
Guiding ? Sub-category Metric
Outcomes
Graduation % of students graduating within 4 years
Readiness % of students college & career ready (% achieving composite ACT score ≥ 20)
Success % of graduates enrolled in post-secondary institution within 2 semesters after graduation
Progress
On track % of Freshman on track
Performance% of students meeting/exceeding state standards% of students exceeding state standards
Growth % of students achieving expected growth (under construction)
Environ-ment
Instructional quality
Teacher qualification - composite or 1 metric 1
Teacher performance (under construction) - % of teachers in each evaluation bucket
Presence & engagement
% of students with fewer than 10 absences from school
% of teachers present in class 95% or more of their scheduled class time
% of teachers who returned to school from previous year (3 year average)
# of different principals serving at school in last 6 years
Family & community engagement in student/ teacher survey
Learning climate Learning climate in student/ teacher survey
Prof. climate Professional climate in teacher survey
1. Metrics being considered – ACT/SAT scores, undergrad university caliber, in-field teaching, emergency/provisionally certified
To be pulled from climate survey
Report cards
110711 IL report card ACM 3 vLTM.pptx 6
Draft – For discussion only
Cop
yrig
ht ©
201
1 by
The
Bos
ton
Con
sulti
ng G
roup
, Inc
. All
right
s re
serv
ed.
Alpha version of middle school report card developed for testing in focus groups
Guiding ? Sub-category Metric
OutcomesReadiness
% of 8th graders meeting/exceeding state standards in reading and math% of 8th graders exceeding state standards in reading and math
% of 8th graders passing Algebra I with grade of C or better
Success % of most recent alumni Freshman on track
Progress
On track% of 6th graders meeting/exceeding state standards in reading and math% of 6th graders exceeding state standards in reading and math
Performance% of students meeting/exceeding state standards% of students exceeding state standards
Growth % of students achieving expected growth (under construction)
Environ-ment
Instructional quality
Teacher qualification - composite or 1 metric 1
Teacher performance (under construction) - % of teachers in each evaluation bucket
Presence & engagement
% of students with fewer than 10 absences from school
% of teachers present in class 95% or more of their scheduled class time
% of teachers who returned to school from previous year (3 year average)
# of different principals serving at school in last 6 years
Family & community engagement in student/ teacher survey
Learning climate Learning climate in student/ teacher survey
Prof. climate Professional climate in teacher survey
Report cards
1. Metrics being considered – ACT/SAT scores, undergrad university caliber, in-field teaching, emergency/provisionally certified
To be pulled from climate survey

110711 IL report card ACM 3 vLTM.pptx 7
Draft – For discussion only
Cop
yrig
ht ©
201
1 by
The
Bos
ton
Con
sulti
ng G
roup
, Inc
. All
right
s re
serv
ed.
Alpha version of elementary school report card developed for testing in focus groups
Guiding ? Sub-category Metric
OutcomesReadiness/ Success
% of 3rd graders meeting/exceeding state standards in reading and math% of 3rd graders exceeding state standards in reading and math% of 5th graders meeting/exceeding state standards in reading and math% of 5th graders exceeding state standards in reading and math
Progress
On track % of students Kindergarten ready 1 (under construction)
Performance% of students meeting/exceeding state standards% of students exceeding state standards
Growth % of students achieving expected growth (under construction)
Environ-ment
Instructional quality
Teacher qualification - composite or 1 metric 2
Teacher performance (under construction) - % of teachers in each evaluation bucket
Presence & engagement
% of students with fewer than 10 absences from school
% of teachers present in class 95% or more of their scheduled class time
% of teachers who returned to school from previous year (3 year average)
# of different principals serving at school in last 6 years
Family & community engagement in teacher survey
Learning climate Learning climate in teacher survey
Prof. climate Professional climate in teacher survey
1. While under construction, recommend including '% of Kindergarteners who experienced preschool' on elementary school report card cover page as a context characteristic. 2. Metrics being considered – ACT/SAT scores, undergrad university caliber, in-field teaching, emergency/provisionally certified
Report cards
To be pulled from climate survey

110711 IL report card ACM 3 vLTM.pptx 8
Draft – For discussion only
Cop
yrig
ht ©
201
1 by
The
Bos
ton
Con
sulti
ng G
roup
, Inc
. All
right
s re
serv
ed.
Agenda
Review "one-pager" report card
Share update on focus groups – schedule, coverage
Discuss additional areas for development of report card
Align on next steps

110711 IL report card ACM 3 vLTM.pptx 9
Draft – For discussion only
Cop
yrig
ht ©
201
1 by
The
Bos
ton
Con
sulti
ng G
roup
, Inc
. All
right
s re
serv
ed.
Focus groups being held across IL with various stakeholders
S M T W Th F S
1 2
3 4 5 6 7 8 9
10 11 12 13 14 15 16
17 18 19 20 21 22 23
24 25 26 27 28 29 30
31 1 2 3 4 5 6
7 8 9 10 11 12 13
14 15 16 17 18 19 20
21 22 23 24 25 26 27
28 29 30 31
Ju
lyA
ug
us
t
Principals, administrators
Principals, administrators
Principals, administrators, teachers
Principals, administrators, teachers
Families, community, students
Families, community, students
Families, community, students
Focus group approachFocus group approachTargeting principals, administrators, teachers in
July; Families, community, students in AugustTargeting principals, administrators, teachers in
July; Families, community, students in August
Aiming for broad geographic representation• Targeting North, South and Central Illinois• Ensuring inclusion of different locales – i.e.
rural, suburban and urban
Staggered start of stakeholder groups• Will refine report card prior to parent focus
groups based on principal, administrator, teacher input
Focus group structure• Ideal focus group size is 5-8 participants
(maximum of 10-12 participants)
Focus groups
List of facilitator materials in appendix; Facilitator trainings in progress, weekly timings offered

110711 IL report card ACM 3 vLTM.pptx 10
Draft – For discussion only
Cop
yrig
ht ©
201
1 by
The
Bos
ton
Con
sulti
ng G
roup
, Inc
. All
right
s re
serv
ed.
Planned focus groups provide broad geographic coverageContact focus group lead team to volunteer to lead additional discussions
Focus groups
Focus group lead teamFocus group lead team
Principals and administrators• Mike Jacoby• Max McGee
Teachers• Amy Alsop• Larry Frank• Sue Walter
Families, parents and community• Kathy Ryg• Deb Strauss
Students• Through schools:
Mike Jacoby, Max McGee• Through community groups:
Kathy Ryg, Deb Strauss
Administrators/Principals
Families/Communities
Teacher focus group planning in progress – aiming to provide broad geographic representation
Families, parents and community group planning to target student.

110711 IL report card ACM 3 vLTM.pptx 11
Draft – For discussion only
Cop
yrig
ht ©
201
1 by
The
Bos
ton
Con
sulti
ng G
roup
, Inc
. All
right
s re
serv
ed.
Focus group discussion aimed at gathering detailed feedback from key stakeholders
Discussion segment Goals for focus group discussions
Part I: Introduction
• Briefly introduce the IL report card project• Introduce facilitator and participants
Part II:Unaided awareness
• Capture initial thoughts on what is important for parents according to the participants without being biased by others in the room or by the report cards
Part III: Initial reactions
• Capture initial reaction to and comprehension of new report card• Understand most and least valuable metrics• Gather potential uses of report card• Determine which metrics may be confusing
Part IV: Deep dive on metrics
• Test preferences for metrics, focusing on key areas of debate among committee
Part V: Design & distribution
• Solicit input on display and potential improvements for ease of use• Solicit input on distribution on potential training and information to accompany
report card
Part VI: Wrap up
• Gather overall response to report card
Focus groups
Focus group design based on commercial client experience from BCG Center for Consumer Insight.

110711 IL report card ACM 3 vLTM.pptx 12
Draft – For discussion only
Cop
yrig
ht ©
201
1 by
The
Bos
ton
Con
sulti
ng G
roup
, Inc
. All
right
s re
serv
ed.
Agenda
Review "one-pager" report card
Share update on focus groups – schedule, coverage
Discuss additional areas for development of report card
Align on next steps

110711 IL report card ACM 3 vLTM.pptx 13
Draft – For discussion only
Cop
yrig
ht ©
201
1 by
The
Bos
ton
Con
sulti
ng G
roup
, Inc
. All
right
s re
serv
ed.
Several activities running concurrent with focus groups
Ongoing activitiesOngoing activities
Report card rubrics
Analysis for peer sets and teacher qualification metric
District report card
Detailed report
Cost benefit analysis
Path forwardPath forward
• To be discussed today
• Developing sample peer sets based on geography and demographic characteristics
• Analyzing teacher characteristics (e.g. ACT/SAT, undergrad university, in-field teaching, emergency/provisional certification) vs. school growth measures1
• To be discussed today
• Gathering and prioritizing metrics based on committee discussions, interviewees and benchmarking
• Interviewing data, platform experts on feasibility of potential design
• Performing analysis for metrics currently not available to ISBE
1. Utilizing CPS value-add data for analysis.
110711 IL report card ACM 3 vLTM.pptx 14
Draft – For discussion only
Cop
yrig
ht ©
201
1 by
The
Bos
ton
Con
sulti
ng G
roup
, Inc
. All
right
s re
serv
ed.
Report card legend
Calculation methodology
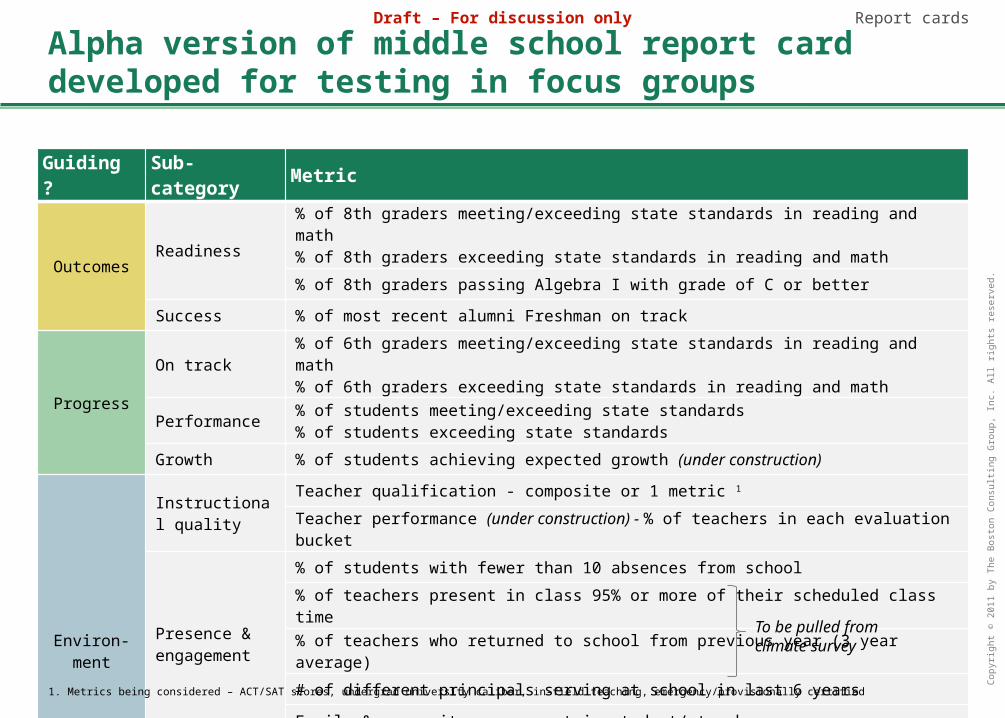
Given varied purposes of rubrics, recommend legend and calculation methodology for each report card
Primary audiencePrimary audience
Families
Data analysts, administrators and teachers
PurposePurpose
Aid comprehension of report card
Detail metric calculations so metrics are:
• Reported consistently across schools
• Fully understood by those using/ interpreting data
DefinitionDefinition
• Defines metric with words in simple way
• Explains why metric is important• 1 page in total
• Defines math calculation (i.e. equation)
• Provides details on inclusions/ exclusions
• Lists source and any other important notes
• 1 page per metric
For ACM discussion: Any metrics of particular interest for focus group feedback?
Report card rubrics

110711 IL report card ACM 3 vLTM.pptx 15
Draft – For discussion only
Cop
yrig
ht ©
201
1 by
The
Bos
ton
Con
sulti
ng G
roup
, Inc
. All
right
s re
serv
ed.
For discussion: High school report card legend (I)Any metrics of particular interest for focus group feedback?
Metric Definition Why it's important
Outcomes
Graduation% of students graduating within 4 years
Percent of freshman who graduated within 4 years, adjusted for mobility.
High school graduation is essential for success in today's economy.
Readiness% of students college & career ready
Percent of students who achieved an ACT composite of at least 20. This uses scores on the PSAE test in 11th grade.
Students are more likely to succeed in the long-term if they finish high school ready to learn and succeed in college and career.1
Success% of graduates enrolled in post-secondary institution within 2 semesters after graduation
Percent of on-time graduates who enroll at a post-secondary school; includes colleges, universities, community colleges, and trade/ vocational schools.
Two‐thirds of new jobs require college or other postsecondary education.
Progress
On track % of Freshman on track
Percent of students who have earned sufficient credit to be promoted without failing more than one core class at the end of their freshman year (not including summer school).
Success in freshman courses is a key predictor of ultimate success in and graduation from high school.
Performance
% of students meeting/exceeding state standards
% of students exceeding state standards
Percent of students meeting or exceeding and percent of students exceeding state standards for all subjects on the PSAE exam (an 11th grade exam).
Indicates whether students are performing at or above acceptable standards set by the state in core subjects.
Growth% of students achieving expected growth (under construction)
TBD – Percent of students that achieve the expected academic improvement from year to year.
To stay on track to graduate, students must achieve expected growth from one academic year to the next.
Environ-ment
Instructional quality
Teacher qualification index TBDQualified teachers lead to improved student performance.
Teacher performance evaluation results (under construction)
How teachers' performance was rated across the 4 possible evaluation classifications: excellent; proficient; needs improvement; unsatisfactory.
Teachers with past success in the classroom are more likely to improve student performance moving forward.
Report card rubrics

110711 IL report card ACM 3 vLTM.pptx 16
Draft – For discussion only
Cop
yrig
ht ©
201
1 by
The
Bos
ton
Con
sulti
ng G
roup
, Inc
. All
right
s re
serv
ed.
For discussion: High school report card legend (II)Any metrics of particular interest for focus group feedback?
Metric Definition Why it's important
Environ-ment
Presence & engagement
% of students with fewer than 10 absences from school
Percent of students who were absent from school fewer than 10 times. A student is considered absent when s/he is in school for less than 5 hours while school is in session (regardless of absence reason).
Students with high attendance are more likely to be on track for graduation; students with low attendance are more likely to drop out.
% of teachers present in class 95% or more of their scheduled class time
Percent of teachers present in their classrooms for 95% or more of their scheduled class time.
Quality instruction requires consistent presence of students' teachers in the classroom.
% of teachers who returned to school from previous year (3 year average)
Percent of teachers from last year who returned to the school this year. A 3 year average is used given year to year variations.
Retaining qualified teachers leads to improved student performance.
Principal stabilityNumber of different principals holding position at school over past 6 years.
Retaining qualified principals provides stable leadership, which motivates teachers and creates a positive environment for students.
Family & community engagement in student/ teacher survey
TBDStudents whose parents and communities are closely involved in their educational progress are more likely to succeed in school.
Learning climate
Learning climate in student/ teacher survey
TBDWhen students feel safe, motivated, and challenged, they are more likely to succeed academically.
Prof. climateProfessional climate in teacher survey
TBD
Understanding teaching conditions helps schools pinpoint improvement areas; responding to these can lead to stronger teacher recruitment, motivation, and/or retention, which ultimately improves student performance.
Report card rubrics

110711 IL report card ACM 3 vLTM.pptx 17
Draft – For discussion only
Cop
yrig
ht ©
201
1 by
The
Bos
ton
Con
sulti
ng G
roup
, Inc
. All
right
s re
serv
ed.
Suggest four guiding questions for the district report card
Are students achieving quality outcomes?
Are students making progress toward quality outcomes?
Is the school/district environment conducive to enabling quality outcomes and progress?
Is the district providing resources and leadership to enable quality outcomes and progress?
1
2
3
4
Do you agree with the additional guiding question?
New question
District report cards
110711 IL report card ACM 3 vLTM.pptx 18
Draft – For discussion only
Cop
yrig
ht ©
201
1 by
The
Bos
ton
Con
sulti
ng G
roup
, Inc
. All
right
s re
serv
ed.
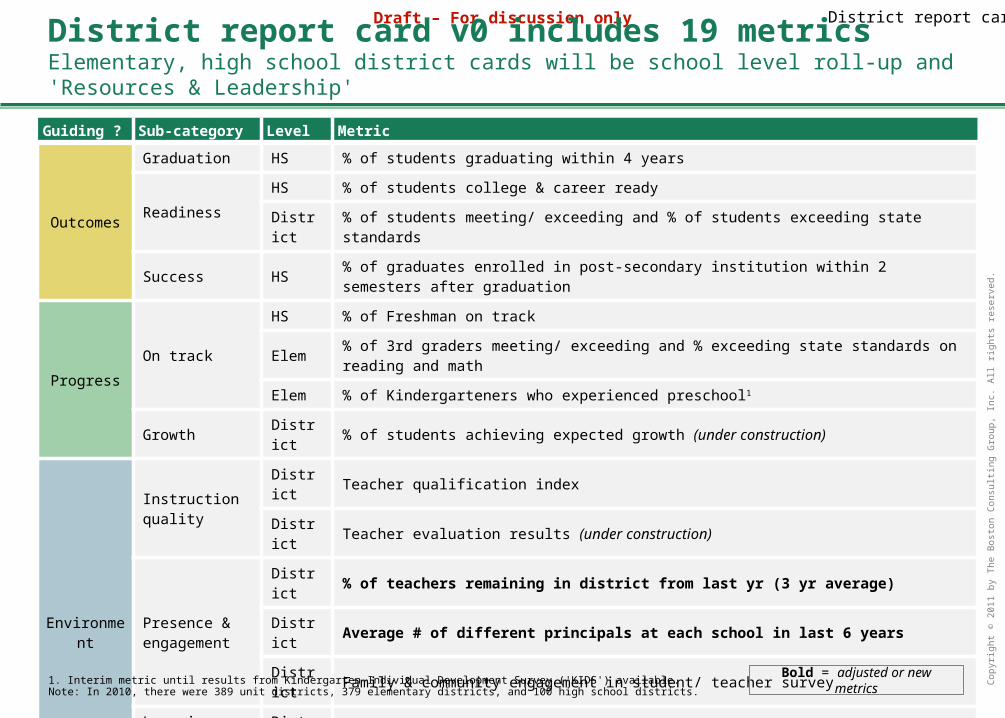
District report card v0 includes 19 metricsElementary, high school district cards will be school level roll-up and 'Resources & Leadership'
Guiding ? Sub-category Level Metric
Outcomes
Graduation HS % of students graduating within 4 years
ReadinessHS % of students college & career ready
District % of students meeting/ exceeding and % of students exceeding state standards
Success HS % of graduates enrolled in post-secondary institution within 2 semesters after graduation
ProgressOn track
HS % of Freshman on track
Elem % of 3rd graders meeting/ exceeding and % exceeding state standards on reading and math
Elem % of Kindergarteners who experienced preschool1
Growth District % of students achieving expected growth (under construction)
Environment
Instruction quality
District Teacher qualification index
District Teacher evaluation results (under construction)
Presence & engagement
District % of teachers remaining in district from last yr (3 yr average)
District Average # of different principals at each school in last 6 years
District Family & community engagement in student/ teacher survey
Learning climate District Learning climate in student/ teacher survey
Prof. climate District Professional climate in student/ teacher survey
Resources & Leadership
ResourcesDistrict Per pupil expenditure: split by instruction, school-level operating, district-level operating
District Average teacher salary
LeadershipDistrict Principal evaluation results (under construction)
District # of different superintendents in last 6 years
1. Interim metric until results from Kindergarten Individual Development Survey ('KIDS') available. Note: In 2010, there were 389 unit districts, 379 elementary districts, and 100 high school districts.
Bold = adjusted or new metrics
District report cards

110711 IL report card ACM 3 vLTM.pptx 19
Draft – For discussion only
Cop
yrig
ht ©
201
1 by
The
Bos
ton
Con
sulti
ng G
roup
, Inc
. All
right
s re
serv
ed.
District report card v0 excludes some metricsFrom student/ teacher attendance and middle and elementary report cards
Guiding ? Sub-category Level Metric excluded from district report card v0 Rationale for exclusion
Outcomes
Readiness MS % of 8th graders passing Algebra I with grade of C or better
Reporting district-wide performance on state tests instead given encompasses more grade levels1
Readiness MS % of 8th graders meeting/ exceeding and % exceeding state standards on reading and math
Readiness/ Success Elem % of 5th graders meeting/ exceeding and % exceeding
state standards
Success MS % of most recent alumni Freshman on trackReporting '% of Freshman on track' from HS report card; this metric would be duplicative
Progress On track MS % of 6th graders meeting/ exceeding and % exceeding state standards on reading and math
Limited research to support as key indicator
Environment Presence & engagement
District % of students with fewer than 10 absences Prefer to include only at school-level to emphasize school's accountability for student/ teacher attendanceDistrict % of teachers present in class 95% or more of scheduled
class time
1. Made explicit decision to include 3rd grade math / reading state test performance as district 'on track' metric given research supports metric as key indicator of future success.
Do you agree with these exclusions?
District report cards

110711 IL report card ACM 3 vLTM.pptx 20
Draft – For discussion only
Cop
yrig
ht ©
201
1 by
The
Bos
ton
Con
sulti
ng G
roup
, Inc
. All
right
s re
serv
ed.
Agenda
Review "one-pager" report card
Share update on focus groups – schedule, coverage
Discuss additional areas for development of report card
Align on next steps
110711 IL report card ACM 3 vLTM.pptx 21
Draft – For discussion only
Cop
yrig
ht ©
201
1 by
The
Bos
ton
Con
sulti
ng G
roup
, Inc
. All
right
s re
serv
ed.
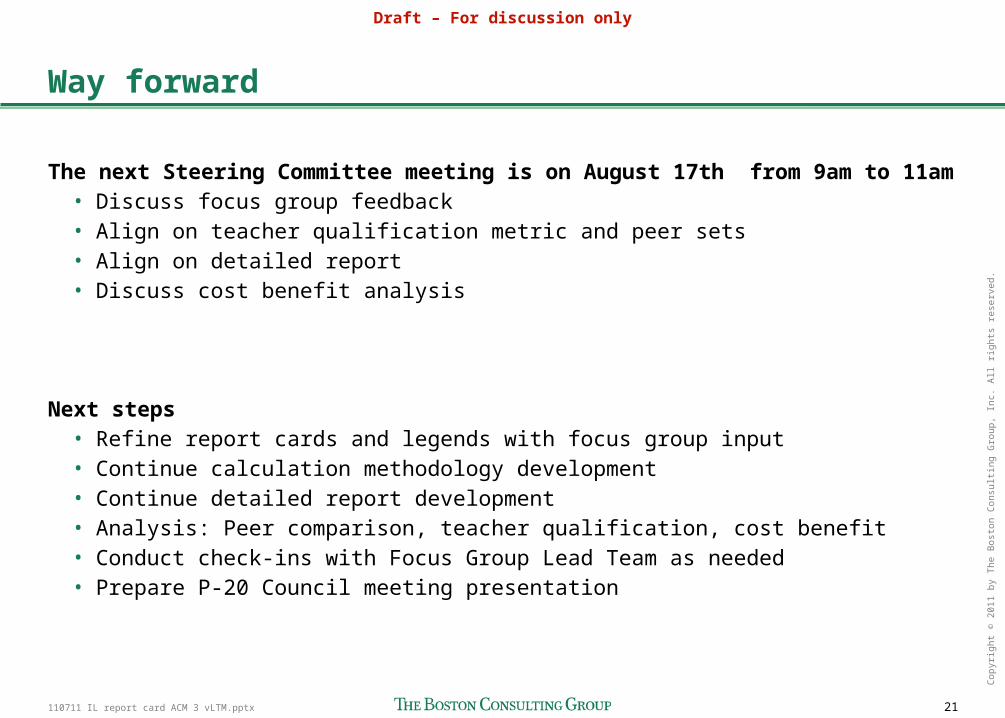
Way forward
The next Steering Committee meeting is on August 17th from 9am to 11am• Discuss focus group feedback• Align on teacher qualification metric and peer sets• Align on detailed report• Discuss cost benefit analysis
Next steps• Refine report cards and legends with focus group input• Continue calculation methodology development• Continue detailed report development• Analysis: Peer comparison, teacher qualification, cost benefit• Conduct check-ins with Focus Group Lead Team as needed• Prepare P-20 Council meeting presentation