Embed Size (px)
Citation preview
EVALSOLUTIONS INC.
2010
Evaluation Report Illinois Mathematics & Science Partnership
Ms. Marica Cullen, Division Administrator, ISBE
Mr. Gil Downey, Principal Consultant, ISBE
Analyses provided by Dr. Elizabeth Oyer
www.evalsolutions.com
Site Evaluators:
Mrs. Debra Greaney, Area V Learning Technology Center
Dr. Tania Jarosewich, Censeo Group
E V A L S O L U T I O N S I N C .

This page intentionally blank

Evaluation Report: 2009-2010
Table of Contents
Background ............................................................................................................................................. 5
IMSP Program Evaluation Framework ...................................................................................................... 6
Participants ......................................................................................................................................... 6
Core program components .................................................................................................................. 7
Overview of Illinois State-Level MSP Evaluation Data Sources .............................................................. 8
Implementation Fidelity....................................................................................................................... 9
Results for IMSP Implementation .......................................................................................................... 10
Qualities of the partnering relationship ............................................................................................. 11
Summary of Site Visits ................................................................................................................... 11
Nature of the Partnerships............................................................................................................. 13
Adequacy of Resources .................................................................................................................. 22
Performance and Outcomes .............................................................................................................. 23
Meta-Analysis Results .................................................................................................................... 23
Site Interview and Survey Data Results .......................................................................................... 33
Communication of the IMSP .......................................................................................................... 41
Implementation of Evaluation ........................................................................................................ 41
Participation by the School Partner ................................................................................................ 42
Alignment of Programs with Participant Needs .............................................................................. 42
Conclusions and Discussion ................................................................................................................... 43
Evaluation Framework ....................................................................................................................... 43
Quality of the Partnerships ................................................................................................................ 43
Progress toward Outcomes................................................................................................................ 44
Sustainability ..................................................................................................................................... 44
Recommendations for Improvement ................................................................................................. 44
Communication of the IMSP .......................................................................................................... 44
Implementation of Evaluation ........................................................................................................ 45

Participation by the School Partner ................................................................................................ 45
Alignment of Programs with Participant Needs .............................................................................. 45
References ............................................................................................................................................ 46
Tables
Table 1. IMSP Funded Grants – Master’s Degree Programs ...................................................................... 6
Table 2. IMSP Funded Grants – Workshop-Institute Program 1 ................................................................ 7
Table 3. IMSP Funded Grants - Workshop Institute Program 2 ................................................................. 7
Table 4. Number of partners/participants named by grantees for State Implementation Phase Survey . 15
Table 5. Aggregated Survey Results (Agee or Strongly Agree/Satisfied or Highly Satisfied) .................... 17
Table 6. ANOVA analysis for control-experimental group ....................................................................... 26
Table 7. Mean and SD of the effect sizes of the Experimental and Control group ................................... 27
Table 8. Teacher Background Predictors for Multi-level Meta-Analysis .................................................. 28
Table 9. Multi-level model for student background variables ................................................................. 28
Table 10. Model 1 - Teacher and Student............................................................................................... 30
Table 11. Longitudinal Trends in IMSP Effect Sizes ................................................................................. 32
Table 12. Mode Level of Development Across Categories ...................................................................... 35
Table 13. Aggregated Survey Results (Agee or Strongly Agree/Satisfied or Highly Satisfied) .................. 36
Figures
Figure 1. Overall Partnership Qualities ........................................................ Error! Bookmark not defined.
Figure 2. Partner Satisfaction with Vision ............................................................................................... 18
Figure 3. Partner Satisfaction with Leadership ....................................................................................... 19
Figure 4. Partner Satisfaction with Communication ............................................................................... 20
Figure 5. Partner Satisfaction with Technical Support ............................................................................ 21
Figure 6. IMSP Effect Sizes ..................................................................................................................... 33
Figure 7. Partnership Progress Chart 2 from Site Interviews ................................................................... 35
Figure 8. Mode Stage of Development by Model Type from Site Interviews ........................................... 36
Figure 9. Partner Satisfaction with Progress Toward Objectives ............................................................. 37
Figure 10. Partner Satisfaction with Sustainability ................................................................................. 40
Appendices
Appendix A IMSP Logic Model
Appendix B IMSP Protocols and Survey Instruments
Appendix C Member Check Survey
Appendix D Tests Used by Sites for Content Knowledge

This page intentionally blank

[Evaluation Report: 2009-2010] Page 1
Evaluation Report: 2009-2010
Executive Summary
Qualities of the partnering relationship
In the 2009-2010 school year, an overview of the qualities of the partnerships indicated action plans and
local evaluation implementation are the areas with grants showing less progress. The partnership
composition and quality of the partnership in terms of trust and mutual needs showed the strongest
progress across grants.
Based on site interviews, many positive relationships were developed between partners. As a whole, the
majority of partnerships were characterized as collaborative and positive with ongoing communication
between partners. Many grants seemed to have a strong collaboration between university partners with
more restricted roles of outside partners. Some partnerships were characterized by restricted
collaboration by other partners with centralized leadership.
Finally, some partnerships were difficult to describe confidently because no partners outside the project
director participated in the interview session.
In surveys, the majority of respondents across partner types (industry, school, higher education, and
teacher) were positive about their experiences in terms of the vision, leadership, and technical support.
Teachers were generally consistent across all categories with most indicating high levels of satisfaction
and confidence across the vision, leadership, communication, and technical support.
It appears that at the end of the second year of implementation, WIP grants are more consistently at the
higher levels of development with 100% at the developing or transformative stages and 55% of the MS
grants at these higher stages of development.

[Evaluation Report: 2009-2010] Page 2
IMSP Performance and Outcomes
Across the three funding cycles in 2009-2010, the IMSP served 957 teachers and administrators and
approximately 54,719 students.
For this second year of implementation, both the effect sizes in the 2009 CCSSO meta-analysis of
national MSP trends as well as the IMSP meta-analysis results are provided. In this context, the IMSP
effect sizes for mathematics and science are moderate to large. In a comparison against last year's IMSP
meta-analysis results, IMSP effect sizes for 2009-2010 are larger across the board except for the overall
student effect size, which is smaller in 2009-2010 (2008-2009=.74; 2009-2010= .62).
Respondents were generally positive about their perceptions of their local IMSP progress toward
objectives. In site interviews, the most commonly described success for building capacity for the
partnerships was the successful implementation of coursework or project programming. Some
partnerships noted success with teacher pedagogy and opportunities for collaboration. A few
partnerships reported institutional changes in the school partner, mostly in terms of transitions in staff
due to poor economic conditions or restructuring unrelated to the grant. A few partners noted positive
changes that they attributed to the grant. Finally, some partners noted changes in teacher knowledge
and attitudes for their project. Fewer programs reported evidence of student change.
0 0.2 0.4 0.6 0.8 1 1.2 1.4
Teacher Overall
Teacher MS Degree
Teacher WIP
Teacher Math
Teacher Science
Student Overall
Student MS Degree
Student WIP
Student Math
Student Science
1.17
1.04
1.09
1.05
1.24
0.62
0.48
0.76
0.5
0.68
Red Line indicates student math Effect Size in CCSSO 2009 meta-analysis Green Line indicates student science Effect Size in CCSSO 2009 meta-analysis Orange Dots indicate effect sizes for 2008-2009
IMSP Effect Sizes 2009-2010
[Evaluation Report: 2009-2010] Page 3
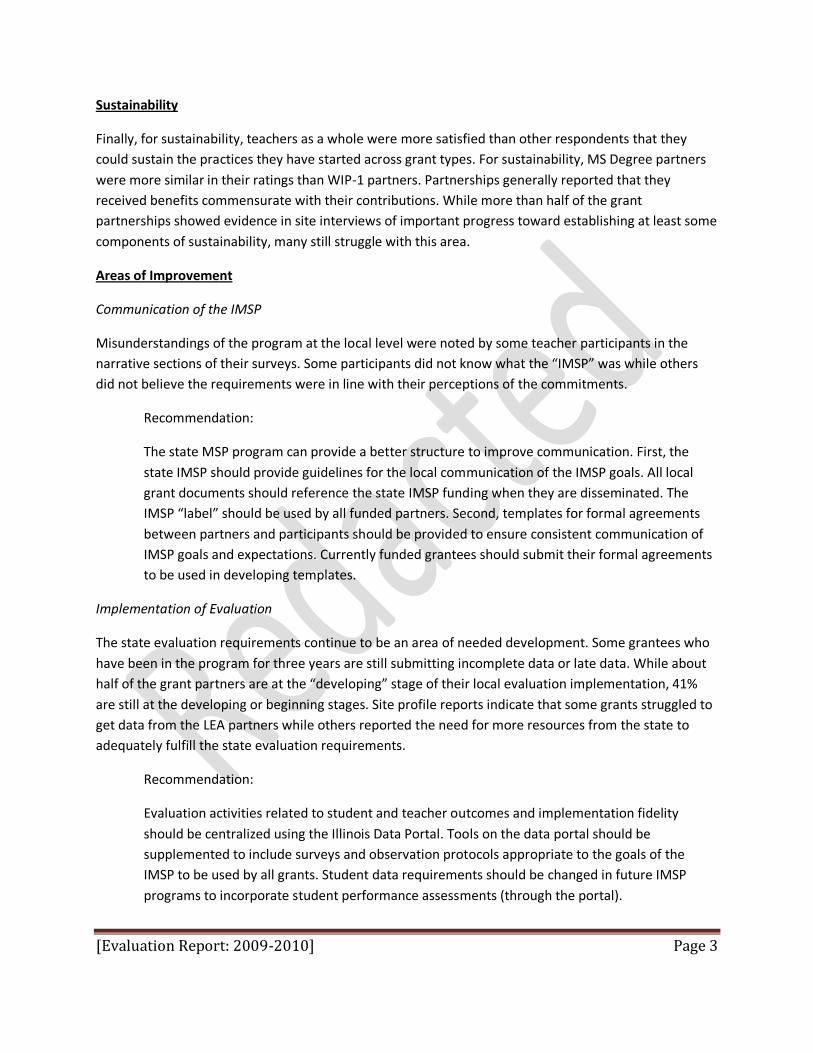
Sustainability
Finally, for sustainability, teachers as a whole were more satisfied than other respondents that they
could sustain the practices they have started across grant types. For sustainability, MS Degree partners
were more similar in their ratings than WIP-1 partners. Partnerships generally reported that they
received benefits commensurate with their contributions. While more than half of the grant
partnerships showed evidence in site interviews of important progress toward establishing at least some
components of sustainability, many still struggle with this area.
Areas of Improvement
Communication of the IMSP
Misunderstandings of the program at the local level were noted by some teacher participants in the
narrative sections of their surveys. Some participants did not know what the “IMSP” was while others
did not believe the requirements were in line with their perceptions of the commitments.
Recommendation:
The state MSP program can provide a better structure to improve communication. First, the
state IMSP should provide guidelines for the local communication of the IMSP goals. All local
grant documents should reference the state IMSP funding when they are disseminated. The
IMSP “label” should be used by all funded partners. Second, templates for formal agreements
between partners and participants should be provided to ensure consistent communication of
IMSP goals and expectations. Currently funded grantees should submit their formal agreements
to be used in developing templates.
Implementation of Evaluation
The state evaluation requirements continue to be an area of needed development. Some grantees who
have been in the program for three years are still submitting incomplete data or late data. While about
half of the grant partners are at the “developing” stage of their local evaluation implementation, 41%
are still at the developing or beginning stages. Site profile reports indicate that some grants struggled to
get data from the LEA partners while others reported the need for more resources from the state to
adequately fulfill the state evaluation requirements.
Recommendation:
Evaluation activities related to student and teacher outcomes and implementation fidelity
should be centralized using the Illinois Data Portal. Tools on the data portal should be
supplemented to include surveys and observation protocols appropriate to the goals of the
IMSP to be used by all grants. Student data requirements should be changed in future IMSP
programs to incorporate student performance assessments (through the portal).

[Evaluation Report: 2009-2010] Page 4
Participation by the School Partner
While some partnerships enjoyed a strong relationship with their school partners, others struggled with
relationships that were in transition or off-balance with the weight of the responsibilities falling on the
university or lead agency in the partnership. Some school partners are approaching their IMSP as a
professional development vendor rather than engaging in a full partnership.
Recommendation:
A more formal application and recruitment process needs to be implemented by the state IMSP
for LEA eligibility to participate. Districts should formally identify local needs and acknowledge
formally their commitment to a deeper participation in the IMSP program. Alternatives need to
be considered to the current recruiting practices focused on local IMSP partners recruiting
participating teachers individually in order to improve the commitment, relevance, and
coherence of the program for the local LEA.
Alignment of Programs with Participant Needs
In surveys, some teachers described barriers in learning that they connected with the wide differences
in abilities between teacher participants. Elementary and secondary teachers alike noted the mismatch
with their needs when they were blended with each other.
Recommendation:
As distinct models, there is no evidence that the two models (graduate versus workshop
institute) are different in their student and teacher outcomes. There is some evidence that
serving teachers from mixed grade and content areas is not as effective at serving the teachers’
needs generally. The IMSP should consider re-formulating the distribution of grants to provide
more targeted opportunities that can address the needs of the schools and teachers more
flexibly. District level commitment to multiple IMSP grants that more specifically target content
or grade level needs may be an appropriate alternative. Centralized evaluation data collection
through the portal will help minimize the burden of participating in multiple grants.
[Evaluation Report: 2009-2010] Page 5
Evaluation Report: 2009-2010
Background
The Illinois Mathematics and Science Partnership (IMSP) program represents an important response to a
very critical need in students' mathematics and science achievement. The IMSP program is designed to
improve the performance of students in the areas of mathematics and science by encouraging states,
IHEs, LEAs, and elementary and secondary schools to participate in programs that improve and upgrade
the status and stature of mathematics and science teaching, focus on the education of mathematics and
science teachers as a career-long process; bring mathematics and science teachers together with STEM
professionals, and develop more rigorous mathematics and science curricula aligned with state and local
standards.
The IMSP program was initiated by the Illinois State Board of Education (ISBE) as a response to
achievement needs for Illinois students in mathematics and science as well as to increase the
percentage of high school math and science teachers certified in their field
Addressing the Need
Model 1:
The first model currently funded in the IMSP program centers around Master’s Degree programs that
represent partnerships across colleges of Arts and Science and Education with school districts to provide
degree programs uniquely tailored to the needs of the IMSP (see Table 1).
Model 2:
In 2008-2009 and 2009-2010, the ISBE funded two cycles of a second model, the Workshop Institute
MSP programs (WIP-1, WIP-2; see Table 2 and
Table 3). This model focused on two week intensive training sessions complemented by shorter training
and mentoring sessions throughout the year. The first round of intensive training was conducted in June
2009.

[Evaluation Report: 2009-2010] Page 6
IMSP Program Evaluation Framework
The ISBE has developed two MSP programs to address the need for improved mathematics and science
instruction in Illinois.
Participants
Initially, the Master’s Degree MSP model (Model 1) was represented by twenty-four separate
partnerships across ten universities throughout the state. The first phase of development for this model
was completed in 2007-2008, a planning phase for finalizing the Master’s programs and recruiting
teachers to participate.
In 2008-2009, grants moved into the implementation phase of the program with teachers beginning
coursework in the fall 2008 or winter 2009. Of the original cohort of grants, sixteen grants across eight
universities began the implementation phase of their projects. Four grants across four universities
extended their planning to delay implementation until 2009-2010. Four grants were discontinued and
did not complete the process to continue into the implementation phase.
The IMSP higher education partners include the Illinois Institute of Technology (IIT), Illinois State
University (ISU), Northern Illinois University (NIU), Southern Illinois University – Carbondale (SIU-C),
Southern Illinois University – Edwardsville (SIU-E), University of Illinois Urbana Champaign (UIUC), Loyola
University (LU), Aurora University (AU), Bradley University (BU), and DePaul University (DU). See Table 1
for breakdown of institutions and content.
Across the three funding cycles in 2009-2010, the IMSP served 957 teachers and administrators and
approximately 54,719 students.
Table 1. IMSP Funded Grants – Master’s Degree Programs
Institution
Content Focus IIT ISU NIU SIU-C SIU-E UIUC LU AU BU DU Total
Life Sciences 1** 1 2
Chemistry 1 1* 2
Earth/Space Science 1 1
Elementary 1* 1* 1 1 1 5
Environmental Science 1** 1
IT/Pre-engineering 1 1 2
Physics 1 1
Secondary Mathematics 1 1 1** 1 1 1** 6
Total 1 4 3 1 1 1 2 4 2 1 20

[Evaluation Report: 2009-2010] Page 7
*Implementation delayed until January 2009
**Implementation delayed until 2009-2010
Table 2. IMSP Funded Grants – Workshop-Institute Program 1
Institution
Content Focus AU UIUC ISU Lee-Ogle ROE
Monroe-Randolph ROE
Rock Island ROE
St. Clair ROE
Total
Nanotechnology 1 1
Physics 1 1
Middle School Mathematics & Science
1 1
Secondary Science 1 1 2
Secondary Mathematics 1 1 1 3
Secondary Mathematics & Science
1 1
Total 2 1 2 1 1 1 1 9 Table 3. IMSP Funded Grants - Workshop Institute Program 2
Institution
Content Focus AU BHS ROE 28
ISU Monroe-Randolph ROE
Lee-Ogle ROE
St. Clair ROE
NIU Rock Island ROE
Total
Elementary 1 1
Middle School Mathematics
1 1
Secondary Mathematics & Science
1 1 2
Science 1 1 2
STEM 1 1 1 3
Total 1 1 2 1 1 1 1 1
Core program components
Each of the programs in both models has the following core elements: Content-focused professional development. The Master’s Program model is focused around new or revised graduate level programs granting Master’s degrees for participants. The Workshop-Institute Program model incorporates intensive content-focused training with mentoring. Partnerships between STEM organization or business, government agencies, universities, and local school districts and school service agencies. All grants in both models have formed important partnerships to execute the grant activities. For the Master’s Program model, all grants incorporate

[Evaluation Report: 2009-2010] Page 8
collaboration across colleges within their universities. In both the Master’s Program and Workshop Institute Program, grants have developed or used existing partnerships with industry, government, education service agencies, or school partners as part of the IMSP. The nature of the partners and their relationships varies across grants. The Illinois cross-site evaluation framework uses local evaluation results in a systematic way as an indicator of the effectiveness of the IMSP project overall. Meta-analysis methodology is used to provide estimates of the impact across the range of mathematics, science, and STEM partnership initiatives funded by the IMSP program. For the second year of implementation, meta-analyses were applied to model the scale of change in teachers’ and students’ content knowledge. In addition to meta-analyses, results from qualitative analyses of interviews and artifacts were triangulated with quantitative survey results to provide a more complete picture of Illinois' progress toward its MSP goals.
Overview of Illinois State-Level MSP Evaluation Data Sources
IMSP outcomes evolved from the CCSSO matrix of professional development outcomes (CCSSO, 2007). Outcome categories. There are five categories of outcomes for which local grants submit data to the state each year: 1. Quality of PD Activities 2. Change in teacher content knowledge 3. Change in instructional practice (including strategies, resources, and content knowledge) 4. Change in student achievement 5. Quality of Partnerships State Data Templates. Local grant programs submit aggregated data for the state evaluation for outcomes 1-4. Participant Surveys – Partners and teacher participants are surveyed each year by the state evaluation team (see Appendix B). The survey was adapted from the Annual Satisfaction Survey for Community Coalitions (Wolff, 2003) and covers their perceptions of the effectiveness of the local MSP vision, leadership, communication, technical assistance, progress and outcomes, and sustainability. The survey focuses largely on state outcome 5 as well as providing evidence for outcomes 1, 2, 3, and 5, listed above. IMSP grantees submitted lists of teacher, school, industry, and higher education partners to complete the surveys. Response rate for the surveys was moderate at 65%. Analyses after the survey administration indicated the internal consistency was strong with α= .97 (n=822). In order to compensate for attrition in responses due to the “not applicable” response choice (which causes the listwise deletion of cases in analyses and an inflated Cronbach’s alpha), these responses were replaced with the appropriate subscale mean. Site Visit Interviews & Protocols – Interview protocols conducted by the state site evaluation team are available in Appendix B. The protocol addresses all of the outcome categories 1-5.

[Evaluation Report: 2009-2010] Page 9
Implementation Fidelity
Implementation fidelity is built into the state level evaluation framework. The state requirements rely on the local evaluation models using a variety of data sources to establish the levels of implementation of grant goals in participating teachers’ classrooms. Although there are broad commonalities across grants, the unique scope and sequence of the content, strategies, resources, and technologies across programs precludes the use of a single implementation measure for everyone. In addition to the differences in goals and design, differences in local school settings require flexibility at the local grant level for measuring implementation. Contextual variables related to the participants (administrators, teachers, and students), competing reforms in the participating schools, and unique partnerships with STEM industry professionals need to be considered when determining how to measure local implementation. Common Implementation Areas. Regardless of local needs, all grantees measure the following common implementation elements: • Integration of content expertise from program activities • Integration of curriculum resources • Integration of instructional strategies and classroom activities • Integration of STEM technologies These four areas are the focus of the state-level implementation evaluation requirements. Each local grant measures the levels at which participants are implementing expected grant activities using a variety of data sources (e.g., surveys, logs, interview and/or focus groups, classroom observation, and extant data). Examples of each of these methods for assessing implementation include: 1) Surveys – like the Survey of Enacted Curriculum which gives a broad view of implementation and the use of a wide variety of strategies. However, this survey will not provide information about specific new lessons, tools, strategies, or resources that teachers are implementing in their classrooms. 2) Logs – teachers can complete instructional logs tailored to the exact implementation requirements of each grant during the period of implementation specified by the grantee. 3) Extant data –grantees can collect and analyze lesson plans, teacher reflection journals, and artifacts from action research projects to examine implementation. 4) Observation – several observation protocols are available to provide a framework for observation. Some resources have been used extensively in IMSP grants. There are other protocols available that are more generic or specialized that could complement the data collection (e.g., protocols specific to technology or inquiry). Grantees select an observation protocol that aligns with their specific program goals.

[Evaluation Report: 2009-2010] Page 10
5) Interviews/Focus Groups – grantees may employ interviews or focus groups to supplement their understanding of teachers’ implementation or barriers to implementation. At the site level, site evaluators summarized interview field notes and project artifacts in Program Profiles for each IMSP grant (see IMSP Profiles Supplemental Report). Principal Investigators for each grant reviewed the profiles and submitted clarifications and comments through an online survey (see Appendix B). Analyses of the partnerships focused on Partnership Composition, Organizational Structure, Action Plan and Operational Guidelines, Qualities of the Partnering Relationship, and Evaluation Implementation. Grant profiles and narrative survey responses were coded using Maxqda 10 software. Statistical analyses were conducted using SPSS 18 and SAS.
Results for IMSP Implementation
In 2009-2010, the state-level evaluation efforts focused on teacher and student outcomes for Master’s
Program and Workshop-Institute Program (WIP)-1 grants that continued implementation as well as
teacher outcomes for WIP-2 grants. Site visits were completed in spring 2010 for the thirty grants in the
MS and WIP-1 (see Appendix B for protocol). Site evaluators summarized interview field notes and
project artifacts in Program Profiles for each IMSP grant (see IMSP Profiles Supplemental Report).
Principal Investigators for each grant reviewed the profiles and submitted clarifications and comments
through an online survey as desired.

[Evaluation Report: 2009-2010] Page 11
Qualities of the partnering relationship
To what extent is there a mutual need, trust, equality in decision-making,
resource exchange, transparency, respect, representation, enthusiasm, and
sustained understanding between partners and stakeholders across this IMSP
grant? To what extent is leadership collaborative and transformational? Who
are the leaders? Have the IMSP resources been sufficient to reach
implementation goals?
Partnership profiles and Partner survey results were analyzed in terms of the characteristics associated
with quality partnerships, including mutuality & trust, leadership, resources, and collaboration and
mechanisms of communication.
Partners and participants were surveyed for feedback on their experiences in the IMSP for 2009-2010.
The surveys asked for satisfaction ratings in terms of vision, leadership, communication, technical
support, progress toward objectives, and sustainability.
Summary of Site Visits
Detailed profiles of grants in the implementation stages were developed based on interviews and review
of extant data conducted by the state evaluation team. Based on these profiles, projects were described
in terms of the degree to which they were in the beginning, emerging, developing, or transformative
stages.
The site visit tools include the site visit protocol and an analysis of artifacts that programs submit to
support interview data (see Appendix B). Sites also submit for review IMSP membership list, IMSP/ IHE
organizational charts, logic/change models, evaluation frameworks, evaluation data analysis plans,
formal agreements or contracts in addition to the grant agreement, meeting agendas, meeting minutes,
budget summary/narratives, newsletters, websites, and other forms or policy statements. Site
evaluators analyze the data in formal profile reports that are reviewed by the local grantee (see
Appendix C). In addition, the site evaluator analyses and interview evidence are incorporated into the
state level reports to triangulate with survey and achievement data.
The Site Visit Protocol for the first two years of data collection asked questions about the partnership
composition, organizational structure of the partnership, the action plan and operational guidelines, and
the quality of the partnership. Partnership Composition is considered in terms of the degree to which
IMSP staffing, collaboration between colleges, as well as the context for implementing the MSP shows
effective coordination for achieving outcomes. Organizational Structure indicates the extent to which
governance and decision-making bodies of the MSP were stable and effective. Action Plan & Operational
Guidelines describe the nature of the program elements and the extent to which formal or informal
[Evaluation Report: 2009-2010] Page 12
agreements define, establish and support effective collaboration. Partnership Quality is represented as
the degree that the IMSP partnership meets mutual needs. The level of trust, respect, and mutual
accountability between partners, shared leadership between partners and sufficient resources to
accomplish goals are also elements of partnership quality. In the second year, Performance and
Outcomes elements were added to the protocol to assess the participants’ perspectives on the IMSP
performance in terms of grant outcomes and capacity building for the partners. Sustainability profiles
indicate the degree to which the grant partners have benefitted from the grant and their perceptions of
the institutionalization and sustainability of the core grant elements. And finally, a profile of the Local
Evaluation Implementation is provided based on interviews of site partners to describe the resources,
methodology and lessons learned in the implementation of the evaluation framework. The interview
data is triangulated with summaries of the support of state level surveys and completion of the state
and federal data reporting requirements.
Based on the interview data, artifacts, and data provided to the state, site evaluators characterize the
progress that each site is making in each of the partnership areas along a four-level heuristic:
• Beginning stages are represented by articulated plans but no actions. The element is “on the
radar” but there is no substantive progress toward effective implementation. The quality of the plans is
inconsistent. Outcomes are not possible because no plans have been put into action. Plans may not
provide adequate foundation for full implementation.
• Emerging stages are represented by clear and articulated plans with some initial actions setting
the stage for implementation, but not enough substantive activity to establish implementation. The
quality of the articulated plan may be very strong or may have some apparent weaknesses amidst other
strengths. Outcomes are not imminent or predictable because high quality implementation has not
reached a minimum threshold.
• Developing stages show clear, strong implementation is in place, although corrections for
barriers, changes to plans, or consistency/satisfaction across stakeholders might be mixed. Positive
outcomes are evident but all goals are not fully realized or not on track.
• Transformative stages show such a clear, strong enacted plan. It can be considered a model for
others to use. Positive outcomes associated with the partnership seem inevitable or highly predictable.
Summary of Key Results
In the 2009-2010 school year, an overview of the qualities of the partnerships indicated action plans and
local evaluation implementation are the areas with grants showing less progress. The partnership
composition and quality of the partnership in terms of trust and mutual needs showed the strongest
progress across grants (see Figure 1).

[Evaluation Report: 2009-2010] Page 13
Figure 1. Partnership Quality
Nature of the Partnerships
Based on site interviews, many positive relationships were developed between partners. As a whole, the
majority of partnerships were characterized as collaborative and positive with ongoing communication
between partners. Several themes were evident in the interviews related to the nature of the
partnerships. A few grants were characterized by strong collaboration between university college
partners as well as with external industry and school partners with a more transformational, distributed
model of leadership.
“Operations are transparent and partners are kept well informed through a variety of methods.
There is still enthusiasm at all levels for the project. Meetings are well attended and have all
level of partners represented. Resources such as equipment are shared at the district level and
university level. Partners feel respected and there is a high level of trust apparent in the
program” (Site Evaluator Conclusion, MS Program).
LEA Administrator stated, “I think from my experiences of what sets this partnership apart is the
way that it is set up in a sense that I’ve seen many partnerships where there are people at the
giving end and receiving end. Genuinely mutual to a partnership and that philosophy is on the
way we set the agendas. It is not one person’s agenda, it is the group’s agenda and everyone is
willing to set that. And once you have that centralized concept that everyone agrees on then
there is no contention. There is no pulling or pushing. The agenda is set to fulfill everyone’s

[Evaluation Report: 2009-2010] Page 14
needs in a serious manner and that sets up a whole beneficial process” (Site Evaluator Evidence,
WIP Program).
"[University] has been highly supportive to our teachers and district in promoting the vision of
the IMSP program. We are quite pleased with the partnership and vision of STEM" (School
Partner, Graduate Grant Survey).
Many grants seemed to have a strong collaboration between university partners with more restricted
roles of outside partners.
“During the interview, the faculty described strong relationships among their group and stronger
connections between the faculty in the School of Education and the College of Arts and Sciences
as a result of this project. They all seemed to be aware of the issues facing the MSP and all had a
voice in offering suggestions and solutions. In contrast to these positive relationships, the
relationship with [the school district] was described as that of a ‘consumer/producer’
relationship. The relationships within [the school district] are primarily with individual teachers
not with district or school-level staff. The faculty said that they ‘don’t want to give up on [the
school district]’ and continue to try to communicate the benefits of the program to potential
teacher participants” (Site Evaluator Conclusion, MS Program).
Some partnerships were characterized by restricted collaboration by other partners with centralized
leadership. Communication may be bi-directional but it was generally more limited and information-
sharing in nature. The relationship between the partners and with the participants was weak.
“Program personnel report that changes in the school partner administration and district
reorganization has hampered efforts at collaboration. No district representatives were present
to provide input. Communication between the IMSP and [the school district] is extremely limited
at this point and they are not involved in the decision making process. Trust is also an issue due
to district policies that limit the collection of needed data from the district. There is still
enthusiasm for the program at [the university]” (Site Evaluator Conclusion, MS Program).
"I am a Superintendent Principal and while my teacher participates and finds it very beneficial to
himself and the class, I am not really part of this" (School Partner, WIP 2 IMSP Survey).
I perceive some kind of disconnect between school officials and these grant opportunities. In our
district, the school officials that make decisions about how our professional time can be
apportioned, seem completely unaware of the professional development that is happening and
how they could support it" (Teacher, WIP 1 IMSP Survey)
Finally, some partnerships were difficult to describe confidently because no partners outside the project
director participated in the interview session. With limited evidence from supporting sources, there was
not sufficient support to corroborate the nature of the partnership.

[Evaluation Report: 2009-2010] Page 15
“According to the PI, she and the co-PI lead the project, consulting with each other when
decisions need to be made. No other stakeholders attended the meeting to discuss project
leadership” (Site Evaluator Evidence, MS Program).
Partnership qualities are also evident from the partners each grant named to complete state partnership
surveys (see Table 4). For the implementation phase of the IMSP, all MS Degree projects named higher
education, 95% (n=19) named school partners, and 20% (n=4) named industry partners to complete
state surveys (see Table 4). Most WIP-1 projects named IHE partners to participate in surveys (89%,
n=8), 78% (n=7) named school partners, and 50% (n=4) named industry partners to participate in the
state survey. WIP-2 projects all named IHE partners to participate in surveys, 60% (n=6) named school
partners, and 20% (n=2) named industry partners to participate in the state survey.
Table 4. Number of partners/participants named by grantees for State Implementation Phase Survey
Grant Model Institution Category IHE Industry School Teacher
MS Degree Aurora Biology 6 4 6 25
MS Degree Aurora Earth/Space 6 4 25
MS Degree Aurora Elementary 6 4 9 25
MS Degree Aurora Sec Math 5 4 10 25
MS Degree ISU Chemistry 3 1 29
MS Degree ISU Elementary 9 1 27
MS Degree ISU IT/pre-eng 6 1 29
MS Degree ISU Sec Math 5 3 24
MS Degree NIU IT/pre-eng 11 2 27
MS Degree NIU Sec Math 5 1 29
MS Degree IIT Physics 12 1 18
MS Degree Loyola Chemistry 3 1 1 18
MS Degree Loyola Sec Math 1 1 21
MS Degree UIUC Elementary 17 2 24
MS Degree Bradley Elementary 17 4 20
MS Degree SIU-C Elementary 3 15 27
MS Degree NIU Biology 6 2 31
MS Degree DePaul Sec Math 10 4 26
MS Degree Bradley Environment 16 4 20
MS Degree SIU-E Sec Math 4 28
WIP-1 Aurora University MS / HS Mathematics (with connections to Physical Sciences)
7 5 1 25
WIP-1 Aurora University MS / HS Physical Sciences (with connections to Mathematics)
5 1 21

[Evaluation Report: 2009-2010] Page 16
Grant Model Institution Category IHE Industry School Teacher
WIP-1 UIUC HS STEM specifically Nanotechnology
1 1 21
WIP-1 ISU MS / HS Science (primarily Geology)
7 1 18
WIP-1 ISU HS Math 4 1 8
WIP-1 Lee/Ogle Counties ROE 47
6th - 9th grade Math and Science
5 27
WIP-1 Monroe-Randolph ROE 45
MS / HS Science specifically Biotechnology
2 1 1 28
WIP-1 Rock Island County ROE 49
4th - 9th grade Math and Science
2 20
WIP-1 St. Clair ROE 50 HS Math and Science 2 3 37
WIP-2 Aurora University Elementary Math / Science 6 4 3 12
WIP-2 BHS ROE #28 7th - 12th grade Math / Science
9 1 17 22
WIP-2 ISU MS Engaged STEM 3 1 15
WIP-2 ISU Threatened Species, Threatened Environments
13
WIP-2 Rock Island ROE 49
NIMS 4th - 9th Physical/ Earth Science
1 23
WIP-2 Monroe-Randolph ROE 45
Elementary / MS Intel Math
5 7 25
WIP-2 NIU MS / HS STEM 8 12
WIP-2 Lee/Ogle Counties ROE 47
5th - 9th NIMS - Rockford 3 2 11
WIP-2 SIU MS / HS Science Partnership for Improved Achievement in Science Through Computational Science
4 2 21
WIP-2 St. Clair ROE 50 Elementary / MS Sprouting STEMS
2 40

[Evaluation Report: 2009-2010] Page 17
Generally, the majority of survey respondents across partner types (industry, school, higher education,
and teacher) were positive about their experiences in terms of the vision, leadership, and technical
support (see Table 5). Teachers were generally consistent across all categories with most indicated high
levels of satisfaction and confidence across the vision, leadership, communication, and technical
support.
Table 5. Aggregated Survey Results (Agee or Strongly Agree/Satisfied or Highly Satisfied)
Vision Leadership Communication Technical Support
Industry WIP-2 Total N/A* N/A* N/A* N/A*
WIP-1 Total 100.0 95.0 91.1 100.0
MS Total 90.2 88.6 78.6 90.5
IHE WIP-2 Total 91.7 90.3 86.9 87.2
WIP-1 Total 94.2 98.9 85.5 99.0
MS Total 88.0 92.4 78.8 91.0
School WIP-2 Total 100.0 100.0 90.8 100.0
WIP-1 Total 87.6 90.0 77.8 77.8
MS Total 83.3 85.3 74.2 81.6
Teacher WIP-2 Total 85.4 87.1 81.1 86.0
WIP-1 Total 85.4 89.0 76.8 87.8
MS Total 76.1 81.8 68.5 79.4
*Low sample size
**Not surveyed

[Evaluation Report: 2009-2010] Page 18
Vision was operationalized in terms of clarity of IMSP goals, planning process used to prepare objectives,
follow-through on activities, efforts to promote collaboration, planned collaborative action between
STEM professionals and teachers, processes used to assess needs, participation of representatives with
a variety of interests, diversity of partners, respect for partner contributions, and shared resources.
Partners and participants for all grant types (MS Degree and WIP programs) rated the vision highly (see
Figure 2). MS Degree teachers rated the vision elements somewhat lower overall than the school, IHE,
and industry partners in their projects.
Figure 2. Partner Satisfaction with Vision
0.0 10.0 20.0 30.0 40.0 50.0 60.0 70.0 80.0 90.0 100.0
WIP-1
MS
WIP-2
WIP-1
MS
WIP-2
WIP-1
MS
WIP-2
WIP-1
MS
Ind
ust
ryIH
ESc
ho
ol
Teac
her
100.0
90.2
91.7
94.2
88.0
100.0
87.6
83.3
85.4
85.4
76.1
% Satisfied or Very Satisfied
Satisfaction with Local IMSP Vision

[Evaluation Report: 2009-2010] Page 19
Leadership was defined in terms of the competence of the IMSP leader, sensitivity to cultural issues,
opportunities for taking a leadership role, trust that partners afforded each other, and transparency of
decision-making. Again, a majority of partners and participants for both MS Degree and WIP programs
rated the project leadership highly (see Figure 3). MS Degree teachers rated leadership elements
somewhat lower overall than the IHE and industry partners in their projects.
Figure 3. Partner Satisfaction with Leadership
0.0 10.0 20.0 30.0 40.0 50.0 60.0 70.0 80.0 90.0 100.0
WIP-1
MS
WIP-2
WIP-1
MS
WIP-2
WIP-1
MS
WIP-2
WIP-1
MS
Ind
ust
ryIH
ESc
ho
ol
Teac
her
95.0
88.6
90.3
98.9
92.4
100.0
90.0
85.3
87.1
89.0
81.8
% Satisfied or Very Satisfied
Satisfaction with Local IMSP Leadership

[Evaluation Report: 2009-2010] Page 20
Communication was rated in terms of media use to promote IMSP, communication among partnership
members, communication between IMSP and broader community, extent to with partners are listened
to and heard, working relationships with school officials, and information on issues and available
resources. A majority of partners for both MS Degree and WIP programs rated the project
communication highly although leadership and vision ratings. Again, MS Degree teachers rated
communication elements somewhat lower overall than the school, IHE, and industry partners in their
projects. WIP-1 teacher and school respondents were similar (around 77% average satisfied or very
satisfied) and somewhat fewer were satisfied as compared with WIP IHE and Industry partners (see
Figure 4). WIP-2 responding teachers rated communication elements somewhat lower overall than the
school, IHE, and industry partners in their projects.
Figure 4. Partner Satisfaction with Communication
0.0 10.0 20.0 30.0 40.0 50.0 60.0 70.0 80.0 90.0 100.0
WIP-1
MS
WIP-2
WIP-1
MS
WIP-2
WIP-1
MS
WIP-2
WIP-1
MS
Ind
ust
ryIH
ESc
ho
ol
Teac
her
91.1
78.6
86.9
85.5
78.8
90.8
77.8
74.2
81.1
76.8
68.5
% Satisfied or Very Satisfied
Satisfaction with Local IMSP Communication
[Evaluation Report: 2009-2010] Page 21
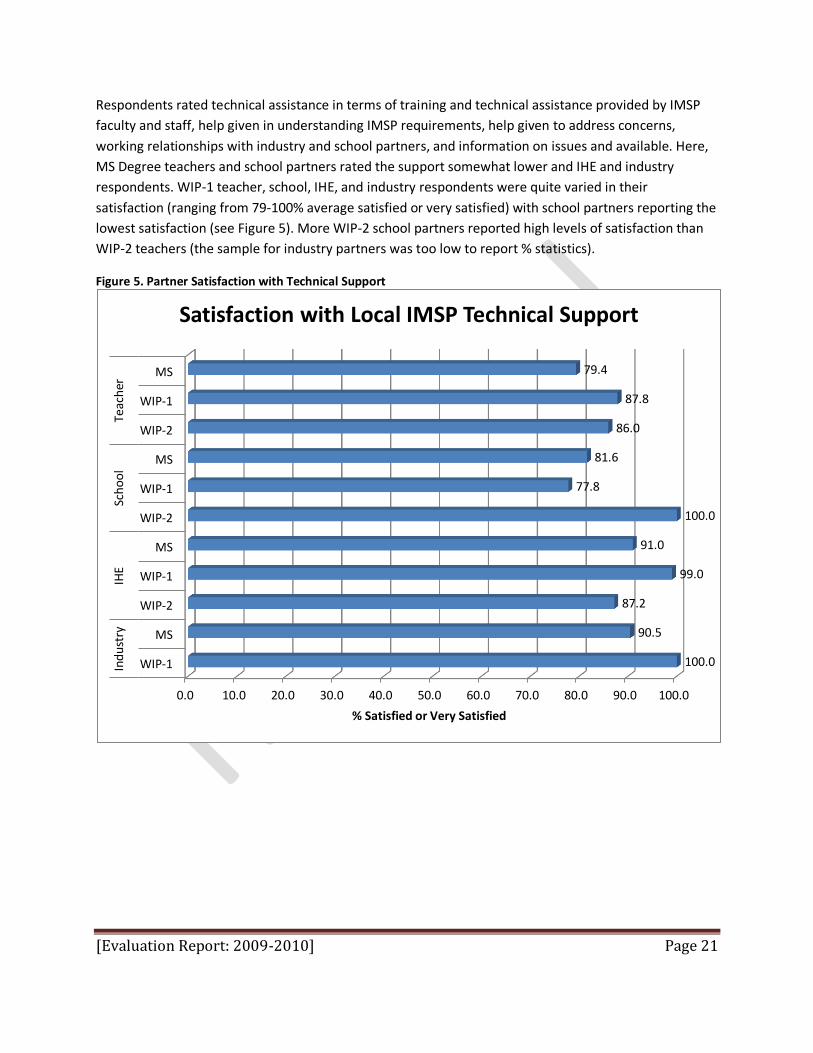
Respondents rated technical assistance in terms of training and technical assistance provided by IMSP
faculty and staff, help given in understanding IMSP requirements, help given to address concerns,
working relationships with industry and school partners, and information on issues and available. Here,
MS Degree teachers and school partners rated the support somewhat lower and IHE and industry
respondents. WIP-1 teacher, school, IHE, and industry respondents were quite varied in their
satisfaction (ranging from 79-100% average satisfied or very satisfied) with school partners reporting the
lowest satisfaction (see Figure 5). More WIP-2 school partners reported high levels of satisfaction than
WIP-2 teachers (the sample for industry partners was too low to report % statistics).
Figure 5. Partner Satisfaction with Technical Support
0.0 10.0 20.0 30.0 40.0 50.0 60.0 70.0 80.0 90.0 100.0
WIP-1
MS
WIP-2
WIP-1
MS
WIP-2
WIP-1
MS
WIP-2
WIP-1
MS
Ind
ust
ryIH
ESc
ho
ol
Teac
her
100.0
90.5
87.2
99.0
91.0
100.0
77.8
81.6
86.0
87.8
79.4
% Satisfied or Very Satisfied
Satisfaction with Local IMSP Technical Support

[Evaluation Report: 2009-2010] Page 22
Adequacy of Resources
Resources were generally considered adequate by partnerships; although some projects indicated they
needed more funds for evaluation.
“Resources have been sufficient to reach implementation goals. There is a discussion regarding
increasing resources for teacher use in the classroom due to the nature of elementary
instruction. Having multiple programs has involved many faculty members to an extent that
they are becoming familiar with the structure of the coursework and that is expanding the
human resources available” (Site Evaluator Conclusion, Graduate IMSP Program).
“The interview team described sufficient resources to implement coursework and to offer
teachers the opportunity to attend conferences. However, the team stated that they did not have
sufficient funds to develop valid and sensitive evaluation tools to measure student outcomes”
(Site Evaluator Conclusion, Graduate IMSP Program).
[Evaluation Report: 2009-2010] Page 23
Performance and Outcomes
What areas did the IMSP address most successfully? In what areas was the IMSP
not successful in addressing?
Meta-Analysis Results
There were four phases of the meta-analyses conducted for 2008-2009 projects.
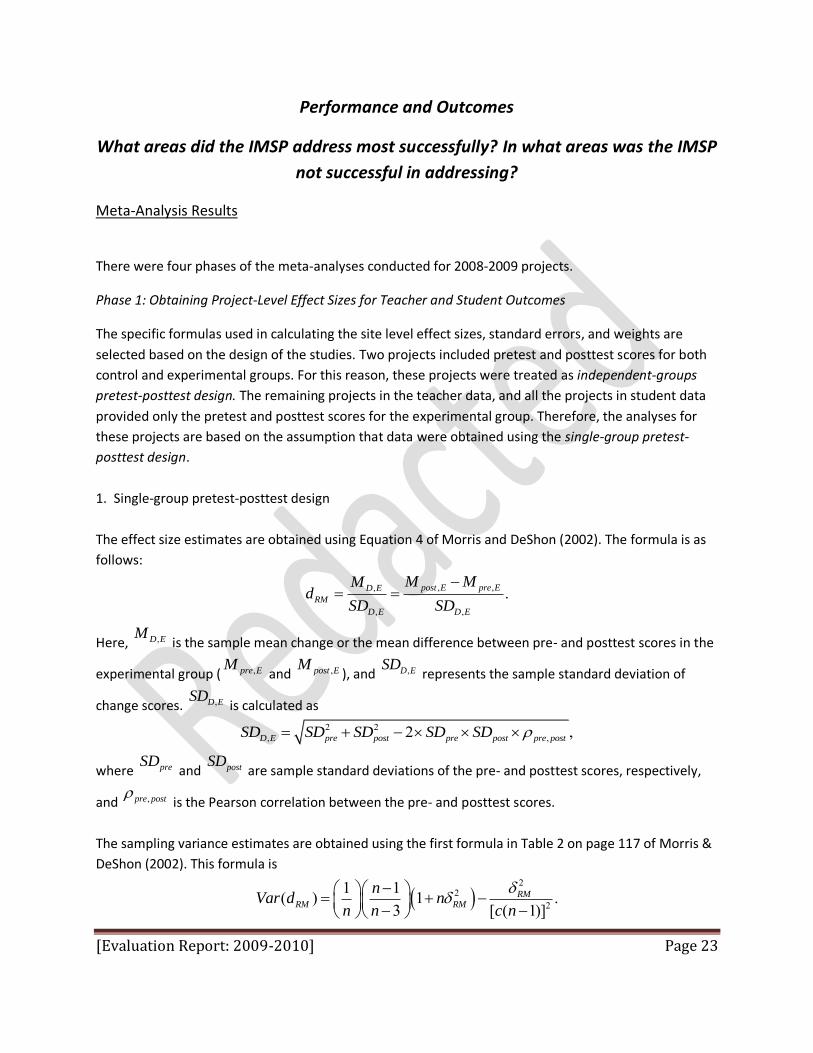
Phase 1: Obtaining Project-Level Effect Sizes for Teacher and Student Outcomes
The specific formulas used in calculating the site level effect sizes, standard errors, and weights are
selected based on the design of the studies. Two projects included pretest and posttest scores for both
control and experimental groups. For this reason, these projects were treated as independent-groups
pretest-posttest design. The remaining projects in the teacher data, and all the projects in student data
provided only the pretest and posttest scores for the experimental group. Therefore, the analyses for
these projects are based on the assumption that data were obtained using the single-group pretest-
posttest design.
1. Single-group pretest-posttest design
The effect size estimates are obtained using Equation 4 of Morris and DeShon (2002). The formula is as
follows:
, ,,
, ,
.post E pre ED E
RM
D E D E
M MMd
SD SD
Here, ,D EM is the sample mean change or the mean difference between pre- and posttest scores in the
experimental group ( ,pre EM and ,post EM
), and ,D ESD represents the sample standard deviation of
change scores. ,D ESD is calculated as
2 2, ,2 ,D E pre post pre post pre postSD SD SD SD SD
where preSD and postSD
are sample standard deviations of the pre- and posttest scores, respectively,
and ,pre post is the Pearson correlation between the pre- and posttest scores.
The sampling variance estimates are obtained using the first formula in Table 2 on page 117 of Morris &
DeShon (2002). This formula is
2
22
1 1( ) 1 .3 [ ( 1)]
RMRM RM
nVar d n
n n c n

[Evaluation Report: 2009-2010] Page 24
Here, n represents the number of paired observations in a single-group pretest-posttest design, RM is
the population effect size in the change-score metrics, and c(df) is the bias function defined as
3( ) 14 1
c dfdf
.
2. Independent-groups pretest-posttest design
For the quasi-experimental project teacher data, the effect size estimates are obtained using Equation 6
of Morris and DeShon (2002). This formula is
, ,
, ,
.D E D C
RM
D E D C
M Md
SD SD
Here, ,D EM is the sample mean change or the mean difference between pre- and posttest scores in the
experimental group ( ,pre EM and ,post EM
), and ,D ESD represents the sample standard deviation of
change scores, which has the same meaning and was calculated in the same way as the ,D ESD in the
single group design; CDM , is the sample mean change or the mean difference between pre- and
posttest scores in the control group, and CDSD , represents the sample standard deviation of change
scores. CDSD , is calculated in the same way as ,D ESD except that the standard deviation and
correlation information obtained from the control group are used.
The sampling variance estimates are obtained using the last formula in Table 2 of Morris and DeShon
(2002):
22
21 2( ) 1 2(1 ) .
2(1 ) 4 ( 2)RM
RM RM
NVar d n
n N c N
In this formula, RM is the population effect size in the change-score metrics, ( )c df is the bias function
defined as
3( ) 14 1
c dfdf
, is the Pearson correlation between pretest and posttest,
)/()*(~CECE nnnnn
, and N is the combined number of observations from both groups (i.e.,
E Cn n). The standard errors of the site level effect size estimates and the weights are calculated based
on these estimates.
3. Missing Data
Due to missing data, the numbers of pre- and posttest observations are not the same. To obtain an

[Evaluation Report: 2009-2010] Page 25
estimate of the number of paired observations, n, in the single-group pretest-posttest design needed in
computing the necessary statistics, the harmonic mean of the pretest and posttest sample sizes (i.e.,
pren and postn
) is obtained. The harmonic mean is used because it is more conservative compared to the
arithmetic mean and the geometric mean, but not as conservative as the using the minimum between
pren and postn
.
4. Imputed Data
Several entries in the Pearson correlation column are missing or considered missing. That is, values
equal or close to zero and negative are treated as missing because of the expectation that pretest and
posttest scores have a positive correlation. To impute the missing values of the correlation coefficients,
the pretest reliability and posttest reliability were used as predictors. Specifically, the natural logarithm
of the correlation was used as the dependent variable, and the natural logarithm of the pretest
reliability and posttest reliability were used as the two independent variables for the multiple regression
models. The following models are used for the teacher and student data, respectively.
)ln(12.0)ln(14.051.0)ˆln( postpre RR , and
)ln(2.0)ln(4.041.0)ˆln( postpre RR
Phase 2: Obtaining Overall Effect Sizes for Content Knowledge
Because some projects utilized more than one measure for teacher knowledge outcomes, observations
were combined within a single project (see list of measures by project in Appendix D). The combined
effect size is the weighted average across the effect sizes within each project (NOTE: projects with the
same “ProjectID” but different “Content” are split into two different projects and these projects are
combined as a weighted average across the multiple effect sizes). That is,
1
1
.n
i ii
n
ii
d wd
w
A total of 51 combined project effect sizes were created for the teacher data. In addition to the
weighted effect sizes, the within project variances were also computed for each project using the
following formula:
22
21
( )1 ,1/
n
i iiwithin n n
i ii i
w d d
w

[Evaluation Report: 2009-2010] Page 26
where n is the number of observations within one project, 2i is the sampling variance, iw
is the
weight, id is the effect size of the
thi observation, d is the weighted effect size across the
observations within one project. The multi-level analyses are based on the combined teacher data. The
two covariates of interest for the teacher data, “content” (1-mathematics, 2-science or technology) and
“type” (1-MS, 2-WIP. 3-other), are dummy coded.
Using the same method, observations in the “student (adjusted)” sheet were also combined by
“ProjectID” (n=34).
1. Dependency Relationship between Variables
The association between the effect size, content and type was investigated. For the teacher data, the
results showed that the “type of grant” variable (MS vs. WIP) had no association with the effect size.
Although the “content” variable had a relatively larger association with the effect size (the mean effect
size for “science” and “engineer” was higher than the mean effect size for “math”), the impact of
content area was still not significant (p=0.3565). The model used here is
weightedd Type
weightedd Content
These two models were also applied to the student data. The analyses show that there was also no
significant association between the effect size and the content area (p=0.43), and between the effect
size and the grant type (p=0.38).
2. Control-Experimental group study
An ANOVA analysis was conducted for the projects that included a control and experimental group
pretest and posttest design. The dependent variable was the effect sizes of the observations in these
two grant projects and the independent variable was the “group” (0-experimental, 1-control). The
following table indicates that type of group has a significant (p=0.0016) impacts on the effect size (see
Table 6 and Table 7).
Table 6. ANOVA analysis for control-experimental group
Source DF Sum of Squares Mean Square F Value Pr > F
Model 1 2.71 2.70 13.69 0.0016
Error 18 3.56 0.19
Corrected Total 19 6.27

[Evaluation Report: 2009-2010] Page 27
Table 7. Mean and SD of the effect sizes of the Experimental and Control group
Group Sample Size Mean Std Dev Minimum Maximum
Experimental 10 0.92 0.39 0.28 1.63
Control 10 0.18 0.49 -0.81 0.99
3. Multi-level Meta-analysis Model
To test for the predictors of effect size magnitude, a multi-level meta-analysis model was used. Multi-
level models are appropriate because the current set of studies is considered a random sample from a
larger population of studies. That is, each study-specific effect is sampled from the larger population of
effects. Therefore, the effects have two sources of variability: one was due to the variability of the effect
parameters, and the other was due to the sampling variability of the observations.
The first multi-level model used was:
Y e
where Y is the weighted effect size, is the average population effect, is the random effect, which
was assumed to have a normal distribution with a mean of zero and a common variance parameter .
For this model, measures the between-study variation (in this analysis, it actually measures the
between-project variation), whereas e measures the within-study variation, which is the project-
specific chance error.
This model was used to conduct the multi-level analysis for the teacher data and student data,
respectively. For both data sets, we aimed to assess the average IMSP effect and to gauge the amount of
variability among these projects. In other words, we wanted to estimate the parameters and .
To investigate whether the effect size can be explained by some covariate variables other than the
population mean, the second multi-level model, Model 2, is defined as
1 1Y X e
where is the average population effect conditional on the covariates. 1X represents the covariate of
interest, 1 is the coefficient associated with the covariates. The remaining components of the model
(i.e., Y , , and e ) have the same interpretation as above. Using this model, the relationship between
the effect size and other possible explanatory variables were also investigated. There were no significant
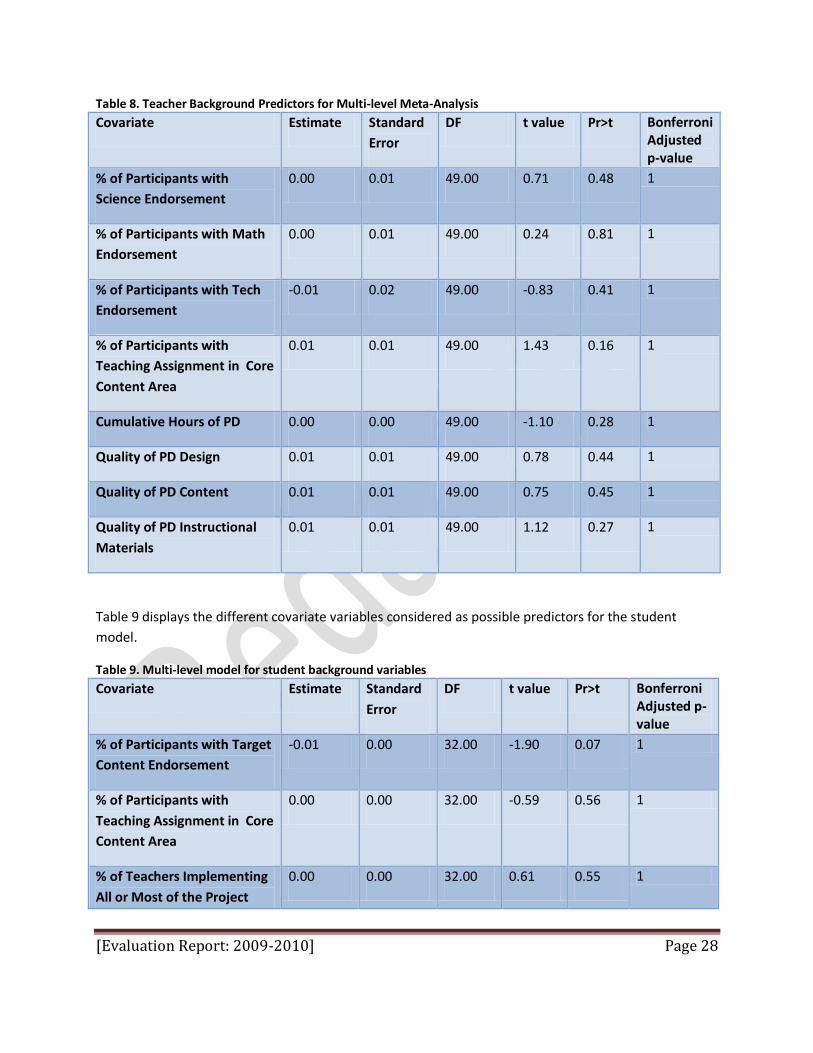
teacher background variables predicting the effect sizes (see Table 8) for teacher content knowledge.
[Evaluation Report: 2009-2010] Page 28
Table 8. Teacher Background Predictors for Multi-level Meta-Analysis
Covariate Estimate Standard
Error
DF t value Pr>t Bonferroni Adjusted p-value
% of Participants with
Science Endorsement
0.00 0.01 49.00 0.71 0.48 1
% of Participants with Math
Endorsement
0.00 0.01 49.00 0.24 0.81 1
% of Participants with Tech
Endorsement
-0.01 0.02 49.00 -0.83 0.41 1
% of Participants with
Teaching Assignment in Core
Content Area
0.01 0.01 49.00 1.43 0.16 1
Cumulative Hours of PD 0.00 0.00 49.00 -1.10 0.28 1
Quality of PD Design 0.01 0.01 49.00 0.78 0.44 1
Quality of PD Content 0.01 0.01 49.00 0.75 0.45 1
Quality of PD Instructional
Materials
0.01 0.01 49.00 1.12 0.27 1
Table 9 displays the different covariate variables considered as possible predictors for the student
model.
Table 9. Multi-level model for student background variables
Covariate Estimate Standard
Error
DF t value Pr>t Bonferroni Adjusted p-value
% of Participants with Target
Content Endorsement
-0.01 0.00 32.00 -1.90 0.07 1
% of Participants with
Teaching Assignment in Core
Content Area
0.00 0.00 32.00 -0.59 0.56 1
% of Teachers Implementing
All or Most of the Project
0.00 0.00 32.00 0.61 0.55 1

[Evaluation Report: 2009-2010] Page 29
Covariate Estimate Standard
Error
DF t value Pr>t Bonferroni Adjusted p-value
Content
% of Teachers Implementing
All or Most of the
Instructional Resources
0.00 0.00 32.00 -0.01 0.99 1
% of Teachers Implementing
All or Most of the Strategies
0.00 0.00 32.00 0.83 0.42 1
% of Teachers Implementing
All or Most of the STEM
Resources
0.00 0.00 32.00 0.91 0.37 1
Average of the % White
Students in Participating
Schools
0.00 0.00 31.00 0.32 0.75 1
Average of the % Black
Students in Participating
Schools
0.00 0.01 31.00 0.02 0.98 1
Average of the % Hispanic
Students in Participating
Schools
0.00 0.01 31.00 -0.88 0.38 1
Average of the % Asian
Students in Participating
Schools
-0.11 0.07 31.00 -1.70 0.10 1
Average of the % Native
American Students in
Participating Schools
1.23 0.99 31.00 1.24 0.22 1
Average of the % Multi-
Racial Students in
Participating Schools
0.11 0.04 32.00 3.05 0.01* .51
Average of the % High
Mobility Students in
0.00 0.00 31.00 -0.21 0.83 1

[Evaluation Report: 2009-2010] Page 30
Covariate Estimate Standard
Error
DF t value Pr>t Bonferroni Adjusted p-value
Participating Schools
Average of the % High
Poverty Students in
Participating Schools
0.00 0.01 31.00 -0.26 0.80 1
% of teacher participants currently teaching in a traditional classroom setting (not looping, multi-age, block, or academic disciplines)
0.00 0.00 32.00 0.02 0.99 1
% of teacher participants currently teaching in a school with a special program emphasis (like charter, magnet, special focus)
0.00 0.00 32.00 -0.02 0.99 1
Cumulative Teacher PD
Hours
0.00 0.00 32.00 0.47 0.64 1
*Excluded from the final student model based on AIC and BIC fit statistics.
Phase 3: Test of Multi-Level Meta-Analyses
The SAS Proc Mixed procedure was used for the multi-level meta-analysis.
None of the teacher or student background and context variables are included in the final models.
Although the “Average of the % Multi-Racial Students in Participating Schools” variable is a significant
predictor of the effect size of the student data, the model fit statistic-AIC and BIC value-indicates that
the default student model (Model 1 - without this race variable) (AIC=59.9, BIC=61.5) has a better
model fit than the model that includes it (AIC=74, BIC=75.6). Therefore, the following results are based
on Model 1 (the unconditional model) for both the teacher and student data (see Table 10).

[Evaluation Report: 2009-2010] Page 31
Table 10. Model 1 - Teacher and Student
Model Estimated Average
Effect Size
Standard Error p-value
Teacher Data Overall (n=51) 1.17 0.15 0.0001
MS Degree (n=25) 1.04 0.26 0.0006
WIP (n=16) 1.09 0.22 0.0001
Other (n=10) 1.64 0.29 0.0003
Math (n=21) 1.05 0.30 0.0025
Science (n=30) 1.24 0.16 0.0001
Student Data Overall (n=34) 0.62 0.10 0.0001
MS Degree (n=23) 0.48 0.14 0.0025
WIP (n=11) 0.76 0.16 0.0009
Math (n=19) 0.50 0.13 0.0016
Science (n=15) 0.68 0.19 0.0029
For the teacher data, the results based on Model 1 show that the estimated average overall IMSP effect
( ̂ ) across 51 projects is 1.17, with standard error 0.15. It is significantly different from zero (p=0.0001).
The between-study variance was 0.91 (not shown in the table) and it was twice the average within-study
variance (0.46, also not shown in the table). This supports the existence of a between-study variation.
Therefore, the mixed-effect model is preferable to the fixed-effect model (the model used for
investigating association between the effect size, content and type) for the current study. The MS
degree program projects and workshop projects have positive effect sizes, and are very close to each
other. The effect size of Science is larger than that of Mathematics in magnitude, but their difference is
not statistically significant (Note: The 95% confidence interval of Science effect size is (0.93, 1.55) and
that of Mathematics is (0.46, 1.63).
For the student data, the results based on Model 1 show that the estimated average overall IMSP effect
across 34 projects is 0.62, with standard error 0.10. It is significantly different from zero (p=0.0001). The
between-study variance was 0.23 (not shown) and it was also twice the average within-study variance
(0.11, also not shown). Again, this supports the existence of a between-study variation. The workshop
[Evaluation Report: 2009-2010] Page 32
projects have a larger effect size than the MS degree projects. The student data also show that the
effect size of Science is larger than that of Mathematics. However, the gaps between different project
type and between different subjects are not statistically significant.
Phase 4: Interpreting the Effect Sizes
In this evaluation report, the multi-level meta-analysis was conducted to measure the average effect
size and the total variation across projects. Meta-analysis has often been restricted to estimating (fixed)
covariates effects based on fixed-effects linear models. However, in this analysis, non-negligible
between-study (or between-project) variation was observed. Therefore, a random-effect component
was incorporated into the model to conceptualize the current set of projects under consideration as a
random sample selected from a population of projects. That is, each project-specific effect is sampled
from a larger population of effects. Therefore, for each project, there are two sources of variability in
the random-effect framework: one is the variability of the effect parameters, and the other is the
sampling variability associated with each project.
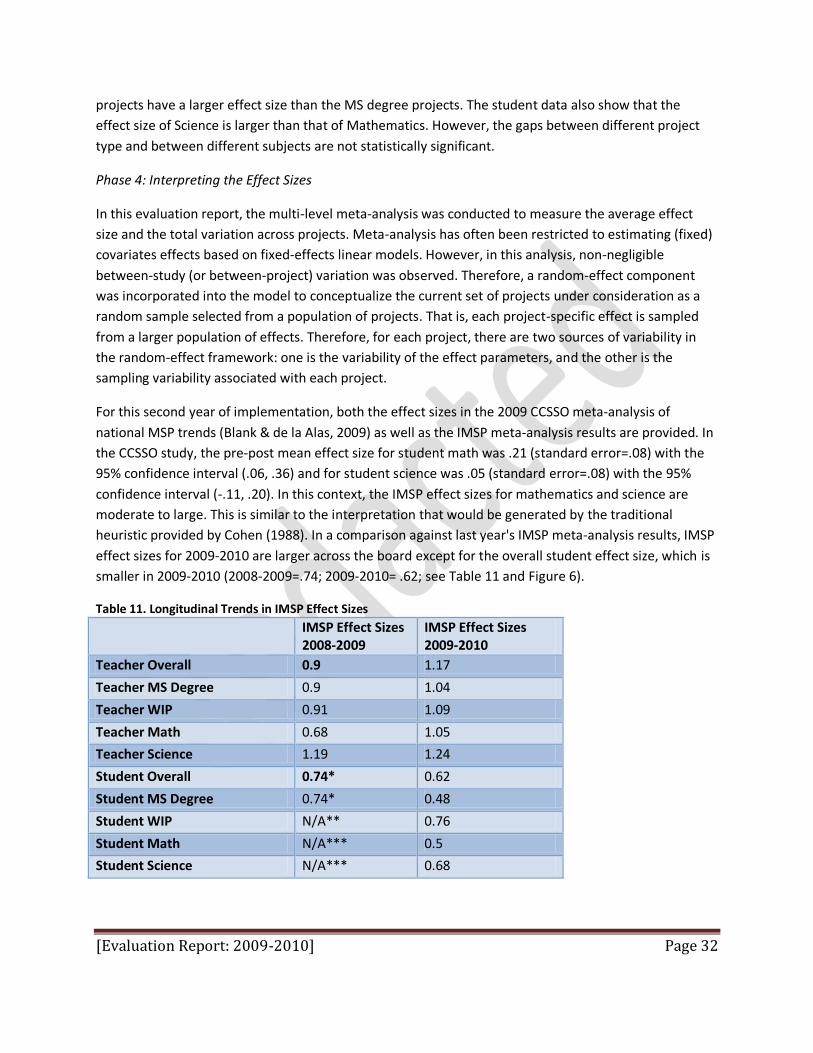
For this second year of implementation, both the effect sizes in the 2009 CCSSO meta-analysis of
national MSP trends (Blank & de la Alas, 2009) as well as the IMSP meta-analysis results are provided. In
the CCSSO study, the pre-post mean effect size for student math was .21 (standard error=.08) with the
95% confidence interval (.06, .36) and for student science was .05 (standard error=.08) with the 95%
confidence interval (-.11, .20). In this context, the IMSP effect sizes for mathematics and science are
moderate to large. This is similar to the interpretation that would be generated by the traditional
heuristic provided by Cohen (1988). In a comparison against last year's IMSP meta-analysis results, IMSP
effect sizes for 2009-2010 are larger across the board except for the overall student effect size, which is
smaller in 2009-2010 (2008-2009=.74; 2009-2010= .62; see Table 11 and Figure 6).
Table 11. Longitudinal Trends in IMSP Effect Sizes
IMSP Effect Sizes 2008-2009
IMSP Effect Sizes 2009-2010
Teacher Overall 0.9 1.17
Teacher MS Degree 0.9 1.04
Teacher WIP 0.91 1.09
Teacher Math 0.68 1.05
Teacher Science 1.19 1.24
Student Overall 0.74* 0.62
Student MS Degree 0.74* 0.48
Student WIP N/A** 0.76
Student Math N/A*** 0.5
Student Science N/A*** 0.68

[Evaluation Report: 2009-2010] Page 33
IMSP Effect Sizes 2008-2009
IMSP Effect Sizes 2009-2010
*All student data was MS Degree Data **No classroom implementation for this year ***Sample Size did not allow for disaggregation
Figure 6. IMSP Effect Sizes
Missing data issues were improved in 2009-2010, although two projects did not produce student data
and one project did not produce teacher data. Gains indicated by the two projects with control group
data are encouraging, but because they represent only 5% of the IMSP data so their generalizability is
limited. Without more analyses involving control groups it is not clear how the IMSP gains compare to
progress made under different models of professional development and learning conditions.
Site Interview and Survey Data Results
Detailed profiles of grants in the implementation stages were developed based on interviews and review
of extant data conducted by the state evaluation team. Based on these profiles, projects were described
in terms of the degree to which they were in the beginning, emerging, developing, or transformative
stages.
[Evaluation Report: 2009-2010] Page 34
In site interviews, Performance & Outcomes were judged for evidence of major outcomes or benefits
for institutions, schools, or community in capacity, knowledge, or knowledge dissemination and the
extent to which the IMSP has pursued major strategies originally planned, there has been positive
performance of the collaboration between partners, or the capacity of the IMSP has increased.
Evaluation Implementation indicates the degree to which evaluation activities provided data needed to
fulfill state and federal reporting requirements.
Beginning stages are represented by articulated plans but no actions. The element is “on the radar” but
there is no substantive progress toward effective implementation. The quality of the plans is
inconsistent. Outcomes are not possible because no plans have been put into action. Plans may not
provide adequate foundation for full implementation. Emerging stages are represented by clear and
articulated plans with some initial actions setting the stage for implementation, but not enough
substantive activity to establish implementation. The quality of the articulated plan may be very strong
or may have some apparent weaknesses amidst other strengths. Outcomes are not imminent or
predictable because high quality implementation has not reached a minimum threshold. Developing
stages show clear, strong implementation is in place, although corrections for barriers, changes to plans,
or consistency/satisfaction across stakeholders might be mixed. Positive outcomes are evident but all
goals are not fully realized or not on track. Transformative stages show such a clear, strong enacted plan
that it is a model for others to use. Positive outcomes associated with the partnership seem inevitable or
highly predictable.
Partners were also surveyed for feedback on their experiences in the IMSP for 2009-2010. The surveys
asked for satisfaction ratings in terms of progress toward objectives and sustainability.
Overview of Results
In the second year of implementation, the strongest area of development was in the sustainability of
programs where about 1/3 of the grants were at the transformative stage (see Figure 7). NOTE: 6 of the
10 programs at this stage are affiliated with Aurora University.

[Evaluation Report: 2009-2010] Page 35
Figure 7. Partnership Progress Chart 2 from Site Interviews
There are a number of projects that are still in lower stages of development across all the areas
discussed with the site interviewer. It appears that at the end of the second year of implementation,
WIP grants are more consistently at the higher levels of development with 100% at the developing or
transformative stages and 55% of the MS grants at these higher stages of development (see Table 12
and Figure 8).
Table 12. Mode Level of Development Across Categories
Transformative Developing Emerging Beginning
WIP 3 6
MS 7 4 9

[Evaluation Report: 2009-2010] Page 36
Figure 8. Mode Stage of Development by Model Type from Site Interviews
The majority of partners and participants were positive in their opinions in surveys about their local
IMSP’s progress toward objectives. Noticeably fewer industry, IHE, and school partners highly rated their
ability to sustain policies, processes, or activities related to the IMSP (see Table 13). Teachers were
generally consistent with most indicating high levels of satisfaction and confidence across the progress
toward objectives and sustainability.
Table 13. Aggregated Survey Results (Agee or Strongly Agree/Satisfied or Highly Satisfied)
Progress Toward Objectives
Sustainability
Industry WIP-2 Total N/A** N/A**
WIP-1 Total 88.9 91.0
MS Total 76.2 69.5
IHE WIP-2 Total N/A** N/A**
WIP-1 Total 90.8 76.5
MS Total 85.1 71.9
School WIP-2 Total N/A** N/A**
WIP-1 Total 77.2 67.7
MS Total 80.1 69.2
Teacher WIP-2 Total 84.2 86.8
WIP-1 Total 86.0 86.8
MS Total 74.4 77.7
*Low sample size
**Not surveyed

[Evaluation Report: 2009-2010] Page 37
Results: Progress toward Objectives
1. Surveys
Progress toward objectives encompasses improvement in teachers' content knowledge, access and use
of new instructional resources and STEM technologies , progress toward meeting endorsement or
certification requirements, effective collaboration between STEM industry experts and teachers, access
to mentors, fairness with which resources and opportunities are distributed, capacity of the local IMSP
teachers to give support to each other, and improvement in science and/or mathematics instruction in
partner schools. For progress elements, more MS Degree IHE respondents rated strong progress
compared with teacher, school, and industry respondents (about 85%). WIP-1 teacher, IHE, and industry
respondents were similar (around 86-91% average satisfied or very satisfied) and somewhat more were
satisfied as compared with WIP-1 school (77%) respondents (see Figure 9). WIP-2 school, IHE, and
industry partners were not surveyed on progress toward objectives or sustainability because classroom
implementation did not begin this year.
Figure 9. Partner Satisfaction with Progress Toward Objectives
0.0 10.0 20.0 30.0 40.0 50.0 60.0 70.0 80.0 90.0 100.0
WIP-1
MS
WIP-1
MS
WIP-1
MS
WIP-2
WIP-1
MS
Ind
ust
ryIH
ESc
ho
ol
Teac
her
88.9
76.2
90.8
85.1
77.2
80.1
84.2
86.0
74.4
% Satisfied or Very Satisfied
Satisfaction with Local IMSP Progress Toward Objectives

[Evaluation Report: 2009-2010] Page 38
2. Site Profiles
The most commonly described success for building capacity for the partnerships was the successful
implementation of coursework or project programming. Some partnerships noted success with teacher
pedagogy and opportunities for collaboration.
“This IMSP was successful in involving all participants in such a way that they were able to
support the program and each other in problem solving and addressing issues in an effective
manner. The University has been successful in using a collaborative model to develop and
implement a new Master’s degree program. The Colleges and their faculty have been successful
in modifying instructional methodology to better meet the needs of students, and not just those
in this program” (Site Evaluator Conclusion, Graduate IMSP Program).
“One of the co-PIs stated, ‘We have seen an increase in teacher math content knowledge. We
have seen gains that have persisted. There have been shifts in instruction, particularly in science
topics. [Early in the project], we saw lessons where teachers just read the text book. Now that
has changed. We have seen some shifts in student behaviors through our observations’” (Site
Interview, Graduate IMSP Program).
A few partnerships reported institutional changes in the school partner, mostly in terms of transitions in
staff due to poor economic conditions or restructuring unrelated to the grant. A few partners noted
positive changes that they attributed to the grant.
“The interview team mentioned a number of changes in [school district] that might affect the
project - decentralization, changes to the data policy, school decisions about which mathematics
curriculum to use, and changes in district staffing” (Site Interview, Graduate IMSP Program).
“The PI stated that the social capital of the participating schools has increased. “Some
participating schools are getting a lot of attention and will get more as they become involved
with the [Industry Partner]” (Site Interview, Graduate IMSP Program).
Finally, some partners noted changes in teacher knowledge and attitudes for their project. Fewer
programs reported evidence of student change.
“Evaluator stated: We’ve seen a positive impact on teacher’s knowledge of mathematics through
the statistical analysis. Co-PI stated: They have showed significant improvement” (Site Interview,
Graduate IMSP Program).
“Evaluator stated: And we’ve had a positive impact on their development in professional growth.
We have noticed a positive impact on student performance in mathematics and two categories
of mathematical dispositions that we promote in our program, so we were happy to see that”
(Site Interview, Graduate IMSP Program).
Improvement in attitudes is also noted at the university partner levels by some grants.

[Evaluation Report: 2009-2010] Page 39
“LEA Administrators are reporting changes in teacher attitudes toward instructional practices
and professional development. The university has seen increased communication and
understanding between colleges. There is some evidence of changes in classroom students’
behavior reported. Teachers are being challenged to change their attitudes regarding content
knowledge and their own learning” (Site Interview, Graduate IMSP Program).
“Changes in attitude and behavior related to classroom instruction and technology was reported
at the teacher level. At the university a change in attitude concerning teacher instruction was
noted by participants” (Site Interview, WIP-1 IMSP Program).
Results: Sustainability
1. Surveys
Finally, sustainability was rated in terms of the extent to which the partners believed they had received
important professional benefits from participation in the IMSP, that benefits received were worth the
time, effort, and cost invested in the IMSP, and that benefits were commensurate with the contributions
made to the IMSP. Respondents also described their belief in whether the IMSP should be continued,
whether they will participate fully in this IMSP's activities in the future, whether the IMSP activities need
to be dramatically improved to make it worth their investment, and whether the composition of their
IMSP needs to be expanded or changed to be more effective. They rated if there were changes in
structure, policies, or functions to institutionalize the IMSP goals and activities and whether alternative
funds to sustain IMSP activities after the expiration of grant were being actively sought. Teachers as a
whole were more satisfied than other respondents that they could sustain the practices they have
started (78-87%) across grant types. For sustainability, MS Degree school, IHE, and industry partners
were similar in their ratings (about 70%). WIP-1 school (68%), IHE (77%), and industry partners (91%)
were quite varied in their rated sustainability WIP-2 school, IHE, and industry partners were not
surveyed on progress toward objectives or sustainability because classroom implementation did not
begin this year.

[Evaluation Report: 2009-2010] Page 40
Figure 10. Partner Satisfaction with Sustainability
2. Site Profiles
Partnerships generally reported that they received benefits commensurate with their contributions.
While more than half of the grant partnerships showed evidence in site interviews of important progress
toward establishing at least some components of sustainability, many still struggle with this area.
“[University] is working toward a 3 pronged approach that uses the workshop model to drive
enrollment for the Master’s degree program. The IMSP believes that the quality of their
program will insure sufficient cohort numbers through “word of mouth” at the LEAs. Scheduling
of courses is important for teachers and this program has addressed this obstacle” (Site
Interview, WIP-1 IMSP).
“The PI talked about specific courses that will likely be taught again, but did not indicate that the
overall degree program would continue. One aspect of institutionalization that the PI mentioned
was the desire that the current teacher participants would share their knowledge with other
teachers in their school to widen the impact of the project. No evidence of how this might
happen was presented” (Site Interview, Graduate IMSP).
0.0 10.0 20.0 30.0 40.0 50.0 60.0 70.0 80.0 90.0 100.0
WIP-1
MS
WIP-1
MS
WIP-1
MS
WIP-2
WIP-1
MS
Ind
ust
ryIH
ESc
ho
ol
Teac
her
91.0
69.5
76.5
71.9
67.7
69.2
86.8
86.8
77.7
% Satisfied or Very Satisfied
Satisfaction with Local IMSP Sustainability

[Evaluation Report: 2009-2010] Page 41
“The program is unsure whether the MSP will be sustained” (Site Interview, Graduate IMSP).
“The IMSP is not yet on a trajectory toward institutionalization. There is no clear model for how
to continue this program. The team will discuss potential additional cohorts with local
administrators in their summer conference” (Site Interview, Graduate IMSP).
In what areas was the IMSP not successful in addressing?
Communication of the IMSP
Misunderstandings of program at the local level were noted by some teacher participants in the
narrative sections of their surveys. Some participants did not know what the “IMSP” was while others
did not believe the requirements were in line with their perceptions of the commitments.
“Our group has had our light kept under the bushel! This is a great opportunity and program.
More should be in the district press and the public press!!!” (Teacher Survey, Graduate IMSP).
“A better outline of the program including requirements before we started” (Teacher Survey,
WIP-1 IMSP).
“I don't think there is a strong relationship that is communicated to my, a student, between my
University and IMSP. I have struggled to figure out the connections between these programs and
what the goals of IMSP through the government and the University are connected (mostly
because I am not educated on IMSP. It would be very helpful if someone from the governmental
side of this program would discuss what the purpose and main goals of IMSP are and how we
are connected to our University. Furthermore, I have seen no connections of IMSP programs at
the high school I work at. I would like to be an advocate for these programs but I don't know
what is available to share with my school” (Teacher Survey, Graduate IMSP).
Implementation of Evaluation
The state evaluation requirements continue to be an area of needed development. Some grantees who
have been in the program for three years are still submitting incomplete data or late data. While about
half of the grant partners are at the “developing” stage of their local evaluation implementation, 41%
are still at the developing or beginning stages. Site profile reports indicate that some grants struggled to
get data from the LEA partners while others reported the need for more resources from the state to
adequately fulfill the state evaluation requirements.
“The interview team was pleased with the implementation of the project to date. The only
concerns mentioned were potential difficulties with accessing data from [the school district]. The

[Evaluation Report: 2009-2010] Page 42
team is following the process to get those data. At the least, they have data in the area of
algebra ‘if the school is giving an endorsed algebra class and also teacher data for those who
teach an algebra initiative class’” (Site Interview, Graduate IMSP Program).
Participation by the School Partner
While some partnerships enjoyed a strong relationship with their school partners, others struggled with
relationships that were in transition or off-balance with the weight of the responsibilities falling on the
university or lead agency in the partnership. Some school partners are approaching their IMSP as a
professional development vendor rather than engaging in a full partnership.
“The quality of the partnership has suffered this year due to issues at the partner LEA. Also,
teachers are struggling in some areas of content knowledge and have requested additional
support outside of the coursework” (Site Interview, Graduate IMSP Program).
“I perceive some kind of disconnect between school officials and these grant opportunities. In our
district, the school officials that make decisions about how our professional time can be
apportioned, seem completely unaware of the professional development that is happening and
how they could support it” (Teacher Survey, WIP-1 IMSP).
Alignment of Programs with Participant Needs
In surveys, some teachers described barriers in learning that they connected with the wide differences
in abilities between teacher participants. Elementary and secondary teachers alike noted the mismatch
with their needs when they were blended with each other.
“Goals are clearly stated, but misguided. Students want this program to help them become
better science and math teachers at their current grade level, but program designers are not
considering practical application to elementary curriculum. The content is more appropriate for
high school teachers than elementary.” (Teacher Survey, Graduate IMSP).
“In order for this program to function properly, the level of student needs to be somewhat equal.
Actually, it really boils down to what level of school the student teaches at. As a high school
teacher my needs and level of previous education in my subject matter are much different than
the middle school or elementary school teacher. My experience would be enhanced with the
removal of the middle/elementary school people and replace them with high school teachers. In
addition, the professors will be able to teach more effectively towards our needs” (Teacher
Survey, Graduate IMSP).

[Evaluation Report: 2009-2010] Page 43
Conclusions and Discussion
Evaluation Framework
There are several key guidelines for effective STEM evaluations (Lawrenz & Huffman, 2006). The
incorporation of qualitative and quantitative methodologies, performed according the relevant rigorous
standards for each, provides a more complete understanding of outcomes. Mixing philosophies, designs,
and devices are all important ways that quantitative and qualitative approaches are combined in STEM
educational evaluation.
There are other considerations in addition to methodology that are key in an effective STEM evaluation.
In the evaluation of recruitment and retention in one Texas MSP program (Scott, Milam, Stuessy, Blount,
& Bentz, 2006), the fruits of close collaboration between colleges in a university and the learning
communities in which their students had field experiences were explored. The attention to the
community context, learner-diversity, knowledge needs, and the use of assessment to provide feedback
were key to increasing the recruitment and retention in STEM education programs.
The pivotal role of context, respect, communication, and cooperation recur in various accounts of
partnerships between organizations focused on STEM initiatives (Miller, Williamson McDiarmid, Luttrell-
Montes, 2006). Further, STEM evaluations must examine both the implementation and outcomes of
program work in order to describe the context of each program (Miller, Williamson McDiarmid, Luttrell-
Montes, 2006) and help to connect outcomes to project activities. Similarly, evaluation of professional
development, be it in STEM projects or other school-based evaluations must examine not only
perceptions of the professional development, but also its outcomes and impact on instruction (Guskey,
2000).
Quality of the Partnerships
One of the guiding principles of the IMSP is that the program funds partnerships, not individual
institutions, to accomplish project goals. Research has identified a number of factors that contribute to
successful collaborations, including an environment that provides a context for bringing together
partners with common needs; membership characterized by diversity and respect; a process/structure
that reflects flexibility, collaborative decision-making and clearly defined roles; group members with a
stake in outcomes; open and frequent communication; a vision that is shared and developed
collaboratively; and resources including in-kind contributions from all stakeholders in addition to outside
resources (Mattessich & Monsey, 1992).

[Evaluation Report: 2009-2010] Page 44
Clearly, mutual need, respect, trust, and enthusiasm are strengths consistently across these IMSP grants.
This foundation characterizes both the spirit of the federal program as well as the promise of positive
results from the resources ISBE has provided to promote collaboration between higher education
faculty, industry STEM professionals, and K-12 school stakeholders.
Progress toward Outcomes
For this second year of implementation, both the effect sizes in the 2009 CCSSO meta-analysis of
national MSP trends as well as the IMSP meta-analysis results are provided. In this context, the IMSP
effect sizes for mathematics and science are moderate to large. In a comparison against last year's IMSP
meta-analysis results, IMSP effect sizes for 2009-2010 are larger across the board except for the overall
student effect size, which is smaller in 2009-2010 (2008-2009=.74; 2009-2010= .62.
Respondents were generally positive about their perceptions of their local IMSP progress toward
objectives. In site interviews, the most commonly described success for building capacity for the
partnerships was the successful implementation of coursework or project programming. Some
partnerships noted success with teacher pedagogy and opportunities for collaboration. A few
partnerships reported institutional changes in the school partner, mostly in terms of transitions in staff
due to poor economic conditions or restructuring unrelated to the grant. A few partners noted positive
changes that they attributed to the grant. Finally, some partners noted changes in teacher knowledge
and attitudes for their project. Fewer programs reported evidence of student change.
Sustainability
Finally, for sustainability, teachers as a whole were more satisfied than other respondents that they
could sustain the practices they have started across grant types. For sustainability, MS Degree partners
were more similar in their ratings than WIP-1 partners. Partnerships generally reported that they
received benefits commensurate with their contributions. While more than half of the grant
partnerships showed evidence in site interviews of important progress toward establishing at least some
components of sustainability, many still struggle with this area.
Recommendations for Improvement
Communication of the IMSP
The state MSP program can provide a better structure to improve communication. First, the state IMSP
should provide guidelines for the local communication of the IMSP goals. All local grant documents
should reference the state IMSP funding when they are disseminated. The IMSP “label” should be used

[Evaluation Report: 2009-2010] Page 45
by all funded partners. Second, templates for formal agreements between partners and participants
should be provided to ensure consistent communication of IMSP goals and expectations. Currently
funded grantees should submit their formal agreements to be used in developing templates.
Implementation of Evaluation
Evaluation activities related to student and teacher outcomes and implementation fidelity should be
centralized using the Illinois Data Portal. Tools on the data portal should be supplemented to include
surveys and observation protocols appropriate to the goals of the IMSP to be used by all grants. Student
data requirements should be changed in future IMSP programs to incorporate student performance
assessments (through the portal).
Participation by the School Partner
A more formal application and recruitment process needs to be implemented by the state IMSP for LEA
eligibility to participate. Districts should formally identify local needs and acknowledge formally their
commitment to a deeper participation in the IMSP program. Alternative strategies to local IMSP
partners recruiting participating teachers individually needs to be considered to improve the
commitment, relevance, and coherence of the program for the local LEA.
Alignment of Programs with Participant Needs
As distinct models, there is no evidence that the two models (graduate versus workshop institute) are
different in their student and teacher outcomes. There is some evidence that serving teachers from
mixed grade and content areas is not as effective at serving the teachers’ needs generally. The IMSP
should consider re-formulating the distribution of grants to provide more targeted opportunities that
can address the needs of the schools and teachers more flexibly. District level commitment to multiple
IMSP grants that more specifically target content or grade level needs may be an appropriate
alternative. Centralized evaluation data collection through the portal will help minimize the burden of
participating in multiple grants.

[Evaluation Report: 2009-2010] Page 46
References
CCSSO. Strengthening Teacher Quality in High-Need Schools: Policy and Practice. Council of Chief State
School Officers, Washington, DC, 2007.
Cohen, J. (1988). Statistical power analysis for the behavioral sciences (2nd ed.). Hillsdale, NJ: Erlbaum.
Guskey, T. (2000). Evaluating Professional Development. Thousand Oaks, CA: Corwin Press.
Lawrenz, F. & Huffman, D. (2006). Methodological pluralism: The gold standard of STEM evaluation. New
Directions for Evaluation, 109, 19-34.
Mattessich, P. W., and Monsey, B. R. Collaboration: What Makes It Work. St. Paul, MN: Amherst H.
Wilder Foundation, 1992. (ED 390758)
Miller, M., Williamson McDiarmid, G., Luttrell-Montes, S. (2006). Partnering to prepare urban math and
science teachers: Managing tensions. Teaching and Teacher Education, 22, 848-863.
Morris, S. B., & DeShon, R. P. (2002). Combining effect size estimates in meta-analysis with repeated
measures and independent-groups designs. Psychological Methods. 7(1), 105-125.
Scott, T.P., Milam, J.L., Stuessy, C.L., Blount, K.P., & Bentz, A.B. (2006). Math and Science Scholars
(MASS) program for the recruitment and retention of preservice mathematics and science
teachers. Journal of Science Teacher Education, 17, 389-411.

[Evaluation Report: 2009-2010] Page 47
Appendix A
IMSP Logic Model


Appendix B
IMSP Protocols and Survey Instruments

Site Visit Evaluation Framework
Partnership Process Focus Analysis Question Data Source
1) Partnership
Composition
Size and diversity of partnership
decision-makers and stakeholders
Who are the partners across Illinois MSP grants?
How diverse are the stakeholders in positions of
power? What are the contributions of the
partners? What is the geographic dispersion of
the partnership?
Interview and Site Visit Protocols
2) Organizational
Structure
MSPs will categorize their
organizational structure based on
HUD’s Office of University
Partnerships (HUD, 2002, pp.
5.20-5.22).
How are the IMSPs organized? Where is the
IMSP located? Who are the decision-makers?
Artifact Analyses
Interview and Site Visit Protocols
3) Action Plan and
Operational
Guidelines
Review of the IMSP program and
articulation of formal
commitments and understandings
between all partners.
What is the scale of the IMSP project? What
formal agreements are in place to define,
establish, and support communication and
collaboration between partners?
Artifact Analyses
Interview and Site Visit Protocols
4) Qualities of the
Partnering
Relationship and
Maintaining the
Partnership
Characteristics are associated with
quality partnerships:
Mutuality & trust Leadership Resources Collaboration and
mechanisms of communication.
To what extent is there a mutual need, trust,
equality in decision-making, resource exchange,
transparency, respect, representation,
enthusiasm, and sustained understanding
between partners and stakeholders across MSP
grants? To what extent is leadership
collaborative and transformational?
Artifact Analyses
Interview and Site Visit Protocols
Interview and Site
Partner Satisfaction Survey
(Adapted from Wolf, 2003).

Protocol for Implementation Phase
1. Partnership Composition.
History: What is the history of the university in the community or with the partners? Did the university
(or parts of it) have experience with or a record of engagement in community outreach, community
service or applied research in the past? [Were these efforts coordinated? Was there a pre-existing
partnership/program within the University that preceded the IMSP? If so, what role does that office
have on the work of the IMSP? What is the relation between the IMSP and the program? Is there a
University unit that oversees the work of this center? What was the relationship between the university
and the community partners in the IMSP prior to the ISBE application?]
For collaboration between colleges within IHE: What was the relationship among the colleges
prior to the IMSP? Were their prior relationships with each other similar or different? In what
way?
Process. What was the process for creating the IMSP? [How did the IMSP partners develop the
application to ISBE? Did community or school partners contribute to the application, review the draft,
etc.? How did the IMSP partners refine the partnership relationships after receiving the grant? Are there
any groups that should have been included that were not part of the IMSP? ]
For collaboration between colleges within IHE:: Did both/all schools participate in developing
the IMSP proposal? How were the roles defined? How were responsibilities assigned?
Staffing. How is the IMSP staffed? [Have new staff been hired to conduct the work of the IMSP? What
positions were filled? Where did the candidates come from? How many staff members work (will work)
for the IMSP? What policies are in place for the replacement of staff as needed?]
For collaboration between colleges within IHE: Are IMSP staff drawn from both/all institutions?
Are faculty and students from both/all institutions involved in IMSP?
Context. What is the school environment for IMSP reform? [What are the major educational initiatives
in the city/region/state? How has the IMSP related to these efforts? Can the IMSP have improved
coordination with other programs to achieve greater outcomes? Are there resources for and attention
to these issues? What is the context for university funding? What other programs are competing for
university resources and attention?]
For collaboration between colleges within IHE: How does the institutional context for the IMSP
differ among the schools?

2. Organizational Structure of Partnership.
Structure. What is the structure of this IMSP? Does the IMSP have an advisory board(s) and what is its
role? Is there a sense of equity among the partners? [Who are the board members and what are their
respective affiliations? What is the governance of the IMSP? How are decisions made? By whom? Are
community / school perspectives valued and respected? What are the roles of the university,
community/ school in the IMSP? To what degree have university-community/school relationships
constituted a partnership? (Not at all, somewhat, to a moderate degree, to a great degree)]
For collaboration between colleges within IHE: What are the respective roles of the colleges in
the IMSP? Do all schools participate equally in governance and decision-making? How is
accountability by each school to the partnership determined? How are imbalances in
institutional resources compensated for? Is the IMSP seen as an opportunity for faculty and
student collaboration among the schools, or as individual efforts under a single banner?
Location within the University. Is there a specific space designated for the IMSP within the university?
What parts of the university are involved with the IMSP? What structures, policies and/or practices of
the university support community outreach or hinder outreach activities? [Where is the IMSP physically
housed? What was the rationale for its placement? Is the IMSP embraced by the leadership of the
university? If so, how?]
For collaboration between colleges within IHE: Where is the IMSP located in the consortium?
Why?
Artifacts: IMSP Membership list, IMSP/ IHE organizational chart
3. Action Plan and Operational Guidelines
IMSP Program Areas. What is the nature of the IMSP program and how ambitious is it? [What program
areas does the IMSP address? What is the scope and sequence of the new program?]
For collaboration between colleges within IHE: Are program areas divided by schools? If so how?
Or do the schools work jointly on the same project areas?
Operational Guidelines. What formal agreements are in place to define, establish, and support
communication and collaboration between partners? Who established these guidelines?
Artifacts: Logic Model, Evaluation Framework, Data Analysis Plans, IBHE proposal

4. Quality of Partnerships
Mutuality & Trust. Do the goals and objectives of the IMSP address mutual needs across partners? What
are the perceptions of trust across partners? Is there a sense of safety for sharing of information and
resources? What steps have partners taken to build trust? What is the nature of most interactions
between partners? Face-to-face? Email? What was the nature of relationships between partners before
the IMSP? How respectful is the IMSP to differences in cultural and organizational norms, values, and
beliefs? How transparent are the IMSP operations? Is their equality in decision-making? Is there
reciprocal accountability? Is there a balance in the representation of all partners in the IMSP? Does
leadership across partners work closely together? Is there enthusiasm surrounding IMSP goals and
activities?
For collaboration between colleges within IHE: What is the nature of relationships between
colleges? Is there a sense of equality in decision-making and resources? Is there a respect for
differences in cultures? Is there shared enthusiasm for the IMSP?
Artifacts: Meeting agendas, minutes
Leadership. Who are the leaders of the IMSP? [Who led the development of the IMSP application? Are
there one or more persons taking leadership? What is their role in the institution? What is their
continuing role in the IMSP? Was there participation from the top levels of the institution?]
For collaboration between colleges within IHE: Is leadership for the IMSP shared among the
colleges? Is there a key person at each school leading the IMSP? Is there participation from top
levels at both/all schools?
Resources. Has the IMSP received matching funds? [From what sources? How does this compare with
the initial proposal? Are there adequate resources to accomplish IMSP goals? Are resources sufficient
for all partners?] limited not just to financial resources but extending to managerial and technical skills,
contacts, information and the like;
For collaboration between colleges within IHE: How will resources be divided among the
institutions? Did all/both schools provide matching funds?
Artifacts: Budget summary/narrative
Communication. What are the guiding principles for your IMSP? Is there shared decision-making
between partners? What are the primary vehicles for communication? Is there a formal management
and communication plan? How are conflicts resolved in the partnership?
Artifacts: Meeting agendas, meeting minutes, newsletters, websites, other forms/policy statements

IMSP Teacher Satisfaction Survey1 (This Survey Omitted for Year One Planning Phase)
Please indicate your level of satisfaction with each aspect of your MSP participation.
(Likert scale: Very Satisfied – Very Dissatisfied)
Vision and Mutuality
1. Clarity of the vision for IMSP goals and objectives
2. Planning process used to prepare the IMSP objectives
3. Follow-through on IMSP activities
4. Efforts to promote collaborative action with other educators
5. Efforts to promote collaborative action with STEM professionals outside the university
6. Processes used to assess teachers’ needs
7. Processes used to assess my students' needs
8. Participation of influential people in the IMSP that represent teachers’ interests
9. Diversity of partners and participants
10. Respect, acceptance and recognition of my contributions to reaching the IMSP goals
11. Resources provided by my district and/or school to support my commitment to the IMSP grant
Leadership
12. Strength and competence of IMSP leadership
13. Sensitivity to cultural issues
14. Opportunities for me to take leadership roles
15. Trust that partners and participants afford each other
Communication
16. Use of the media to promote awareness of the IMSP goals, actions, and accomplishments
17. Communication among members of the partnership
18. Communication between the IMSP and the broader community
19. Extent to which IMSP participants are listened to and heard
20. Working relationships established with school officials
21. Information provided on issues and available resources
Comments:
Technical Assistance:
22. Strength and competence of IMSP faculty and staff
23. Training and technical assistance provided by faculty and staff
24. Help given the participants in meeting IMSP requirements
1 Adapted from Annual Satisfaction Survey for Community Coalitions. Wolff,T (2003).. A practical approach to evaluating coalitions. In T.Backer(Ed.) Evaluating Community Collaborations. Springer Publishing

25. Help given the participants to become better able to address and resolve their concerns
Progress and Outcomes:
26. My progress in learning new content through the IMSP grant.
27. My progress in using new instructional resources through the IMSP grant.
28. My progress in using new STEM technologies through the IMSP grant.
29. My progress toward meeting endorsement or certification requirements.
30. My access to STEM industry experts through the IMSP grant.
31. My access to mentors because of the IMSP grant.
32. Fairness with which resources and opportunities are distributed
33. Capacity of IMSP teachers to give support to each other
34. IMSP grant's contribution to improving science and/or mathematics instruction in my school.
Please indicate how much you agree or disagree with the following statements.
(Likert scale: Strongly Agree – Strongly Disagree)
Job Satisfaction
35. In most ways, being a STEM teacher is close to my ideal.
36. My conditions of being a STEM teacher are excellent.
37. I am satisfied with being a STEM teacher.
38. So far I have gotten the important things I want to be a STEM teacher.
39. If I could choose my career over, I would change almost nothing.
Sustainability
40. I received important professional benefits from my participation in the IMSP.
41. The benefits I received were worth the time, effort, and cost I invested in the IMSP.
42. The benefits I received were commensurate with the contributions I made to the IMSP.
43. I strongly believe the IMSP should be continued.
44. I will participate fully in IMSP activities in the future.
45. The IMSP activities need to be dramatically improved to make it worth my investment.
46. I will continue to integrate IMSP strategies and materials into my classroom instruction.
47. I have access to the resources I need to continue to integrate IMSP strategies and materials into my
classroom instruction.
48. My district will support my continued integration of IMSP strategies and materials into my classroom
instruction.

IMSP School Partner Satisfaction Survey2
Please indicate your level of satisfaction with each aspect of your IMSP partnership.
(Likert scale: Very Satisfied – Very Dissatisfied)
Vision and Mutuality
1. Clarity of the vision for the IMSP goals and objectives
2. Planning process used to prepare the IMSP objectives
3. Follow-through on IMSP activities
4. Efforts to promote collaborative action
5. Efforts to promote collaborative action between STEM professionals and teachers
6. Processes used to assess teachers’ needs
7. Processes used to assess students' needs
8. Participation of influential people in the IMSP that represent a variety of interests
9. Diversity of partners and participants
10. Respect, acceptance and recognition of my contributions to reaching the IMSP goals
11. Resources provided by the partner districts and/or school to support the IMSP grant
Leadership
12. Strength and competence of IMSP leadership
13. Sensitivity to cultural issues
14. Opportunities for me to take a leadership role
15. Trust that partners and participants afford each other
16. Transparency of decision-making.
Communication
17. Use of the media to promote awareness of the IMSP goals, actions, and accomplishments
18. Communication among members of the partnership
19. Communication between the IMSP and the broader community
20. Extent to which IMSP participants are listened to and heard
21. Working relationships established with school officials
22. Information provided on issues and available resources
2 Adapted from Annual Satisfaction Survey for Community Coalitions. Wolff,T. (2003). A practical approach to evaluating coalitions. In T.Backer(Ed.) Evaluating Community Collaborations. Springer Publishing
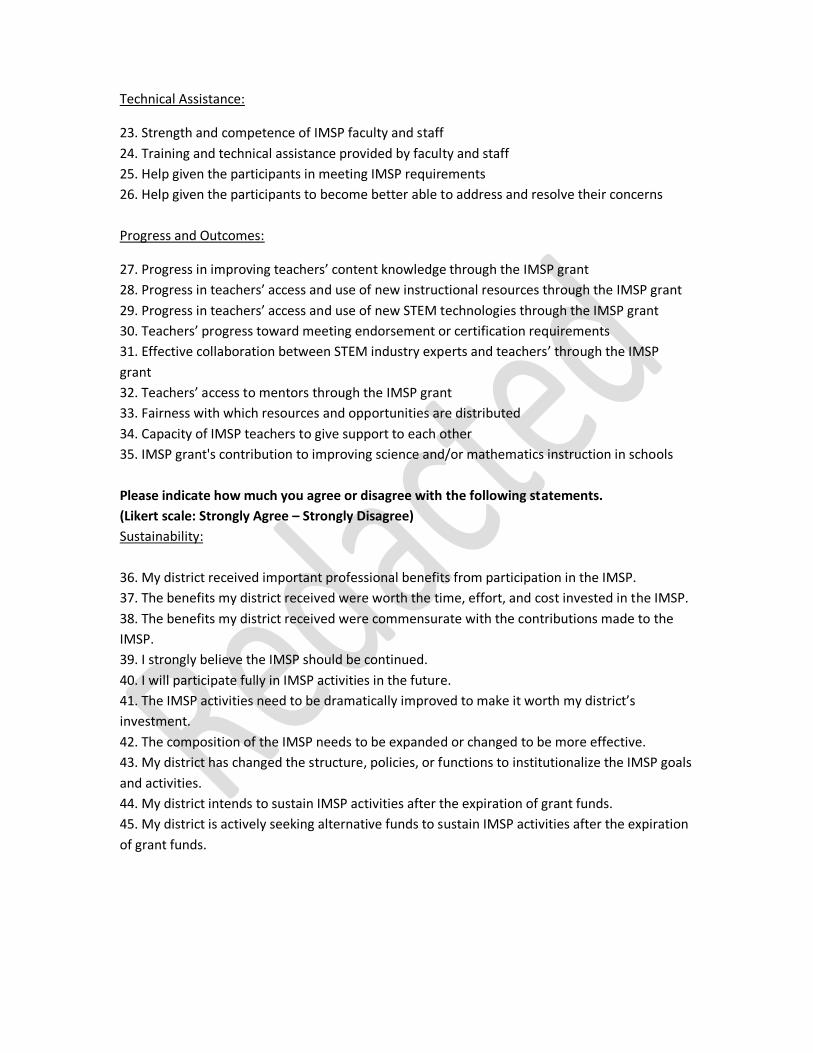
Technical Assistance:
23. Strength and competence of IMSP faculty and staff
24. Training and technical assistance provided by faculty and staff
25. Help given the participants in meeting IMSP requirements
26. Help given the participants to become better able to address and resolve their concerns
Progress and Outcomes:
27. Progress in improving teachers’ content knowledge through the IMSP grant
28. Progress in teachers’ access and use of new instructional resources through the IMSP grant
29. Progress in teachers’ access and use of new STEM technologies through the IMSP grant
30. Teachers’ progress toward meeting endorsement or certification requirements
31. Effective collaboration between STEM industry experts and teachers’ through the IMSP
grant
32. Teachers’ access to mentors through the IMSP grant
33. Fairness with which resources and opportunities are distributed
34. Capacity of IMSP teachers to give support to each other
35. IMSP grant's contribution to improving science and/or mathematics instruction in schools
Please indicate how much you agree or disagree with the following statements.
(Likert scale: Strongly Agree – Strongly Disagree)
Sustainability:
36. My district received important professional benefits from participation in the IMSP.
37. The benefits my district received were worth the time, effort, and cost invested in the IMSP.
38. The benefits my district received were commensurate with the contributions made to the
IMSP.
39. I strongly believe the IMSP should be continued.
40. I will participate fully in IMSP activities in the future.
41. The IMSP activities need to be dramatically improved to make it worth my district’s
investment.
42. The composition of the IMSP needs to be expanded or changed to be more effective.
43. My district has changed the structure, policies, or functions to institutionalize the IMSP goals
and activities.
44. My district intends to sustain IMSP activities after the expiration of grant funds.
45. My district is actively seeking alternative funds to sustain IMSP activities after the expiration
of grant funds.

IMSP Industry Partner Satisfaction Survey3
Please indicate your level of satisfaction with each aspect of your IMSP partnership.
(Likert scale: Very Satisfied – Very Dissatisfied)
Vision and Mutuality:
1. Clarity of the vision for the IMSP goals and objectives
2. Planning process used to prepare the IMSP objectives
3. Follow-through on IMSP activities
4. Efforts to promote collaborative action between partners
5. Efforts to promote collaborative action between STEM professionals and teachers
6. Participation of influential people in the IMSP that represent a variety of interests
7. Diversity of partners and participants
8. Respect, acceptance and recognition of my contributions to reaching the IMSP goals
9. Resources provided by the partner organizations to support the IMSP grant
Leadership:
10. Strength and competence of IMSP leadership
11. Sensitivity to cultural issues
12. Opportunities for me to take a leadership role
13. Trust that partners and participants afford each other
14. Transparency of decision-making.
Communication:
15. Use of the media to promote awareness of the IMSP goals, actions, and accomplishments
16. Communication among members of the partnership
17. Communication between the IMSP and the broader community
18. Extent to which IMSP participants are listened to and heard
19. Working relationships established with school officials
20. Information provided on issues and available resources
Technical Assistance:
21. Strength and competence of IMSP faculty and staff
22. Training and technical assistance provided by faculty and staff
23. Help given the participants in meeting IMSP requirements
24. Help given the participants to become better able to address and resolve their concerns
3 Adapted from Annual Satisfaction Survey for Community Coalitions. Wolff,T. (2003). A practical approach to evaluating coalitions. In T.Backer(Ed.) Evaluating Community Collaborations. Springer Publishing

Progress and Outcomes:
25. Progress in improving teachers’ content knowledge through the IMSP grant
26. Progress in teachers’ access and use of new instructional resources through the IMSP grant
27. Progress in teachers’ access and use of new STEM technologies through the IMSP grant
28. Teachers’ progress toward meeting endorsement or certification requirements
29. Effective collaboration between STEM industry experts and teachers’ through the IMSP
grant
30. Teachers’ access to mentors through the IMSP grant
31. Fairness with which resources and opportunities are distributed
32. Capacity of IMSP teachers to give support to each other
33. IMSP grant's contribution to improving science and/or mathematics instruction in schools
Please indicate how much you agree or disagree with the following statements.
(Likert scale: Strongly Agree – Strongly Disagree)
Sustainability:
34. My organization received important professional benefits from participation in the IMSP.
35. The benefits my organization received were worth the time, effort, and cost invested in the
IMSP.
36. The benefits my organization received were commensurate with the contributions made to
the IMSP.
37. I strongly believe the IMSP should be continued.
38. I will participate fully in IMSP activities in the future.
39. The IMSP activities need to be dramatically improved to make it worth my organization’s
investment.
40. The composition of the IMSP needs to be expanded or changed to be more effective.
41. My organization has changed the structure, policies, or functions to institutionalize the IMSP
goals and activities.
42. My organization intends to sustain IMSP activities after the expiration of grant funds.
43. My organization is actively seeking alternative funds to sustain IMSP activities after the
expiration of grant funds.

Appendix C
Member Check Survey

Grant Profile Member Check
Each grant has been sent a .pdf representing the profile written by your state site evaluator focusing on four specific areas: Partnership
Composition, Organizational Structure, Action Plan and Operational Guidelines, and Qualities of the Partnering Relationship.
The profiles across all grants will be analyzed to report on trends across the state in terms of the funded IMSP partnerships. Individual profiles
will be submitted to the ISBE in an Appendix as part of the year-end report. A redacted version will be submitted as needed using pseudonyms
for partners as indicated by individual grants. The redacted version will be disseminated as appropriate at the discretion of the ISBE.
The purpose of this survey is to provide grantees an opportunity to clarify or provide alternative perspectives on the profiles being submitted to
the ISBE in the year-end report. If you are comfortable with the content of the profile as written by the site evaluator, no response is needed. All
responses submitted on this form will be appended to your site evaluator profile unedited.
Comments about your IMSP Partnership Composition profile summary:

Comments about your IMSP Organizational Structure profile summary:
Comments about your IMSP Action Plan and Operational Guidelines profile summary:
Comments about your IMSP Qualities of the Partnering Relationships profile summary:
Identification in redacted report: Yes No
Would you like the redacted report to use a pseudonym for university partners?
Would you like the redacted report to use a pseudonym for school partners?
Would you like the redacted report to use a pseudonym for industry partners?

Appendix D
Tests Used by Sites for Content Knowledge

Project Name Teacher Test Name
Master's Aurora Biology Bio #1
Master's Aurora Biology Bio #2
Master's Aurora Biology Bio #3
Master's Aurora Earth Space MOSART Astronomy/Space Science
Master's Aurora Earth Space MOSART Earth Science
Master's Aurora Elementary DTAMS Life Science
Master's Aurora Elementary DTAMS Whole Numbers and Computation
Master's Aurora Elementary DTAMS Rational Numbers
Master's Aurora Secondary Math DTAMS MS Probability and Statistics
Master's Aurora Secondary Math DTAMS MS Geometry and Measurement
Master's Bradley Elementary LMT Elementary number concepts
Master's Bradley Elementary LMT Elementary number concepts-control
Master's Bradley Elementary LMT ratios and fractions
Master's Bradley Elementary LMT ratios and fractions-control
Master's Bradley Elementary LMT rational numbers
Master's Bradley Elementary LMT rational numbers-control
Master's Bradley Elementary LMT middle school geometry
Master's Bradley Elementary LMT middle school geometry-control
Master's Bradley Elementary LMT middle school algebra
Master's Bradley Elementary LMT middle school algebra-control
Master's Bradley Elementary DTAMS earth science
Master's Bradley Elementary DTAMS earth science-control
Master's Bradley Elementary DTAMS life science
Master's Bradley Elementary DTAMS life science-control
Master's Bradley Elementary DTAMS physical science
Master's Bradley Elementary DTAMS physical science-control
Master's Bradley Environmental Science Environmental science test
Master's Bradley Environmental Science Environmental science test
Master's Bradley Environmental Science Math test
Master's Bradley Environmental Science Math test
Master's DePaul Secondary Math DTAMS: Geometry/Measurement - questions 1-5
Master's IIT Physics DTAMS
Master's IIT Physics VNOS-C
Master's ISU Chemistry Local
Master's ISU Elementary DTAMS
Master's ISU Elementary DTAMS test
Master's ISU Elementary Teacher beliefs
Master's ISU IT / Pre-Engineering Integrated Curriculum
Master's ISU Secondary Math DTAMS Number and Computation

Project Name Teacher Test Name
Master's ISU Secondary Math DTAMS Geometry and Measurement
Master's ISU Secondary Math DTAMS Life Science
Master's ISU Secondary Math DTAMS Physical Science
Master's Loyola Chemistry Chem 495
Master's Loyola Secondary Math DTAMS Algebra
Master's Loyola Secondary Math DTAMS Number Th
Master's Loyola Secondary Math DTAMS Geometry
Master's NIU Biology Teacher Content
Master's NIU IT / Pre-Engineering nano
Master's NIU IT / Pre-Engineering manufacturing
Master's NIU IT / Pre-Engineering fuel cell
Master's NIU IT / Pre-Engineering action research
Master's NIU Secondary Math NCO
Master's NIU Secondary Math GEO
Master's NIU Secondary Math PFA
Master's SIU-C Elementary Math
Master's SIU-C Elementary Physics
Master's SIU-C Elementary DTAMS
Master's SIU-E Secondary Math CI 563 (Marlette)
Master's SIU-E Secondary Math MTH531 (Hasty)
Master's UIUC Elementary LMT_Total
Master's UIUC Elementary LMT_Number
Master's UIUC Elementary LMT_Algebra
Master's UIUC Elementary LMT_Geometry
Master's UIUC Elementary DTAMS _Total
Master's UIUC Elementary ATLAST_The Flow of Matter and Energy
Master's UIUC Elementary Biodiversity
Workshop/Institute 2 Aurora University Elementary Math / Science
DTAMS
Workshop/Institute 2 BHS ROE #28 7th - 12th grade Math / Science
Math7-12
Workshop/Institute 2 BHS ROE #28 7th - 12th grade Math / Science
Tech
Workshop/Institute 2 Illinois State University MS Engaged STEM
STEM
Workshop/Institute 2 Illinois State University Threatened Species, Threatened Environments
Threatened Species
Workshop/Institute 2 Lee/Ogle Counties ROE 47 5th - 9th NIMS - Rockford
Science
Workshop/Institute 2 Lee/Ogle Counties Math

Project Name Teacher Test Name
ROE 47 5th - 9th NIMS - Rockford
Workshop/Institute 2 M-R ROE #45 Elementary / MS Intel Math
Intel Math Content Test
Workshop/Institute 2 Northern Illinois University MS / HS STEM
Manufacturing
Workshop/Institute 2 Northern Illinois University MS / HS STEM
Nano
Workshop/Institute 2 RI ROE 49 NIMS 4th - 9th Physical/ Earth Science
Physical science
Workshop/Institute 2 RI ROE 49 NIMS 4th - 9th Physical/ Earth Science
Data analysis
Workshop/Institute 2 Southern Illinois University MS / HS Science Partnership for Improved Achievement in Science Through Computational Science
Modified DTAMS
Workshop/Institute 2 Southern Illinois University MS / HS Science Partnership for Improved Achievement in Science Through Computational Science
Simulations & animations test
Workshop/Institute 2 St. Clair ROE 50 Elementary / MS Sprouting STEMS
Broad Content Examination
Workshop/Institute 2 St. Clair ROE 50 Elementary / MS Sprouting STEMS
Math Workshop
Workshop/Institute 2 St. Clair ROE 50 Elementary / MS Sprouting STEMS
Science Workshop
Workshop/Institute Aurora University MS / HS Mathematics
DTAMS
Workshop/Institute Aurora University MS / HS Physical Sciences
DTAMS
Workshop/Institute Board of Trustees of the University of Illinois HS STEM - Nanotechnology
Nanotechnology
Workshop/Institute Illinois State University HS Math
IMSP Professional Development Participant Interview
Workshop/Institute Illinois State University MS / HS Science / Geology
Earthscope
Workshop/Institute Lee/Ogle Counties ROE 47 6th - 9th grade Math & Science
Science
Workshop/Institute Lee/Ogle Counties ROE 47 6th - 9th grade Math & Science
Math
Workshop/Institute Lee/Ogle Counties ROE 47 6th - 9th grade Math & Science
LMT Geom
Workshop/Institute Lee/Ogle Counties ROE 47 6th - 9th grade Math & Science
PGE Science
Workshop/Institute Lee/Ogle Counties ROE PGE Math
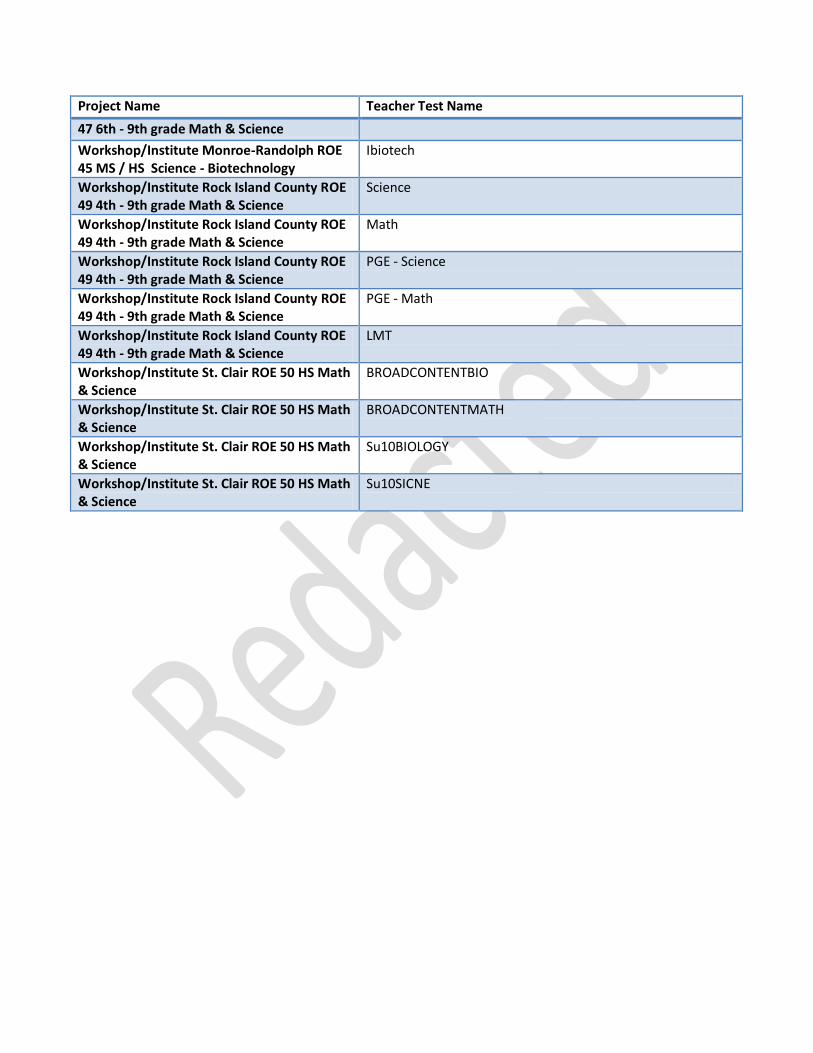
Project Name Teacher Test Name
47 6th - 9th grade Math & Science
Workshop/Institute Monroe-Randolph ROE 45 MS / HS Science - Biotechnology
Ibiotech
Workshop/Institute Rock Island County ROE 49 4th - 9th grade Math & Science
Science
Workshop/Institute Rock Island County ROE 49 4th - 9th grade Math & Science
Math
Workshop/Institute Rock Island County ROE 49 4th - 9th grade Math & Science
PGE - Science
Workshop/Institute Rock Island County ROE 49 4th - 9th grade Math & Science
PGE - Math
Workshop/Institute Rock Island County ROE 49 4th - 9th grade Math & Science
LMT
Workshop/Institute St. Clair ROE 50 HS Math & Science
BROADCONTENTBIO
Workshop/Institute St. Clair ROE 50 HS Math & Science
BROADCONTENTMATH
Workshop/Institute St. Clair ROE 50 HS Math & Science
Su10BIOLOGY
Workshop/Institute St. Clair ROE 50 HS Math & Science
Su10SICNE

Project Name Grade Level
Student Test Name
Master's Aurora Biology 6 VNOS
Master's Aurora Biology 7 VNOS
Master's Aurora Biology 9 VNOS
Master's Aurora Biology 10 VNOS
Master's Aurora Biology 11 VNOS
Master's Aurora Biology 12 VNOS
Master's Aurora Earth Space 7 Classroom Designed Science test
Master's Aurora Earth Space 10 Classroom Designed Science test
Master's Aurora Elementary 4 ISAT MATH
Master's Aurora Elementary 5 ISAT MATH
Master's Aurora Secondary Math 6 Math Diagnostic Testing Project Pre-Algebra Readiness
Master's Aurora Secondary Math 7 Math Diagnostic Testing Project Algebra Readiness
Master's Aurora Secondary Math 8 Math Diagnostic Testing Project Algebra Readiness Longer Version
Master's Aurora Secondary Math 8 Math Diagnostic Testing Project Geometry Readiness
Master's Aurora Secondary Math 9 Math Diagnostic Testing Project Second Yr Algebra Readiness
Master's Aurora Secondary Math 12 Math Diagnostic Testing Calculus Readiness
Master's Bradley Elementary 4 ISAT MATH
Master's Bradley Elementary 5 ISAT MATH
Master's Bradley Elementary 6 ISAT MATH
Master's Bradley Elementary 7 ISAT MATH
Master's Bradley Elementary 8 ISAT MATH
Master's Bradley Environmental Science
9 EXPLORE/PLAN MATH
Master's Bradley Environmental Science
9 EXPLORE/PLAN SCIENCE
Master's DePaul Secondary Math 10 MOSART Form 731 (pre-test) and 732 (post-test)
Master's DePaul Secondary Math 11 MOSART Form 731 (pre-test) and 732 (post-test)
Master's IIT Physics 4 Ecology
Master's IIT Physics 7 Ecology
Master's IIT Physics 8 Ecology
Master's IIT Physics 5 Atomic Structure
Master's ISU Chemistry 11 Local
Master's ISU Elementary 3 Science
Master's ISU Elementary 7 Science
Master's ISU Elementary 3 math
Master's ISU Elementary 7 math
Master's ISU IT / Pre-Engineering 6 ISAT Math (07-08)

Project Name Grade Level
Student Test Name
Master's ISU IT / Pre-Engineering 8 ISAT Math (09-10)
Master's ISU IT / Pre-Engineering 11 PSAE Science (07-08)
Master's ISU IT / Pre-Engineering 11 PSAE Science (09-10)
Master's ISU Secondary Math 5 ISAT
Master's ISU Secondary Math 6 ISAT
Master's ISU Secondary Math 7 ISAT
Master's ISU Secondary Math 8 ISAT
Master's ISU Secondary Math 5 IICC Science Test
Master's ISU Secondary Math 6 IICC Science Test
Master's Loyola Chemistry 10 MOSART Form 731 (pre-test) and 732 (post-test)
Master's Loyola Chemistry 11 MOSART Form 731 (pre-test) and 732 (post-test)
Master's Loyola Secondary Math 50 ISAT
Master's NIU Biology 7 biology
Master's NIU Biology 9 biology
Master's NIU Biology 10 biology
Master's NIU Biology 11 biology
Master's NIU Biology 12 biology
Master's NIU IT / Pre-Engineering 6 Test 1
Master's NIU IT / Pre-Engineering 7 Test 2
Master's NIU IT / Pre-Engineering 8 Test 3
Master's NIU IT / Pre-Engineering 9 Test 4
Master's NIU IT / Pre-Engineering 10 Test 5
Master's NIU IT / Pre-Engineering 11 Test 6
Master's NIU IT / Pre-Engineering 12 Test 7
Master's NIU Secondary Math 5 EMMA
Master's NIU Secondary Math 6 EMMA
Master's NIU Secondary Math 7 EMMA
Master's NIU Secondary Math 8 EMMA
Master's NIU Secondary Math 5 MDS
Master's NIU Secondary Math 6 MDS
Master's NIU Secondary Math 7 MDS
Master's NIU Secondary Math 8 MDS
Master's SIU-C Elementary 5 Math
Master's SIU-C Elementary 6 Math
Master's SIU-C Elementary 7 Math
Master's SIU-C Elementary 6 Science
Master's SIU-C Elementary 7 science
Master's SIU-E Secondary Math 9 algebra test
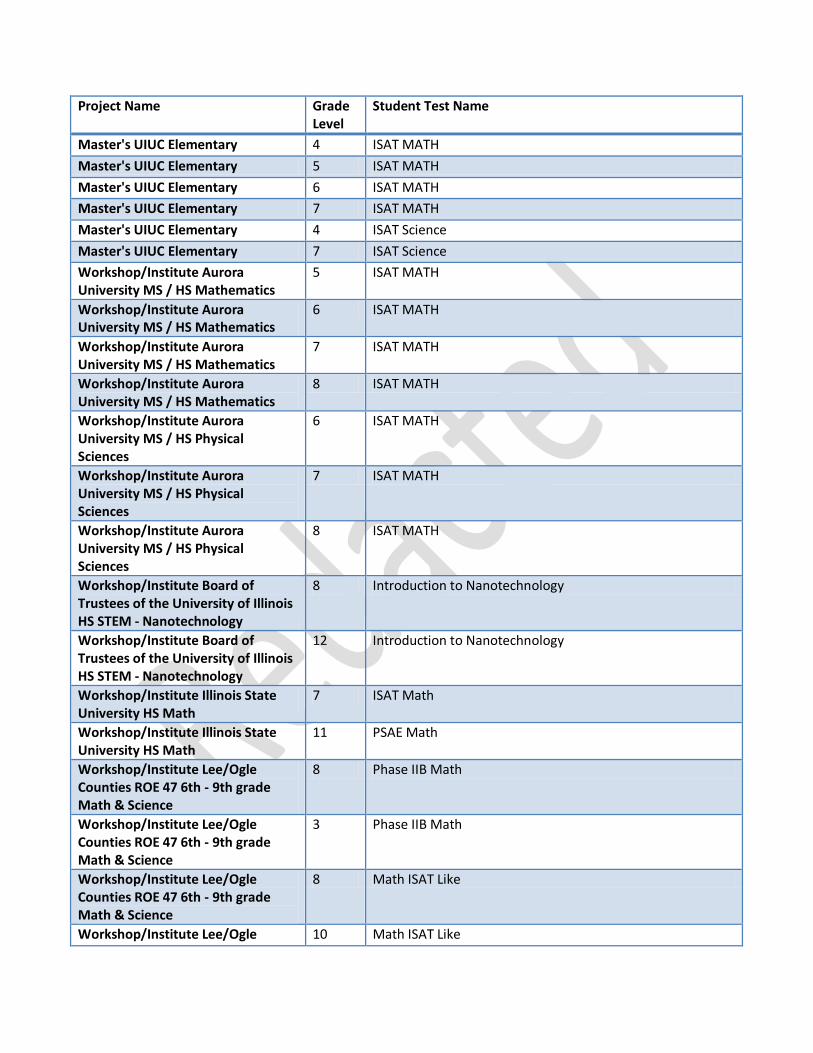
Project Name Grade Level
Student Test Name
Master's UIUC Elementary 4 ISAT MATH
Master's UIUC Elementary 5 ISAT MATH
Master's UIUC Elementary 6 ISAT MATH
Master's UIUC Elementary 7 ISAT MATH
Master's UIUC Elementary 4 ISAT Science
Master's UIUC Elementary 7 ISAT Science
Workshop/Institute Aurora University MS / HS Mathematics
5 ISAT MATH
Workshop/Institute Aurora University MS / HS Mathematics
6 ISAT MATH
Workshop/Institute Aurora University MS / HS Mathematics
7 ISAT MATH
Workshop/Institute Aurora University MS / HS Mathematics
8 ISAT MATH
Workshop/Institute Aurora University MS / HS Physical Sciences
6 ISAT MATH
Workshop/Institute Aurora University MS / HS Physical Sciences
7 ISAT MATH
Workshop/Institute Aurora University MS / HS Physical Sciences
8 ISAT MATH
Workshop/Institute Board of Trustees of the University of Illinois HS STEM - Nanotechnology
8 Introduction to Nanotechnology
Workshop/Institute Board of Trustees of the University of Illinois HS STEM - Nanotechnology
12 Introduction to Nanotechnology
Workshop/Institute Illinois State University HS Math
7 ISAT Math
Workshop/Institute Illinois State University HS Math
11 PSAE Math
Workshop/Institute Lee/Ogle Counties ROE 47 6th - 9th grade Math & Science
8 Phase IIB Math
Workshop/Institute Lee/Ogle Counties ROE 47 6th - 9th grade Math & Science
3 Phase IIB Math
Workshop/Institute Lee/Ogle Counties ROE 47 6th - 9th grade Math & Science
8 Math ISAT Like
Workshop/Institute Lee/Ogle 10 Math ISAT Like

Project Name Grade Level
Student Test Name
Counties ROE 47 6th - 9th grade Math & Science
Workshop/Institute Lee/Ogle Counties ROE 47 6th - 9th grade Math & Science
10 Science ISAT Like
Workshop/Institute Lee/Ogle Counties ROE 47 6th - 9th grade Math & Science
6 Math Phase IIA Type
Workshop/Institute Lee/Ogle Counties ROE 47 6th - 9th grade Math & Science
6 Math ISAT Like
Workshop/Institute Monroe-Randolph ROE 45 MS / HS Science - Biotechnology
5 IBIO5
Workshop/Institute Monroe-Randolph ROE 45 MS / HS Science - Biotechnology
6 IBIO6
Workshop/Institute Monroe-Randolph ROE 45 MS / HS Science - Biotechnology
8 IBIO8
Workshop/Institute Monroe-Randolph ROE 45 MS / HS Science - Biotechnology
9 IBIO9
Workshop/Institute Monroe-Randolph ROE 45 MS / HS Science - Biotechnology
12 IBIO12
Workshop/Institute Rock Island County ROE 49 4th - 9th grade Math & Science
5 Math ISAT Like
Workshop/Institute Rock Island County ROE 49 4th - 9th grade Math & Science
6 Math ISAT Like
Workshop/Institute Rock Island County ROE 49 4th - 9th grade Math & Science
7 Math ISAT Like
Workshop/Institute Rock Island County ROE 49 4th - 9th grade Math & Science
4 Science ISAT like
Workshop/Institute Rock Island County ROE 49 4th - 9th grade Math & Science
6 Science ISAT like
Workshop/Institute Rock Island County ROE 49 4th - 9th grade Math & Science
7 Science ISAT like

Project Name Grade Level
Student Test Name
Workshop/Institute Rock Island County ROE 49 4th - 9th grade Math & Science
8 Science ISAT like
Workshop/Institute Rock Island County ROE 49 4th - 9th grade Math & Science
10 Science ISAT like
Workshop/Institute St. Clair ROE 50 HS Math & Science
9 Algebra I Test
Workshop/Institute St. Clair ROE 50 HS Math & Science
10 Biology Test