Embed Size (px)
Citation preview

1
ILLINOIS INDUSTRIAL CARBON CAPTURE AND STORAGE PROJECT Project Overview, Lessons, & Future Plans
Carbon Sequestration Leadership Forum June 11-14, 2012 Scott McDonald
Biofuels Development Director [email protected]

2
Acknowledgements • The Industrial Carbon Capture and Storage (ICCS) project is administered by
the U.S. Department of Energy's Office of Fossil Energy and managed by the National Energy Technology Laboratory (award number DE-FE-0001547) and by a cost share agreement with the Archer Daniels Midland Company, University of Illinois through the Illinois State Geological Survey, Schlumberger Carbon Services, and Richland Community College. This ICCS project received DOE funding from the American Recovery and Reinvestment Act of 2009 ($141.4 million).
• The Midwest Geological Sequestration Consortium is funded by the U.S. Department of Energy through the National Energy Technology Laboratory via the Regional Carbon Sequestration Partnership Program (contract number DE-FC26-05NT42588) and by a cost share agreement with the Illinois Department of Commerce and Economic Opportunity, Office of Coal Development through the Illinois Clean Coal Institute.
• The Midwest Geological Sequestration Consortium (MGSC) is a collaboration led by the geological surveys of Illinois, Indiana, and Kentucky

3
ADM is: A Global Leader in Renewable Fuels and Products using our Premier Position in Agricultural Processing to Serve Vital Human Needs for Food and Energy by Connecting the Harvest to the Home.

4
ADM Company Profile Core Purpose Connecting the harvest to the home and transforming crops into products that serve vital needs for food and energy. Financials • FY 2011 Net Sales: $80 billion • FY 2011 Net Earnings: $2.0 billion Processing • 66,000 MT of corn each day • 100,000 MT of oilseeds each day • 28,000 MT of wheat each day • 3,000 MT of cocoa beans Logistics • 26,100 Rail cars • 1,700 Barges • 700 Trucks – 1,500 Trailers • 8 Oceangoing Ships

5
Sourcing facilities Oilseed processing Corn processing Cocoa & wheat processing Wilmar Sourcing distribution Processing distribution
ADM’s Global Assets

6
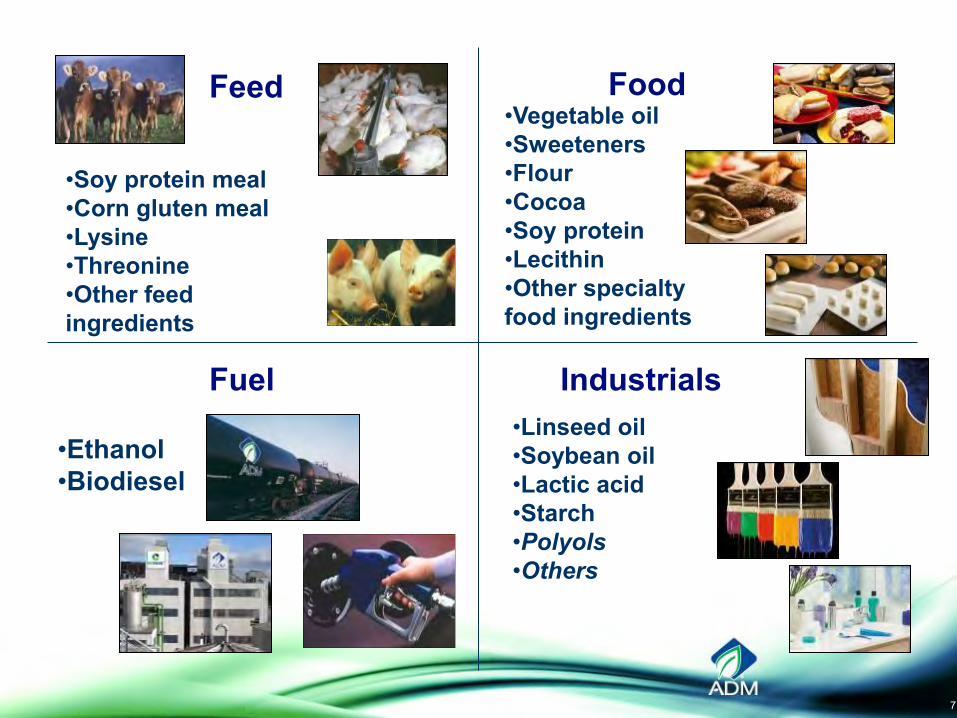
The ADM Value Chain
Food
Feed
Fuels
Industrials
SOURCE TRANSPORT MARKET &
SELL TRANSFORM PROCESS DISTRIBUTE
COCOA BEAN
Microbiology, Chemistry, Engineering, Food and Animal Science
Oilseeds
Corn
Cocoa
Wheat
CROPS VALUE-ADDED
PRODUCTS
Feedstocks Sourcing and Transportation •New Traits •New Feedstocks
Process & Transform •Efficiency •New Products •Sustainability
Distribute, Market & Sell •Product Safety •Applications Research •Quality
Business Acumen and Financial Strength
Technology Is Key Across the Value Chain
7
•Soy protein meal •Corn gluten meal •Lysine •Threonine •Other feed ingredients
•Vegetable oil •Sweeteners •Flour •Cocoa •Soy protein •Lecithin •Other specialty food ingredients
•Ethanol •Biodiesel
•Linseed oil •Soybean oil •Lactic acid •Starch •Polyols •Others
Feed
Fuel Industrials
Food

8
ADM Research Initiatives •Biomass Conversion to Fuel
Additives • Integrated Biorefinery: Ethanol &
Ethyl Acrylate •Carbon Capture and Storage •Membrane Solvent-Extraction:
Ethanol •HTL, Catalytic Pyrolysis, &
Hydrogen Research •Chemical Platform Development:
PG/EG •And Many More…..

9
Focus of Today’s Presentation • Provide an Overview and Comparison of the
CCS projects underway in Decatur, Illinois - Illinois Industrial Carbon Capture and Storage Project (IL-ICCS) - Illinois Basin Decatur Project (IBDP)
• Features, Activities, & Impacts of IL-ICCS
• Review Lessoned Learned
• Future Plans for the Facility & Site

10
DOE - Regional Carbon Storage Partnerships (Phase 3) Program Objective Large scale geologic test to inject 1.0 million tons of CO2 over a three year period (1,000 MT/day).
Project Team Members Schedule of Activities - Engineering Q1 2008 – Q1 2012 - Permitting Q1 2008 – Q1 2013 - Construction Q2 2009 – Q3 2011 - Operation Q4 2011 – Q4 2014 - Monitoring Q1 2015 – Q4 2016 Knowledge Base - Site Geological Characterization - Risk Assessment & Reservoir Modeling - Engineering Design & MVA Breaking ground for anthropogenic CO2 storage in a saline reservoir using cutting-edge sequestration technology
Illinois Basin Decatur Project (IBDP) Project Overview

11
DOE - Large-Scale CCS from Industrial Sources (Area 1) Program Objectives - Target & Demonstrate Advanced CCS
Technologies at Industrial Scale Facilities - Inject and Store One Million Tons of CO2
Annually (3,000 tons/day) Project Team Members
Schedule of Activities - Engineering Q3 2010 – Q1 2012 - Permitting Q3 2011 – Q1 2013 - Construction Q2 2011 – Q2 2013 - Operation Q3 2013 – Q3 2015 Knowledge Base - Site Geological Characterization - Risk Assessment & Reservoir Modeling - Engineering Design & MVA - Education and Public Outreach Study the interaction between the CO2 plumes from two injection wells within the same formation.
Illinois Industrial CCS Project (IL-ICCS) Project Overview

12
Project Objectives - Design, construct, and operate a
new CO2 collection, compression, and dehydration facility capable of delivering up to 2,000 metric tons of CO2 per day to the injection site.
- Integrate the new facility with an existing 1,000 metric tons of CO2 per day compression and dehydration facility to achieve a total CO2 injection capacity of 3,000 metric tons per day or one million tons annually.
- Implement deep subsurface and near-surface MVA of the stored CO2.
- Develop and conduct an integrated community outreach, training, and education initiative.
Illinois Industrial CCS Project (IL-ICCS) Project Objectives

13
Richland Community College • National Sequestration
Education Center • Community Outreach & CCUS Training • New Associate Degree Programs in CCUS
Schlumberger Carbon Services • Seismic Acquisition & Data Processing • Reservoir Modeling • Design & Construction of Storage Facility • Subsurface Operations • Deep MVA CO2 Monitoring
Archer Daniels Midland Company • Project Leader • Overall Project Execution • Facility Owner and Operator • Design & Construction of Surface Facilities • UIC Class VI Permit Holder
Illinois State Geological Survey • Site Characterization • MVA Development • USDW Monitoring • Near-Surface CO2
Monitoring • Outreach and Communication
Leveraging Knowledge and Experience
Illinois Industrial CCS Project (IL-ICCS) Project Team Members

14
Site Characterization
Design and Engineering
Construction
MVA & UIC VI Permit
Commissioning & Operation
2011 2012 2013 2014 2015
Compression & Transmission
100 Mw Substation
Well Construction
Illinois Industrial CCS Project (IL-ICCS) Project Schedule

15
Wet CO2 from Corn-to-Ethanol
Fermentor (P=15, M<3) CO2 Inlet
Separator
Centrifugal Blower
(3000 HP)
CO2
CO2 P=35
36-in Collection
Header
Notes: P = psia M = wt% moisture MTPD = metric tons per day D = depth in feet T = thickness in feet (all values approximate)
Dehydrated CO2 to
4th Stage
CO2 Contactor 3rd Stage
Discharge CO2 P=590
CO2 Sequestration ~7,000 ft. depth in
Mt. Simon Sandstone
New Albany Shale (D=2000, T=120): Tertiary Seal
Primary Source of Drinking Water (D=140)
Pre-Cambrian Granite (D=7200)
Eau Claire Shale (D=5000, T=500): Primary Seal
Mt. Simon Sandstone (D=5500, T=1600): Saline Reservoir
Maquoketa Shale (D=2600, T=200): Secondary Seal
Centrifugal Booster Pump
(400 HP)
Reciprocating Compressors (3250 HP)
4 Stages with Intercoolers
4th Stage Discharge CO2 P=1425
Tri-ethylene Glycol Dehydration Unit
Return Dry Glycol
Water Glycol Regenerator
Supercritical CO2 8-in, 1-mile Pipeline
2500-3000 MTPD M<0.005
Water
Regenerator Reboiler
24-in line 1500-ft
Injection Well P set by permit (estimate < 2300)
St. Peter Sandstone Lower Most USDW (D=4000)
Illinois Industrial CCS Project (IL-ICCS) Project Process Flow Diagram

16
BIG SKY
WESTCARB
SWP
PCOR
MGSC
SECARB
MRCSP
Site Selection Regional Carbon Sequestration Partnerships ICCS project site selection benefitted from the information developed through the Regional Carbon Sequestration Partnership Program.
• Engage regional, state, and local governments • Determine regional sequestration benefits • Baseline region for sources and sinks • Establish monitoring and verification protocols • Address regulatory, environmental, and outreach issues • Validate sequestration technology and infrastructure
Development Phase (2008-2017+) 9 large scale
injections (over 1 million tons each)
Commercial scale understanding
Regulatory, liability, ownership
issues
Validation Phase (2005-2010)
20 injection tests in saline formations, depleted oil, unmineable coal seams, and basalt
Characterization Phase (2003-2005)
Search of potential storage locations and CO2 sources
Found potential for 100’s of years of storage

17
• Cratonic basin • 60,000 square mile area • Structurally complex to the
south with faulting and seismicity
• ADM Decatur facility is located near the center of this geologic formation
• Estimated CO2 storage capacity between 27 to 109 billion metric tons
Site Selection Regional Geologic Characterization

18
• Receiver lines spaced 640 ft. (N-S lines)
• 18,090 point receivers • Source lines spaced
720 ft. (E-W lines) • 2,018 shot points
Site Characterization Seismic Acquisition
• Fold coverage is maximized over injection well location
• 40’-by-40’ bin size (horizontal resolution)
• Q-Land Technology with improved signal-to-noise ratio
• More desirable for acquiring seismic data within industrial settings

19
• Both projects seismic data sets were merged prior to processing
• Improved resolution and clarity
Site Characterization Seismic Processing & Geocellular Model Development • Petrophysical
properties extrapolated from CCS #1 logs
• Extended coverage over both sites
Legacy Data Merged Data
• Large model dimensions (30-by-30 miles) used to minimize boundary effects
• Yielding more usable data within AoR.

20
• Synthetic wavelet constructed from correlation to wellbore log data
• Seismic data inverted to generate petrophysical properties
Site Characterization Seismic Inversion: Formation Density
• 2D Line 101 inverted to generate image of formation density
• Enhances detailed features and allows interpretation of depositional bodies
Top: Eau Claire
Top: Mt Simon
Top: Granite Wash

21
Site Characterization Evaluation of the Decatur Site
produced with Petrel
Channel
Top: Eau Claire
Top: Mt. Simon
Top: Higher porosity zone within the Mt. Simon
• The ADM site has excellent features for CO2 storage
• High purity source of CO2
• Thick permeable formation for storage. Porosity <20% and permeability 26 mD
• Formation depth • Thick seal with no
resolvable faulting • Additional seal
formations • No local penetrations
of the primary seal formation
• Low population density

22
Site Characterization AoR - Maximum Extent of the Plume or Pressure Front
• The delineation of the AoR is based on the Maximum Extent of the Separate-phase Plume or Pressure-front (MESPOP) methodology, as detailed in the relevant US EPA guidance document (USEPA, 2011).
• The pressure front is defined by the differential pressure needed to allow fluid from the injection zone to flow through a hypothetical open conduit into the overlying lowermost USDW (St. Peter Sandstone)
• Site specific data used to determine the MESPOP and was calculated to be 171 psi.
Illustration of pressure front delineation calculation based using the St. Peter Sandstone is as the lowermost USDW.
USEPA Pressure Front Delineation Equation

23
Site Characterization Updating the Site Model – Matching Operational History
• The site model was calibrated using data obtained during the first four (4) months of the IBDP injection period.
• The IBDP injection rate was input into the simulation to calculate the bottom hole pressures and pressures at five different zones at the verification well.
• Reservoir permeability and skin were the main parameters impacting the injection pressure calibration and were used as fitting parameters.
• Once the injection bottom hole pressure was calibrated, simulated pressures at five different zones at the verification well were fine-tuned calibrating the kv/kh ratio of the tight sections and compressibility of the reservoir rock
History Matched Injection Bottom Hole Pressure (BHP) for CCS#1.
History Matched Pressures at Verification Well for CCS#1

24
Site Characterization Updating the Site Model – Matching Operational History
• RST Well Logs helped us estimate the location, saturation, and thickness of the CO2 column around the injection and verification wells.
• This information helped us fine tune the end points of relative permeability curves which dominate the CO2 and brine flow in the reservoir.
• Using the calibrated model, a predictive simulation was run to evaluate plume development and pressure perturbation during the course of the injection.
• The project’s planned injection schedule was used for the 52 year simulation.
Calibrated Reservoir Unit Relative Permeability Curves
Injection Schedule for IBDP (CCS#1) and IL-ICCS (CCS#2) Projects YEAR IBDP (MT/D) IBDP (MT/YR) ICCS (MT/D) ICCS (MT/YR)
1 1,000 333,333
2 1,000 333,333
3 1,000 333,333 2,000 730,000
4
3,000 1,000,000
5
3,000 1,000,000
6
3,000 1,000,000
7
3,000 1,000,000
Total
1,000,000
4,750,000

25
Site Characterization Modeling Plume Extent and Pressure Front
March 2012 (Year 0.3)
26
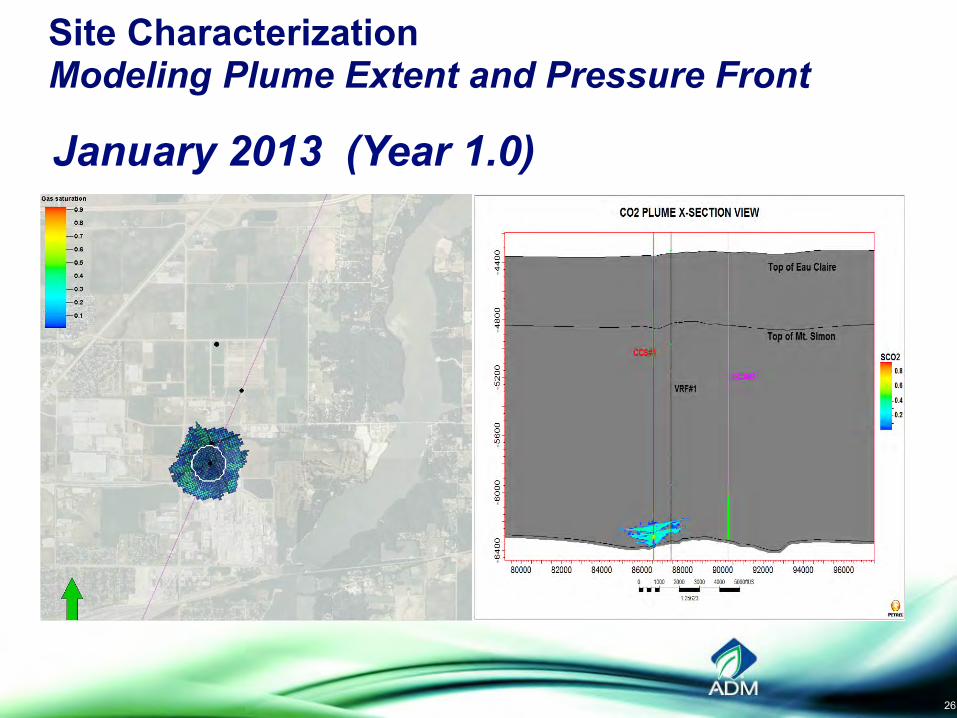
Site Characterization Modeling Plume Extent and Pressure Front
January 2013 (Year 1.0)

27
Site Characterization Modeling Plume Extent and Pressure Front
January 2014 (Year 2.0)

28
Site Characterization Modeling Plume Extent and Pressure Front
January 2015 (Year 3.0)

29
Site Characterization Modeling Plume Extent and Pressure Front
January 2017 (Year 5.0)

30
Site Characterization Modeling Plume Extent and Pressure Front
January 2019 (Year 7.0)

31
Site Characterization Modeling Plume Extent and Pressure Front
January 2020 (Year 8.0)

32
Site Characterization Modeling Plume Extent and Pressure Front
January 2025 (Year 13.0)

33
Site Characterization Modeling Plume Extent and Pressure Front
January 2030 (Year 18.0)

34
Site Characterization Modeling Plume Extent and Pressure Front
January 2062 (Year 50.0)

35
• UIC Class VI permit application submitted on July 25, 2011.
• US EPA Region V issued a notice of completeness on August 26, 2011.
• EPA issued an information request on December 21, 2012.
• The project team sent a response on January 25, 2012.
• The EPA issued a determination that stated the St. Peter Sandstone formation was the lower most USDW.
• The project team submitted revised permit application using new USDW on May 31, 2012.
• OG-7 application for construction of monitoring well submitted June 4, 2012.
1st UIC Class VI Permit Application Reviewed by the US EPA
Site Permitting USEPA: UIC Class VI Permit

36
• Collection, Compression, and Dehydration Facility
• CO2 Transmission System
• 100 MW Electrical Substation
• Electrical Distribution System
• Sequestration Site and Monitoring Facility
• National Sequestration Education Center (NSEC)
NSEC
East
Substation
Compression
Facility
#2 Injection,
Monitoring, &
Geophone Well
#1 Injection,
Monitoring, &
Geophone
Well
Collection
Facility
Engineering Design & Construction Major Capital Elements

37
Engineering Design & Construction Capital Project Approach Plan ADM has a stage-gate project plan that is divided into six stages:
• Concept and Feasibility Stage • Assessment Stage • Development and Design Stage • Construction Stage • Start up and Commissioning
Stage • Final Audit and Closing Stage
Reduce Capital and Technical Risk

38
Engineering Design & Construction Modular Design & 3D Computer Aided Design • Major equipment designed as
modular components on self contained skids using 3D CAD
• Combined modules into single model which allowed integration of the mechanical, structure, civil, & electrical design elements
• 3D model allowed rapid evaluation of changes to the mechanical and structural design elements
• All construction drawings were created from the 3D model allowing for precise shop fabrication of 80% of the mechanical, structural & electrical components.
Reducing Installation Cost

39
Engineering Design & Construction Planning Construction Scheduling and Equipment Installation • Designed enclosures with a
coordinated/staged construction schedule
• Minimized craft interference and accelerated building erection
• Staggered craft work schedule minimized interference
• The enclosure also facilitate construction during winter or periods of inclement weather
• Refurbished existing equipment and a structures to minimize project footprint and costs
• 24 month construction schedule Reducing Installation
Time & Cost

40
Engineering Design & Planning Storage Site: Major Well Schematics
13 CR Casing
Pressure gauge
31 Sensor Array
Packers
Sample Port
Pumping Port
Perfs
Westbay System 7 Zone Monitoring Adapted from the
water industry
Built to Meet Class VI Standards

41
Well Construction Management Storage Site - Lost Circulation Event
• CCS #1 LCM event in the Knox zone conventional LCM were not effective for this zone – Set cement plugs
• MW #1 – bypassed LCM and set cement plugs. 70% cost reduction vs. CCS #1
• Using of 3D seismic and modeling techniques to predict location and severity of lost returns.
• Developed drilling protocol to maximize drill time during LC event (drill thru the formation) and set cement plug.
Loss of mud to the formation

42
Environmental Monitoring (MVA) Conceptual Framework
Near Surface
Soil and Vadose Zone
Aerial Imagery Soil CO2 Flux
Ground Water
Geochemical Sampling
P/T Monitoring
Deep Subsurface
Above Seal
Geophysical Surveys Seismic
Monitoring P Monitoring
Injection Zone
Geophysical Surveys
Geochemical sampling
P/T Monitoring

43
Environmental Monitoring Near Surface Monitoring
• Near infrared aerial imagery will be used to evaluate plant stress
• Soil resistivity characterized shallow depths for identification of optimum GWM locations
• GWM for baseline conditions and operational surveillance
• Surface soil CO2 flux monitoring

44
Environmental Monitoring Deep Subsurface Monitoring
• CCS#2 T/P monitoring • Distributed Temp
Sensor • VM#2 Westbay system • Multi-level sampling
ports reservoir fluid collection and T/P monitoring
• GM#2 has 31 sensor array
• Pressure sensor to monitor above the seal
• Allow offset or walkaway Vertical Seismic Profile (VSP)
• Well logging (RST)

45
ICCS Outreach and Education Building on Current Regional CCS Activities
• Trusted Information Source • Local, Regional, National, and
International Events - Decatur Public Events - AAPG Short Courses - IEA GHG Summer School 2011
• Providing Information - Invited presentations - Technical presentations - Model presentations - Teacher workshops - Coordination with STEM.
• Education Development - STELA Learning Environment - Undergraduate CCUS course
Working with local programs to leverage program dollars.

46
National Sequestration Education Center
• Innovative Educational Spaces
• Academic Curricula • Community & Industry
Workshops • Workforce Training
Activities • Visitor Center • K-12, Community &
Regional Outreach • Sequestration
Training & Learning Array (STELA)
Project Groundbreaking Ceremony: August 24, 2011

47
Richland Community College Richland is developing two new degree programs with an emphasis on CCUS: • Associate of Applied Science Engineering Technology- Sequestration Specialty (Starts in fall 2012) • Associate of Science -
Sequestration Concentration Several universities in Illinois have already reviewed and accepted Richland CCUS courses as electives in their degree program(s). This recognition allows the students obtaining their 2-year degree from Richland to receive credits for the CCUS courses when they transfer to a 4-year degree program at these universities.
List of Participants:National Energy Technology Laboratory/U.S. DOE
Archer Daniels Midland CompanySchlumberger Carbon Services Corp.
Illinois State Geological Survey/University of IllinoisRichland Community College

48
Environmental and Cost Benefits GHG Reduction & Fuel LCA
• Significant CO2 site emission reductions.
• Injected CO2 has a reduction of 94% GHG emissions based on using Midwest electricity (coal).
• CCS will significantly reduce the carbon footprint of fuel ethanol.
• The operational expense is significantly lower than post combustion capture.
• 15 billion gallons annually, represents about 40 million metric tons of CO2.

49
Estimated Jobs Creation & Retention
0
10
20
30
40
50
60
Oct
-10
De
c-1
0
Feb
-11
Ap
r-1
1
Jun
-11
Au
g-1
1
Oct
-11
De
c-1
1
Feb
-12
Ap
r-1
2
Jun
-12
Au
g-1
2
Oct
-12
De
c-1
2
Feb
-13
Ap
r-1
3
Jun
-13
Au
g-1
3
Oct
-13
De
c-1
3
Feb
-14
Ap
r-1
4
Jun
-14
Au
g-1
4
Oct
-14
De
c-1
4
Feb
-15
Ap
r-1
5
Jun
-15
Au
g-1
5
• 900+ Jobs • 400+ Local Jobs
• 6-8 Permanent Jobs • Professional and Construction Trades

50
$0.0
$0.2
$0.4
$0.6
$0.8
$1.0
$1.2
$1.4O
ct-1
0
De
c-1
0
Feb
-11
Ap
r-1
1
Jun
-11
Au
g-1
1
Oct
-11
De
c-1
1
Feb
-12
Ap
r-1
2
Jun
-12
Au
g-1
2
Oct
-12
De
c-1
2
Feb
-13
Ap
r-1
3
Jun
-13
Au
g-1
3
Oct
-13
De
c-1
3
Feb
-14
Ap
r-1
4
Jun
-14
Au
g-1
4
Oct
-14
De
c-1
4
Feb
-15
Ap
r-1
5
Jun
-15
Au
g-1
5
Local Area Businesses
Estimated from Consumer Spending: US Labor Dept, Bureau of Statistics, April 2009.

51
Future Commercial Potential •Enhanced Oil Recovery •Product Development
•CO2 Liquids •Carbonates •Fertilizer
•Process Development •SC Extraction •Solvent Applications
•Carbon Management •Storage •Trading & Risk Management
•Illinois Basin - Oil Producing Region •Est. Recoverable Oil = 700 million bbls(1)
•Est. CO2 Requirements = 150 million tons
(1) BASIN ORIENTED STRATEGIES FOR CO2 ENHANCED OIL RECOVERY: ILLINOIS AND MICHIGAN BASIN OF ILLINOIS, INDIANA, KENTUCKY AND MICHIGAN; Advanced Resources International, February 2006
ADM Plants 10,000 TPD

52
Project Construction Progress Photographs

53
Project Construction Progress Photographs

54
Project Construction Progress Photographs

55
IL-ICCS: Project Benefits Review Public Benefits • Recovery Act funding creating jobs for economic recovery • Mitigating risks for the industry to demonstrate the largest integrated,
saline storage project in the U.S. • Community Outreach - CCUS technologies • Collected CO2 is produced from biologic fermentation, a significant
feature of the Illinois ICCS project is its “negative carbon footprint.” • Validate the Mt. Simon Sandstone saline reservoir site for commercial-
scale, long-term geologic storage of CO2. Collect crucial scientific and engineering data in advance of carbon capture requirements
Project Outcomes • Demonstrates cost advantages/economic viability of CCS at ethanol
plants • Facilitates exploration of long-term CO2 utilization options- EOR Illinois
Basin Develops a market for utilization of U.S. geologic saline storage capacity that ranges from 1,700 to 20,000 billion metric tons
(2010 Carbon Sequestration Atlas, NETL)

56
Thank You! Industrial Carbon Capture and Storage Project: • U.S. Department of Energy Award No. DE-FE-0001547 • Administered by the DOE’s Office of Fossil Energy • Managed by the National Energy Technology Laboratory • DOE cost share from American Recovery and Reinvestment Act of 2009
Cost Share Agreements: • Archer Daniels Midland Company • University of Illinois through the Illinois State Geological Survey • Schlumberger Carbon Services • Richland Community College
Project Team Members Contacts: • Dr. Sai Gollakota (NETL-DoE) [email protected] • Dr. Robert Finley, (ISGS) [email protected] • Eric Berlin, (Schlumberger Carbon Services) [email protected] • Dr. Douglas Brauer (RCC) [email protected] (Disclaimer: Reference herein to any specific commercial product, process, or service by trade name, trademark, manufacturer, or otherwise does not necessarily constitute or imply its endorsement, recommendation, or favoring by the United States Government or any agency thereof. Neither the United States Government nor any agency thereof, nor any of their employees, makes any warranty, express or implied, or assumes any legal liability or responsibility for the accuracy, completeness, or usefulness of any information, apparatus, product, or process disclosed, or represents that its use would not infringe privately owned rights. The views and opinions of authors expressed herein do not necessarily state or reflect those of the United States Government or any agency thereof.)