Embed Size (px)
Citation preview

HILL I NO SUNIVERSITY OF ILLINOIS AT URBANA-CHAMPAIGN
PRODUCTION NOTE
University of Illinois atUrbana-Champaign Library
Large-scale Digitization Project, 2007.


Piping and Pick-up Factors for
Automatically Fired One-Pipe
Hot-Water and Steam Systems
by
Warren S. Harris
PROFESSOR OF MECHANICAL ENGINEERING
Chien Fan
RESEARCH ASSISTANT IN MECHANICAL ENGINEERING
ENGINEERING EXPERIMENT STATION BULLETIN NO. 455

ACKNOWLEDGMENTS
These investigations have been carried on as projects of the De-partment of Mechanical Engineering. Acknowledgment is herebymade to Mr. R. R. Laschober, former Research Assistant in Mechan-ical Engineering, who analyzed the data from the 1950-51 hot-watertests and prepared the first report, "Piping and Pick-Up Factors forAutomatically Fired Boilers," Proceedings of the Engineering Confer-ence of Steam and Water Heating and Summer Cooling, Universityof Illinois Department of Mechanical Engineering, May 1956. Ac-knowledgment is also made to Messrs. C. Fan and N. B. Migdal forassistance in the experimental program, and to the various manufac-turers who cooperated by furnishing materials and equipment usedin this investigation.
@ 1959 BY THE BOARD OF TRUSTEES OF THE
UNIVERSITY OF ILLINOIS
UNIVERSI1TYOF ILLINOISII PRESS I
1550-8-59-68528

SUMMARY
In designing hydronic* systems, it is commonpractice to select a boiler with a gross outputlarger than the load to be connected to it. This isto ensure sufficient boiler capacity to take care ofthe piping loss of the system and to bring the sys-tem up to its maximum output in a reasonabletime after a period of idleness. The ratio of thegross boiler output to the total connected load iscalled the piping and pick-up factor. The factorsused in past years for automatically fired boilershave ranged from about 1.25 to as high as 1.56.In the interest of economical installations, it isdesirable to use as low a piping and pick-up factoras possible consistent with proper performance ofthe system.
This investigation was undertaken to supplydata on the effect of the size of the piping andpick-up factor on the performance of hydronicsystems and to provide a logical basis for deter-mining the minimum usable piping and pick-upfactor.
A common method of operation requiring anadequate piping and pick-up factor is that ofoperating with reduced room-air temperature atnight. The smaller the factor used, the longer thetime required for the system to raise the housetemperature to normal from the reduced tempera-ture. Therefore, the length of the warm-up periodwas used as the criterion for the adequacy of thepiping and pick-up factor.
A room air temperature of approximately 72 Ffrom 5:30 a.m. to 10:00 p.m. and 66 F from 10:00p.m. to 5:30 a.m. was maintained. The time re-quired to raise the house temperature from 66 F to72 F was observed each day and related to the out-door temperature and the piping and pick-up factor.The size of the load was determined by the amountof radiation installed in the house. The gross out-put of the boiler was changed by changing the gasburning rate. Three gas burning rates, resultingin three piping and pick-up factors which rangedfrom about 0.9 to 1.6, were used for each systemtested. Tests were made on a one-pipe steam sys-tem, and two forced circulation, one-pipe, hot-water systems.
From the results of these tests, it was concluded:
* "Hydronic system" is a term used in the heating industry as asubstitute for "steam and hot-water heating systems."
(1) The same piping and pick-up factor maybe used for both steam and hot-water heating sys-tems which are automatically fired.
(2) A piping and pick-up factor as low as 1.1may be used for selecting the boiler for a systemdesigned to maintain room-air temperature at aconstant value at all times; however, this low afactor will not provide sufficient reserve for opera-tion with reduced room-air temperature at night.
(3) A piping and pick-up factor of 1.3 is ade-quate for the successful operation of automaticallyfired steam or hot-water residential heating sys-tems.
The following is a summary of test results:When the outdoor temperature was near the
design temperature, the method of operation had nomeasurable effect on the length of the warm-upperiod.
For each piping and pick-up factor the rate ofwarming the room air when operating at designindoor-outdoor temperature difference was the sameregardless of the type or size of the system.
At a piping and pick-up factor of approxi-mately 1.1 the heating capacities of the systemswere not sufficient to raise the room-air tempera-ture at the end of a night setback period to thenormal daytime value.
As the piping and pick-up factor was reducedbelow 1.3 there was a marked increase in thelength of the warm-up time. On the other hand,the decrease in warm-up time was relatively smallas the piping and pick-up factor was increasedabove 1.3.
Oversizing both the boiler and radiation in thehot-water system by 12% reduced the length ofthe warm-up time by as much as 50%. Oversizingthe boiler only (use of large piping and pick-upfactor) resulted in only a slight reduction in thelength of the warm-up time.
Due to the small heat storage capacity of asteam system, the rate at which the room-air tem-perature decreased at the start of a night setbackperiod was about 40% greater when the steamsystem was being used than when using the hot-water system.
Normal daytime temperatures were attained atleast an hour before the time the thermostat wassatisfied, and, due to radiation from the warmer

than normal ceilings during the warm-up period,the house felt comfortably warm even before theroom-air temperature attained normal.
The average overrun in the living room-airtemperature was approximately 2 F when the hot-water system was being used and about 1 F whenusing the steam system.
Neither oversizing the system nor increasing thepiping and pick-up factor decreased the daily fuelconsumption. On the contrary, they probably re-sulted in some increase.
The heat output from the hot-water system tothe rooms began to increase as soon as the burnerstarted to operate. However, the rate of increasewas comparatively slow and about 4 hours wererequired to raise the output of the system to itsmaximum value for any of the three piping andpick-up factors used in these tests. The maximumoutput of the water system increased as the pipingand pick-up factor was increased up to a factor ofabout 1.3. When a higher piping and pick-up factorwas used, the high limit control prevented furtherincrease in the water temperature and thus limitedthe maximum heat output of the system.
The heating-up characteristics of the steamsystem were quite different. Until the water tem-perature in the boiler had reached the boiling pointand at least part of the air was expelled, there wasno useful heat output. The length of time required
to do this was dependent upon the water tempera-ture at the time the burner started to operate andthe rate of heat input to the boiler. In the threewarm-up tests reported in this bulletin approxi-mately 5 minutes were required to start boiling.It took an average of another 12 to 17 minutes forsteam to reach the radiators. The time requiredto free the system of air, fill the system with steam,and thus obtain the maximum heat output from thesystem depended upon the piping and pick-upfactor used, but even at the lowest piping andpick-up factor this was accomplished in an averagetime of about 90 minutes as compared to about4 hours for the hot-water system.
Since the steam temperature could vary onlybetween 212 F and about 220 F, the maximumoutput of the system was practically independentof the piping and pick-up factor used as long asthe firing rate was sufficient to generate steam asfast as it was being condensed in the radiatorsand piping.
The normal operating cycle of the steam systemwas too short to obtain complete venting of thesystem and, therefore, uniformity of heating thedifferent rooms was dependent upon the ventingrate of the valves on the radiators. If for anyreason the venting rate of one or more of thesevalves should change with respect to the others,the balance of the system may be destroyed.

CONTENTS
I. INTRODUCTION 71. Preliminary Statement 72. Objects of Investigation 7
II. DESCRIPTION OF EQUIPMENT 83. 1=B=R Research Home 84. Heating Systems 85. Controls 126. Testing Apparatus 12
III. METHOD AND PROCEDURE OF TESTING 137. General Method 138. Hot-Water Tests 139. Steam Tests 13
10. Special Tests 14
IV. BOILER OUTPUT AND RATE OF WARM-UP 1511. Effect of Indirect Water Heater Operation on Length of
Warm-up Period 1512. Effect of Burning Rate on Gross Output and Piping and
Pick-up Factor 1513. Effect of Percent of Design Indoor-Outdoor Temperature
Difference on Warm-up Rate 1614. Effect of Piping and Pick-up Factor on Warm-up Time 1715. Effects of Outdoor Temperature and System Size on
Warm-up Time 18
V. ROOM-AIR TEMPERATURES 1916. Average Room-Air Temperature During Setback Period 1917. Average Room-Air Temperature Following Warm-up Period 2018. Average Room-Air Temperature During Normal Daytime
Operation 21
VI. FUEL CONSUMPTION 2219. Daily Fuel Consumption 22
VII. SYSTEM WARM-UP TESTS 2420. Method of Testing 2421. Rate of Water Temperature Rise - Hot-Water System 2422. Temperature of Steam Leaving and Condensate Returning
to Boiler -Steam System 2423. Boiler Pressure - Steam System 2524. Time Required to Generate Steam and Distribute It to
Radiation - Steam System 2525. System Warm-up Characteristics - Steam vs. Water 26
VIII. REFERENCES 27

FIGURES
1. I =B=R Research Home 82. 1950-51 Hot-Water System 93. 1956-57 Hot-Water System 94. 1957-58 Steam System 105. Piping Systems (1950-51 Water, 1957-58 Steam) 116. Control Arrangements (Hot-Water and Steam Systems) 127. Effect of Operating Conditions on Length of Warm-up Period 158. Gross Outputs of Boiler and Piping and Pick-up Factors 159. Effect of Indoor-Outdoor Temperature Difference on the
Warm-up Rate 1610. Effect of Piping and Pick-up Factor on the Warm-up Rate 1711. Room-Air Temperature During Setback Period 1912. Room-Air Temperature at End of Warm-up Period 2013. Average Daily Gas Consumption 2214. Effect of Burning Rate on the Boiler Water Temperature
(Hot-Water System) 25
TABLES
1. Data on I=B=R Research Home and Heating Systems 82. Operating Conditions - Hot-Water Tests 133. Effects of Outdoor Temperature and System Size
on Length of Warm-up Time 184. Room Air Temperatures at End of Warm-up Period 215. Room Air Temperatures - Normal Daytime Operation 216. Rate of Heating of Radiators - Steam System 26

I. INTRODUCTION1. Preliminary Statement
This is the sixteenth publication prepared undera cooperative agreement between the Institute ofBoiler and Radiator Manufacturers and the Uni-versity of Illinois. Under the terms of this agree-ment the Institute is represented by a ResearchCommittee consisting of eight members. This com-mittee, working with the Engineering ExperimentStation staff assigned to the I=B=R researchproject, develops the research program consideredto be of greatest interest to the manufacturers,installers, and users of steam and hot-water heatingequipment. The Institute provides funds for de-fraying the major portion of the expense of thisresearch.
In designing hot-water or steam systems, it iscommon practice to select a boiler with a grossoutput in excess of the actual load to be connectedto the boiler. This is to ensure that the boiler willhave sufficient capacity to take care of the pipingloss of the system and to bring the system up to itsmaximum output within a reasonable time follow-ing a period of idleness. The ratio of the grossboiler output to the total connected load is calledthe piping and pick-up factor. The piping and
pick-up factors used in past years for automaticallyfired boilers have ranged from about 1.25 to ashigh as 1.56. In the interest of economical installa-tion, it is desirable to use as low a factor as pos-sible consistent with proper performance of thesystem.
This investigation was undertaken to supplydata concerning the effect of the size of the pipingand pick-up factor on the performance of hot-waterand steam heating systems and to provide a logicalbasis for determining the minimum piping andpick-up factor which should be used.
The experimental work on hot-water systemswas done in the I=B=R Research Home duringthe winters of 1950-51 and 1956-57. Investigationson the steam system were made during the winterof 1957-58.
2. Objects of Investigation
The tests herein reported were undertaken pri-marily to determine the minimum practical pipingand pick-up factor for automatically fired, one-pipe, hot-water and steam systems. Other objec-tives were to compare the operating characteristicsof one-pipe steam and hot-water systems whenoperating under actual use conditions.

II. DESCRIPTION OF EQUIPMENT3. I=B=R Research Home
The Research Home, shown in Figs. 1 through
4, and described in detail in earlier reports ( 1, 2
) *
was a two-story building typical of the small, well-built American home of 1940. The construction was
brick veneer on wood frame. All of the outsidewalls and the second-story ceiling were insulated
with mineral wool batts 3/8 in. thick. A vaporbarrier between the plaster base and the insulationprevented condensation on the sheathing by re-tarding the passage of water vapor from the roomsinto the insulation in the walls. The calculatedcoefficient of heat transmission, U, for the wall sec-tion was 0.074 Btu per sq ft per hr (F) temperaturedifference. All windows and the two outside doors
were weatherstripped. Two storm doors were used.
The total calculated heat loss for the house, ex-cluding the basement, was 43,370 Btuh at designtemperatures of -10 F outdoors and 70 F indoors.A summary of room volumes and calculated heatlosses is given in Table 1.
* Superscripts in parentheses refer to entries in the References.
4. Heating Systems
1950-51 Hot-Water System: A gas fired, one-pipe forced circulation, hot-water system, designedin accordance with I=B=R Installation Guide No.5, was used in the Research Home during the
Fig. I. 1=B=R Research Home
Rooms I
Living Room 2Dining Room I:Kitchen 1ILavatoryVestibuleVest. ClosetTotal, First Floor
NE Bedroom 1NW Bedroom 1SW Bedroom 1;BathroomStairwayClosetsTotal, Second Floor
Total, First andSecond Floors
Data on I
Dimensions Heated Calc.Space, HeatCu Ft Loss,
Btuha
4'0" x 13'4"3'1" x 11'3"0'5" x 11'3"7'0" x 2'8"7'5" x 5'4"
0'7" x 9'9"0'6" x 13'4"3'0" x 11'4"6'6" x 7'6"
57498742319914844848
24022
43934944525026062155
19348
Table 1
=B=R Research Home and Heating Systems
1950-51 Hot-Water System
INSTALLED RADIATION
No. Quantity Output,of Btuh
Units
First Floor Ceiling Height 8'3"1 11 ft RC
b 5335
1 111 ft RCb
53351 10 Sect STe 33601 8 Sect STe 26881 14 Sect ST° 4704
5 21422
Second Floor Ceiling Height 7'9"2 9 ft RCb 43652 10 ft RCb 48502 10 ft RCb 48501 8 Sect ST" 26881 6 Sect ST" 2015
8 18768
9393 43370 13 51 ft and 40190d46 Sect
1956-57 Hot-Water System
INSTALLED RADIATION
No. Quantity Output,of Btuh
Units
13 ft RCb
13 ft RCb
11 Sect STc
9 Sect STo16 Sect STe
10 ft RCb12 ft RC'b11 ft RCb9 Sect ST°7 Sect ST'
63056305369630255376
24707
48505820533530252353
21383
13 59 ft and 46090-52 Sect
1957-58 Steam SystemINSTALLEDRADIATION
(23" 3 Tube, Large Tube)No. No. Output,of of Btuh
Units Sect.
624067203360
9603840
21120
43205280528024001440
18720
11 83 3 9 840'
a No storm sash. Outdoor temperature = -10 F, indoor temperature = 70 F. Infiltration based on crackage.b 7 in. RC radiant baseboard.C
19 in. 4 tube, small tube.d Equivalent to a design temperature difference of 740 or a design O.D.T. of -4 F.. Equivalent to a design temperature of 850 or a design O.D.T. of -15 F.f Equivalent to a design temperature difference of 73.5 F or a design O.D.T. of -3.5 F.

Bul. 455. PIPING AND PICK-UP FACTORS--HOT-WATER AND STEAM SYSTEMS
Celihng heights; First floor 8-3", Second floor 7'9"
Legend
I /9" Small tube radiator (4 tubes)- 7" RC radiant baseboard
N
Fig. 2. 1950-51 Hot-Water System
Ceiling heights; First floor 8'-3", Second f/oor 7'9"
N
Fig. 3. 1956-57 Hot-Water System
Legend
Si/9" Small lube radiator (4 tubes)7" RC radiant baseboard

ILLINOIS ENGINEERING EXPERIMENT STATION
Ceiling heights; First floor 8-3", Second floor 7'-9"
N
1950-51 heating season. The capacity of the in-stalled radiation was equal to 40,190 Btuh at adesign water temperature of 215 F. This capacity
was equivalent to the calculated heat loss of thehouse at an indoor-outdoor temperature difference
of 74 F or to a design outdoor temperature of -4 F
and a design indoor temperature of 70 F. The
radiation consisted of five units of 19-in. 4 tube,small tube radiators, totalling 46 sections, and eight
units of 7-in. type RC radiant baseboard'totalling51 ft in length. The arrangement of the radiationand piping system is shown in Figs. 2 and 5 andin Table 1.
A wet bottom, cast iron boiler composed of two6-in. sections and one 4-in. section was used in thetests. This boiler was insulated on top, sides andback with an air cell insulation approximately1 in. thick and was completely enclosed in anenameled sheet metal jacket. All cracks betweensections were sealed with asbestos cement. Theboiler was equipped with a conversion type gasburner. The net I=B=R rating of the boiler was55,000 Btuh, the gross I=B=R output was 84,000Btuh; however, during the tests reported here
several different firing rates were used to obtain
different gross outputs.1956-57 Hot-Water System: The hot-water sys-
tem used during the 1956-57 heating season was the
same as that used during 1950-51 except that the
installed radiation was increased by about 12/%,
equivalent to using a design indoor-outdoor tem-
perature difference of 85 F. The amount of radia-
tion installed in each room is shown in Table 1.
1957-58 Steam System: A gas fired, one-pipe
steam heating system was used in the Research
Home for all tests made during the 1957-58 heatingseason. The capacity of the installed radiation(Table 1) was equivalent to the calculated heatloss of the house at an indoor-outdoor temperaturedifference of 73.5 F. The radiation consisted of23-in. 3 tube, large tube radiators set under win-dows. All radiator venting valves and the mainvent valves were of the non-vacuum type. Theventing rates of the valves were adjustable. Thesizes and locations of the radiators are indicatedin Table 1 and on the floor plans of the house inFig. 4. The piping system is shown in Fig. 5.
A dry base, 4-section, cast iron steam boiler
Legend
S23" Large tube radiator (3 lubes)
Fig. 4. 1957-58 Steam System

Bul.455. PIPING AND PICK-UP FACTORS- HOT-WATER AND STEAM SYSTEMS
(a) One-pipe hot- water system (1950-5/ and /956-57)
(b) One-pipe steam system (1957-58)
Fig. 5. Piping Systems (1950-51 Water, 1957-58 Steam)
artford loop boiler connec/ions

ILLINOIS ENGINEERING EXPERIMENT STATION
(0) Hot water tests
Room (Nthermosat - -
Heating
off
'mne
- -<<^ - r~- -Transformer j I
Gaos valve A Automatic poiot
(b) Steam test
Fig. 6. Control Arrangements (Hot-Water and Steam Systems)
designed for gas firing was used in the tests. Theboiler was insulated on the top, sides, front andback with glass wool insulation approximately 1 in.thick and was completely enclosed in an enameledsheet metal jacket. The net I=B=R rating was40,000 Btuh, but, as was the case with the hot-water boiler, several gas burning rates were usedto obtain a range of gross outputs.
5. Controls
The same basic control arrangement was usedin all three heating systems. The room thermostat,located at the 30-in. level in the living room, wasof the heat-anticipating type and turned the gasburner on and off according to the heat require-ments of the room. On the hot-water system theroom thermostat also controlled the operation ofthe circulator. The safety control consisted of animmersion thermostat set to stop the burner, but
not the circulator, when the temperature of thewater in the boiler exceeded 225 F. The burnerwould re-start when the water temperature droppedto about 185 F.
The safety controls on the steam system con-sisted of a low water cut-off, set to turn off theburner at any time the water level in the boilerdropped 5 in. below normal, and a steam pressurecontrol, set to stop the burner when the steampressure attained 2.5 lb per sq in. gage.
Both the steam and water boilers were equippedwith safety valves set to open at the maximumallowable working pressure for the system. Sche-matic diagrams of the control arrangements areshown in Fig. 6.
6. Testing Apparatus
Instrumentation in the Research Home has beendescribed in detail in an earlier report. 1) It sufficeshere to say that thermocouples for the measurementof room-air and basement-air temperatures wereinstalled at levels of 3 in., 30 in., and 60 in. abovethe floor as well as 3 in. below the ceiling. Otherthermocouples were used to measure the tempera-ture of the water or steam leaving the boiler andthe temperature of the water returning to theboiler. A differential pressure recorder attached toan elbow meter,m3 ) calibrated in place, supplied acontinuous record of the rate of water circulationthrough the boiler for all tests with the hot-watersystem.
Recording thermometers were used to makecontinuous records of the air temperatures in eachof the six rooms and the attic space at 3 and 30 in.above the floor and 3 in. below the ceiling. Similarthermometers recorded the temperature of the out-door air and the temperature of the flue gases atthe flue outlet of the boiler. The CO, content ofthe flue gas was obtained by use of an Orsat appa-ratus, and the fuel consumption was measured bya dry test meter. The moisture content of the airwas measured by four humidity indicators and onehygrometer. A thermocouple-type surface pyrom-eter was used to measure the temperature ofradiator surfaces during special studies.

III. METHOD AND PROCEDURE OF TESTING7. General Method
Operating a heating system with reduced tem-perature at night is one of the more commonmethods of operation requiring an adequate pipingand pick-up factor. The smaller the factor used,the longer the time required for the system to raisethe house temperature to normal following a periodof operation with reduced temperature. Hence, thelength of this warm-up period was used as thecriterion for the adequacy of the piping and pick-upfactor.
The thermostat was set to maintain a room-airtemperature of approximately 72 F from 5:30 a.m.to 10:00 p.m. and 66 F from 10:00 p.m. to 5:30 a.m.The time required to raise the house temperaturefrom 66 F to 72 F was observed each day andrelated to the outdoor temperature and the pipingand pick-up factor.
By definition, the piping and pick-up factor isthe ratio of the gross output of the boiler to the
connected load. The size of the connected loadwas determined by the amount of radiation in-stalled in the house. Different gross outputs of the
boiler were obtained by the use of different burningrates. Three gas burning rates, resulting in three
piping and pick-up factors, were used for each
system tested. These factors ranged from about
0.9 to 1.6. The fuel used in all tests was natural
gas supplied by the Texas-Oklahoma pipe line.
The heating value of the gas was 1000 Btu per
cu ft.At all times during the tests the doors between
rooms were open, and the windows were closed.
Observations of room-air temperature as deter-
mined by the thermocouples located 3, 30 and 60 in.
above the floor and 3 in. below the ceiling were
recorded at 7:30 a.m., 11:00 a.m., 4:00 p.m. and
10:30 p.m. The temperature of the air in the base-ment and in the attic and the relative humidity in
the heated portions of the house were also observed
at these times. Complete daily records were made
of the operating time, the number of cycles of the
gas burner, the power consumption of the circulator
Table 2
Operating Conditions - Hot-Water Tests
Test HighSeries Limit
Con-trolSet-
ting,F
B-50 225
C-50 225F-50 225G-50 225H-50 225A-56 225
B-56 225
C-56 225
I-50 225J-50 225K-50 225N-50 225
Flow WaterControl HeaterValve Opera-
tion
Used
UsedNot UsedNot UsedNot UsedUsed
Used
Used
UsedUsedUsedUsed
75 galserv.
StandbyDrainedDrainedDrainedStandby,
DrainedStandby,
DrainedStandby,Drained
Standby75 galStandbyDrained
Thermo-stat
Setting,F
72-66
72-6672-6672-6672-6672-66
72-66
72-66
72-6672-6672-66
72
In- Gasstalled Burn-Radia- ingtion, Rate,Btuh cfh
40,190
40,19040,19040,19040,19046,090
46,090
46,090
40,19040,19040,19040,190
and the cubic feet of gas consumed. Recordinginstruments were used to obtain a continuousrecord of the temperature of the water returning tothe boiler and the temperature of the water orsteam at the boiler outlet.
8. Hot-Water Tests
The operating conditions employed in tests onthe hot-water heating systems are shown in Table2. For each operating condition the gross output ofthe boiler was obtained by multiplying the rate ofwater circulation through the boiler in pounds perhour by the temperature rise in degrees F. As acheck on this calculation, the gross output was alsoobtained by multiplying the heat input rate to theboiler by the efficiency of operation. The efficiencyof operation was obtained from readings of thetemperature and carbon dioxide content of the fluegas. The total heat input rate was equal to the rateof gas burning in cfh multiplied by the heat con-tent of the gas in Btu per cubic foot.
The piping and pick-up factors were obtainedby dividing the gross output of the boiler by theconnected load, both expressed in Btuh.
9. Steam Tests
In testing the steam system, the initial stepswere to establish a uniform rate of heating rooms

ILLINOIS ENGINEERING EXPERIMENT STATION
by adjusting the venting rates of the radiator ventvalves. After the room-air temperature had beenbalanced, the room thermostat was set at 72 F from5:30 a.m. to 10:00 p.m. and at 66 F from 10:00 p.m.to 5:30 a.m. Three series of tests were conductedunder these conditions: Series E-57 with a gasburning rate of 85 cfh; Series F-57 with a burningrate of 65 cfh; and Series G-57 with a burningrate of 70 cfh.
For each series of tests, the measured flue gastemperature and the CO 2 content of the flue gasdetermined the boiler efficiency. This efficiency,
multiplied by the heat input rate, gave the grossoutput of the boiler. As before, the piping andpick-up factor was obtained by dividing the grossoutput of the boiler by the installed radiation.
10. Special Tests
Some special tests were made to determine therate of heating when starting with the entire systemcold. Operating conditions and test methods usedfor these tests are described along with the discus-sion of results.

IV. BOILER OUTPUT AND RATE OF WARM-UP11. Effect of Indirect Water Heater Operation on
Length of Warm-up Period
Preliminary tests were made at the start of thehot-water studies to determine the effect of theoperation of an indirect water heater on the lengthof the warm-up period. The three conditions con-sidered were: operation with the low limit controland with no water heater in use; operation with thewater heater attached but no hot water used; andoperation with a daily hot-water consumption of75 gal. A summary of all operating conditions isgiven in Table 2. Figure 7 shows the warm-up timeplotted against the outdoor temperature during thewarm-up period for Series G-50, J-50 and 1-50.These tests were made with a firing rate of 70 cfh,the lowest used with this heating system. The ca-pacity of the installed radiation was equivalent tothe calculated heat loss of the house at 70 F and-4 F indoor and outdoor temperatures, respec-
700
600
500
400n
<-00
1-300•3o§
/OO
S9
t Thermostat setting reduced at night.
Incomplete High limit control setting = 225F.
recovery - -A Series G-50 Low limit controloff. House heating only.
-- Series 1-50 Low limit controlsetting = 185F. Stand-byoperation of water heater.
-- Series J-50 Low limit controlsetting= 185 F. 75 gal hotwater used daily.
'S
-S0
0/ 20 30 40 50Average outdoor temp during warm-up, deg F
Fig. 7. Effect of Operating Conditions on Lengthof Warm-up Period
tively. It can be seen that when the outdoor tem-perature was near the design temperature, themethod of operation had no measurable effect onthe length of the warm-up period. In mild weather,operation with no water heater attached to theboiler resulted in the longest warm-up time. Whilethe curves are not shown for Series B-50, C-50 andF-50, in which the firing rate was increased to 100cfh, these three series of tests confirmed the resultsshown in Fig. 7.
The piping and pick-up factor is most criticalwhen the system is operating at or near designconditions. This being the case, these preliminarytests indicated that the method of operation shouldhave no effect on the results of the tests; how-ever, practically all subsequent tests to determinethe minimum piping and pick-up factor were madeby operating the boiler with no low limit controland without an indirect water heater attached.
12. Effect of Burning Rate on Gross Output andPiping and Pick-up Factor
The curves of Fig. 8 show the effect of burningrate on the piping and pick-up factor and the grossboiler output. It can be observed that as the firing
009
9bg-
I-00,
0.
60 80 /00 120 /40Heat input rate, /000 Btu per hr
Fig. 8. Gross Outputs of Boiler and Piping and Pick-up Factors
YeaI S;ystm ,1,, I
pick-up output Year System radiation
A A 1950-51 Water 40,190 Btuh0 * 1956-57 Water 46,090 Btuha . 1957-.5 .Stpnm .39. R40 Rfh1975 S m 4
dr I
- ____AI----- I ~I/-I__
?
I-
r

ILLINOIS ENGINEERING EXPERIMENT STATION
r0
0
i
Q.
//0 /00 90 80 70
Indoor-outdoor temp difference
Fig. 9. Effect of Indoor-Outdoor Tem
rate increased, the boiler output increased, and,consequently, the piping and pick-up factor in-creased. Thus, the three firing rates used for eachheating system represented three boiler outputs andthree piping and pick-up factors. The latter werethe ratios of gross boiler outputs to the installedradiation, both expressed in Btuh.
13. Effect of Percent of Design Indoor-OutdoorTemperature Difference on Warm-up Rate
Relating the length of the warm-up period tothe average outdoor temperature and fuel burningrate, as was done in Fig. 7, was found to be unsat-isfactory when trying to compare the different sys-tems as, from test to test, there was some variationin the number of degrees the room-air temperaturewas raised. Furthermore since the amount of in-stalled radiation differed in each system, a givenfiring rate did not result in the same piping andpick-up factor for all three systems.
To place all data on a common basis, the aver-age rate of warming the room air in degrees F per
60 50 40 30 20in per cent of design temp difference
peroture Difference on the Worm-up Rate
hour was correlated with the observed indoor-outdoor temperature difference during the test, ex-pressed in percent of the design temperature differ-ence, and with the piping and pick-up factor. Thedesign temperature difference was taken as that atwhich the calculated heat loss of the house wouldbe equal to the capacity of the installed radiation.The observed indoor-outdoor temperature differencewas assumed equal to the difference between theaverage daytime indoor air temperature and the av-erage outdoor air temperature during the warm-upperiod. (1,
4) The piping and pick-up factor was ob-tained from the heat input rate during the test andFig. 8.
Figure 9 is a plot of all test data using themethod just described. These curves show the obvi-ous fact that for any piping and pick-up factor therate of warm-up decreases as the indoor-outdoortemperature difference increases, and at any givenindoor-outdoor temperature difference, the rate ofwarm-up increases as the piping and pick-up factoris increased. It appeared that the indoor-outdoor
I

Bul.455. PIPING AND PICK-UP FACTORS -HOT-WATER AND STEAM SYSTEMS
Piping and
Fig. 10. Effect of Piping and P
temperature difference had a greater effect on thewarm-up rate when using the steam system thanwhen using the hot-water system. Also, as the sizeof the hot-water system was increased, the effect ofthe indoor-outdoor temperature difference on thewarm-up rate became more pronounced.
14. Effect of Piping and Pick-up Factor onWarm-up Time
The warm-up rate at the design indoor-outdoortemperature difference is most important, since theboiler size must be adequate to ensure satisfactoryoperation at these conditions. The lower group ofcurves in Fig. 10 shows the relationship between thewarm-up rate and the piping and pick-up factor foreach of the three systems when operated at designconditions. These curves were derived directly fromthose in Fig. 9.
For each piping and pick-up factor, the rate ofwarming up the room air when operating at designindoor-outdoor temperature difference was essen-tially the same regardless of the type or size of thesystem. At a piping and pick-up factor of approxi-mately 1.1, the heating capacity of the system wasnot sufficient to raise the room-air temperature atthe end of a night setback period. Thus a factor of1.1 might be used on a system where the room-air
pic
ick-u
k-up factor
'p Factor on the Warm-up Rate
temperature was to be maintained at a constantvalue at all times, but it would not be adequate ifthe room-air temperature was to be periodicallyreduced below the normal operating value. In Fig.10 a clearer picture of the effect of the size of thepiping and pick-up factor on the length of thewarm-up time is obtained from the upper group ofcurves which show the time required to raise theroom-air temperature 6 F. As the piping andpick-up factor was reduced below about 1.3, therewas a marked increase in the length of the warm-uptime. On the other hand, as the piping and pick-upfactor was increased above 1.3, the decrease inwarm-up time was relatively small. For example,increasing the piping and pick-up factor from 1.3 to1.56 (a 12% increase in the gross boiler output)made almost no reduction in the length of thewarm-up time when using the steam system, andabout a 30% reduction in the case of the hot-watersystem. A 12% reduction in the gross output ofeither the steam or hot-water boiler resulted in awarm-up time of over 10 hours.
The results of these tests indicate that a pipingand pick-up factor of 1.3 is adequate for the suc-cessful operation of both automatically fired steamand hot-water residential heating systems. The useof larger factors results in the selection of larger
600
500
300
400
ii
J00
0O0£-0'
Kis,a<
a-
aSs?p3

ILLINOIS ENGINEERING EXPERIMENT STATION
boilers but offers little or no improvement in over-all performance.
15. Effects of Outdoor Temperature and SystemSize on Warm-up Time
The length of the warm-up period shown inFig. 10 may seem large. However, this is for de-sign outdoor temperature difference and, for agreater part of the winter, outdoor temperatures arewell above design. In Urbana the average outdoortemperature for the winter is 38 F and for onlyabout one day out of every two years does theoutdoor temperature average zero or less. Further-more, due to the radiant effect of the hot radiatorsand the warmer than normal ceiling, the house feltcomfortably warm 60 to 90 minutes before theactual end of the pick-up cycle.
Table 3 has been developed from the same dataas Fig. 10 and is arranged to show the effect of out-door temperature and system size on warm-up time.For all systems, an increase in the outdoor tempera-ture resulted in a marked decrease in warm-up time.This was especially true in the 1957-58 tests usingthe one-pipe steam system. Whereas the length ofthe warm-up period at design indoor-outdoor tem-perature difference was about 300 minutes, at anoutdoor temperature of 30 F it was only 115 to195 minutes.
A hot-water heating system inherently requiresa relatively long time to raise the house temperaturefrom one value to a higher one. By increasing boththe amount of installed radiation and the grossoutput of the boiler by 12%, thus making no changein the piping and pick-up factor, the length of the
Out-door
Temp.,F
Table 3
Effects of Outdoor Temperature and System Sizeon Length of Warm-up Time
Indoor Temperature= 70 FPiping and Pick-up Factor = 1.3House Temperature Raised 6 F
1950-51Percent Warm-up
of Time,Design MinutesIn-OutTemp.Diff.
-20 122 Inr-10 108 43d
0 95 27'10 81 22F20 68 20-30 54 19,40 41 19.
InstalledRadiation 40,190 BtulDesign In-OutTemp. Diff. 74.0 FSystem Hot-Water
1956-57Percent Warm-up
of Time,Design MinutesIn-OutTemp.Diff.106 50094 22583 17271 14659 13047 12535 125
1957-58Percent Warm-up
of Time,Design MinutesIn-OutTemp.Diff.121 Inf.107 51094 23381 16767 13354 11540 105
46,090 Btuh 39,840 Btuh
85.0 FHot-Water
73.5 FSteam
pick-up time when using a hot-water system at anoutdoor temperature of -10 F was reduced from435 minutes to 225 minutes, a reduction of approxi-mately 50%. At an outdoor temperature of 30 Fthe reduction in warm-up time was approximately35%.
The results of these tests indicate that thewarm-up time for a hot-water system may be de-creased to some extent by the use of an oversizedboiler, but if minimum warm-up times are desired,the entire system must be increased in size. Almostno decrease in the warm-up time results from theuse of an oversized steam boiler.
While the use of an oversized system will re-duce the warm-up time, caution should be used,since carrying such a practice to extreme may resultin such control problems as overrun of room-airtemperature above the setting of the thermostat.
527i4
55
h

V. ROOM-AIR TEMPERATURES16. Average Room-Air Temperature During
Setback Period
Both the steam and hot-water systems produceda variation in room-air temperature during thenight setback period. These variations are shownin the curves of Fig. 11, which were drawn from thedata of two selected testing days, each having anaverage indoor-outdoor temperature difference ap-proximating design conditions.
Even though the outdoor temperature was aboutthe same during the period represented by each ofthe curves in Fig. 11, the rate at which the housecooled down was about 40% faster when the steamsystem was in use. Since there were no changes inthe house which would affect the heat loss, it isevident that the different rates of cooling must beattributed to the heating systems. The water con-tent of the hot-water system exceeded that of thesteam system by about 250 lb. The average tem-perature of the water at the start of the setbackperiod was about 200 F and during the setbackperiod this water was cooled to about 80 F, a dropof 120 F. This represented a heat release from the
74
it
-.
72
'Sa
S70
I 68
66
hot-water system of approximately 30,000 Btu(equivalent to the calculated heat loss of the housefor about one hour at the indoor-outdoor tempera-ture difference existing during the setback period)which was not present when the steam system wasused. Since there were heat gains in the house fromsuch other sources as gas burned in the waterheater, electricity used, occupancy and heat fromthe chimney, the heat released by cooling the waterin the heating system did not have to supply theentire heat loss of the house and it is evident thatthe 30,000 Btu from the water would be sufficientto increase the length of the cooling period by 90minutes as indicated in Fig. 11.
In mild weather the cooling rate of the housewas correspondingly longer. In fact, at an outdoortemperature of about 35 F there was no operationof the burner during the entire night and the tem-perature of the water in the heating system wasbetween 70 F and 80 F at the start of the pick-upperiod. In this case an additional 30,000 Btu had tobe supplied to the water in the hot-water system ascompared to the steam system to obtain the full
400
* December 16, /950; Hot-water heating system*' e Average outdoor temp=38F
o February 9, /958; Steam heating systemAverage outdoor temp 2.7 F
0
/50 200 250 300
Time from start of set-back period, minutes
Fig. 11. Room-Air Temperature During Setback Period

ILLINOIS ENGINEERING EXPERIMENT STATION
kd
"-I
S·'0
'Is
',i<
· 9>^0
t3
240 320. 400 480 560Time from start
Fig. 12. Room-Air Tempera
output of the installed radiation. Thus the warm-uptime for the hot-water system in mild weather waslonger than for the steam system. In colder weather,the heating systems would operate during the nightso that at the start of the pick-up period the watertemperature was nearer the design value. At designoutdoor temperature, operation of the systems atnight was sufficient to bring the water temperatureclose to the maximum temperature required andhence the warm-up time was about the same forboth the steam and water system (see Table 3).
17. Average Room-Air Temperature FollowingWarm-up Period
Average room-air temperatures and the temper-ature of the air in the living room near the end of,and immediately following, the warm-up period areshown in Fig. 12. The living room air temperaturewas about 2 F lower than the house average but
640 720 800 880 960
of warm-up period, minutes
ture at End of Warm-up Period
otherwise the two exhibited the same character-istics. During the warm-up periods, the tempera-ture of the room air was increasing. The change inthe temperature of the walls and thermostat bodynaturally lagged behind the air temperature change.The heat input from the anticipator was insufficientto overcome this lag completely; hence there was a1 F overrun in air temperature at the time thethermostat ceased to call for heat (end of warm-upperiod). This represents the amount that the tem-perature of the thermostat lagged the air tempera-ture during the warm-up period. There was someadditional overrun immediately following the endof the warm-up period resulting from heat storedin the system. The lag of the thermostat behind theroom-air temperature made the warm-up periods(time the thermostat called for heat) quite long.However, normal daytime temperatures were at-tained at least an hour before the end of the

Bul.455. PIPING AND PICK-UP FACTORS- HOT-WATER AND STEAM SYSTEMS
Table 4
Room Air Temperatures at End of Warm-up PeriodTest Gas Piping Warm- Time to Overrun in
Series Burning and up Raise Living RoomRate, Pick-up Period, Room-
cfh Factor Min- Air Time, Temp.,utes Temp. to Min- F
Normal, utesMinutes
/ater SystemF-50 100 1.43 273 220 53F-50 100 1.43 198 148 50G-50 70 1.06 310 256 54
Average, water SystemSteam System
F-57 65 1.21G-57 70 1.33E-57 85 1.63
Average, Steam System
OutdoorAir
Temp.,F
0.826.032.0
33.0-2.032.0
warm-up period, and the house felt comfortablywarm even before the room-air temperature at-tained normal due to radiation from the warmerthan normal ceilings during the warm-up period.
Following the peak temperature, attained a fewminutes after the end of the warm-up period, theroom-air temperatures declined. Even during thisperiod there was some operation of the burner, ap-parently due to the effect of wall surface tempera-ture which lagged behind the room-air temperatureduring the warm-up period.
The curves in Fig. 12 are for two tests only.Table 4 presents similar data for several firing ratesand outdoor temperatures. The overrun at the endof the warm-up period tended to be a little greaterfor the hot-water system than for the steam system.This was particularly true at the warmer outdoortemperatures, under which conditions the additionalheat stored in the water system was sufficient to
cause additional overrun after the thermostat wassatisfied.
The overrun increased with increasing outdoortemperatures and with increasing firing rates. Theaverage overrun in the living room air temperaturewas approximately 2 F when the hot-water sys-tem was being used and about 1 F when the steamsystem was being used.
1 8. Average Room-Air Temperature DuringNormal Daytime Operation
The average room-air temperature at the 30-in.level in each room of the house and for each testseries is shown in Table 5. In all tests there was aslight difference in the individual room-air temper-atures because the capacity of the installed radia-tion was not exactly matched to the actual heatloss of the room. With the exception of the firststory lavatory, this unbalance in room-air tempera-ture was generally less than 3.0 F.
The data in Table 5 indicate that the piping andpick-up factor had little if any effect on the dis-tribution of heat to the rooms. In Test Series A-56,B-56 and C-56 it appeared that as the piping andpick-up factor was increased, a slightly greaterproportion of the total heat output was delivered tothe second-story rooms (bedrooms). However, theresulting change in the unbalance of room-air tem-perature was slight, amounting to about 2 F atmost. Changing the piping and pick-up factor from1.21 to 1.63 did not affect the distribution of heatby the steam system.
Table 5Room Air Temperatures -Normal Daytime Operation
G-50 H-50
Water
1.29
Avg. Diff.Air from
Temp. Liv-ing
RoomTemp.
72.0 073.0 1.072.6 0.673.1 1.173.5 1.573.3 1.373.2 1.267.1 -4.9
F-50
1.43
Avg. Diff.Air from
Temp. Liv-ing
RoomTemp.
72.0 073.5 1.573.1 1.173.6 1.673.9 1.974.1 2.174.2 2.267.3 -4.7
B-56 A-56 C-56
Water
0.88
Avg. Diff.Air from
Temp. Liv-ing
RoomTemp.
71.8 072.1 0.371.3 -0.571.9 0.171.5 0.372.3 0.572.5 0.769,7 -2.1
1.22
Avg. Diff.Air from
Temp. Liv-ing
RoomTemp.
72.5 073.0 0.572.8 0.373.1 0.672.9 0.473.7 1.2
1.57
Avg. Diff.Air from
Temp. Liv-ing
RoomTemp.
72.3 072.9 0.672.3 073.6 1.373.6 1.374.6 2.3
74.1 1.6 74.2 1.968.8 -3.7 68.1 -4.2
F-57 G-57 E-57
Steam
1.21
Avg.Air
Temp.
71.873.371.975.873.474.072.464.464.4
1.33
Avg. Diff.Air from
Temp. Liv-ing
RoomTemp.
71.1 073.2 2.171.9 0.876.0 4.973.6 2.574.1 3.072.3 1.263.0 -8.1
V
Test Series
System
Piping andPick-up Factor
Living RoomDining RoomKitchenNE BedroomNW BedroomSW BedroomBathroomLavatory
1.06
Avg. Diff.Air from
Temp. Liv-ing
RoomTemp.
72.0 073.3 1.372.3 0.373.3 1.373.4 1.473.3 1.373.9 1.968.0 -4.0
1.63
Avg. Diff.Air from
Temp. Liv-ing
RoomTemp.
72.6 073.3 0.772.2 -0.476.0 3.475.0 2.475.3 2.773.0 0.463.5 -9.1

VI. FUEL CONSUMPTION19. Daily Fuel Consumption
The daily gas consumption was determined foreach test. The average daily gas consumption foreach series at outdoor temperatures of 0 F and 30 Fare shown in Fig. 13. In comparing the 1950-51and 1956-57 tests on hot-water systems, there is anindication that the fuel consumption was slightlyhigher for the 1956-57 tests, although, consideringthe 95% confidence interval,* it is doubtful thatthe difference is significant at an outdoor temper-ature of 30 F. At least a part of any increase theremay have been in the daily fuel consumption in the1956-57 tests resulted from the lower boiler effi-ciency obtained in those tests (see Fig. 8). As anoutdoor temperature of 30 F approximates averagewinter conditions at Urbana, Illinois, the fuel con-sumption at this temperature is an excellent indexof seasonal fuel consumption. While the differencein daily gas consumption does appear to be signifi-cant at an outdoor temperature of 0 F, the verylarge confidence interval indicates that additionaltests at low temperature are required to establishaccurate values. During the winter of 1956-57there were very few days with average temper-atures below 15 F and as a result the fuel consump-tions at 0 F for Series A-56, B-56 and C-56 shownin Fig. 13 had to be extrapolated beyond the rangeof actual test data. This practice in itself intro-duced some doubt as to the accuracy of the values.
While there was no clear-cut indication that thefuel burning rate had any effect on the daily fuelconsumption in the 1950-51 tests, there was a defi-nite increase in the daily fuel consumption as thefuel burning rate was increased in the 1956-57 tests.The range of fuel burning rates was larger in 1956-57 than in 1950-51 and at the higher burning ratesthe boiler was being over-fired.
Making allowance for the unfavorable winterin 1956-57 and the over-firing of the boiler in
* Confidence interval is a term used in statistical analysis to de-fine the certainty of a value. As used here, it means that if the testswere repeated under the same conditions, the chances would be 95 outof a hundred that the new average fuel consumption would fall withinthe confidence interval indicated in Fig. 12.
Series C-56, the fact still remains that neitheroversizing the system nor increasing the piping andpick-up factor decreased the daily fuel consump-tion. On the contrary, they probably resulted insome increase.
The fuel consumptions obtained with the steamsystem in 1957-58 were approximately the same asthose obtained on the hot-water system in 1950-51.However this comparison may be misleading, since
2400
200
/80
160Z'
/40
S/240
'0
'0
0
'0
0
95 Per cent confidence - -- Average of // testsintervol for overage
LktzQ --
?5-
0
S-
Q,,
_o
Hi
Gas70 85 00
Wote
Water
70 100 135burning rate,
to to to
3 (Z 0
Water
-M-
65 7085cfh
Steam
Test series
System
Fig. 13. Average Daily Gas Consumption
l
I

Bul.455. PIPING AND PICK-UP FACTORS--HOT-WATER AND STEAM SYSTEMS
the boiler used for the steam tests was designed forgas and was 10 to 15% more efficient than the allpurpose boiler equipped with a conversion gasburner which was used on the hot-water systemduring the winters of 1950-51 and 1956-57. Had the
same all purpose boiler been used on all tests, thedaily fuel consumption for the steam tests wouldprobably have been some 10 to 15% higher thanthose shown in Fig. 13 and would closely approxi-mate earlier test results. (2 )

VII. SYSTEM WARM-UP TESTS20. Method of Testing
Tests were made on both the hot-water and thesteam systems to determine how changes in thefiring rate would affect the warming-up character-istics of the system itself. In preparation for thesetests the system was allowed to cool to an averagewater temperature of about 130 F. After the sys-tem had cooled, the burner was started and oper-ated continuously until the system was operatingat its maximum output. During tests on the hot-water system the circulator was in continuousoperation. Observations included the temperatureof the water in the boiler and the rate of watercirculation for the hot-water system; observationsfor the steam system included the boiler watertemperature, boiler pressure, time required for theboiler to start steaming, time required for steam toreach each radiator and the time required for eachradiator to become filled with steam. Other obser-vations included the firing rate and flue gas tem-perature.
21. Rate of Water Temperature Rise -Hot-Water System
Warm-up tests were made on the hot-watersystem during the winter of 1950-51. System watertemperatures were observed throughout each testand plotted in Fig. 14. At all three burning ratesit took approximately 4 hours to attain the maxi-mum water temperature. At a burning rate of 70cfh (piping and pick-up factor = 1.06), the maxi-mum water temperature was about 180 F, 35 Flower than the design water temperature. At firingrates of 85 cfh and 100 cfh (piping and pick-upfactors of 1.29 and 1.43 respectively), the corre-sponding maximum water temperatures were 205and 220 F.
The output of a baseboard radiator is propor-tional to the 1.4 power of the difference betweenaverage water temperature and ambient air tem-perature. Assuming the average water temperaturein the radiation to be the same as the average watertemperature in the boiler and the ambient air
temperature to be 70 F, the curves of Fig. 14indicate that the hot-water system was operatingat 30 to 40% of its maximum output at the startof the system warming-up tests. In 40 minutes theoutput had risen to about 60% of maximum andin 80 minutes the system was operating at about80% of maximum output.
Since 215 F was the design water temperature,it is apparent that the system was unable to oper-ate at design capacity during tests in Series G-50and H-50. The maximum output of the systemduring test H-50 was about 90% of design outputand only about 70% of design output for test G-50.
In summary, the firing rate (piping and pick-upfactor) apparently had no effect on the length oftime required to heat the water in the hot-watersystem to the maximum temperature attainable.It did, however, have a distinct effect on the valueof the maximum temperature and on the maximumoutput of the system. About four hours were re-quired to attain maximum water temperatures inthe system, and at any piping and pick-up factorless than about 1.3 the system was unable todevelop its full design output capacity.
22. Temperature of Steam Leaving and CondensateReturning to Boiler -Steam System
The temperatures of the steam leaving theboiler and of the condensate returning to the boilerwere recorded at 1-minute intervals during eachtest. The variations in these temperatures wereabout the same for all three firing rates. The boilerstarted to steam about 5 minutes after the start ofthe test. In all except Series E-57 the steam tem-perature remained at a constant value of approxi-mately 212 F throughout the remainder of the test.In Series E-57 the steam temperature began toincrease above 212 F approximately 60 minutesafter the start of the test and reached a maximumof about 220 F 15 minutes later, at which time theburner was stopped by action of the high limitcontrol.
The first condensate was returned to the boiler

Bul. 455. PIPING AND PICK-UP FACTORS - HOT-WATER AND STEAM SYSTEMS
/20 /60 200
7ime from start of warm-up period, minutes
240 280
Fig. 14. Effect of Burning Rate on the Boiler Water Temperature (Hot-Water System)
about 10 minutes after the start of the test. Thetemperature of the condensate was about 166 F atthe start and gradually increased to a steady statetemperature of 198 F, about 15 F less than theaverage steam temperature.
23. Boiler Pressure - Steam System
In Test E-57 (piping and pick-up factor1.63) the boiler pressure was raised to 2.5 psig, thesetting of the pressure control, in 75 minutes. Over3 hours were required to do this in Test G-57(piping and pick-up factor = 1.33) and in TestF-57 (piping and pick-up factor = 1.21) the boilerpressure could not be increased above about 0.7psig regardless of how long the burner was oper-ated. Operation of the burner can cause anincrease in the boiler pressure only if the grossoutput of the boiler exceeds the rate at whichsteam is condensed in the radiation and pipingmaking up the system. Since steady state condi-
tions existed in Test F-57, the gross output of theboiler must have exactly equalled the steam con-densing capacity of the pipe and connected radia-tion or, in other words, the steam condensingcapacity of the system piping was about 21% ofthe condensing capacity of the connected radiation.
At any time the gross output of the boiler isequal to or less than the steam condensing capac-ity of the piping and connected radiation there isdanger that the system will not be completely freedof air and therefore one or more of the radiatorsin the system may fail to heat properly.
24. Time Required to Generate Steam and DistributeIt to Radiation - Steam System
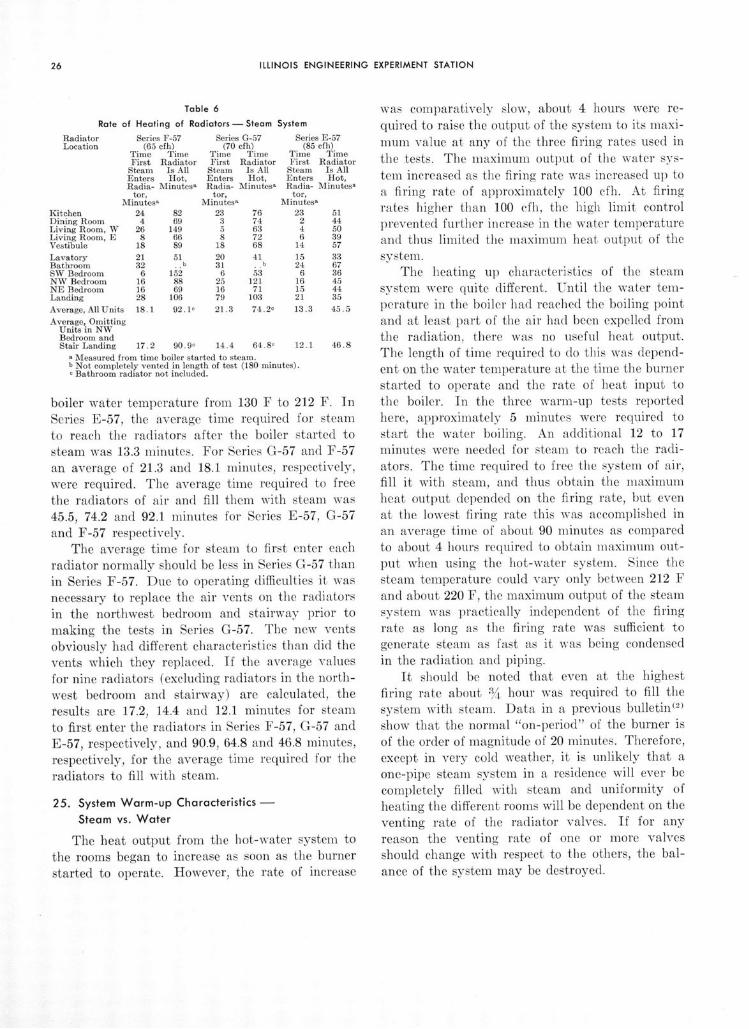
The intervals between the times the boilerstarted to steam and (1) steam first entered eachradiator and (2) each radiator was filled withsteam are tabulated in Table 6. In each seriesapproximately 5 minutes were required to raise the
a
a
a
N
a
320
ILLINOIS ENGINEERING EXPERIMENT STATION
Radiator Series F-57Location (65 cfh)
Time TimeFirst Radiator
Steam Is AllEnters Hot,Radia- Minutesa
tor,Minutesa
tchen 24 82tning Room 4 69ving Room, W 26 149ving Room, E 8 66stibule 18 89
vatory 21 51athroom 32 .. bV Bedroom 6 152W Bedroom 16 88E Bedroom 16 69inding 28 106
reraee, All Units 18.1 92.10
Average, OmittingUnits in NWBedroom andStair Landing 17.2
Series G-57(70 cfh)
Time TimeFirst Radiator
Steam Is AllEnters Hot,Radia- Minutes
a
tor,Minutes
a
23 763 745 638 72
18 68
20 4131 .
6 5325 12116 7179 103
21.3 74.2o
Series E-57(85 cfh)
Time TimeFirst Radiator
Steam Is AllEnters Hot,Radia- Minutesa
tor,Minutes-
23 512 444 506 39
14 57
15 3324 67
6 3616 4515 4421 35
13.3 45.5
90.9e 14.4 64.80 12.1 46.8
a Measured from time boiler started to steam.b Not completely vented in length of test (180 minutes).o Bathroom radiator not included.
boiler water temperature from 130 F to 212 F. InSeries E-57, the average time required for steamto reach the radiators after the boiler started tosteam was 13.3 minutes. For Series G-57 and F-57an average of 21.3 and 18.1 minutes, respectively,were required. The average time required to freethe radiators of air and fill them with steam was45.5, 74.2 and 92.1 minutes for Series E-57, G-57and F-57 respectively.
The average time for steam to first enter eachradiator normally should be less in Series G-57 thanin Series F-57. Due to operating difficulties it wasnecessary to replace the air vents on the radiatorsin the northwest bedroom and stairway prior tomaking the tests in Series G-57. The new ventsobviously had different characteristics than did thevents which they replaced. If the average valuesfor nine radiators (excluding radiators in the north-west bedroom and stairway) are calculated, theresults are 17.2, 14.4 and 12.1 minutes for steamto first enter the radiators in Series F-57, G-57 andE-57, respectively, and 90.9, 64.8 and 46.8 minutes,respectively, for the average time required for theradiators to fill with steam.
25. System Warm-up Characteristics -Steam vs. Water
The heat output from the hot-water system tothe rooms began to increase as soon as the burnerstarted to operate. However, the rate of increase
Table 6
Rate of Heating of Radiators-Steam System
KiDiLiLiVe
LaBESNN:La
Ai
was comparatively slow, about 4 hours were re-quired to raise the output of the system to its maxi-mum value at any of the three firing rates used inthe tests. The maximum output of the water sys-tem increased as the firing rate was increased up toa firing rate of approximately 100 cfh. At firingrates higher than 100 cfh, the high limit controlprevented further increase in the water temperatureand thus limited the maximum heat output of thesystem.
The heating up characteristics of the steamsystem were quite different. Until the water tem-perature in the boiler had reached the boiling pointand at least part of the air had been expelled fromthe radiation, there was no useful heat output.The length of time required to do this was depend-ent on the water temperature at the time the burnerstarted to operate and the rate of heat input tothe boiler. In the three warm-up tests reportedhere, approximately 5 minutes were required tostart the water boiling. An additional 12 to 17minutes were needed for steam to reach the radi-ators. The time required to free the system of air,fill it with steam, and thus obtain the maximumheat output depended on the firing rate, but evenat the lowest firing rate this was accomplished inan average time of about 90 minutes as comparedto about 4 hours required to obtain maximum out-put when using the hot-water system. Since thesteam temperature could vary only between 212 Fand about 220 F, the maximum output of the steamsystem was practically independent of the firingrate as long as the firing rate was sufficient togenerate steam as fast as it was being condensedin the radiation and piping.
It should be noted that even at the highestfiring rate about 3/ hour was required to fill thesystem with steam. Data in a previous bulletin (21
show that the normal "on-period" of the burner isof the order of magnitude of 20 minutes. Therefore,except in very cold weather, it is unlikely that aone-pipe steam system in a residence will ever becompletely filled with steam and uniformity ofheating the different rooms will be dependent on theventing rate of the radiator valves. If for anyreason the venting rate of one or more valvesshould change with respect to the others, the bal-ance of the system may be destroyed.

VIII. REFERENCES1. "Performance of a Hot Water Heating System in the
I=B=R Research Home at the University of Illi-nois," A. P. Kratz, W. S. Harris, M. K. Fahnestock,and R. J. Martin. Univ. of Ill. Engineering Experi-ment Station Bulletin No. 349, 1944.
2. "Progress Report on Performance of a One-Pipe SteamSystem in the I=B=R Research Home," W. S. Har-ris. Univ. of Ill. Engineering Experiment Station Bul-letin No. 383, 1949.
3. "The Use of an Elbow in a Pipe Line for Determiningthe Rate of Flow in the Pipe," W. M. Lansford. Univ.of Ill. Engineering Experiment Station Bulletin No.289, 1936.
4. "Radiant Baseboard Heating and Effects of ReducedThermostat Setting and Open Bedroom Windows atNight," W. S. Harris and R. H. Weigel. Univ. of Ill.Engineering Experiment Station Bulletin No. 391,1951.


![Ill an 94 s 94.} o o o o o O O 00 O O 00 Il Il o 02 00 00 s 4] O ...Èíí Ill Èí Èíí ùilí È9f Ùt 1 anu RTII 71 àfrí Èílí b (0 S S a Ill S 94 o s s co S Ill Ill s s Ill](https://img.dokumen.tips/doc/110x75/605732e25f20611932214e4d/ill-an-94-s-94-o-o-o-o-o-o-o-00-o-o-00-il-il-o-02-00-00-s-4-o-ill.jpg)