Embed Size (px)
Citation preview

Supplemental Figures and Tables
IL1RL1 Asthma Risk Variants Regulate Airway Type 2 Inflammation E. D. Gordona, J. Palandrab, A. Wesolowska-Andersenc, L. Ringelc, C.L. Riosc, M. E. Lachowicz-Scrogginsd, L. Sharpd, J. Evermanc, H. J. MacLeodd, J. W. Leed,e, R. J. Masonf, M. A. Matthaya,d,e, R.T. Sheldong, M. C. Petersa, K.H. Nockag, J. V. Fahya,d, M. A. Seiboldc,h,i*.
Supplemental Figure 1. Candidate IL1RL1 Single Nucleotide Polymorphisms (SNPs) have
been implicated in the pathogenesis of asthma and allergic disease. (A) Table showing the 5
candidate SNPs tested in our UCSF cohort, the minor allele frequencies in the UCSF plasma cohort
stratified by racial group, and prior functional and disease implications. (B) Linkage disequilibrium
Asian White Non-Hispanic Hispanic
IL1RL1 single nucleotide polymorphisms (SNPs) tested and prior disease or functional implication
Variant
Minor Allle Frequency in UCSF Plasma Cohort
Location Disease or Functional ImplicationWhite Non-
Hispanic (N=90)Asian (N=32)
Hispanic (N=28)
Black (N=13)
rs11685480 (T) 0.57 0.53 0.32 0.35 Distal Promoter
Associated with atopic dermatitis in Japanese individuals and 3-SNP distal promoter haplotype altered expression in vitro (Shimizu et al, Human Mol Gen, 2005); Associated with serum sST2 in pediatric Dutch cohort (Savenije et al, JACI, 2011)
rs1041973 (T) 0.28 0.13 0.20 0.38 Exon 3 Associated with asthma in Mexican population (Wu et al, JACI, 2010); Associated with asthma, eosinophils and serum ST2 in pediatric Dutch cohort (Savenije et al, JACI, 2011)
rs1420101 (A) 0.43 0.45 0.27 0.25 Intron 5GWAS of peripheral blood eosinophils, asthma, atopic asthma in European and East Asian populations (Gudbjartsson et al, Nat Gen, 2009); Associated with serum sST2 in pediatric Dutch cohort (Savenije et al, JACI, 2011); GWAS of serum sST2 (Ho et al, JCI, 2013)
rs1921622 (T) 0.57 0.48 0.28 0.23 Intron 10
Associated with asthma, serum IgE, and bronchial hyperreactivity in Dutch asthma families (Reijmerink et al, JACI, 2008); Associated with serum sST2 in pediatric Dutch cohort (Savenije et al, JACI, 2011); Associated with severe RSV infection in Dutch children age less than 1 year old (Faber et al, PLOSOne, 2012)
rs10192157 (A) 0.32 0.09 0.29 0.58 Exon 11Coding haplotype increased signaling though ST2L in KU812 cell line (Ho et al, JCI, 2013); Coding haplotype protective for asthma and reduced signaling through ST2L in HEK cell line (Ramirez-Carrozzi et al, JACI, 2014)
A
B

maps for the 5 candidate SNPs in our UCSF plasma cohort stratified by racial group (data not shown
for blacks due to limited numbers of subjects in that group).
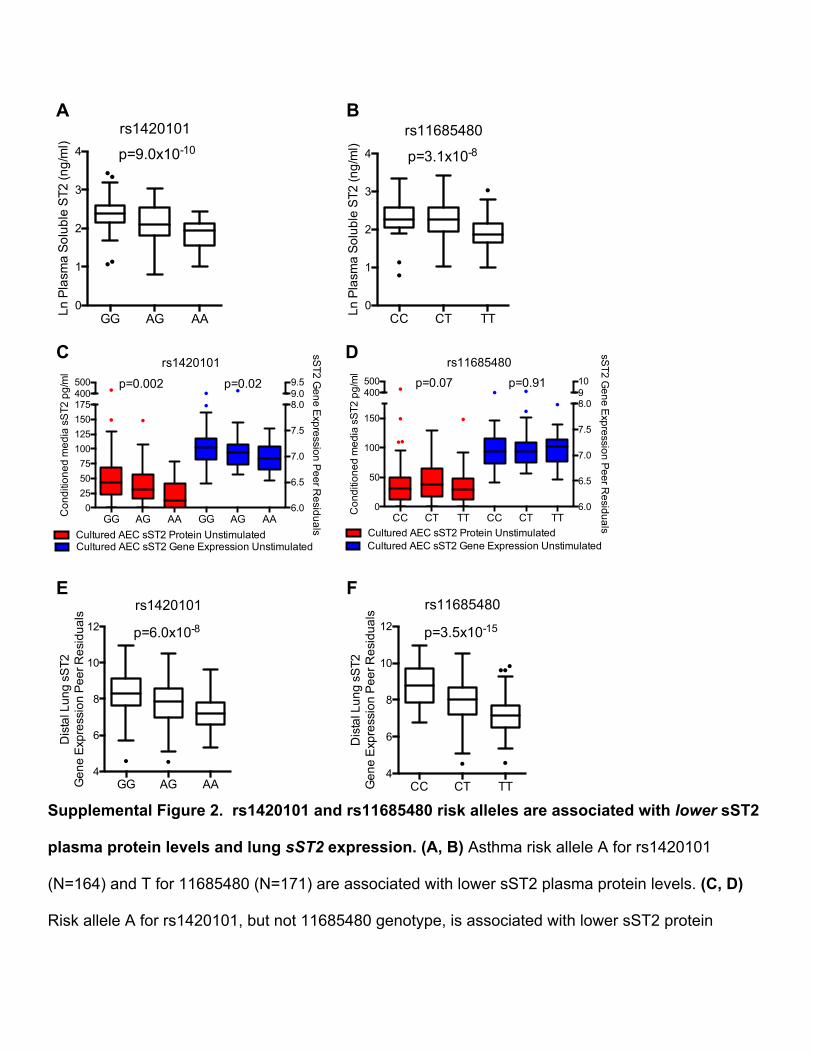
Supplemental Figure 2. rs1420101 and rs11685480 risk alleles are associated with lower sST2
plasma protein levels and lung sST2 expression. (A, B) Asthma risk allele A for rs1420101
(N=164) and T for 11685480 (N=171) are associated with lower sST2 plasma protein levels. (C, D)
Risk allele A for rs1420101, but not 11685480 genotype, is associated with lower sST2 protein
CC CT TT4
6
8
10
12
rs11685480
Dis
tal L
ung
sST2
G
ene
Exp
ress
ion
Pee
r Res
idua
ls
p=3.5x10⁻¹⁵
GG AG AA4
6
8
10
12
Dis
tal L
ung
sST2
G
ene
Exp
ress
ion
Pee
r Res
idua
ls rs1420101
p=6.0x10⁻⁸
GG AG AA GG AG AA0
255075
100125150175400500
6.0
6.5
7.0
7.5
8.09.09.5
Con
ditio
ned
med
ia s
ST2
pg/
ml
rs1420101
sST2 G
ene Expression P
eer Residuals
Cultured AEC sST2 Protein UnstimulatedCultured AEC sST2 Gene Expression Unstimulated
p=0.002 p=0.02
CC CT TT CC CT TT0
50
100
150
400500
6.0
6.5
7.0
7.5
8.0910
Con
ditio
ned
med
ia s
ST2
pg/
ml
rs11685480
sST2 G
ene Expression P
eer Residuals
Cultured AEC sST2 Protein UnstimulatedCultured AEC sST2 Gene Expression Unstimulated
p=0.07 p=0.91
GG AG AA0
1
2
3
4
Ln P
lasm
a S
olub
le S
T2 (n
g/m
l)
rs1420101
p=9.0x10⁻¹⁰
CC CT TT0
1
2
3
4
Ln P
lasm
a S
olub
le S
T2 (n
g/m
l)
rs11685480
p=3.1x10⁻⁸
A B
C D
E F
measures (N=141, red) and sST2 gene expression (N=127, blue) in cultured human primary airway
epithelial cells (AEC) in the unstimulated condition. (E, F) Risk allele A for rs1420101 and T for
11685480 are associated with lower sST2 gene expression (N=237) distal lung parenchymal tissue
from the Genotype-Tissue Expression Project (GTEx) dataset. AEC and GTEx gene expression data
is shown as peer residuals generated as described in the methods. Data presented as Tukey box
plots with box containing the first and third quartile, line at median, and whiskers at 1.5 interquartile
range. All p values generated from additive linear regression models.
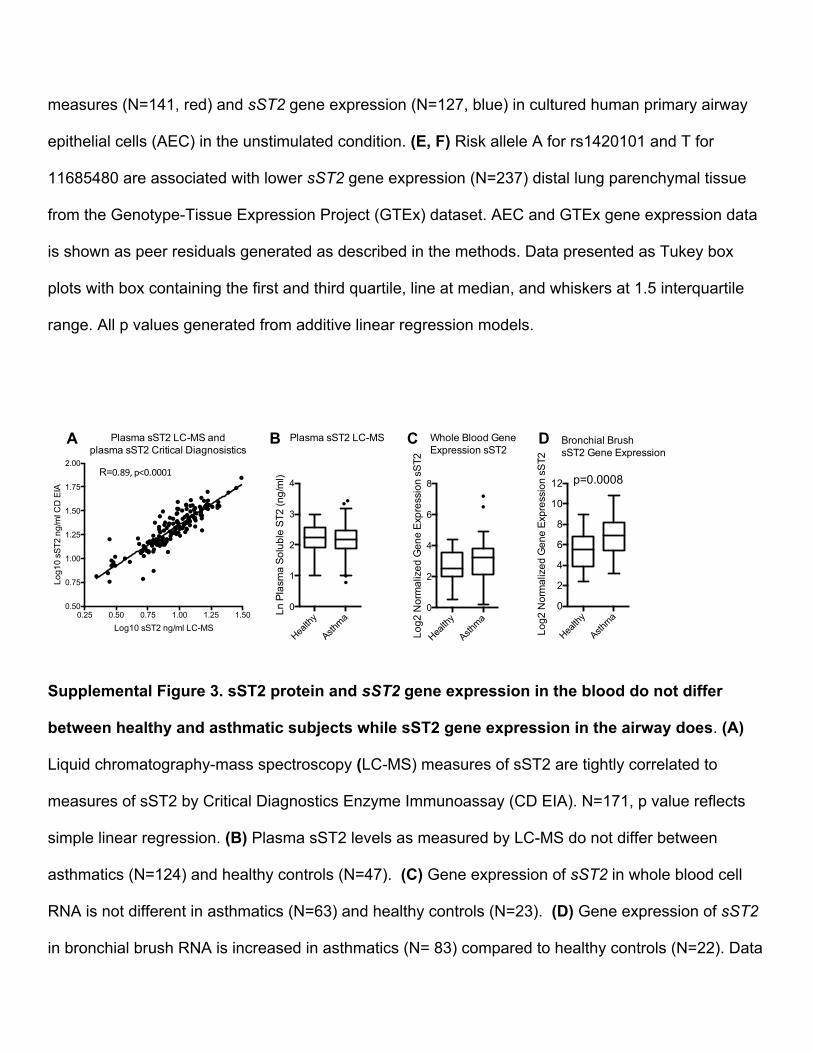
Supplemental Figure 3. sST2 protein and sST2 gene expression in the blood do not differ
between healthy and asthmatic subjects while sST2 gene expression in the airway does. (A)
Liquid chromatography-mass spectroscopy (LC-MS) measures of sST2 are tightly correlated to
measures of sST2 by Critical Diagnostics Enzyme Immunoassay (CD EIA). N=171, p value reflects
simple linear regression. (B) Plasma sST2 levels as measured by LC-MS do not differ between
asthmatics (N=124) and healthy controls (N=47). (C) Gene expression of sST2 in whole blood cell
RNA is not different in asthmatics (N=63) and healthy controls (N=23). (D) Gene expression of sST2
in bronchial brush RNA is increased in asthmatics (N= 83) compared to healthy controls (N=22). Data
Health
y
Asthma
0
2
4
6
8
Log2
Nor
mal
ized
Gen
e Ex
pres
sion
sST
2
Health
y
Asthma
0
2
4
6
8
10
12
Log2
Nor
mal
ized
Gen
e Ex
pres
sion
sST
2
p=0.0008
B Plasma sST2 LC-MS C Whole Blood GeneExpression sST2
0.25 0.50 0.75 1.00 1.25 1.500.50
0.75
1.00
1.25
1.50
1.75
2.00
Log10 sST2 ng/ml LC-MS
Log1
0 sS
T2 n
g/m
l CD
EIA
R=0.89,&p<0.0001
A Plasma sST2 LC-MS and plasma sST2 Critical Diagnosistics
D Bronchial Brush sST2 Gene Expression
Health
y
Asthma
0
1
2
3
4
Ln P
lasm
a So
lubl
e ST
2 (n
g/m
l)

presented as Tukey box plots with box containing the first and third quartile, line at median, and
whiskers at 1.5 interquartile range; comparisons performed by two-tailed t-test.
Supplemental Figure 4. Schematic depicting the molecular mechanism by which IL1RL1
genetic variants drive type 2 inflammation in asthma. Expression quantitative trait loci (eQTL) in
the proximal and distal promoters independently drive sST2 expression in the lung. rs1420101 or a
tag of this SNP alters expression of sST2 produced by the proximal promoter in airway and alveolar
epithelial cells. Alternatively, rs11685480 or a tag of this SNP alters sST2 expression through the
distal promoter which is active in alveolar epithelial cells. sST2 produced by airway epithelial cells
acts locally in the airway to inhibit IL-33 signaling and suppress type 2 inflammation. sST2 produced
in the distal lung by alveolar epithelial cells and microvascular endothelial cells accumulates in the
plasma and acts as a reservoir, which leaks into injured tissues and again acts to suppress type 2
inflammation. A genetically determined deficiency in soluble ST2 both in the airway and in the plasma
reservoir increases the risk of type 2 airway inflammation in asthma.
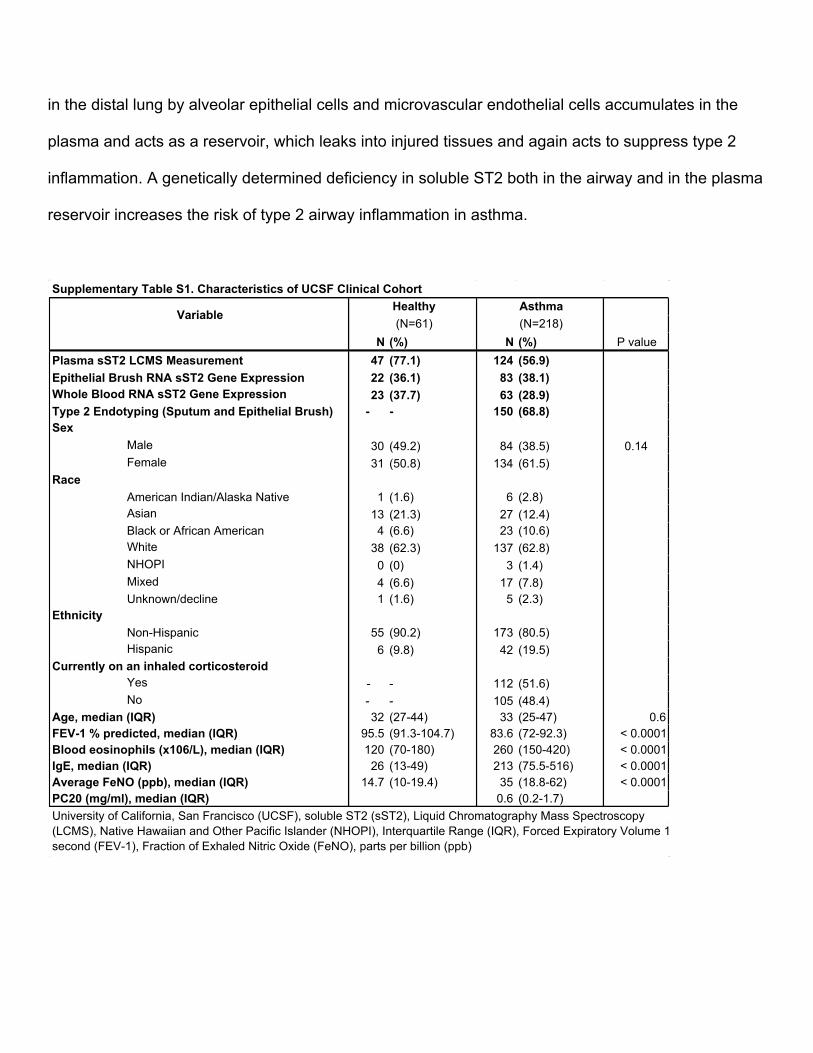
N (%) N (%) P value47 (77.1) 124 (56.9)22 (36.1) 83 (38.1)23 (37.7) 63 (28.9)
- - 150 (68.8)
30 (49.2) 84 (38.5) 0.1431 (50.8) 134 (61.5)
1 (1.6) 6 (2.8)13 (21.3) 27 (12.4)4 (6.6) 23 (10.6)
38 (62.3) 137 (62.8)0 (0) 3 (1.4)4 (6.6) 17 (7.8)1 (1.6) 5 (2.3)
55 (90.2) 173 (80.5)6 (9.8) 42 (19.5)
- - 112 (51.6)- - 105 (48.4)32 (27-44) 33 (25-47) 0.6
95.5 (91.3-104.7) 83.6 (72-92.3) < 0.0001120 (70-180) 260 (150-420) < 0.000126 (13-49) 213 (75.5-516) < 0.0001
14.7 (10-19.4) 35 (18.8-62) < 0.00010.6 (0.2-1.7)
Blood eosinophils (x106/L), median (IQR)IgE, median (IQR)Average FeNO (ppb), median (IQR)PC20 (mg/ml), median (IQR)
FEV-1 % predicted, median (IQR)
NHOPIMixedUnknown/decline
EthnicityNon-HispanicHispanic
Currently on an inhaled corticosteroidYesNo
Age, median (IQR)
University of California, San Francisco (UCSF), soluble ST2 (sST2), Liquid Chromatography Mass Spectroscopy (LCMS), Native Hawaiian and Other Pacific Islander (NHOPI), Interquartile Range (IQR), Forced Expiratory Volume 1 second (FEV-1), Fraction of Exhaled Nitric Oxide (FeNO), parts per billion (ppb)
White
Plasma sST2 LCMS MeasurementEpithelial Brush RNA sST2 Gene ExpressionWhole Blood RNA sST2 Gene ExpressionType 2 Endotyping (Sputum and Epithelial Brush)Sex
MaleFemale
RaceAmerican Indian/Alaska NativeAsianBlack or African American
Supplementary Table S1. Characteristics of UCSF Clinical Cohort
VariableHealthy Asthma (N=61) (N=218)
N (%) N (%) P value
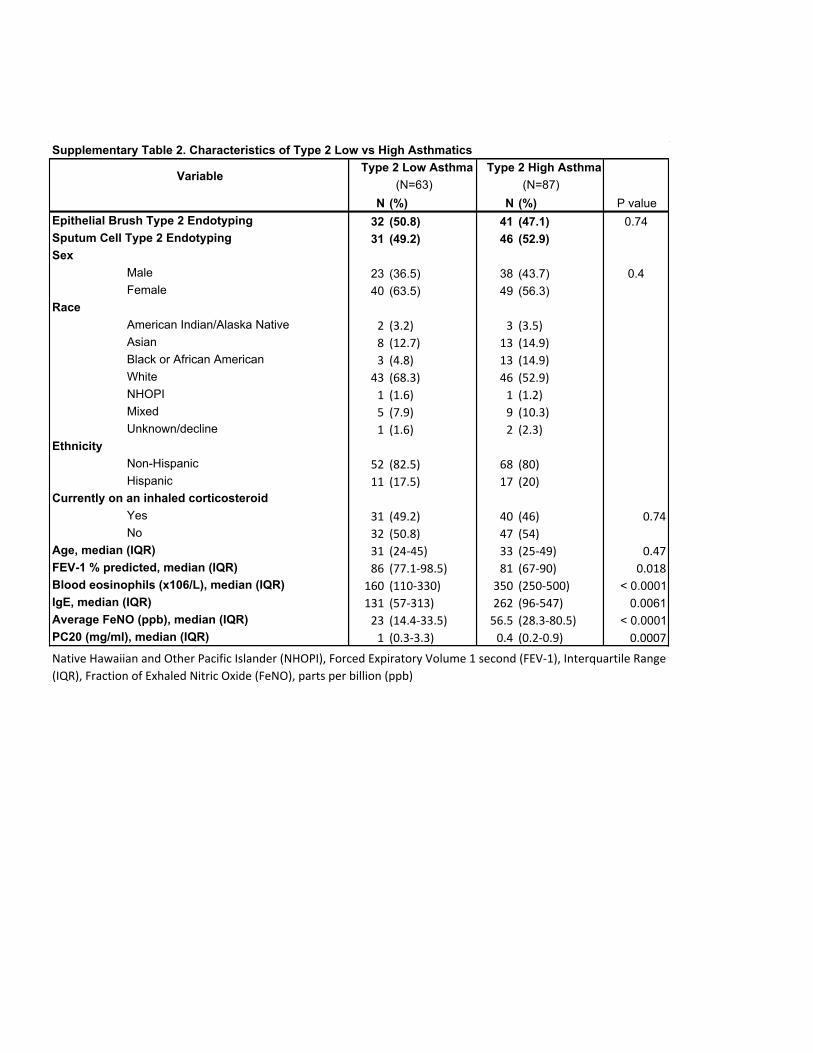
32 (50.8) 41 (47.1) 0.74
31 (49.2) 46 (52.9)
23 (36.5) 38 (43.7) 0.4
40 (63.5) 49 (56.3)
2 (3.2) 3 (3.5)8 (12.7) 13 (14.9)3 (4.8) 13 (14.9)43 (68.3) 46 (52.9)1 (1.6) 1 (1.2)5 (7.9) 9 (10.3)1 (1.6) 2 (2.3)
52 (82.5) 68 (80)11 (17.5) 17 (20)
31 (49.2) 40 (46) 0.7432 (50.8) 47 (54)31 (24-45) 33 (25-49) 0.4786 (77.1-98.5) 81 (67-90) 0.018160 (110-330) 350 (250-500) < 0.0001
131 (57-313) 262 (96-547) 0.0061
23 (14.4-33.5) 56.5 (28.3-80.5) < 0.0001
1 (0.3-3.3) 0.4 (0.2-0.9) 0.0007
Currently on an inhaled corticosteroid
Race
American Indian/Alaska Native
Asian
Black or African American
White
NativeHawaiianandOtherPacificIslander(NHOPI),ForcedExpiratoryVolume1second(FEV-1),InterquartileRange(IQR),FractionofExhaledNitricOxide(FeNO),partsperbillion(ppb)
Average FeNO (ppb), median (IQR)
PC20 (mg/ml), median (IQR)
Age, median (IQR)
Yes
No
FEV-1 % predicted, median (IQR)
Blood eosinophils (x106/L), median (IQR)
IgE, median (IQR)
NHOPI
Mixed
Unknown/decline
Ethnicity
Non-Hispanic
Hispanic
Female
Supplementary Table 2. Characteristics of Type 2 Low vs High Asthmatics
VariableType 2 Low Asthma Type 2 High Asthma
(N=63) (N=87)
Epithelial Brush Type 2 Endotyping
Sputum Cell Type 2 Endotyping
Sex
Male
University of California, San Francisco (UCSF), soluble ST2 (sST2), Liquid Chromatography Mass Spectroscopy
(LCMS), Native Hawaiian and Other Pacific Islander (NHOPI), Interquartile Range (IQR), Forced Expiratory Volume 1
second (FEV-1), Fraction of Exhaled Nitric Oxide (FeNO), parts per billion (ppb)
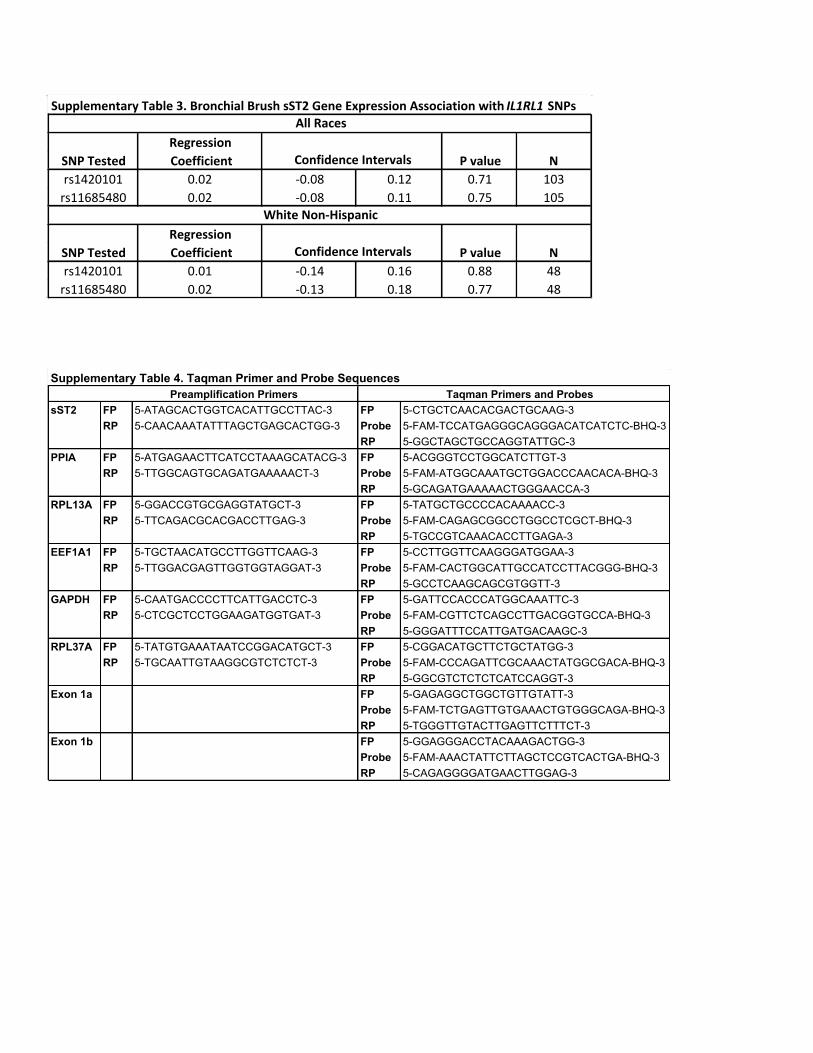
SupplementaryTable3.BronchialBrushsST2GeneExpressionAssociationwithIL1RL1 SNPs
SNPTested Pvalue Nrs1420101 0.02 -0.08 0.12 0.71 103rs11685480 0.02 -0.08 0.11 0.75 105
SNPTested Pvalue Nrs1420101 0.01 -0.14 0.16 0.88 48rs11685480 0.02 -0.13 0.18 0.77 48
AllRacesRegressionCoefficient ConfidenceIntervals
WhiteNon-HispanicRegressionCoefficient ConfidenceIntervals
Supplementary Table 4. Taqman Primer and Probe Sequences
sST2 FP 5-ATAGCACTGGTCACATTGCCTTAC-3 FP 5-CTGCTCAACACGACTGCAAG-3RP 5-CAACAAATATTTAGCTGAGCACTGG-3 Probe 5-FAM-TCCATGAGGGCAGGGACATCATCTC-BHQ-3
RP 5-GGCTAGCTGCCAGGTATTGC-3PPIA FP 5-ATGAGAACTTCATCCTAAAGCATACG-3 FP 5-ACGGGTCCTGGCATCTTGT-3
RP 5-TTGGCAGTGCAGATGAAAAACT-3 Probe 5-FAM-ATGGCAAATGCTGGACCCAACACA-BHQ-3RP 5-GCAGATGAAAAACTGGGAACCA-3
RPL13A FP 5-GGACCGTGCGAGGTATGCT-3 FP 5-TATGCTGCCCCACAAAACC-3RP 5-TTCAGACGCACGACCTTGAG-3 Probe 5-FAM-CAGAGCGGCCTGGCCTCGCT-BHQ-3
RP 5-TGCCGTCAAACACCTTGAGA-3EEF1A1 FP 5-TGCTAACATGCCTTGGTTCAAG-3 FP 5-CCTTGGTTCAAGGGATGGAA-3
RP 5-TTGGACGAGTTGGTGGTAGGAT-3 Probe 5-FAM-CACTGGCATTGCCATCCTTACGGG-BHQ-3RP 5-GCCTCAAGCAGCGTGGTT-3
GAPDH FP 5-CAATGACCCCTTCATTGACCTC-3 FP 5-GATTCCACCCATGGCAAATTC-3RP 5-CTCGCTCCTGGAAGATGGTGAT-3 Probe 5-FAM-CGTTCTCAGCCTTGACGGTGCCA-BHQ-3
RP 5-GGGATTTCCATTGATGACAAGC-3RPL37A FP 5-TATGTGAAATAATCCGGACATGCT-3 FP 5-CGGACATGCTTCTGCTATGG-3
RP 5-TGCAATTGTAAGGCGTCTCTCT-3 Probe 5-FAM-CCCAGATTCGCAAACTATGGCGACA-BHQ-3RP 5-GGCGTCTCTCTCATCCAGGT-3
Exon 1a FP 5-GAGAGGCTGGCTGTTGTATT-3Probe 5-FAM-TCTGAGTTGTGAAACTGTGGGCAGA-BHQ-3RP 5-TGGGTTGTACTTGAGTTCTTTCT-3
Exon 1b FP 5-GGAGGGACCTACAAAGACTGG-3Probe 5-FAM-AAACTATTCTTAGCTCCGTCACTGA-BHQ-3RP 5-CAGAGGGGATGAACTTGGAG-3
Preamplification Primers Taqman Primers and Probes