Embed Size (px)
Citation preview

lunedì 3 giugno 2013
IL CENTRO EUROPA RICERCHE ER produces short and medium-term forecast of the Italian economy, evalua-tions on economic policy, reports on public finance, fiscal, monetary and industrial policy. CER is regularly invited to auditions for the Italian Parliament on the economic outlook and public finance trends. CER prepares a «consensus forecast» for the Italian Ministry of the Economy jointly with other research institutes. CER's forecasting and simulation expertise is embodied in its econometric models, which are continuously updated to take into account structural changes in the national and in-ternational economy. The econometric models are used to test the impact of policy measures as well as provide forecasts of economic and financial variables. The micro-simulation model, using data on wages and consumer expenditure, is used to evaluate the distribution impact of tax and tariff measures on Italian households. CER's reports are available to subscribers as are presentations and workshops on the re-ports organised and sponsored by CER and attended to by experts and leading person-alities and policy makers.

Centro Europa Ricerche S.r.l. Via G. Zanardelli, 34, 00186 Roma Tel. (0039) 06 8081304 E-mail: [email protected] www.centroeuroparicerche.it Presidente Onorario: Giorgio Ruffolo Presidente: Vladimiro Giacché Vicepresidenti: Matteo Arpe, Claudio Levorato Direttore: Stefano Fantacone Comitato scientifico: Marcello Messori (presidente), Emilio Barucci, Massimo Bordignon, Agar Bru-giavini, Stefano Caselli, Innocenzo Cipolletta, Claudio De Vincenti, Massimo Egidi, Paolo Guerrieri, Marco Lossani, Mauro Maré, Maria Rosaria Maugeri, Giulio Napolitano, Giovanna Nicodano, Pier Carlo Padoan, Antonio Pedone, Gianni Toniolo Rapporto CER: pubblicazione periodica a carattere economico. Anno XXXI Direttore responsabile: Anna Maria Lombroso Iscrizione n. 177 del 6 maggio 1998 del Registro della Stampa del Tribunale di Roma Proprietario della testata: Centro Europa Ricerche S.r.l. C.C.I.A.A. Roma: R.E.A. 480286 Edizione: Centro Europa Ricerche S.r.l.
Finito di stampare 3 giugno 2013 presso la sede del Cer

Europe’s choice: Austerity or growth?
RAPPORTO
2013 n.1

Hanno collaborato alla redazione del rapporto: Stefan Collignon, Stefano Corsaro Piero Esposito, Stefano Fantacone, Petya Garalova, Carlo Milani.

R A P P O R T O C E R
5 5
Summary 7 Supply and demand imbalances 13THE IMPACT OF THE CRISIS 13THE IMBALANCE OF DEMAND AND SUPPLY IN THE EURO AREA 16THE MYSTERY OF GROWTH 18THE IMPACT OF AUSTERITY ON INVESTMENT AND ECONOMIC GROWTH 22THE CONTRIBUTION OF EFFECTIVE DEMAND COMPONENTS TO ECONOMIC GROWTH 24Box 1. The fiscal multiplier and its effect on growth during the crisis: a survey 28 Fiscal Imbalances
31
DEBT SUSTAINABILITY 35FISCAL POLICY AND AGGREGATE DEMAND 41 Single currency, “external” imbalances and competitiveness 45HOW MONETARY UNION WORKS 45A EUROPEAN BANKING UNION 47MEASURING COMPETITIVENESS 50COMPETITIVENESS AND THE RETURN TO CAPITAL 50COMPETITIVENESS AND UNIT LABOUR COSTS 54Box 2. The European Banking Union 49Box 3. Structural breaks in the Phillips Curve of EU15 countries 60 Sectorial imbalances in the Euro Area 65FLOW OF FUNDS ACCOUNTING 65 The Italian debate on austerity 71WHAT IS WRONG WITH EUROPE? 71WHY KEEP THE EURO? 79MICROECONOMIC REASONS 80MACROECONOMIC ARGUMENTS 82


R A P P O R T O C E R
7 7
Summary
1 This year’s Rapporto Europa looks at the causes and consequences and remedies of austerity in the Euro Area. Austerity, we are told, is Europe’s newest curse. Austerity cuts budgets and prevents buying public goods; austerity lowers wages and pushes unemployment up; austerity, in other words, throws people into misery. Yet, we are also told, austerity is unavoid-able. Public and private debt are unsustainable, high wages have made Europe un-competitive and employment will only return when structural reforms will have made their effect and the economy found its balance again. Austerity is temporary. 2 The open question is whether the European Union and its currency, the euro, will sur-vive until austerity can be given up again. Tensions are mounting. While trade and cur-rent account deficits are narrowing, imbalances in debt and unemployment are rising. Politically, the process of European unification is tested to its limits. Pursuing austerity without considering the social and political consequences risks bringing down the whole edifice of integration. What Europe needs is a return to balanced economic growth. Without growth, public debt will not come down, employment will not be cre-ated, and Europe’s social model will not remain sustainable. What is needed is gener-ating a new economic dynamism without the excesses of bubbles and busts and without concentrating wealth and prosperity in some member states at the expense of all others. This year’s Rapporto Europa provides some answers how this could be achieved. 3 Austerity is Europe’s response to the crisis. The global financial crisis has had its epicen-tre in the United States, but the fallout was global. It has spilled over into Europe, but Europe has made it worse. After the debt crisis, which was initiated by policy makers in Greece, and after the banking crises, which followed in Ireland, Spain and Cyprus, aus-terity sought to restore balanced budgets, but it has generated more political and fi-nancial uncertainty. With over 12 percent, unemployment in the Euro Area is at its highest level ever since 1960. Youth unemployment at 21.4 percent is nearly twice as high, in Spain and Greece it is even over 50 percent. A whole generation will be lost. Not surprisingly, political extremism is gaining ground. Economic growth has become negative for the second time since 2009. The Euro Area performs worse than either the United States or Japan, which have continued to grow moderately despite the nega-tive shocks from the global economy and despite rising public debt which has not pre-vented their governments from accessing financial markets. Clearly, Europe’s problems

N. 1 - 2 0 1 3
8
are to a large degree home-made. 4 Within Europe, the divergence of performances sharpens. New member states often surpass the old ones. Germany and other northern member states do reasonably well. The south is hardest hit. This has led some commentators to recommend the low per-formers to leave the Euro Area, as if it were a fixed exchange rate regime like the old European Monetary System. This is a profound misunderstanding, as we will show be-low. More moderately, others ask crisis countries “to do their homework” and imple-ment “necessary structural reforms”. The assumption is that if everyone cleans his own house, the city is clean (1). Yet, things are not that simple. When one lives in a condo-minium, it may be desirable that every party keeps their part of the staircase in order, but one still needs a property manager to repair the roof. Although it is true that many countries could improve their welfare by structural reforms, such as by reducing corrup-tion, eliminating discrimination in the labour market, increasing the incentives for in-vestment, etc., many national policies generate important externalities for Euro mem-ber states. Some of these externalities are positive because they ensure the efficient functioning of the internal market and generate economies of scale. Some are nega-tive because they generate collective action problems in the form of free-riding and moral hazard. In order to govern Europe’s common goods efficiently, a European government that takes care of citizens’ common interests would be need. Europe’s challenge today is, more than ever, political. 5 Confronted with the deteriorating economic environment, it has become fashionable to blame “the euro” and “construction mistakes” in Europe’s common currency. How-ever, there is nothing wrong with the functioning of monetary union or the euro, which operates exactly like any other currency in the world, such as in Switzerland, the UK, the USA or India. Europe’s problems result from the lack of a coherent and integrated sys-tem of economic governance. National governments act in the pursuit of the interests of their partial constituencies, but the Euro Area has no institutions to protect citizens against the negative externalities generated by others. When the Greek Karamanlis government deliberately broke the rules of the Stability and Growth Pact in order to win re-election, it caused harm to all Europeans, regardless whether they live in Greece, Italy, or Germany. When the Merkel Government tottered and swayed about rescuing banks and finally imposed harsh austerity on member states with financial troubles, it aggravated the crisis not only in Europe’s south, but it also made the bill for Germany more expensive. When Italy is incapable of giving itself a proper govern- (1) As the German Finance Minister Wolfgang Schäuble said: "Ein jeder kehr’ vor seiner Tür und sauber ist das Stadtquartier." Badische Zeitung, 13 4. 2013 (http://www.badische-zeitung.de/wirtschaft-3/ein-jeder-kehr-vor-seiner-tuer--40204678.html).

R A P P O R T O C E R
9 9
ment, it risks destroying half a century of European integration. The political and eco-nomic consequences of these developments are devastating. This situation can hardly last for long. 6 Is there an alternative to austerity? The United States have taken a very different pol-icy track, which seems more successful. Even the IMF is now recognising that the re-strictive European policy mix has slowed down growth significantly, while the United States and even Japan are improving their position. In these two economies public spending has made up for the losses in private consumption; this has stopped the negative feedback loop, which is particularly dramatic in Europe’s south, and the positive outlook has calmed financial markets. By contrast, in Europe the rigid imposi-tion of austerity on some member states has perpetuated the financial crisis; it has caused social and economic pain and damage in the short term; it has also de-stroyed productive capacity and caused long term harm. 7 Under these circumstances, credit-financed public spending should remain a policy option for the Euro Area in order to stimulate private economic activity. This would require suspending the rigid constraints of the Stability and Growth Pact and Fiscal Compact until the output gap has been closed again. Once the situation normalizes, a tight fiscal control regime is of course necessary to prevent similar crises in the fu-ture. In line with Council Regulation (EC) No 1056/2005of 27 June 2005 (amending Regulation (EC) No 1467/97 on speeding up and clarifying the implementation of the excessive deficit procedure, Article 1) the output gap criterion should also be in-cluded into the Fiscal Pact by which certain member states have introduced a so-called debt brake into their domestic budget policy programs. 8 While a fiscal stimulus is recommended in the Euro Area, its implementation cannot be generalised because the sustainability of public debt stands on stronger founda-tions in the north than in the south. The north should relax its fiscal stance and stimu-late the Euro economy as a whole; the south should adopt a neutral fiscal stance and stimulate private investment by improving competitiveness. The European Union budget should be strengthened in this strategy. 9 Clearly, Germany must play a major role in this context, given that it has had a bal-anced budget in 2012. In countries like Greece, Italy and Spain, rising public con-sumption will not have significant effects, especially when the potential growth rate is close to zero or negative. In these countries, private investment needs to be stimu-lated. Public investment in infrastructure could improve competitiveness, if it is well

N. 1 - 2 0 1 3
10
targeted, which is not likely given the widespread corruption in many southern states. 10 A quick way to create incentives for private investment is subsidising it, for example by granting high rates of early digressive tax depreciation for investment goods. This may cause a relatively small increase in the budget deficit due to lost income, but it would soon generate additional growth and thereby generate more tax revenue. 11 Improving competitiveness in low income regions of the Euro Area is crucial for long run catch up growth. Structural reforms should not focus on “flexible labour markets” as such, but rather on generating productivity gains for labour, capital and absorb-ing technological progress. Italy is an example that the flexibility in the informal economy and rigidity in the formal sector have restrained potential growth, techno-logical progress and higher productivity. The number of firms must be reduced and the size of firms must be increased, if labour productivity is to be improved. 12 Wage bargaining must take into account not only local labour productivity, but also capital productivity. However, because unit labour cost have such an important im-pact on relative returns on capital and therefore competitiveness, European trade unions and employers should think about improved cross-border wage coordination. Otherwise, issues of social justice could undermine the acceptance of the European integration project. 13 Whether European integration and the euro are worth having is becoming increas-ingly a topic for discussion in Europe. The British Prime minister has proposed a refer-endum about the UK’s future in the Union. In Italy, Greece and France, important po-litical parties have put exit from the euro into their programs. In Germany, a new party proposes the return to the deutschmark and is credited enough votes by opin-ion polls that it may be represented in the next parliament after the elections in Sep-tember. 14 But the return to the nation state is not a way out of Europe’s dilemma. If left and right wing critics wish to use the traditional nation state in order to pursue alternatives to austerity, they will inevitably generate external effects for those Europeans who live and work in neighbouring member states. These policy spillovers will reduce wel-fare in Europe – at home and abroad. For the same reason it is impossible to close the democratic deficit by involving national parliaments to a greater degree in Euro-pean policy making. The only efficient and democratic solution consists in European

R A P P O R T O C E R
11 11
citizens appointing an agent who represents their collective interests. Such a unified agent, a European (economic) government, would be able to defend their com-mon interest if it were democratically legitimated by elections for the European Par-liament. Such a government should be able, for example, to implement a genuine banking union; it should define and enforce a fiscal policy for the Euro Area that pre-serves debt solvency; it should direct funds to public investment such as research and development, trans-European infrastructure, the ecological transformation of Europe’s industrial model and achieving a fair redistribution of social welfare. Such a European government would create a different Europe. A Europe that overcomes the obsession with austerity and designs a new model for economic growth. A Europe, where citizens are at home.


R A P P O R T O C E R
13 13
Supply and demand imbalances
The impact of the crisis 1 Austerity is a policy of reducing aggregate demand in an economy, not by mone-tary policy but by cutting deficits through lower public expenditure and rising taxes or by reducing private consumption through lower wages and increased savings. It of-ten implies less investment and less public service, higher unemployment and more wage restraint. When the policy purpose is to reduce current account deficits, aus-terity is unavoidable as current account deficits are always equal to the sum of budget deficits and the investment-savings relation. Aggregate demand is determined by spending on investment goods, private and public consumption plus the demand from the rest of the world. Under normal condi-tions, private demand for investment and consumption responds to interest rates and monetary policy, but in a severe crisis where trust in banks has vanished and general uncertainty blocks credit to firms and households, the government must step in. Pub-lic spending financed by public borrowing can then compensate for insufficient pri-vate demand. However, this is only justified as long as public spending does not ig-nite inflation. 2 In order to assess whether austerity is a desirable policy or not, a benchmark is needed. This is the output gap, which is the difference between actual and potential GDP. A positive output gap implies that aggregate spending (demand) in the econ-omy exceeds the potential supply, so that excess demand pushes up prices. In that case, austerity is recommendable in order to stabilize the economy. Alternatively, a negative output gap implies a lack of demand and may push down prices or, more likely, dampen entrepreneurs' willingness to invest, thereby decreasing potential out-put capacity and weakening employment. In that case, demand must be stimu-lated by increasing private and public spending in order to stabilize the economy. Thus, one has to distinguish clearly between the levels of aggregate spending rela-tive to the value of potential output, and the changes in spending, which reflect stimulus and austerity. Whether austerity is good or bad depends on the specific posi-tion of the economy. See table 1. 3 Productive capacity or potential output is defined as the level of output that an economy can produce at a constant inflation rate. There are many ways to estimate

N. 1 - 2 0 1 3
14
potential GDP; some rely on purely statistical methods, such as the HP-filter, others use production functions of which the Cobb-Douglas function is the most popular. This method, which is also used by European institutions (2) and the US Congressional Budget Office (3), depends on a growing capital stock and assumes non-inflationary full employment of the labour force, and a steady rate of technological progress (To-tal Factor Productivity - TFP, also called Solow residual). More recently, work at the BIS has shown that incorporating information about the financial cycle is important to improve measures of potential output and it had used this information to calculate “finance-neutral” output gaps (4). However, the European Commission has argued that while such financial information may be useful for early warning signals, the fi-nance neutral output gaps could cause many “false alarms”, while producing im-plausibly small and too rapidly closing post-crisis output gaps (5). We will use the data provided by the European Commission in the Ameco base. Table 1. Economic policy options
Excess demand Demand gap
Stimulus is: bad goodAusterity is: good bad
4 The global financial crisis, triggered by the Lehman bankruptcy in 2008, was a major shock in most economies of the globe. Lack of effective demand pushed actual GDP below potential output. Output gaps became negative everywhere. Figure 1 shows evidence from the Euro Area, some selected member states, and the United States. The fall in income is significant everywhere. In the Euro Area as a whole, and especially in the crisis economies in the South, actual GDP is lagging far behind po-tential. By contrast, in the United States the gap is closing again.
(2) See: Cécile Denis, Daniel Grenouilleau, Kieran Mc Morrow and Werner Röger, 2006. Calculat-ing potential growth rates and output gaps - A revised production function approach; European Economy, Number 247, March ; http://ec.europa.eu/economy_finance/publications/publication746_en.pdf. (3) See: Congressional Budget Office, 2004. A Summary of Alternative Methods for Estimating Po-tential GDP Background Paper; The Congress of the United States http://www.cbo.gov/sites/default/files/cbofiles/ftpdocs/51xx/doc5191/03-16-gdp.pdf. (4) See: Claudio Borio, Piti Disyatat and Mikael Juselius, 2013. Rethinking potential output: Embed-ding information about the financial cycle; BIS Working Papers No 404, February Monetary and Economic Department. http://www.bis.org/publ/work404.pdf. (5) European Commission, 2013. European Economic Forecast Spring 2013. European Economy 2/2013.

R A P P O R T O C E R
15 15
Figure 1. Actual and potential GDP for selected economies
6,400
6,800
7,200
7,600
8,000
8,400
8,800
1996 1998 2000 2002 2004 2006 2008 2010 2012 2014
Euro Area
1,900
2,000
2,100
2,200
2,300
2,400
2,500
2,600
1996 1998 2000 2002 2004 2006 2008 2010 2012 2014
Germany
1,300
1,400
1,500
1,600
1,700
1,800
1,900
1996 1998 2000 2002 2004 2006 2008 2010 2012 2014
France
1,250
1,300
1,350
1,400
1,450
1,500
1996 1998 2000 2002 2004 2006 2008 2010 2012 2014
Italy
640
680
720
760
800
840
880
920
960
1,000
1996 1998 2000 2002 2004 2006 2008 2010 2012 2014
Spain
130
140
150
160
170
180
190
200
210
220
1996 1998 2000 2002 2004 2006 2008 2010 2012 2014
Greece
80
100
120
140
160
180
200
1996 1998 2000 2002 2004 2006 2008 2010 2012 2014
Ireland
124
128
132
136
140
144
148
152
156
160
164
1996 1998 2000 2002 2004 2006 2008 2010 2012 2014
Portugal
6
7
8
9
10
11
12
13
14
1996 1998 2000 2002 2004 2006 2008 2010 2012 2014
Estonia
2,000
2,200
2,400
2,600
2,800
3,000
3,200
3,400
1996 1998 2000 2002 2004 2006 2008 2010 2012 2014
Sweden
900
1,000
1,100
1,200
1,300
1,400
1996 1998 2000 2002 2004 2006 2008 2010 2012 2014
Actual GDP Potential GDP
United Kingdom
9,000
10,000
11,000
12,000
13,000
14,000
15,000
1996 1998 2000 2002 2004 2006 2008 2010 2012 2014
United States
Euro Lehman
Source: AMECO. 5 While most economies outside Europe have managed to slowly return to the growth path of their potential capacity, the Euro Area has failed to do the same. The differ-ence between the United States and Europe is revealing. In America, domestic de-mand, i.e. the mix of private and public consumption and investment, has picked up and is nearly absorbing potential output again. In the Euro Area, domestic drivers of growth are by and large absent and the little demand there is comes from net ex-ports into the rest of the world. Furthermore, we observe that the growth of potential output has slowed down since the crisis started. Thus, the crisis has not only done temporary damage, which will be overcome in time, but it has also done structural damage, which will not improve without counteracting policies. With lower invest-

N. 1 - 2 0 1 3
16
ment, potential output is shrinking, because employment is destroyed, skills are erod-ing, labour force participation rates are falling, and productive infrastructure is worn out. These depressing effects will prevent the consolidation of public debt and raise the probability of private sector defaults and bankruptcies. The Euro crisis is the mani-festation of such a negative feedback loop. It can only be stopped by stimulating in-vestment again. 6 Nevertheless, some European economies, notably Germany and Sweden, have al-ready pulled out of the recession and are producing output at their potential capac-ity again; Estonia, which is sometimes named a successful adjustment example, has also returned to growth, although its productive capacity has not improved during the crisis. In the rest of Europe, one can observe a common adjustment feature: the output gap is closing, not only because demand is returning, but because supply capacities are reduced, or at least because potential growth is slowing down. This slowdown translates into rising structural unemployment and exploding public debt. An exit from the crisis requires, therefore, not only structural reforms to improve the supply side potential of the Euro Area’s member states, but also effective demand sufficient to absorb the potential output. The imbalance of demand and supply in the Euro Area 7 The output gap measures the imbalance between demand and supply. Figure 2 re-veals that since it started, the Euro Area has experienced two booms where demand has exceeded supply capacities: the first in 1999-2000, the second from 2005 to the financial crisis. The early so-called dot.com bubble was more moderate and driven by investment in new technologies. When it collapsed, the resulting asset price defla-tion caused a slowdown that pushed the output gap into negative terrain in some member states. Yet, given the relative limited role of the IT sector, the crash did not affect all economies to the same degree. The unwinding of excess demand in 2000 was relatively slow and did therefore not cause a deep crisis, especially when com-pared with the financial crisis in 2008, because a bubble in the housing market has far more nasty effects, as we discovered after 2007. In the early years of European monetary union several member states continued to experience excess demand, notably Italy, Spain and also France. By contrast, demand fell below potential in the northern economies like Germany, the Netherlands, and Finland where IT-related in-vestment had been important. In Portugal, shrinking internal and external demand also affected the output gap negatively. 8 In response to the dot-com crash in 2000 and also after the New York 9-11 attack in 2001, monetary and fiscal policies were world-wide highly accommodating. This con-

R A P P O R T O C E R
17 17
tributed to the over-accumulation of capital in the mid-2000s. Between 2002 and 2005, the Euro Area as a whole experienced a period of demand and supply equilib-rium. The second boom took off in 2005 and lasted until 2007-8, when trouble from the USA spilled over into Europe, first with the Bear Stern bailout in 2007, followed by the Lehman crash in 2008. Since then very large negative output gaps have persisted nearly everywhere. In Greece they are of a historically unprecedented size. Thus, the predominant problem in the European economy today is a lack of demand that widens the output gaps. Nevertheless, in some member states structural reforms may also be necessary to improve the economic potential. This is particularly true for Italy. Figure 2. Output gaps
-4
-2
0
2
4
2000 2002 2004 2006 2008 2010 2012 2014
Gap Euro area (12 countries)
-6
-4
-2
0
2
4
2000 2002 2004 2006 2008 2010 2012 2014
Gap Germany
-4
-2
0
2
4
2000 2002 2004 2006 2008 2010 2012 2014
Gap Italy
-4
-2
0
2
4
2000 2002 2004 2006 2008 2010 2012 2014
Gap France
-6
-4
-2
0
2
4
6
2000 2002 2004 2006 2008 2010 2012 2014
Gap Finland
-4
-2
0
2
4
2000 2002 2004 2006 2008 2010 2012 2014
Gap Netherlands
-6
-4
-2
0
2
4
6
2000 2002 2004 2006 2008 2010 2012 2014
Gap Ireland
-6
-4
-2
0
2
4
2000 2002 2004 2006 2008 2010 2012 2014
Gap Spain
-6
-4
-2
0
2
4
2000 2002 2004 2006 2008 2010 2012 2014
Gap Portugal
-16
-12
-8
-4
0
4
2000 2002 2004 2006 2008 2010 2012 2014
Gap Greece
-4
-2
0
2
4
2000 2002 2004 2006 2008 2010 2012 2014
Gap United Kingdom
-4
-2
0
2
4
2000 2002 2004 2006 2008 2010 2012 2014
Gap United States
Source: AMECO.

N. 1 - 2 0 1 3
18
The mystery of growth 9 The economic literature usually interprets output gaps as a cyclical variation around a long run growth trend, which is determined by labour and capital input and tech-nological improvement. Thus, the economy’s supply side is exogenous, and aggre-gate demand has to adjust. For new classical economists this adjustment happens automatically if markets are allowed to operate flexibly; for Keynesians some de-mand management by means of monetary and fiscal policy is required to minimise the output gap. However, the crisis teaches us that both these approaches have missed the fact that the supply side may respond endogenously to demand condi-tions, as will be proven below. 10 In Figure 3 we see the long run growth rates of economic potential growth over half a century. Under the Bretton Woods regime, economic capacity has increased more rapidly in Europe than in the USA, but thereafter growth rates came down every-where. Data for the Euro Area only start after the Maastricht Treaty, but before the crisis, potential growth in the Euro Area 12 was above 1.5 percent. Thereafter, it dropped below 0.5 percent. By contrast, in the United States potential growth has oscillated around 3 percent until the early 2000s, and then it fell to 2 percent. The fi-nancial crisis has reduced this rate further, but recently the economy has improved again. Among individual Euro member states, Italy stands out as the country with a continuously deteriorating growth capacity, largely because of falling and now even negative rates of productivity growth. By contrast, Ireland, Greece and Spain have improved their capacities in the 1980s and 90s. Germany also has had a long run trend of decelerating growth, although this has been distorted by the temporary ef-fects of unification. Against its historic record, Germany only looks good today be-cause the rest of Europe is doing so badly; its traditional characteristic of a slow-growth economy is masked by the troubles in competing economies. In fact after the Lehman crisis in 2008, all economies, other than Germany and the United States, have experienced a drastic deterioration of potential growth. Hence, it is not correct to interpret the growth potential as a stable trend. 11 By definition, economic growth is a long run phenomenon. But the long run consists of a succession of short runs. Supply-side factors determine the long run; demand-side factors the short run. Because the observed growth rates always amalgamate supply and demand factors, it is difficult to disentangle these individual factors. Clas-sical economic growth theory has focussed on the efficient allocation of factors of production and their accumulation over time. In neoclassical models savings and the accumulation of physical capital is the driver of growth, but the constraints imposed

R A P P O R T O C E R
19 19
Figure 3. Economic potential growth rates
.004
.008
.012
.016
.020
.024
.028
.032
60 65 70 75 80 85 90 95 00 05 10
Euro area
.00
.01
.02
.03
.04
.05
60 65 70 75 80 85 90 95 00 05 10
Germany
.00
.01
.02
.03
.04
.05
.06
60 65 70 75 80 85 90 95 00 05 10
Netherlands
.00
.01
.02
.03
.04
.05
.06
60 65 70 75 80 85 90 95 00 05 10
France
-.01
.00
.01
.02
.03
.04
.05
60 65 70 75 80 85 90 95 00 05 10
Italy
-.02
.00
.02
.04
.06
.08
60 65 70 75 80 85 90 95 00 05 10
Spain
-.02
.00
.02
.04
.06
.08
60 65 70 75 80 85 90 95 00 05 10
Portugal
-.02
.00
.02
.04
.06
.08
.10
60 65 70 75 80 85 90 95 00 05 10
Ireland
-.04
-.02
.00
.02
.04
.06
.08
60 65 70 75 80 85 90 95 00 05 10
Greece
.005
.010
.015
.020
.025
.030
.035
.040
60 65 70 75 80 85 90 95 00 05 10
Sweden
.005
.010
.015
.020
.025
.030
.035
60 65 70 75 80 85 90 95 00 05 10
United Kingdom
.00
.01
.02
.03
.04
60 65 70 75 80 85 90 95 00 05 10
United States
Bre
tton
Woo
ds e
nds
Def
latio
n po
licy
star
ts
Maa
stric
htEuro
Lehm
an
Source: AMECO. on the production function yield diminishing returns. This has the advantage that the economy converges to a long run steady state growth rate. In this context, the sav-ings rate is an essential variable for explaining economic growth. 12 However, in the long run, improvements of productivity are dominating all other fac-tors. Endogenous growth theory has observed that productivity depends on skills and technology, which will improve with economic growth, so that the growth of produc-tivity is endogenous to the overall increases in output. A long line of research has identified Research & Development (R&D) spending, human capital accumulation (education, skills and training), public infrastructure, labour market flexibility and a

N. 1 - 2 0 1 3
20
number of efficiency variables as prominent explanations for the rate of technologi-cal progress, although the deeper causes of economic growth are still not fully un-derstood. Helpman (6) has therefore eloquently spoken of “the mystery of growth”. 13 Nevertheless, a crucial variable is the accumulation of fixed capital, because it in-corporates technological progress. For example, buying a new computer with faster chips will increase productivity on many levels. Furthermore, spending savings on in-vestment goods rather than on financial securities generates income and stimulates demand. Figure 4 presents the growth rates of the stock of fixed capital. Comparing the graph with figure 3 reveals that for certain countries and periods, potential output growth is closely correlated with capital accumulation, although changes in produc-tivity and in the labour force can generate important divergences. Most significantly, we find in all economies a clear deterioration of capital accumulation after 2008. This phenomenon has also been observed in the USA, where the Federal Reserve Bank of Cleveland has explained: “The (…) recession damaged the supply side of the economy, temporarily reduced the potential growth rate and permanently shifted the future path of potential out-put downward. … It is quite typical to see potential GDP slowing down after the economy enters a recession. This is because investment generally falls during an economic contraction, which slows down capital accumulation and reduces the growth rate of potential GDP. In the most recent downturn, however, the drop in in-vestment has been exceptionally large and persistent, and this has caused potential GDP to decelerate more and for longer than is typical.” (7) Hence, investment is an important variable for restoring economic growth. According to the production function used by the European Commission, the impact of capital on potential growth in the Euro Area is twice as strong as that of labour, and during the boom years 2003-2007 it was nearly 50 percent higher than of total factor productivity (8). Nevertheless, since 2008, negative developments in the Euro-pean labour markets have overshadowed the contribution of capital accumulation, because the Commission estimates that the so-called “Non-Accelerating Wage Rate of Unemployment”, or NAWRU, has increased during the crisis, so that the labour component in the production function for potential output has actually fallen by 3 percent. However, according to the Commission’s methodology, “the NAWRU should go back to its original level with no impact on potential output in the long run”
(6) Helpman, E. (2004), The Mystery of Economic Growth, MIT Press. (7) Margaret Jacobson and Filippo Occhino, 2013. Behind the Slowdown of Potential GDP, Fed-eral Reserve Bank of Cleveland, Economic Trends 02.12.13. http://www.clevelandfed.org/research/trends/2013/0213/01gropro.cfm. (8) European Commission, 2013. European Economic Forecast Spring 2013. European Economy 2/2013:12.

R A P P O R T O C E R
21 21
(9). If this were true, and it is a big “if”, the fall in potential output observed in the crisis economies would stop over time, although the growth rate would be largely driven by capital accumulation. In fact, it is capital accumulation that determines the growth rate of the economy’s supply capacity. Figure 4. Growth rates of fixed capital stock
0
1
2
3
4
5
60 65 70 75 80 85 90 95 00 05 10
Euro area (12 countries)
0
1
2
3
4
5
60 65 70 75 80 85 90 95 00 05 10
GERMANY
0
1
2
3
4
5
6
60 65 70 75 80 85 90 95 00 05 10
NETHERLANDS
0
1
2
3
4
5
6
60 65 70 75 80 85 90 95 00 05 10
FRANCE
0
1
2
3
4
5
6
60 65 70 75 80 85 90 95 00 05 10
ITALY
0
2
4
6
8
60 65 70 75 80 85 90 95 00 05 10
SPAIN
-2
0
2
4
6
8
60 65 70 75 80 85 90 95 00 05 10
PORTUGAL
-2
0
2
4
6
8
60 65 70 75 80 85 90 95 00 05 10
IRELAND
-2
0
2
4
6
8
10
60 65 70 75 80 85 90 95 00 05 10
GREECE
0
1
2
3
4
5
60 65 70 75 80 85 90 95 00 05 10
SWEDEN
0
1
2
3
4
60 65 70 75 80 85 90 95 00 05 10
United Kingdom
0
1
2
3
4
60 65 70 75 80 85 90 95 00 05 10
United States
BrettomWoods
Euro
Lehm
an
Source: AMECO and own calculations.
(9) Francesca D'Auria, Cécile Denis, Karel Havik, Kieran Mc Morrow, Christophe Planas, Rafal Raciborski, Werner Röger and Alessandro Rossi . 2010. The production function methodology for calculating potential growth rates and output gaps; European Economy. Economic Papers. 420. July 2010. Brussels: page 36.

N. 1 - 2 0 1 3
22
14 Figure 4 indicates some important structural weaknesses. For example in Italy, and to a lesser degree in Germany, capital accumulation has slowed down persistently and with a stable trend over the last 50 years. In most countries the investment slowdown has accelerated since the late 1990, which coincides with monetary union, but we find the same phenomenon in the United States so that we must not jump to quick conclusions about the impact of EMU. Nevertheless, capital accumulation does af-fect growth, although the actual effects were mitigated by developments in the la-bour market and factor productivity. The impact of austerity on investment and economic growth 15 Because we are interested in the interaction of austerity and growth, we are not analysing the structural supply side factors any further, although they are without any doubt important for explaining differences in the long run economic performance between member states. Notably Italy has to find a solution to its falling and negative productivity trends. Instead, we wish to find out how the lack of effective demand is affecting short run investment decisions, which then accumulate to generate long run growth effects. However, from this perspective, demand management is not just a matter of avoiding cyclical variations around the long run trend of a steadily grow-ing economy. It is also about generating an environment, which sets incentives for productive investment and entrepreneurial initiative. Hence, demand management is in the long run more complex than simply stabilising the business cycle, because potential output is not static. 16 The complication derives from the fact that a negative output gap (i.e. a lack in demand relative to potential output capacities) will affect the rate of investment and therefore the level of the capital stock as well as the development and adapta-tion of technological innovation. By contrast, a positive output gap ignites inflationary pressures, which will be met by restrictive monetary policies and these will also re-duce investment and growth. 17 Hence, there are two channels through which aggregate demand will affect future potential output: first, a negative output gap is an indicator for insufficient market opportunities. A negative output gap will therefore lower investment and future out-put, especially when the lack of demand is persisting for a long time. Second, the dynamics of market opportunities can be measured by the difference between ac-tual and potential GDP. If the gap is negative, there is no incentive to increase pro-duction. If actual GDP grows faster than potential, a negative gap is closing; if it lags behind potential, the market dynamic worsens and this will accelerate the loss of in-

R A P P O R T O C E R
23 23
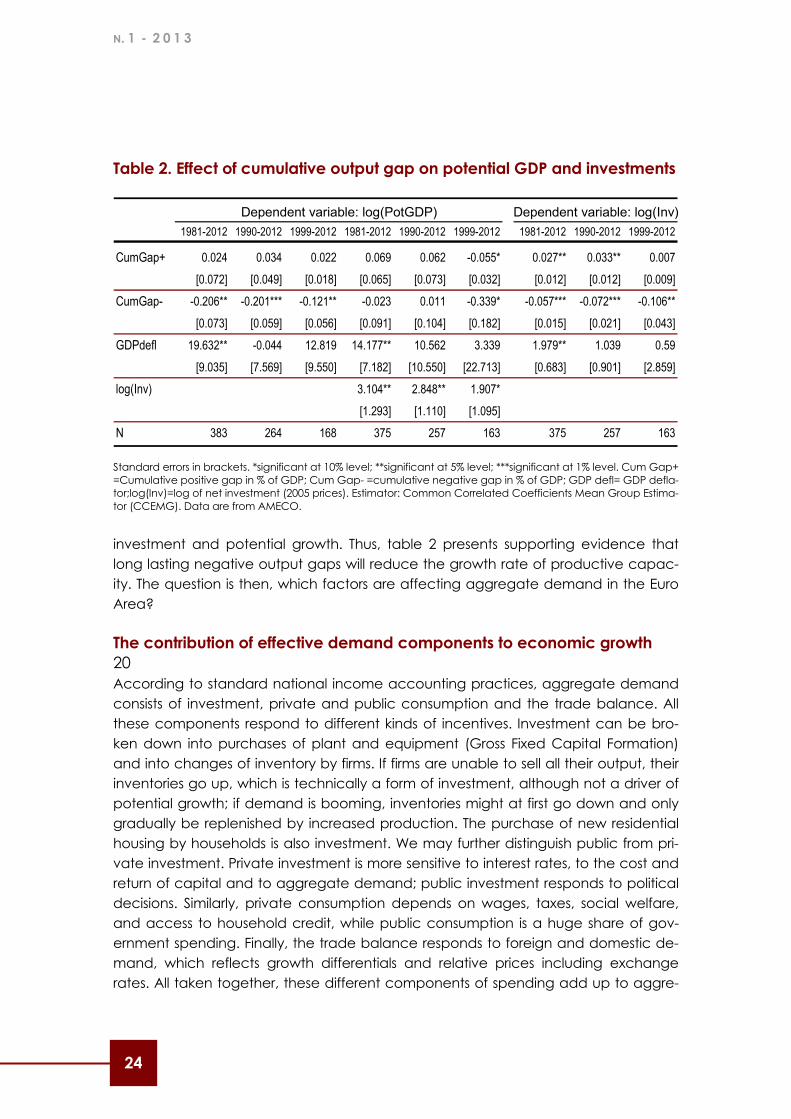
vestment and potential growth. Thus, a negative differential between actual and po-tential GDP growth leads to a negative feedback loop, which will cause the econ-omy to stagnate or shrink. If demand exceeds supply, prices go up. This may gener-ate some investment to expand capacity, but if inflation is repressed, the effect will be short-lived (10). Thus, when estimating the effects of demand on potential GDP, we should not only consider the size of the output gap, but also its duration. 18 To test whether this hypothesis of a long run reduction in the potential growth rate due to insufficient demand holds up, we have estimated a panel regression for Euro Area member states, where the dependent variable in the first part is the potential growth rate and in the second the investment rate. As regressors we have taken the cumulative output gap between the moments when it switches from positive to negative or the other way round. Because a positive output gap is inflationary, we have also added the GDP deflator and separated periods with positive and nega-tive cumulated gaps. Finally, we have also added the variable for investment, which catches all kinds of structural influences. 19 The results in table 2 support our hypothesis. Prolonged negative output gaps in the Euro Area will reduce potential GDP, because the lack of demand will disincentivize investment (columns 1-3) (11). This phenomenon is less clear for the 1990-2012 period, which is dominated by many structural reforms due to the creation of the European internal market. This can be seen in column 5, where the investment variable catch-ing structural effects is strongly significant. However, for the monetary union era 1999-2012, our model is well supported by the data: a negative cumulated output gap lowers the potential growth rate, while structural reforms increase capital accumula-tion and raise the growth potential. The channel through which this effect is gener-ated is the rate of investment, which reduces potential output, the longer and larger the output gap remains negative. Inflation does not matter, presumably because the ECB has been successful in maintaining price stability. This may also be the reason, why positive output gaps do not generate higher growth: excess demand, which could generate inflation, will be countered by higher interest rates, which will reduce
(10) The Lucas supply curve has modelled investment and growth as a temporary reaction to in-flation due to misperceptions of suppliers who cannot distinguish price rises for their own products from general inflation, so that production is cut back to the “normal” rate of output and growth. We argue here that if monetary policy aims at price stability, there is an asymmetry in adjustment, because the positive temporary growth effects are more modest than in the Lucas curve, while negative demand effects reduce the natural rate. (11) The negative gap is expressed in absolute terms so that a negative sign signals that an in-creasing negative gap will reduce potential GDP.
N. 1 - 2 0 1 3
24
Table 2. Effect of cumulative output gap on potential GDP and investments
Dependent variable: log(PotGDP) Dependent variable: log(Inv)1981-2012 1990-2012 1999-2012 1981-2012 1990-2012 1999-2012 1981-2012 1990-2012 1999-2012
CumGap+ 0.024 0.034 0.022 0.069 0.062 -0.055* 0.027** 0.033** 0.007[0.072] [0.049] [0.018] [0.065] [0.073] [0.032] [0.012] [0.012] [0.009]
CumGap- -0.206** -0.201*** -0.121** -0.023 0.011 -0.339* -0.057*** -0.072*** -0.106**[0.073] [0.059] [0.056] [0.091] [0.104] [0.182] [0.015] [0.021] [0.043]
GDPdefl 19.632** -0.044 12.819 14.177** 10.562 3.339 1.979** 1.039 0.59[9.035] [7.569] [9.550] [7.182] [10.550] [22.713] [0.683] [0.901] [2.859]
log(Inv) 3.104** 2.848** 1.907*[1.293] [1.110] [1.095]
N 383 264 168 375 257 163 375 257 163
Standard errors in brackets. *significant at 10% level; **significant at 5% level; ***significant at 1% level. Cum Gap+ =Cumulative positive gap in % of GDP; Cum Gap- =cumulative negative gap in % of GDP; GDP defl= GDP defla-tor;log(Inv)=log of net investment (2005 prices). Estimator: Common Correlated Coefficients Mean Group Estima-tor (CCEMG). Data are from AMECO.
investment and potential growth. Thus, table 2 presents supporting evidence that long lasting negative output gaps will reduce the growth rate of productive capac-ity. The question is then, which factors are affecting aggregate demand in the Euro Area? The contribution of effective demand components to economic growth 20 According to standard national income accounting practices, aggregate demand consists of investment, private and public consumption and the trade balance. All these components respond to different kinds of incentives. Investment can be bro-ken down into purchases of plant and equipment (Gross Fixed Capital Formation) and into changes of inventory by firms. If firms are unable to sell all their output, their inventories go up, which is technically a form of investment, although not a driver of potential growth; if demand is booming, inventories might at first go down and only gradually be replenished by increased production. The purchase of new residential housing by households is also investment. We may further distinguish public from pri-vate investment. Private investment is more sensitive to interest rates, to the cost and return of capital and to aggregate demand; public investment responds to political decisions. Similarly, private consumption depends on wages, taxes, social welfare, and access to household credit, while public consumption is a huge share of gov-ernment spending. Finally, the trade balance responds to foreign and domestic de-mand, which reflects growth differentials and relative prices including exchange rates. All taken together, these different components of spending add up to aggre-

R A P P O R T O C E R
25 25
gate demand, or GDP, and one can calculate their respective contributions to the overall growth rate. 21 Figure 5 shows the contribution of these demand components to the GDP growth rates. It is remarkable that since the early 1990s, investment has been absent as a driver of growth in the Euro Area as a whole. Private and public consumption were the most important components, followed by net exports into the rest of the world. But since the financial crisis, domestic consumption has faltered and Euro Area growth is nearly exclusively dependent on trade. This is different in the United States, where investment plays a role in raising growth, although over the last 25 years the most important factor of demand has been the private consumption boom. Among the individual member states of the Euro Area, trade surpluses have crowded out domestic demand in the Netherlands and Germany, most of which was due to net exports within the European Union (12). In Germany there was hardly any contri-bution from private or public consumption. In Italy all components were weak. France, Portugal, Greece and Ireland went through a consumer boom after they joined monetary union; the UK did the same on the outside. In Italy, public consump-tion was important in the first years of EMU. Thus, the gains from monetary union where consumed instead of being used for the reduction of public debt. High growth in Spain was dominated by investment and private consumption. After the financial crisis, private consumption, investment and exports have turned negative every-where and variations in inventory became the shock-absorbing buffer. Nevertheless, Germany has pulled out of the recession already in 2010 due to a balanced mix of exports, investment and private consumption complemented by public spending. France tried the same, but it was not supported by exports. In most other countries consumption remained flat and growth was depressed by foreign trade and nega-tive investment. Greece is characterized by a collapse of private consumption, in-vestment and exports and an absence of public consumption. In Ireland, net exports have compensated the negative growth of domestic demand, while in Portugal ex-ports and investment are pushing the economy down. Thus, the lack of lack domes-tic demand has worsened in and after 2011 and austerity has become the only pol-icy alternative. 22 Demand management must be seen in its economic context and over time. As we saw in table 1, there are times when the economy must be stimulated and there are times when austerity is justified. Clearly, in Europe today, stimulating the economy is a
(12) Collignon, S., (2013) “Macroeconomic imbalances and competitiveness in the euro area”, Trasfer: Eurpean Review of Labour and Research, 19(1), 63-87.

N. 1 - 2 0 1 3
26
Figure 5. Demand contributions to GDP growth
-2
-1
0
1
2
3
4
90 92 94 96 98 00 02 04 06 08 10 12 14
Euro Area
-6
-4
-2
0
2
4
6
90 92 94 96 98 00 02 04 06 08 10 12
Germany
-6
-4
-2
0
2
4
90 92 94 96 98 00 02 04 06 08 10 12
Italy
Euro Lehman Monti
-4
-3
-2
-1
0
1
2
3
4
5
90 92 94 96 98 00 02 04 06 08 10 12
France
-12
-8
-4
0
4
8
90 92 94 96 98 00 02 04 06 08 10 12 14
Finland
-6
-4
-2
0
2
4
6
8
10
90 92 94 96 98 00 02 04 06 08 10 12 14
Netherlands
-12
-8
-4
0
4
8
12
90 92 94 96 98 00 02 04 06 08 10 12
Ireland
-8
-6
-4
-2
0
2
4
6
8
90 92 94 96 98 00 02 04 06 08 10 12
Spain
-8
-4
0
4
8
12
90 92 94 96 98 00 02 04 06 08 10 12
Portugal
-12
-8
-4
0
4
8
12
90 92 94 96 98 00 02 04 06 08 10 12
Inventories GFCF Private consumption Public consumption Trade balance
Greece
Euro
-6
-4
-2
0
2
4
6
90 92 94 96 98 00 02 04 06 08 10 12
United Kingdom
-6
-4
-2
0
2
4
6
90 92 94 96 98 00 02 04 06 08 10 12
United States
Source: AMECO. must. The policy objective should be to keep the demand for goods and services in balance with the capacity of supply. How can this be achieved? Conventional Keynesian policies suggest using debt-financed fiscal policy, especially when interest rates are close to their nominal lower bound of zero because monetary policy then loses its power. Japan has demonstrated that when interest rates are low, high public debt levels are not necessarily a heavy burden for tax payers. However, while Japa-nese fiscal policy may have prevented the collapse of the economy, it is hardly an inspiring example for a successful growth strategy. The European policy consensus in Brussels and Berlin has rejected fiscal policy as an instrument for stimulating the Euro-pean economy because public debt levels are already high, at least when com-pared against the Maastricht criteria whereby debt must not exceed 60 percent of GDP. But this rejection is grounded more on dogmatic principles than on a thorough

R A P P O R T O C E R
27 27
analysis of what fiscal policy can do. This is revealed by a study done by the IMF (13). The smaller the fiscal multipliers, i.e. the growth impact of fiscal policy, the less costly are fiscal consolidations. The IMF found that many international organisations and forecasters, including the European Commission, have used a fiscal multiplier of 0.5, while the correct figure has been in the range of 0.9 to 1.7. In other words, policy recommendations by the Commission err on the side of excessive restrictiveness. The consequences are slow growth in Europe. 23 In the long run, economic growth depends on the accumulation of human and physical capital and on productivity and technological progress. However, whether capital is accumulated or not depends on a set of conditions, which must render the return on physical and human investment persistently more attractive than alterna-tive forms of investment. These conditions cover a wide range of supply-side factors that are usually summarised under the term of “competitiveness”. We will discuss these issues below. Nevertheless, demand-side factors also matter, as we saw above: if the output gap is negative, potential supply exceeds demand and there are no reasons why firms should invest into extending capacities and train their workforce. All they might do is buy equipment that increases productivity and reduces costs which would contribute to higher unemployment. For this reason, there is a role for fiscal policy: government spending can close the demand gap and help to absorb the potential output. However, if it exceeds the supply capacities, it becomes inflationary and damages growth. Thus, fiscal policy has the auxiliary function of keeping the economy in balance, but it is rather powerless in generating a sustained growth dy-namic by itself. The only exception is, and this is not negligible, but little understood, that public investment into education and infrastructure may increase total factor productivity. On the other hand, lack of demand, to which fiscal policy may contrib-ute, will slow down investment and economic growth. 24 In the European context, the demand effects of debt-financed government spend-ing are the big policy neglect. Instead, the focus has been put nearly exclusively on competitiveness issues. This policy is then justified by the claim that public debt is un-sustainable and requires urgent consolidation. In this chapter we will assess the situa-tion of public debt in Europe’s crisis countries. Thereafter we deal with competitive-ness.
(13) IMF, World Economic Outlook, 2012: 41

N. 1 - 2 0 1 3
28
BOX. 1 THE FISCAL MULTIPLIER AND ITS EFFECT ON GROWTH DURING THE CRISIS: A SURVEY With the global financial crisis and the subsequent debt crisis in the Euro Area a growing litera-ture has started to investigate the relation between fiscal policy and growth in times of crisis. We can summarize the existing literature into two blocks: a first group favours austerity in order to reduce external debt. The second group emphasises the role of fiscal multipliers during re-cessions, which are higher in a severe recession. Among the works of the first group, the influential paper by Rogoff and Reinhart (2010) argued that economic growth is slowing down when the debt ratio exceeds 90 percent and this justi-fied the implementation of austerity policies throughout the world. However, some severe flaws were recently discovered in data and calculations, which have put this position into the defensive. Similarly, the papers of Cwik and Wieland (2011), Boussard et al (2011) and Iltetzki et al. (2013), are opposing the use of fiscal stimuli. An intermediate position is taken by Barrel et al. (2012), Coenen et al (2012), Seidman (2012) and Corsetti et al. (2013). In the second group, arguments and estimates in favour of the assumption of a higher fiscal multipliers in times of crisis are provided by Blanchard and Leigh (2013), Christiano et al. (2011), Auerbach and Gorodnichenko (2011 and 2012), Delong and Summers (2012), Mittnik and Semmler (2011). Among the group of “anti-Keynesians”, Cwik and Wieland (2011) are highly critical to the use of fiscal stimuli during crisis periods and implicitly refuse the Keynesian assumption of spending-led recovery. They argue that the increase in government spending is more likely to crowed out private sector spending on consumption and investment. This is because, first, substantial lags in the implementation of stimulus packages exist, and second, consumers and firms an-ticipate higher tax burdens and higher interest rates in the future in order to pay back the debt and therefore reduce consumption and investment (so-called Ricardian equivalence argu-ment). Boussard et al (2012) consider the possibility that fiscal consolidation may lead to debt increases in the short run, because one-year multipliers of government spending are higher than usual in times of crisis. They consider these counterintuitive effects should last three years and then revert. However, if fiscal consolidation is repeated over time (i.e. not a one-time ad-justment) and the fiscal shock is persistent, the debt increases could become permanent. The authors further stress that for high debt countries the necessary time for the debt dynamics to turn negative can be as long as ten years. So, their conclusion suggest that in the current crisis, consolidation efforts should not be reverted as their effects in some countries like Italy and Greece could show up only after ten years. Iltetzki et al (2013) share the idea that fiscal stimuli are in general small and that their effect takes place with substantial lags, raising doubts on their usefulness as a stabilisation tool. In addition, they show that expansionary fiscal policy may be counterproductive in highly indebted countries. In any case, their analysis does not include the more recent period and while controlling for many country specific characteristics, the high number of countries in their sample does not allow their results to be comparable with the literature on the Euro Area.

R A P P O R T O C E R
29 29
The advocates of more Keynesian policies wish to use fiscal stimuli to restore growth without endangering the external debt position. They argue that the fiscal multiplier is substantially higher in times of crisis (Blanchard and Leigh 2013, Auerbach and Gorodnichenko 2011 and 2012, Mittnik and Semmler 2012). In addition, for many studies, the low (or zero) interest rate environment is a crucial condition for effectiveness of Keynesian spending measures (Delong and Summers 2012, Christiano et al 2011, Mittnik and Semmler 2012). Auerbah and Gorodnichenko (2011 and 2012) use a regime-switching model to calculate the size of fiscal multipliers in times of recession. They confirm the finding of other studies that fiscal multipliers are substantially higher in periods of recession, with military spending and public in-vestments are showing very high values. On a similar token, Mittnik and Semmler (2012) argue that the size of the fiscal multiplier depend on the state of the economy, with a higher effec-tiveness in times of below average growth. They find that in a low growth environment the fis-cal multiplier is one third higher than in times of high growth and that it goes back to its normal level after five years. Their result is based on the theoretical assumption that economic agents face different constraints in each of the two states. With below average growth, fiscal expan-sions are generating positive demand shocks which relax labour market and liquidity con-straints. The low interest rate environment is an important assumption for this effect to show up. Delong and Summers (2012) investigate the effectiveness of fiscal policy in depressed econo-mies, where interest rates are constrained by the zero lower bound and they conclude that in this situation fiscal policy can be highly effective as a stabilisation tool. However, expansionary fiscal policies must only be pursued on a temporary basis, which means that the stimulus should be withdrawn when the economy recovers. This is because with hysteresis and height-ened liquidity constraints in depression times, when interest rates hit the zero bound their effect on public debt is lower than that arising from GDP growth. Blanchard and Leigh (2013) analyse forecast errors in GDP and their relation to fiscal policy, and they conclude that early in the cri-sis the forecasters have assumed a multiplier of 0.5 from the pre-crisis levels, while the actual post-crisis value is substantially higher and close to 1. This would explain the lower than ex-pected effect of fiscal consolidation on economic growth. The weaker relation between fore-cast errors and fiscal stance in more recent years is an indication of the learning process among forecasters. Other studies indirectly produce evidence for a positive effect of countercyclical spending, although the relation with debt increases is not investigated. Barrel et al. (2012) use the NIGEM econometric model to calculate fiscal multipliers in 18 OECD countries. They find that in gen-eral, in most countries fiscal policy multipliers are small (0.3-0.5), but are negative when fiscal policy is tightened. This implies that tighter fiscal policy reduces growth in the short run in al-most all circumstances and they also find that this effect is larger for larger countries. Coenen et al. (2012) recognize that discretionary fiscal policy has been highly effective during the 2008-9 crisis by raising GDP by 1.6%. Nevertheless, they argue that these policies will lead to fu-ture debt increases. Their results, in any case, confirm the idea that fiscal multipliers are higher in times of crisis. Seidman (2012) advocates the use of Keynesian fiscal stimuli during

N. 1 - 2 0 1 3
30
recession, as it happened in the recent global financial crisis, but he worries about the possibil-ity that fears of debt insolvency may worsen the recession if Keynesian policies are no longer perceived as temporary (as argued by Delong and Summers, too). The author further suggests that consolidation efforts should be concentrated in times of prosperity. Similar conclusions are shared by Corsetti et al. (2012). On the one hand, they also find that the fiscal multiplier is higher in times of recession, but on the other hand they warn that this outcome could be pos-sible only when concerns about the fiscal and debt sustainability are absent. Applying this conclusion to the present Euro Area situation, the panic among investors caused by the Greek crisis and the uncertainty about the sustainability of public finances, would have reduced, if not nullified, the effectiveness of stimulus measures.
Summing up, while some contributions are against the use of fiscal spending in order to stimu-late growth, most of the recent work has taken the opposite view. It must be stressed, how-ever, that even among authors in favour of consolidation and austerity, the idea that the fiscal multiplier is higher during times of low economic activity is not universally rejected, leading to a general consensus on this assumption.
References Auerbach A.J., Gorodnichenko Y., (2011) “Fiscal Multipliers in Recessions and expansions” NBER Working Paper, 17447. Auerbach A.J.,Gorodnichenko,Y., (2012) “Measuring the output responses to fiscal policy”, American Economic Journal: Economic Policy 4(1), pp: 1–27. Barrel R., Holland D., Hurst I., (2012) “Fiscal multipliers and prospects for consolidation”, OECD Journal: Economic Studies, 2012(1), pp: 71-102. Blanchard O., Leigh D., (2013) “Growth Forecast Errors and Fiscal Multipliers”, IMF Working Paper, 13/1. Boussard J., De Castro F., Salto M., (2012), “Fiscal Multipliers and Public Debt Dynamics in Con-solidations”, European Economy Economic Papers, 460. Christiano L., Eichenbaum M., Rebelo S., (2011), “When is the government spending multiplier large?”, Journal of Political Economy, 119(1), pp: 78–121. Coenen G., Straub R., Trabandt M., (2012), “Fiscal Policy and the Great Recession in the Euro Area” American Economic Review: Papers & Proceedings, 102(3), pp: 71–6. Corsetti G., Meier A., Müller G.J., (2012), “What Determines Government Spending Multipliers?”, IMF Working paper 12/150. Cwik T., Wieland W., (2011), “Keynesian Government Spending Multipliers and Spillovers in the Euro Area.” Economic Policy, 26 (67), pp: 493–549. Delong J.B., Summers H., (2012) “Fiscal Policy in a Depressed Economy”, The Brooking Institution, mimeo. Ilzetzki E., Mendoza E.G., Végh C.A., (2013), “How big (small?) are fiscal multipliers?”, Journal of Monetary Economics, 60(2), pp: 239–54. Mittnik S., Semmler W., (2012) “Regime dependence of the fiscal multiplier”, Journal of Economic Behavior & Organization, 83(3), pp: 502–22.

R A P P O R T O C E R
31 31
Fiscal Imbalances 25 In the immediate aftermath of the Global Financial Crisis, all G20 governments agreed that, given the severity of the recession in the general climate of uncertainty and dysfunctional financial markets, stimulating effective demand by public borrow-ing was necessary. The United States, China, Japan and the UK announced large spending packages, although the Euro Area was more reluctant. In the end, Ger-many and France, as well as some smaller countries, did undertake stimulative measures; Italy did not. The stimulus worked. A sustained depression was avoided and even Italy benefitted from the spillover for its exports. But while economic growth returned, it did so in most cases at lower rates than before. 26 As soon as the world started to pull out of the global financial crisis, Europe was shaken a second time by the Greek debt crisis, which turned into a full-fledged Euro crisis. When the newly elected Papandreou government revealed the misdemean-ours of its predecessor, confidence in Europe’s fiscal policy framework and the Stabil-ity and Growth Pact collapsed. Financial investors dumped Greek government debt from their portfolios and soon the crisis spilled over into Ireland, Portugal and the rest of Southern Europe. Yield spreads shot up and the Euro interbank market froze. Bank lending stopped, and political comments made the situation worse (14). In Cyprus, bankers thought they knew better and bought Greek sovereign debt, only to lose € 6bn worth of assets when European policy makers decided to give Greece a haircut. Hence, bad politics and bad communication turned a bad local event into a sys-temic crisis. 27 But problems did not stop there. With the emerging public debt problems, Europe’s policy consensus started to deviate from global wisdom. Given that excessive debt seemed to be the problem, fiscal consolidation became the dominant theme for policy makers. Harsh, sometimes extremely harsh, austerity measures were imposed on member states with rapidly rising debt ratios. It was argued that high deficits were a sign of fiscal irresponsibility which needed to be “punished” and reined in by cut-ting expenditure and rising taxes. However, despite these measures, the situation got worse. (14) See: S. Collignon, P. Esposito and H. Lierse, 2013. European Sovereign Bailouts, Political Risk and the Economic consequences of Mrs. Merkel. Journal of International Commerce, Economics and Policy, Vol. 4.2

N. 1 - 2 0 1 3
32
28 Figure 6 shows that the rapid increase in public debt ratios was a direct conse-quence of the global financial crisis (15). Fiscal profligacy may have prevailed before the crisis in Portugal, Germany, and France (similar to the United States), but the Euro member states with the greatest debt problems, such as Ireland, Greece and Spain, had stable or falling debt ratios before 2008 and extremely rapid increases thereaf-ter. Despite several years of consolidation and austerity, no break in the upward Figure 6. Debt-GDP ratios for selected countries
50
60
70
80
90
100
96 98 00 02 04 06 08 10 12 14
Euro area (12 countries)
40
60
80
100
120
140
96 98 00 02 04 06 08 10 12 14
BELGIUM
40
80
120
160
200
96 98 00 02 04 06 08 10 12 14
GREECE
40
60
80
100
120
140
96 98 00 02 04 06 08 10 12 14
ITALY
50
60
70
80
90
100
96 98 00 02 04 06 08 10 12 14
FRANCE
50
60
70
80
90
100
96 98 00 02 04 06 08 10 12 14
GERMANY
20
40
60
80
100
120
140
96 98 00 02 04 06 08 10 12 14
IRELAND
20
40
60
80
100
96 98 00 02 04 06 08 10 12 14
SPAIN
40
60
80
100
120
140
96 98 00 02 04 06 08 10 12 14
PORTUGAL
20
40
60
80
100
96 98 00 02 04 06 08 10 12 14
SWEDEN
20
40
60
80
100
96 98 00 02 04 06 08 10 12 14
United Kingdom
40
60
80
100
120
96 98 00 02 04 06 08 10 12 14
United States
Source: AMECO. trend of debt ratios has been seen so far, except maybe in Germany. The European Commission is expecting a trend slowdown in the southern crisis countries or even a
(15) The year 2007 was the peak of the boom. Lehman declared bankruptcy in 2008.

R A P P O R T O C E R
33 33
trend inversion in Ireland and Germany, but this optimism is based on favourable growth assumptions, which may not be realised if austerity continues. If there is one common factor that these countries share, it is not budget irresponsibility before the crisis, but large negative output gaps since 2008 (cf. figure 1 and 2). Lack of demand is the major factor in this debt crisis. 29 Nevertheless, it should be noted that in 1999 Belgium started with a debt ratio of 130 which by had come down by 46 percentage points to 84 percent. This improvement was twice as high as in Italy, where the debt ration only fell from 120 to 106. Belgium was therefore in a much better position when the crisis hit: excess demand before the crisis, and the demand gap after the crisis were both lower than in Italy (figure 7). Figure 7. Output gaps for Belgium and Italy
-4
-3
-2
-1
0
1
2
3
4
99 00 01 02 03 04 05 06 07 08 09 10 11 12 13 14
Gap Belgium Gap Italy
Lehm
an
Source: AMECO.
30 The effect of the crisis is also apparent from figure 8, which shows the dramatic de-terioration of actual and cyclically adjusted budget deficits. Both measures deterio-rated strongly when output collapsed. The reduction of potential output, which we witnessed in figure 3, implied lower permanent government revenue. However, pub-lic expenditure did not fall immediately because a large portion of it are contractual entitlements, such as wages and salaries, maintenance of existing institutions, social benefits, etc. Hence, the structural deficit increases as potential output falls. The ad-justment of spending to lower revenue levels translated then into austerity. However,

N. 1 - 2 0 1 3
34
Figure 8. Actual and structural budget position
-7
-6
-5
-4
-3
-2
-1
0
1
2
99 00 01 02 03 04 05 06 07 08 09 10 11 12 13 14
Euro Area (17 countries)
-5
-4
-3
-2
-1
0
1
2
99 00 01 02 03 04 05 06 07 08 09 10 11 12 13 14
Public Balance Cyclically Adjusted Public Balance
Germany
-12
-10
-8
-6
-4
-2
0
2
4
99 00 01 02 03 04 05 06 07 08 09 10 11 12 13 14
Spain
-8
-7
-6
-5
-4
-3
-2
-1
99 00 01 02 03 04 05 06 07 08 09 10 11 12 13 14
France
-16
-12
-8
-4
0
4
99 00 01 02 03 04 05 06 07 08 09 10 11 12 13 14
Greece
-32
-28
-24
-20
-16
-12
-8
-4
0
4
8
99 00 01 02 03 04 05 06 07 08 09 10 11 12 13 14
Ireland
-6
-5
-4
-3
-2
-1
0
99 00 01 02 03 04 05 06 07 08 09 10 11 12 13 14
Italy
-11
-10
-9
-8
-7
-6
-5
-4
-3
-2
99 00 01 02 03 04 05 06 07 08 09 10 11 12 13 14
Portugal
-12
-10
-8
-6
-4
-2
0
2
4
99 00 01 02 03 04 05 06 07 08 09 10 11 12 13 14
United Kingdom
Source: AMECO. the chart also shows that prior to the crisis, few member states conformed to the fis-cal rules of monetary union. In fact, these rules consist of two sets: The Excessive Defi-cits Procedure written in the Treaty, says that member states with actual deficits in excess of 3 percent and debt ratios higher than 60 percent must correct this excess. The Stability and Growth Pact, which has now been introduced into national legisla-tion through the so-called fiscal compact but is not part of the European Treaty, stipulates that member states should bring their cyclically adjusted, i.e. structural deficits into” balance or surplus”. Figure 8 shows that member states with excess de-mand before the crisis such as Italy, Greece and France (but not Spain), did little to conform to the Stability and Growth Pact. In 2012 only Germany, Luxembourg, Hun-gary and Sweden fulfilled these requirements in the EU. 31 The budget turn-around began in 2010, except in Germany, where it was delayed by one year. As output gaps started to close, actual deficits came down and, in most cases this improvement was matched by improvements in the structural budget posi-tion. Germany was the only country in the Euro Area to have achieved an actual

R A P P O R T O C E R
35 35
budget surplus in 2012, while in Italy the actual budget position was -3.04 percent. It is, however, remarkable that Italy’s structural deficit has been more than halved dur-ing the Monti premiership, amounting to a reduction of approximately 24bn – which is of similar size as the total receipts from IMU on first, second and third houses plus commercial premises. 17 out of 27 member states violated the excessive deficit rule of not letting actual deficits exceed the 3 percent of GDP. Given this situation, the European Commission opened excessive deficit procedures for most members of the Euro Area and re-quested credible programs of fiscal tightening. 32 Europe’s fiscal tightening came at a time when most countries were still experiencing negative output gaps. By contrast, in the USA fiscal policy was loose, because public borrowing was deliberately used to stimulate aggregate demand. These diverging policy orientations have generated important differences in the performance of the two economies. The successful post-crisis performances in Germany and the United States teach a simple lesson: a loose fiscal policy stance is useful to overcome the cri-sis and should be maintained until the output gap is closed; thereafter structural defi-cits must be consolidated. Figure 8 shows that Ireland and Germany have started to consolidate their structural deficits only after 2011, while for the other countries auster-ity came too early in 2010. 33 In table 1 we argued that austerity, and therefore fiscal tightening, is necessary when aggregate demand exceeds supply capacities, for otherwise inflation will emerge. On the other hand, when demand is insufficient to absorb the output capacity, aus-terity is self-defeating, because the lack of demand for products pushes firms to re-duce investment and employment, and lower growth will reduce government reve-nue. Thus, contrary to the policies pursued in the USA, Europe’s restrictive fiscal stance has hampered the return to economic growth. Yet, if public debt is unsustainable, this will destabilise financial markets and also hamper the return to economic growth. There is a delicate balance to be kept in order to avoid these two negative out-comes. We can measure and assess this balance by using the primary budget posi-tion, i.e. the budget deficit net of interest payments and adjusted for cyclical varia-tions. First, we will discuss the sustainability of debt; then we will link this discussion to demand management. Debt sustainability 34 There are many ways to measure whether government debt is sustainable. In its sim-plest form it means that tax revenue is sufficient to pay for interest liabilities. This ap-proach privileges the primary budget position, which describes how much money

N. 1 - 2 0 1 3
36
the government has at its disposition to service its debt after taking all other expendi-tures into account. If the primary budget does not cover this obligation, new debt needs to be raised in order to avoid default. Clearly, this is not sustainable in the long run, although temporarily this may be justified to prevent a collapse in aggregate demand. In order to avoid short term noise from cyclical variations we will use the cyclically adjusted primary surplus for analysing the more fundamental long run con-ditions, because it indicates whether public finances are structurally sound so that the primary surplus is high enough to cover the debt service. We will then look at debt sustainability from two perspectives: first, we define sustainability as a static equilibrium with a constant debt-GDP ratio; then we look at sustainability as a dy-namic equilibrium where the debt ratio converges to a long run steady state. 35 Negative output gaps shift the long run economic growth potential downward, which means that the structural primary budget balance will also deteriorate be-cause aggregate income is permanently lower. This situation would require a fiscal adjustment in proportion to the lower long run potential output. But this reduction in public borrowing will take demand out of the market, so that it re-enforces the nega-tive output gap and negative growth dynamics. Fiscal consolidation must therefore be complemented by other stimulating measures. Given that monetary policy is already becoming powerless at the lower zero-interest bound, only an improvement in competitiveness, i.e. a depreciation of domestic relative to “foreign” prices, could generate demand from abroad. Increases in net exports would then fill the demand gap. But this requires that other countries are not only willing but also capable of absorbing the surplus. In the Euro Area this is difficult to achieve. The south largely exports into European markets and it is hard to see who could fulfil the function of a buyer of last resort if every member state is consolidating public finances. We must therefore assess which countries have the fiscal space to loosen their fiscal policy stance and absorb at least some of their partners’ produc-tive capacity. 36 A good measure of how far a government is from a stable debt position is the differ-ence between the primary budget position and the interest liability as a share of GDP. If this gap is closed, the debt ratio will be stable. The interest liability is sometimes also called the “snowball effect”, because if the interest rate exceeds the nominal growth rate, the liabilities will increase at the growth-adjusted interest rate and this will require also rising primary surpluses. Figure 9 presents the evolution of the primary budget positions in selected member states. The Euro Area as a whole had a small surplus before the crisis, which became a big deficit and has returned to a positive position since 2012. The horizontal punc-tuated line indicates the level of interest rate liabilities. The only countries close to fi-

R A P P O R T O C E R
37 37
nancial stability are Germany, Italy and, according to the Commission forecasts, Greece. Figure 9. Primary budget position s % of GDP
-4
-2
0
2
4
2000 2002 2004 2006 2008 2010 2012
EURO AREA (17 countries)
-2
-1
0
1
2
3
4
2000 2002 2004 2006 2008 2010 2012
GERMANY
-4
-2
0
2
4
2000 2002 2004 2006 2008 2010 2012
FRANCE
-12
-8
-4
0
4
8
2000 2002 2004 2006 2008 2010 2012
GREECE
-30
-20
-10
0
10
2000 2002 2004 2006 2008 2010 2012
IRELAND
-8
-6
-4
-2
0
2
4
6
2000 2002 2004 2006 2008 2010 2012
PORTUGAL
-8
-6
-4
-2
0
2
4
2000 2002 2004 2006 2008 2010 2012
SPAIN
-2
0
2
4
6
2000 2002 2004 2006 2008 2010 2012
ITALY
-8
-4
0
4
8
2000 2002 2004 2006 2008 2010 2012
UNITED KINGDOM
Sustainability (2013)
Source: AMECO. 37 The consolidation effort that would stabilise the debt ratio is the difference betwe-en the snowball effect and the cyclically adjusted primary surplus. When the gap is negative, the debt ratio is falling; if it is positive, the ratio rises. Table 3 shows that in the north debt is stable, in the South it is rising. For the Euro Area as a whole, the con-solidation gap in 2012 was nearly 2 percent. In Germany, Luxemburg and Finland debt ratios were coming down and in Austrian and Estonia they were nearly stable. Malta and Belgium are slightly below the Euro average, France and Italy above. In Slovenia, Ireland , Cyprus, Portugal, Spain, and Greece significant consolidation ef-forts would have to be made in order to stabilise the debt ratio. In Cyprus, Portugal, Spain and Greece this seems practically impossible. Outside the Euro Area, the Czech Republic and the UK are also in difficult positions. However, the factors behind these adjustment requirements are not all the same. Most of the southern countries, except Italy and Greece, but including France have negative structural primary budget positions. This is also true for Romania, Denmark,

N. 1 - 2 0 1 3
38
Table 3. Consolidation gap to stabilize public debt (2012; percent of GDP)
Snowball Structural Gapeffect primary surplus
Germany 0,90 2,64 -1,74Luxembourg -0,35 0,52 -0,86Finland -0,22 0,22 -0,44Austria 0,45 0,27 0,18Estonia -0,22 -0,51 0,29Malta 1,08 -0,05 1,13Belgium 1,64 0,09 1,55Euro Area (17 ) 2,50 0,51 1,99France 1,18 -0,99 2,17Italy 6,51 4,20 2,31Slovakia 0,42 -2,13 2,55Netherlands 2,06 -0,73 2,79Slovenia 3,04 -0,62 3,66Ireland 0,75 -3,21 3,97Cyprus 3,52 -3,15 6,68Portugal 8,09 -0,41 8,51Spain 3,90 -5,46 9,35Greece 17,98 0,79 17,19
Latvia -2,04 0,47 -2,51Hungary 3,05 4,15 -1,09Sweden 0,13 0,96 -0,83Bulgaria 0,39 0,49 -0,11Romania -0,05 -0,40 0,35Denmark 0,98 0,39 0,59Lithuania -0,49 -1,25 0,77Poland 0,47 -0,82 1,29Czech Republic 1,46 -2,02 3,48United Kingdom 1,57 -2,17 3,74
Source: own elaboration on AMECO. Lithuania, Poland, Czech Republic, and the United Kingdom. By contrast, most northern Euro members have positive primary budgets. The problems in the south are accentuated by the high snowball effect, which comes from higher interest rates

R A P P O R T O C E R
39 39
and negative economic growth. Thus, we are back to the central issue: how to bring back growth. 38 A rigid imposition of austerity would demand a rapid increase in primary budget bal-ances in order to close the consolidation gap. Given the data in table 3, this is un-feasibly harsh. Consolidation must take time. What matters for the sustainability of debt is that the debt ratio converges to the long run equilibrium and does not ex-plode. In the CER Rapporto Europa 2012, we have demonstrated that the fiscal rules under the excessive deficit procedure yield a simple condition for keeping the debt ratio from becoming explosive: ignoring the 60 percent debt target and just focusing on the deficit target, the gap between an excessive deficit and the 3%-ceiling should be adjusted by not less than the growth-adjusted interest rate. Otherwise, the debt ratio will increase without bounds, but if this is done, the debt ratio will converge to 60 percent in the long run. The intuition is clear: when the interest rate is larger than the growth rate, the primary budget surplus must be increased in order to service the debt. On the other hand, the lower the interest rates and the larger the growth rates, the less fiscal consolida-tion is needed, because economic growth generates the income necessary to re-pay debt (16). 39 Table 4 presents the consolidation efforts required to ensure dynamic sustainability in accordance with the European fiscal rules. No consolidation is needed, when the public deficit is below 3 percent. The first two columns show the actual deficit and the excess over the 3%. Consolidation means to increase the primary structural bal-ance in proportion to the excess deficit. The implicit interest rate is the ratio of actual interest payments to gross general government debt. It is a more realistic measure than 10-year government bonds. It is interesting that since Greek debt was repeat-edly restricted since 2011, its implicit interest rate is lower than Germany’s. The differ-ence between this interest rate and the nominal growth rate determines the mini-mum consolidation response for debt convergence (17). We also apply these rules to the United States and Japan, in order to compare the European policies with the other major economies in the world.
(16) For the full explanation of the size of required fiscal adjustment, see: S. Collignon, Fiscal Policy Rules and the Sustainability of Public Debt in Europe; International Economic Review, Vol. 53, No. 2, May 2012 (17) If the growth rate exceeds the interest rate, the stability condition is not α>(r-g), but
α> ( )2ππα +−+> yr .See Footnote 16. We used this formula for calculating the consoli-
dation efforts in Lithuania and Japan.

N. 1 - 2 0 1 3
40
Table 4. Fiscal consolidations requirements
Implicit In percent of GDPDeficit 2012 Excess Interest ( r) Growth (g) α=(r-g) Required 2013 Gap
adjustment adjustment
Italy -3,04 -0,04 4,5 -0,8 5,3 0,22 0,45 0,22Malta -3,34 -0,34 4,6 3,0 1,6 0,56 -0,27 -0,82Slovakia -4,35 -1,35 4,4 3,4 1,1 1,44 1,94 0,50Blegium -3,94 -0,94 3,6 1,9 1,7 1,61 1,20 -0,41Euro Area (17) -3,72 -0,72 3,6 0,7 2,9 2,06 1,20 -0,85France -4,83 -1,83 3,0 1,6 1,4 2,62 1,39 -1,23Netherlands -4,06 -1,06 2,9 -0,2 3,1 3,33 0,87 -2,46Ireland -7,62 -4,62 3,6 2,9 0,8 3,56 0,91 -2,65Slovenia -4,00 -1,00 4,4 -2,0 6,4 6,36 -0,62 -6,98Cyprus -6,30 -3,30 4,4 -0,5 4,9 16,28 3,43 -12,85Portugal -6,41 -3,41 3,9 -3,4 7,3 24,81 1,40 -23,41Spain -10,64 -7,64 4,3 -1,3 5,6 42,48 4,47 -38,01Greece -9,99 -6,99 2,7 -7,4 10,1 70,43 5,47 -64,98Austria -2,48 0,52 3,7 3,0 0,7 no need 0,54Estonia -0,27 2,73 2,8 6,4 -3,6 no need 0,03Finland -1,88 1,12 2,2 2,6 -0,4 no need 0,18Germany 0,15 3,15 3,1 2,0 1,2 no need 0,16Luxembourg -0,81 2,19 2,2 4,1 -1,9 no need 0,65
Lithuania 3,24 -0,24 5,1 6,2 -1,1 0,01 0,07 0,05Poland -3,93 -0,93 5,3 4,3 1,0 0,91 0,52 -0,39Denmark -3,99 -0,99 3,6 1,6 2,0 1,94 2,29 0,35Czech Republic -4,40 -1,40 3,6 0,1 3,6 5,01 1,98 -3,03United Kingdom -6,34 -3,34 3,6 1,7 1,9 6,29 -0,49 -6,79Bulgaria -0,80 2,20 5,5 3,0 2,5 no need -0,39Hungary -1,88 1,12 5,2 1,4 3,8 no need -1,08Latvia -1,21 1,79 3,4 8,4 -4,9 no need -0,36Romania -2,86 0,14 5,4 5,4 0,0 no need 0,46Sweden -0,51 2,49 1,9 1,6 0,3 no need -0,35
Japan -9,89 -6,89 0,9 1,1 -3,0 7,4%United States -8,93 -5,93 2,8 4,0 1,7 10,3% Source: own calculation on AMECO. 40 In five northern countries of the Euro Area and most of the new member states in Central and Eastern Europe (except Lithuania, Poland and Czech Republic), there is no need to consolidate excessive deficits. Italy does do not have to make huge ef-

R A P P O R T O C E R
41 41
forts, and in fact, it is tightening its fiscal stance more than the minimum requirement. Hence, Italy’s public debt is sustainable. However, the margin is small and Italy has no room for fiscal loosening. The same is true for Slovakia and for Lithuania and Denmark outside the Euro Area. In the other crisis countries, the situation is dire. 12 member states with excessive deficits are not meeting the sustainability condition. In Belgium and France, the required additional consolidation effort to become sustainable is less than 2% of GDP, and in the Netherlands and Ireland less than 3%. This is hard enough, but pales against the dramatic sustainability gaps in Greece, Spain, Cyprus, and Por-tugal. Slovenia is also in trouble. In the United Kingdom and the Czech Republic, pub-lic debt is also not sustainable. In these last four countries, the problem is the fiscal policy stance compared to other EU member states. In the southern crisis countries, the major difficulty is the recession. With negative growth of -3.4 or -7.4 the consolida-tion of public debt is simply not possible. Finally, Japan and the United States would also have to make big consolidation ef-forts, if they were following a policy regime similar to Europe’s fiscal rules. Of course, this is not the case. The point here is to show that the system of European budget rules is clearly more constraining than in other parts of the world. Fiscal policy and aggregate demand 41 The sustainability of public debt is, therefore, a real issue in Europe. Borrowing to stimulate demand is more easily justified in member states without excessive deficits and where the debt dynamics are not explosive. Given that the implicit interest rates are relatively low, economic growth is the key variable to improve sovereign debt sustainability and lower the debt burden. The question arises, therefore, whether a loosening of the policy stance could make public debt more or less sustainable. The Keynesian answer is that because of fiscal multipliers, loosening the fiscal stance will increase growth and therefore make debt more, not less, sustainable. By contrast, the neoclassical reply is that additional borrowing by governments will push up inter-est rates, either because of additional demand or, in the present situation more likely, because uncertainty about the solvency of governments will raise the risk premia for government debt. Either way, additional borrowing will make matters worse and only fiscal tightening can reassure markets and improve growth. 42 To find evidence for answering this question, we need to assess how the fiscal policy stances adopted by governments will affect demand and actual GDP growth. The most widely used variable for measuring the policy stance is the change in the pri-mary budget position. The fiscal stance is tightening when the change in the primary position is positive and loosening when it is negative. Figure 10 shows that before the crisis, the fiscal stance was already tight in Germany, loose in Greece, moving from loose to tight in Italy and oscillating in most of the other

N. 1 - 2 0 1 3
42
states reported here. After the crisis, the situation changed. In Spain, a dramatic loosening started already in 2007, when the property market was slowing down. In 2009, in the midst of the crisis, all member states loosened fiscal policy in order to stimulate the economy. In most countries, the effect was close to 4 percent of GDP. The loosening fiscal stance must not be confounded with the stimulus packages of 2009, for it shows only changes in the cyclically adjusted budget position. Some of the huge stimulus packages in 2009, for example in Germany, have simply re-sponded to the growing output gaps and thereby avoided a deep recession, but they did not necessarily generate additional growth impulses. In Ireland, the effect is distorted by the banking crisis. Figure 10. Fiscal Stance (change in primary structural budget position)
-2
-1
0
1
2
2000 2002 2004 2006 2008 2010 2012
EURO AREA (17 countries)
-6
-4
-2
0
2
4
2000 2002 2004 2006 2008 2010 2012
GERMANY
-3
-2
-1
0
1
2
2000 2002 2004 2006 2008 2010 2012
FRANCE
-8
-4
0
4
8
2000 2002 2004 2006 2008 2010 2012
GREECE
-20
-10
0
10
20
2000 2002 2004 2006 2008 2010 2012
IRELAND
-8
-4
0
4
8
2000 2002 2004 2006 2008 2010 2012
PORTUGAL
-6
-4
-2
0
2
4
2000 2002 2004 2006 2008 2010 2012
SPAIN
-3
-2
-1
0
1
2
3
2000 2002 2004 2006 2008 2010 2012
ITALY
-6
-4
-2
0
2
4
2000 2002 2004 2006 2008 2010 2012
UNITED KINGDOM
Source: AMECO, own calculations. 43 Nevertheless, as soon as economic growth started to turn the corner, and well before the output gaps were closed, European policy makers returned to a tight fiscal re-gime, arguing that this was required under the rules of the Stability and Growth Pact, which stipulates that the excessive deficit procedure is suspended in case of a se-

R A P P O R T O C E R
43 43
vere economic downturn “if the excess over the reference value results from a nega-tive annual GDP volume growth rate or from an accumulated loss of output during a protracted period of very low annual GDP volume growth relative to its potential”(18). Thus, when GDP growth bounced back into positive territory, despite persistent negative output gaps, the suspension was revoked because the Pact defines the exceptionality of the situation only in terms of growth rates and not in terms of output levels relative to potential. As a consequence already by the end of 2009, 12 Euro Area member states have been declared to have “excessive deficits”, which needed to be corrected by 2013 (19). Thus, the Stability and Growth Pact did not only require a rapid and early fiscal consolidation with damages for long term growth, but in addition it was applied in an overly restrictive way, most probably in contradiction with the legal text. 44 That the timing of fiscal consolidation is important can also be seen in figure 10. In most countries the fiscal stance returned to zero or became positive in 2010, hardly 2 years after Lehman. The only notable exceptions were Germany and Ireland. These two countries still had loose or stimulating fiscal stances in 2010 and only consoli-dated in 2011. Yet since then, it is Germany, which has had the best performance in the Euro Area, and it is Ireland, which has had the best performance among the crisis countries. 45 What are the implications for fiscal policy? Europe is caught in a dilemma: budget deficits can stimulate aggregate demand and thereby close the output gap, which is good for growth. But higher deficits may also undermine debt sustainability and then the limits of fiscal policy are reached. In principle, a fiscal stimulus could prevent a slowdown of growth in the productive capacity and maintain the long run dynamics of capital accumulation, but such a short run stimulus makes only sense, if the debt dynamics remain sustainable, which implies that financial markets are willing to fund new borrowing. If financial markets are worried about the sol-vency of sovereign debtors, interest rates will go up, as one has witnessed in Europe’s south, growth slows down and the sustainability of public debt is impaired. Given that monetary policy has already become highly accommodative with in-terest rates close to the zero bound, this would mean the ship of the European economy has become rudderless.
(18) Council Regulation (EC) No 1056/2005of 27 June 2005 amending Regulation (EC) No 1467/97 on speeding up and clarifying the implementation of the excessive deficit procedure, Article 1. (19) http://ec.europa.eu/economy_finance/economic_governance/sgp/deficit/index_en.htm (accessed 21.1.2013).

N. 1 - 2 0 1 3
44
46 Thus, Europe’s policy options are not easy. Europe will have to muddle its way out of the dilemma: on the one hand it should accept higher deficits until the output gap has closed; on the other hand, countries with more easily sustainable debt positions have the space to support their partners by stimulating their own domestic demand. From table 3 and 4 it is clear that the Euro member states with the largest possible margins for stimulating fiscal policies are Germany, Austria, Luxemburg, Finland and Estonia, but given the relative size, this puts the major burden on Germany. France and Italy have no room for manoeuvre. France needs to avoid being too closely as-sociated with southern crisis economies and that includes the avoidance of a fiscally induced recession. Italy is the corner country between sustainable and unsustainable public debt. Given that it has one of the highest debt ratios in the Union, sliding into unsustainable debt positions could be the fatal stroke to the whole edifice of Euro-pean integration. Monetary union was good for Italy: the implicit interest rate for government debt has come down from 12% in 1992 to now close to 4% and the share of GDP that taxpayers had to pay to service their debt has fallen from 12.5 to 5.5 percent, even if the reduction of the debt-GDP ratio was rather disappointing. Hence, a fiscal loosening which could be interpreted as increasing the risks of insol-vency would be counterproductive, but so would be further fiscal tightening. France and Italy need a neutral fiscal policy stance: no stimulus, no austerity. 47 As for the sever crisis countries Greece, Spain, Portugal, and Cyprus, the consolida-tion gap to return to dynamic stability is too large to be filled by fiscal consolidation. The negative depressive spiral must be stopped, but this can only be accomplished by a return to economic growth. Here, fiscal policy must be complemented by pri-vate sector demand. This leads us to look, in the next chapter, at competitiveness as an alternative strategy. However, the close link between investment, private debt, banks and public debt requires re-thinking the functioning of financial markets in the Euro Area. Putting finance back on sound footings is a necessary, though no suffi-cient condition for restoring economic growth.

R A P P O R T O C E R
45 45
Single currency, “external” imbalances and
competitiveness 48 The euro was created to complete and consolidate the European internal market. It was to remove distortions due to exchange rates variations and to provide long term stability. In other words, it was to provide a level playing field where competition was about good goods and good services – as it is in any other integrated economic space. This coherent view has been shattered during the crisis by a mistaken debate on macroeconomic imbalances. How monetary union works 49 Soon after the Euro crisis erupted, it was observed that the member states with the worst private and public debt problems all had large and rising current account deficits since European monetary union began. In the early years of monetary union, this was taken as a sign that the new currency functioned as planned, because it meant that savings were allocated to where they yielded the highest return and purchases were made in the European internal market according to comparative cost advantages. The so-called Horioka-Feldstein paradox had disappeared (20). Yet, during the crisis this view was revised again. Because current account deficits in-crease foreign debt, it was argued, in line with international economic textbooks, that the sustainability of foreign debt required the discounted value of all future cur-rent account positions to be equal to the outstanding value of foreign debt today. Hence, countries with large foreign debt must generate current account surpluses. Given that “nominal exchange rate devaluations are not an available policy tool for the correction of external imbalances in EMU”, various “internal devaluation” meas-ures were recommended to “mimic the effects of nominal devaluations by reducing domestic prices and encourage expenditure-switching effects” (21). In practice this meant that austerity was the main tool for correcting “external” imbalances and promoting net exports and current account surpluses in southern states. However, this new orthodoxy committed an important category mistake by interpreting member state current account deficits as a form of “foreign” borrowing. (20) Blanchard O and Giavazzi F (2002), Current Account Deficits in the Euro Area: The End of the Feldstein Horioka Puzzle. Brookings Papers on Economic Activity 33(2): 147–210. (21) European Commission, 2011. Quarterly Report on the Euro Area III/2011; Brussels, p. 21.

N. 1 - 2 0 1 3
46
50 Current account deficits are identical with net borrowing from non-resident sources. When countries have different currencies, this distinction is important, because non-residents need to be paid in foreign currency. Current account deficits are therefore only possible if foreigners lend their savings to domestic borrowers, or if the central bank has accumulated foreign exchange reserves which it can sell to domestic resi-dents. When it does so, it reduces domestic money supply. However, in European monetary union, deficits between member states are not paid in foreign currency, but in “domestic” euros. Like in the case of foreign currencies, the borrower needs to find a lender. But in monetary union, the budget constraint is different. Credit does not necessarily have to come from a non-domestic source, but it can also be granted by local banks, which get euros from the ECB. Domestic money, i.e. legal tender, is created by the central bank when it gives credit to commercial banks anywhere in the Euro Area and these central bank liabilities can be used anywhere in the area to make payments. Thus, no “country” can run out of money as long as local banks remain solvent and the ECB does its job as lender of last resort and pro-vider of liquidity to the banking system. For this reason, payments between member states in a currency area are fundamentally different from international payments and current account deficits within the Euro Area cannot be treated in the same way as an independent country’s current account. 51 The fact that a monetary union is a payment union, where the means of payment are provided by the central bank, makes it rather robust with respect to liquidity flows. This is a superior quality compared to fixed exchange rate systems such as the European Monetary System that existed before the euro. A currency peg collapses when the central bank runs out of reserves. In that case a country is internationally il-liquid and the price for its currency will depreciate quickly and dramatically, unless it gets additional liquidity from the International Monetary Fund. None of this can hap-pen in a currency union, which is sustained by the “open discount window” of the central bank. 52 This means that under normal circumstances, the ECB provides funds to banks against adequate collateral at the main refinancing rate (presently 0.5%). The Euro-system of central banks has established a list of what is adequate collateral and most government bonds are part of it. However, during the Euro crisis the rating of some countries’ public bonds have deteriorated to such an extent that the ECB could no longer accept them as collateral. Most famously this was the case for Greek, Irish and Cypriote government debt. If the ECB no longer accepts such bonds, bank may suddenly lack adequate collateral and therefore access to liquidity, even if they are still solvent. In this situation they can still have recourse to so-called Emergency Liquid-ity Assistance (ELA), which is authorized by the ECB but granted by national central

R A P P O R T O C E R
47 47
banks to local banks. Potential losses from lending under this facilitate are entirely borne by national treasuries. In principle, ELA funding is temporary, flexible and bank-specific. It is available only to liquid banks and can be withdrawn at any time by a vote supported by two thirds of the members of the ECB’s Governing Council. Never-theless, it is a guarantee that banks will always get the liquidity they need, even in highly unusual circumstances. 53 The ECB has clarified its position as the unconditional defender of monetary union when President Mario Draghi declared that “the ECB will do whatever it takes” to de-fend the euro by setting up the Outright Monetary Transaction (OMT) prgramme. By clarifying that the ECB will fulfil its role as lender of last resort to the banking system, this statement was simply a description of how a monetary union works. Since then, financial markets have significantly calmed down. However, during the Cyprus crisis, this commitment seemed to be put into question again, when the ECB threatened to withdraw funding under the Emergency Assistance Liquidity unless the Cypriote gov-ernment would agree to a deal with international creditors. Technically, stopping ELA would have been equivalent to kicking Cyprus out of monetary union. In the end this did not happen, but the incidence has been a clear demonstration how monetary union works – and how it can be destroyed. As the late Tommaso Padoa Schioppa once said: “In theory we all agree that emergency liquidity support should be pro-vided only to illiquid but solvent institutions. But the distinction between these two concepts is particularly difficult to make in periods of financial distress, which is ex-actly when central banks may have to use this tool. Consequently, careful judge-ment is necessary in providing emergency liquidity assistance” (22). A European Banking Union 54 Unfortunately, the perfect liquidity guarantee to solvent banks, which is the founda-tion of all modern monetary economies, does not solve all problems. The issue is not just to determine how long a bank is solvent, because a bank’s solvency is negatively affected by insolvencies of its debtors. For, economic activity in particular regions depends on the amount of money spent, i.e. on demand. If local residents borrow money from local banks, they must generate future income in order to remain sol-vent. Otherwise they default on their debt and in a severe recession or lasting de-pression the likelihood of such corporate and household defaults is rising. An increas-ing number of corporate failures can then create bankruptcy avalanches and bank runs, which could ultimately turn into a systemic crisis. How can this be avoided? There are two aspects: one focuses on supervision, the other on macroeconomics.
(22) Quoted in financial Times, March 20, 2013.

N. 1 - 2 0 1 3
48
55 The gaps in the supervisory arrangements of the Euro Area are now tackled by the emerging European Banking Union. See Box 2. Financial crises may be triggered off by a sudden deterioration of the economic environment, usually when interest rates are rising. Some firms may then no longer be able to service their debt, but this will only turn into a systemic crisis if these firms are interconnected with other firms which also have high debt leverage. This is the situation at the end of a credit boom. In or-der to prevent banks from accommodating excessive credit demand from their cli-ents in the first place, strict banking supervisory rules are necessary. Such rules could have avoided property crisis in Ireland and Spain or the banking crisis in Cyprus. The supervisory authority must be established with full powers at the European and not the national level, because it is well-known that the network between local political and banking elites may resist measures necessary to preserve financial stability. Part of the measures to strengthen the banking system is also a resolution mechanism which shifts the incentives toward more prudent lending behaviour. Finally, adequate capital requirements and regulation of the shadow banking sector will reduce the risk of excessive credit booms. 56 The macroeconomic dimension must focus on reducing the risk for the corporate sector of being unable to meet the liabilities undertaken during a boom by making sure that the present value of investors’ future returns does not fall substantially below the value of outstanding debt. Hence, the equilibrium condition, which makes the local debt sustainable, is that in the long run the actual return on capital is equal to or larger than the cost of capital. Under the assumptions of neoclassical economics, this is equivalent to saying that the long run growth rate must be equal to the interest rate. 57 This argument shows why austerity can become a systemic risk if it is imposed on economies with negative output gaps. When aggregate demand is cut back, and growth slows down, the return on capital may be pushed below the contracted in-terest rate. Some corporations will go bankrupt and default on their debt. This will trigger off an avalanche of insolvencies, which destabilise banks’ balance sheets. In return banks start to deleverage and reduce their lending, which further destabilises the economy. Hence, the risk of financial instability is the limit for austerity; budget consolidation must not be pushed beyond the point where it destabilizes the cur-rency area. 58 However, there is more. The return on capital depends on the profitability of produc-tion. It should therefore be possible to increase profits by cutting wages, reducing

R A P P O R T O C E R
49 49
BOX 2. THE EUROPEAN BANKING UNION
The European Banking Union is a fundamental step for the stabilization and integration of fi-nancial market in EU countries. It consists of four complementary pillars:
i) the single rulebook in the form of capital requirements;
ii) the Single Supervisory Mechanism (SSM);
iii) a common system of deposit protection;
iv) a single European recovery and resolution framework.
The first pillar has been already implemented in the form of the fourth Capital Requirements Directive (CRD IV), which lays down prudential requirements for capital, liquidity and the credit risk for banks operating in EU member states.
The second pillar, the SSM, was set up in December 2012 and it will be operative next year, when the ECB will assume the European banking supervision. In particular, the ECB will as-sume the supervision of approximately 150 European banks, with assets of more than 30 bil-lion euros, or representing more than 20% of a Member State’s GDP. The remaining 6,000 banks in the Euro area will remain under the supervision of national supervisors. However, the ECB will set the supervisory rules and be able to assume directly all relevant tasks whenever it considers it appropriate.
In order to separate the monetary policy functions from the new tasks, in the ECB it will be created a Supervisory Board, in which they will be also represented Member States outside the Euro area. Taking into account that the ECB Governing Council will have the power to reject the decisions of the Supervisory Board, a mediation panel will be involved in case of divergences with non-euro area Member States.
It is important to underline that when the SSM will be completed, the European Stability Mechanism (ESM) will be allowed to directly recapitalize and repair European banks.
The last two pillars, i.e. a common system of deposit protection and a Single Resolution Mechanism (SRM), are still under negotiation. The German government insists that the obli-gation to pay for others must be tightly linked to the right of control of funds. During the Cy-prus crisis, the deposit protection mechanism and the SRM have become a major issue. However, while there is a legislative proposal on deposit guarantee schemes, the SRM is still to be defined by the European Commission.
In conclusion, the overall architecture of the EU Banking Union seems well on its way. Never-theless, in order to have an effective integrated banking system is important that all the four pillars must be implemented completely.

N. 1 - 2 0 1 3
50
secondary income transfers through the welfare system and increasing productivity. This program of “structural reforms” could therefore contribute, if not ensure, that a slow-growing or depressed member state regains “competitiveness” and returns to stable and sustainable growth. This line of reasoning would support policies aimed at avoiding excessive macroeco-nomic imbalances. However, rather than repressing current account deficits by member states, which would push southern economies deeper into the crisis, it would require stimulating credit and investment in the local economies. To some degree, public credit could play a role in such stimulus, but ultimately the driver of growth must be private investment. And investment responds to profit opportunities. This is the principle behind competitiveness and only competitive economies will be able to attract investment. We therefore need to establish a benchmark for evaluating competitiveness. Measuring competitiveness 59 In a single market with a single currency, the efficient allocation of capital requires that investors put their money wherever it yields the highest return. We have seen that the idea that national current accounts should be balanced is not compatible with the principle of an integrated financial market, for there is absolutely no reason why, say, Italian companies or the government should only borrow from Italian households or why German households should not buy French bonds. In a correctly working sin-gle currency area, borrowers will borrow where they get the most favourable terms and lenders will lend where they get the best return, given risk considerations, and yields should converge, which is what one observed during the first decade of Euro-pean monetary union. The whole purpose of economic and monetary union is pre-cisely to create a more efficient framework for the integrated European economy. This means that if capital can circulate freely, relative returns to capital will determine where investment is located. Thus, the proper measure of competitiveness within a currency area is the return to capital of a given sector or region relative to the ag-gregate return of the area and the efficiency of monetary union is measured by the tendency of rates of return on capital to converge. Competitiveness and the return to capital 60 Figure 11 shows the aggregate rates of return to the national capital stock in some selected member states. The average return to capital in the Euro Area has hardly moved in the first decade, but it has dropped notably during the crisis and has now stabilised at a lower level. The discrepancies between member states have nar-rowed until the crisis has reversed this movement. Thus, from a market point of view, the first decade of the euro was highly efficient. Ireland, Italy and Portugal, and also to some extent France, had initially above average returns, although they had a

R A P P O R T O C E R
51 51
tendency to deteriorate. In Ireland and France, this seems to reflect diminishing re-turns to investment, given that the rate of accumulation accelerated during mone-tary union. In Ireland the deterioration was drastic, but it has turned around again in 2010. Germany and Greece had below average returns all through the 1990s and 2000s, although they have steadily closed the gap relative to the Euro average. After the German labour market reforms in 2005, the return on capital started to exceed the Euro Area rate and it has further improved in recent years. By contrast, Greece and France have suffered most from the crisis. Spain is interesting, as the return on capital has deteriorated significantly in monetary union until it has started to improve after 2010. This indicates that the heavy net borrowing by Spanish corporations and households before the crisis was not driven by actual returns on capital, but by the irrational exuberance of the Spanish housing bubble. Rates of return in the USA are consistently higher than in Europe and the transatlantic gap has become larger since the crisis. This is an indication that for many investors, lending to the rest of the world was more attractive than placing their funds in the Euro Area. Figure 11. Returns of capital
.06
.08
.10
.12
.14
.16
.18
.20
.22
.24
90 92 94 96 98 00 02 04 06 08 10 12 14
Euro area (12 countries) RoC Germany RoCFrance RoC Italy RoCSpain RoC Ireland RoCGreece RoC Portugal RoCUnited States RoC
Source: AMECO, own calculations. 61 We use the return on capital as a measure for competitiveness. Our definition of competitiveness as the ability to generate or attract sustained investment implies a rate of return at least equal if not higher than the rest of the currency area. This as-signs a critical role to wages and wage bargaining, but also to other variables such as productivity of labour and capital. The macroeconomic rate of return on capital can be written as the product of the profit margin times capital productivity:

N. 1 - 2 0 1 3
52
(1)
Where PY is nominal GDP, wL is the nominal compensation of labour and is the
nominal value of the capital stock. We call the average capital efficiency (ACE), which is equal to capital productivity when the price index for capital goods
evolves at the same rate as the GDP deflator P. The expression is either called the wage share or real unit labour costs, because nominal unit labour costs are
, i.e. the ratio between nominal wages and labour productivity, where . The profit margin is the complement of the wage share. The return to capital may then increase if the profit margin increases, because unit labour costs are reduced or because the capital efficiency is improved. Thus, we may explain the changes in the return on capital by changes in the profit margin (also called operating surplus), or by changes in the productivity of capital and labour. With zero technological progress labour and capital productivity stand in an inverse relation to each other. 62 Figure 12 shows the very different development features over half a century. Profit margins are shown on the left hand scale, returns to capital on the right. When the gap between the two curves increases, capital productivity is rising; when it shrinks, the average efficiency of capital diminishes; when the two curves evolve in parallel, the return to capital is driven by wages and profits. Under the Bretton Woods regime, profits improved in Europe and remained stable in the USA. Economic growth was fast in Europe. After 1980 monetary policies was tightened to bring inflation down and neoliberal policies of liberalising financial and product markets became the new policy consensus. This has driven up profit margins and returns to capital all over the world. In Germany, improved of rates of return usually reflect increases in profit mar-gins, while capital productivity does not seem to change much. The labour market reforms by the Schröder government have increased profit margins. In Portugal, capital efficiency also does not change, at least until the crisis has diminished capital productivity, but profit margins remain flat. In Ireland, the return on capital is also driven by wages and not by capital efficiency. Irish profit margins increased in the booming 1980s and 90s, but then the advantage has been lost after EMU began. Profits only picked up again during the crisis years. In Greece, by contrast, profit mar-gins have risen only marginally before the crisis, but there was a long run trend of im-proved capital efficiency. In all the other countries shown in figure 12, the trends for profit margins and rates of return go in opposite directions because capital produc-tivity has diminished. In France, Italy and Spain this loss of competitiveness is dra-matic, although for different reasons. Profit margins have remained stable in the first

R A P P O R T O C E R
53 53
two economies, but they have risen in Spain, but not enough to prevent diminishing returns. Figure 12. Profit margins and return in capital
.300
.325
.350
.375
.400
.425
.450
.09
.10
.11
.12
.13
.14
.15
1960 1965 1970 1975 1980 1985 1990 1995 2000 2005 2010
Euro Area
.32
.36
.40
.44
.48
.08
.10
.12
.14
.16
1960 1965 1970 1975 1980 1985 1990 1995 2000 2005 2010
Germany
.34
.36
.38
.40
.42
.08
.10
.12
.14
.16
.18
.20
1960 1965 1970 1975 1980 1985 1990 1995 2000 2005 2010
USA
.1
.2
.3
.4
.5
.04
.08
.12
.16
.20
1960 1965 1970 1975 1980 1985 1990 1995 2000 2005 2010
Portugal
.1
.2
.3
.4
.5
.6
.06
.08
.10
.12
.14
.16
.18
1960 1965 1970 1975 1980 1985 1990 1995 2000 2005 2010
Greece
.25
.30
.35
.40
.45
.50
.55
.08
.12
.16
.20
.24
1960 1965 1970 1975 1980 1985 1990 1995 2000 2005 2010
Ireland
.32
.34
.36
.38
.40
.42
.44
.10
.11
.12
.13
.14
.15
1960 1965 1970 1975 1980 1985 1990 1995 2000 2005 2010
France
.28
.32
.36
.40
.44
.48
.08
.10
.12
.14
.16
.18
1960 1965 1970 1975 1980 1985 1990 1995 2000 2005 2010
Profit margin Return on Capital
Italy
.30
.35
.40
.45
.50
.10
.11
.12
.13
.14
.15
1960 1965 1970 1975 1980 1985 1990 1995 2000 2005 2010
Spain
Source: AMECO. 63 The distinction between profit margins and returns to capital throws a new light on competitiveness. Labour market reforms usually aim at reducing wages, either by in-creasing labour supply or by lowering social contributions. This is what has happened in Germany. However, after the financial crisis, margins have also gone up in the Southern crisis countries. The main cause for the deteriorating competitiveness in the South during the previous Euro-decade has therefore been the rapid accumulation of capital. Where interest rates have come down after the start of the euro, rapid accumulation of capital has caused diminishing returns to capital, and variations in wage setting have not compensated this competitive deterioration. In the north, in-terest rates have not changed much, so that lower wages and higher profit margins have increased the return to capital. In the US, by comparison, wage reductions have pushed profit margins up so that by and large the diminishing capital produc-tivity has been compensated and the return on capital has remained stable or even improved after the crisis.

N. 1 - 2 0 1 3
54
64 Diminishing returns on investment have lowered the average efficiency of capital. Figure 13 shows that before the financial crisis, the average efficiency of the capital stock has fallen in all southern member states, except Greece. This trend has contin-ued even through the crisis (except in Ireland), although the negative trend seems to have stopped in Italy, Spain, and Portugal; in Greece the adjustment policies im-posed have destroyed and reversed the earlier positive trends of capital productivity, but here, too, the downward trend may finally have come to an end in 2013. Figure 13. Average efficiency of capital
.30
.31
.32
.33
.34
90 92 94 96 98 00 02 04 06 08 10 12 14
Euro area (12 countries)
.29
.30
.31
.32
.33
.34
.35
90 92 94 96 98 00 02 04 06 08 10 12 14
GERMANY
.28
.30
.32
.34
.36
90 92 94 96 98 00 02 04 06 08 10 12 14
FRANCE
.28
.30
.32
.34
.36
90 92 94 96 98 00 02 04 06 08 10 12 14
ITALY
.26
.28
.30
.32
.34
.36
90 92 94 96 98 00 02 04 06 08 10 12 14
SPAIN
.20
.22
.24
.26
.28
.30
90 92 94 96 98 00 02 04 06 08 10 12 14
GREECE
.34
.36
.38
.40
.42
.44
90 92 94 96 98 00 02 04 06 08 10 12 14
IRELAND
.30
.32
.34
.36
.38
.40
90 92 94 96 98 00 02 04 06 08 10 12 14
PORTUGAL
.36
.38
.40
.42
.44
.46
90 92 94 96 98 00 02 04 06 08 10 12 14
United States
Source: own elaboration on AMECO. Competitiveness and unit labour costs 65 Differences in rates of return are an important driver of macroeconomic imbalances in the Euro Area. Assuming that capital productivity depends on a combination of exogenous factors and the accumulation of capital, we can ask how much unit la-bour costs would have to adjust in order to balance the return to capital. If our benchmark for measuring competitiveness is the rate of return to capital relative to the Euro average, we can derive the equilibrium level of unit labour costs as the level

R A P P O R T O C E R
55 55
where the regional return to capital is equal to the aggregate of the currency area (23). Taking the Euro Area as our reference, the relative return on capital in different member states would indicate that unit labour costs are overvalued when actual costs are above the equilibrium level or undervalued in the opposite case. 66 Figure 14 shows the levels of equilibrium unit labour costs, calculated under these as-sumptions. The equilibrium level is neither constant nor necessarily close to parity (the horizontal line), because capital productivity is changing and/or because inflation differentials or wage settlements are modifying profit margins and all these factors in-fluence the return on capital. The chart indicates that in the southern crisis
Figure 14. Actual and equilibrium unit labour costs
.40
.45
.50
.55
.60
.65
.70
.75
.80
90 92 94 96 98 00 02 04 06 08 10 12
Cyprus
.40
.44
.48
.52
.56
.60
.64
.68
90 92 94 96 98 00 02 04 06 08 10 12
Germany
.44
.48
.52
.56
.60
.64
.68
90 92 94 96 98 00 02 04 06 08 10 12
France
.2
.3
.4
.5
.6
.7
90 92 94 96 98 00 02 04 06 08 10 12
Greece
.35
.40
.45
.50
.55
.60
.65
90 92 94 96 98 00 02 04 06 08 10 12
Ireland
.36
.40
.44
.48
.52
.56
.60
.64
90 92 94 96 98 00 02 04 06 08 10 12
Italy
.36
.40
.44
.48
.52
.56
.60
.64
.68
.72
90 92 94 96 98 00 02 04 06 08 10 12
Netherlands
.30
.35
.40
.45
.50
.55
.60
.65
.70
90 92 94 96 98 00 02 04 06 08 10 12
Portugal
.40
.44
.48
.52
.56
.60
.64
90 92 94 96 98 00 02 04 06 08 10 12
Unit Labour Costs Equilibrium Unit Labour Costs
Spain
Source: own elaboration on AMECO. countries equilibrium unit labour costs have fallen since 2009, while they have risen in Germany. This means that southern member states must have lost competitiveness (23) For a detailed explanation of the methodology, see: CER Report on Europe, 2012; and S. Col-lignon, Macroeconomic imbalances and comparative advantages in the Euro Area, European Trade Union Institute (ETUI), Brussels, 2012

N. 1 - 2 0 1 3
56
even if they have kept unit labour costs constant, while Germany would have been winning. The reason is that the average efficiency of capital was improving in Ger-many, but falling in the South as the same capital stock has produced less output in the recession. Thus, here again we find that the negative output gaps have severe negative consequences in the long run. One may object that the south “simply” would have to reduce wages in order to remain competitive. While this appears to be true in the first instance, it ignores the second round effects for private consump-tion and fiscal consolidation. An optimal strategy would instead aim at Germany in-creasing its unit labour costs more than the Euro average and spending the in-creased purchasing power on imports from neighbouring countries, while the South would moderately adjust downwards. 67 How much adjustment effort should be done in the two directions? A quick way to measure the positions and changes in competitiveness levels is the difference be-tween the actual and equilibrium unit labour costs relative to the Euro Area. Figure 15 summarises this information into a single Competitive Index. The horizontal line indi-cates that at the unit labour cost levels of a given country are at a level where the return to capital is equal to the Euro Area. An index number above the zero line represents an overvaluation. For example, 1.1 means that the ULCs of a member state would have to fall by 10 percent in order to ensure a national return to capital equal to the Euro Area average. An increase in the index is equivalent to a loss of competitiveness. 68 In Finland the undervaluation goes back to the crisis years in the early 1990s, in the Netherlands it started around the time of monetary union in 1999, and in Germany it occurred with the Schröder labour market reforms. France has moved from under-valuation to overvaluation, Italy has persistently lost competitive advantages over the last two decades, but having started from a much undervalued position it is now close to equilibrium. In the crisis countries, Spain has become more and more over-valued during its property boom; Portugal and Ireland have also lost competitive-ness, but they are still undervalued. Cyprus has oscillated in a range below equilib-rium. Most surprising, Greece has reduced its overvaluation disadvantage before the crisis, but had not yet reached equilibrium. Despite a draconian austerity regime since the crisis erupted, the country has now experienced a slight deterioration in competitiveness. These movements reveal very different behaviour in unit labour costs among member states. 69 Based on these data, we can classify member states according to the over- or un-dervaluation of their unit labour costs relative to the Euro Area equilibrium. Although

R A P P O R T O C E R
57 57
Figure 15. Competitiveness index
.79
.80
.81
.82
.83
.84
.85
.86
.87
90 92 94 96 98 00 02 04 06 08 10 12
Cy prus
0.92
0.96
1.00
1.04
1.08
1.12
90 92 94 96 98 00 02 04 06 08 10 12
Germany
0.96
1.00
1.04
1.08
1.12
1.16
90 92 94 96 98 00 02 04 06 08 10 12
Spain
0.94
0.96
0.98
1.00
1.02
1.04
1.06
1.08
90 92 94 96 98 00 02 04 06 08 10 12
France
0.9
1.0
1.1
1.2
1.3
1.4
1.5
1.6
1.7
90 92 94 96 98 00 02 04 06 08 10 12
Greece
.70
.75
.80
.85
.90
.95
90 92 94 96 98 00 02 04 06 08 10 12
Ireland
0.90
0.92
0.94
0.96
0.98
1.00
1.02
1.04
90 92 94 96 98 00 02 04 06 08 10 12
Italy
0.88
0.92
0.96
1.00
1.04
1.08
1.12
90 92 94 96 98 00 02 04 06 08 10 12
Netherlands
0.84
0.86
0.88
0.90
0.92
0.94
0.96
0.98
1.00
90 92 94 96 98 00 02 04 06 08 10 12
Portugal
Source: own elaboration on AMECO. some northern member states, like Austria, also have unit labour cost levels above equilibrium, it is broadly true that unit labour costs are higher in Europe’s south. Greece has halved is disadvantage since 1999, but it is still the most overvalued economy in Europe. More worrisome is the fact that during the crisis competitiveness has deteriorated again. Spain is also seriously handicapped and France has been losing ground since 2008. By contrast, Portugal is not far from the German position, while Cyprus and Ireland have huge competitive advantages, which should help them to regain economic growth. Outside the Euro Area, nominal wage compensation had to be converted into euros in order to make then comparable. Interestingly, all non-euro member states in the European Union are undervalued; the UK least, Romania most. Only Bulgaria has lost competitive advantages during the crisis. Outside Europe, unit labour costs are 13.4 percent below the Euro level in the United States ULC, and in Japan they are 12.6 percent above. Switzerland is also overvalued, but has made improvement despite the strong franc. Wage adjustment in the Euro Area is slow. The standard deviation of ULC disequilibria has marginally come down, while it has increased in the group of non-Euro Area countries. On the one hand this indicates that having the exchange rate as a poten-tial adjustment tool does not help with restoring labour market equilibrium. On the

N. 1 - 2 0 1 3
58
Table 5. ULC over- and undervaluation relative to Euro Area (2012; percent of GDP)
1999 Change 2007 Change 2011
Greece 28,5 -20,3 8,2 6,6 14,8Spain 2,1 11,0 13,1 -3,4 9,7France -3,7 6,8 3,1 3,2 6,3Austria 12,7 -6,5 6,2 -1,9 4,3Italy -8,1 6,0 -2,1 2,4 0,3Euro Area 0,0 0,0 0,0 0,0 0,0Belgium 0,4 -4,2 -3,9 -0,2 -4,1Portugal -9,2 5,3 -3,9 -0,7 -4,6Slovenia -12,3 -0,4 -12,8 7,6 -5,2Germany 9,1 -12,3 -3,2 -2,2 -5,4Netherlands -0,8 -6,1 -7,0 0,0 -7,0Finland -13,3 -2,5 -15,7 3,2 -12,5Cyprus -17,4 -0,2 -17,6 0,1 -17,5Ireland -24,8 7,4 -17,4 -4,4 -21,8Estonia -19,6 -2,9 -22,5 0,1 -22,4Malta -28,6 1,1 -27,4 -1,0 -28,5Luxemburg -32,9 -6,3 -39,3 3,8 -35,5Slovakia -33,0 -8,5 -41,5 0,2 -41,2
United Kingdom -3,8 -2,2 -6,0 -2,1 -8,1Sweden 2,3 -4,5 -2,2 -7,3 -9,4Czeck Republic -1,8 -12,1 -13,9 0,0 -13,9Denmark -13,5 1,0 -12,6 -2,7 -15,3Bulgaria -18,5 -15,4 -33,9 11,2 -22,7Hungary -24,9 -1,0 -25,9 -4,6 -30,4Latvia -32,8 0,4 -32,4 -5,7 -38,1Poland -19,3 -17,0 -36,3 -2,1 -38,3Lithuania -27,2 -8,6 -35,8 -8,1 -43,9Romania -11,5 -31,6 -43,1 -6,6 -49,8
Switzerland 32,7 -16,0 16,7 -9,1 7,6Japan 22,2 -9,7 12,5 0,2 12,6United States -8,3 1,7 -6,7 -6,8 -13,4
Source: CER data base. other hand, the critique that the labour market in the Euro Area is too inflexible may be justified. Euro-critics at the right and left have drawn the conclusion that Europe is not an optimal currency area and cannot be sustained.

R A P P O R T O C E R
59 59
70 However, the correct question is: what drives labour costs in the Euro Area? Ulti-mately, wage bargaining must take into consideration factors such as productivity, inflation and the business climate. Traditionally, this is represented by a Phillips Curve, which explains real wage increases by these factors. The business climate can be measured by the output gap or by the deviation of actual from natural unemploy-ment. Box 3 shows our estimates for the Euro Area. It reveals that wage bargaining is usually influenced by the business cycle. Excess demand, measured either by a posi-tive output gap or by unemployment falling below the equilibrium (NAIRU) rate, will increase (real) wages. However, this general rule was suspended during the early years of European monetary union. There is some weak evidence that this effect was strongest in countries which experienced a strong reduction in interest rates after the introduction of the Euro. In other word, the irrational exuberance caused by the lifting of the foreign exchange constraint in the single currency area led wage bargainers to make settlements, which slowed down the convergence of unit labour costs. 71 Another hypothesis for the slow adjustment is that austerity itself prevents unit labour cost convergence. If output falls and the stock of capital or labour employed is not reduced to the same proportions, productivity deteriorates. Given that we take rela-tive rates of return as our benchmark, this deterioration will affect competitiveness. The standard policy recommendation is to reduce wages and relative unit labour costs through structural reforms. At first sight, this seems obvious: if wages are reduced and nothing else changes, profits and returns must improve as well and growth should return. However, it is not clear that nothing else changes. If wages are re-duced and demand falls, there is no incentive to invest because the output gap in-creases. In that case, it is more likely that non-financial corporations will invest their re-tained earnings in financial assets or reduce their liabilities. These consequences of wage restraint can be observed from flow of funds accounts. Before looking at the evidence, we will quickly explain the value of this analytic tool.

N. 1 - 2 0 1 3
60
BOX 3. STRUCTURAL BREAKS IN THE PHILLIPS CURVE OF EU15 COUNTRIES In this box we attempt to estimate the wage equation for a panel of EU15 countries using a specification derived from the Phillips Curve. The aim is to test whether the introduction of the euro, the global financial crisis and the European debt crisis have caused changes in the rela-tion between economic activity and real wages. As explained in the main text, the introduc-tion of the euro and the convergence of interest rates should have brought about a faster wage dynamics in southern Europe, coupled with lower productivity growth and the conse-quent rise in unit labour costs. This process has been interrupted when the global financial crisis exploded because of the austerity policies imposed to southern European states and because of the recessions in the Euro area. If these assumptions are correct, we would expect a reduc-tion in the response of wage growth to the demand gap between 1999 and 2007 while from 2008 the coefficient should go back to its pre-euro value. In order to formally test these as-sumptions we augment a standard Phillips Curve equation with two dummies, accounting for the two sub-periods (euro adoption and crisis), and their interaction with the cycle variable. In the econometric specification the growth rate of real wages is expressed as a function of labour productivity (LP) growth and of the difference between the growth of the GDP deflator and that of CPI inflation (P-CPI). The latter variable is a proxy for the terms of trade as CPI infla-tion includes imported inflation and its coefficient captures the degree of pass-through from terms of trade shocks to real consumption wages(1) (Goretti 2008). As measure of economic activity, i.e. the demand gap, we use two alternative variables: the first one is the “cyclical” unemployment, calculated as the difference between the actual unemployment rate and the non-accelerating wage rate of unemployment (NAWRU); the second one is the output gap, that is the percentage difference between actual and potential GDP, with the latter calculated by a production function. In addition to structural breaks, non-linearity in the rela-tion between wages and the demand gap may play a role as strong “cyclical” variations can have a higher impact on wages, especially in the current period as recession and austerity are associated with much slower wage dynamics. In order to capture these effects we express the cycle variable as second order polynomial term which will be interacted with the euro and cri-sis dummies. Hence, the final specification is as follows:
(B1)
where Y is the measure of economic cycle, that is cyclical unemployment (Ucyc) or the out-put gap (OutGap). The estimation sample includes the old 15 EU members over the period 1965-2012. As robustness check, in particular because the oil shock as well as the end of Bret-ton Woods in early ‘1970s can potentially introduce additional breaks to the series, we esti-mate equation (B1) on a subsample from 1980. ______________________ (1) See Goretti M. (2008) “Wage-price setting in the new EU Member States”, IMF Working Paper 08/243.

R A P P O R T O C E R
61 61
Estimation results for the relation between real wages and cyclical unemployment are shown in table B1; results with the output gap are shown in table B2. In both cases, the relation be-tween wages and labour productivity is stable, with a coefficient around 0.4-0.5. Similarly, the coefficient of the terms of trade is always around one, which means that there is instant pass through from prices to real wages. Turning to cyclical unemployment, we find a significant Table B1. Estimates of the relation between real wage growth and cyclical unemployment
Measure of economic activity: cyclical unemployment (U-NAWRU)1965-2012 1965-2007 1965-2012 1965-2012 1980-2012 1980-2007 1980-2012 1980-2012
∆log(LP) 0.478*** 0.498*** 0.483*** 0.530*** 0.442*** 0.470*** 0.467*** 0.577***[0.078] [0.078] [0.078] [0.078] [0.098] [0.103] [0.099] [0.138]
∆(P-CPI) 1.036*** 1.039*** 1.035*** 1.051*** 1.020*** 1.019*** 1.018*** 1.041***
[0.034] [0.033] [0.035] [0.028] [0.042] [0.039] [0.041] [0.033]
Ucyc -0.604*** -0.633*** -0.662*** -0.289 -0.444 -0.557** -0.535* -0.909[0.153] [0.152] [0.159] [0.669] [0.295] [0.258] [0.286] [0.817]
Ucyc*Euro 0.407* 0.387 0.422 1.403* 0.410 0.440 0.393 1.471
[0.242] [0.265] [0.257] [0.800] [0.383] [0.346] [0.342] [0.941]
Ucyc*crisis 1.093 7.164 1.246 13.548[0.908] [18.1] [0.895] [21.861]
Ucyc^2 -27.186 -11.2
[38.7] [46.4]
(Ucyc^2)*Euro 188.0** 110.3[68.4] [68.5]
(Ucyc^2)*Crisis -781.2 -429.9[2282.1] [2480.9]
Euro -0.001 -0.002 -0.002 -0.004 0.000 -0.002 -0.001 -0.004[0.002] [0.002] [0.002] [0.005] [0.002] [0.002] [0.002] [0.005]
Crisis 0.000 0.004 0.065 0.000 0.005 0.083[0.004] [0.008] [0.079] [0.004] [0.010] [0.095]
N 674 608 674 674 483 417 483 483
Standard errors in brackets.*significant at 10% level; **significant at 5% level; ***significant at 1% level. Estimator: Common Correlated Effects Mean Group estimator (CCEMG). and negative overall coefficient – around -0.6 – in the sample from 1965 but less significant in the shorter subsample. Level shifts (the Euro and Crisis dummies) are insignificant in table B1 while changes in the slope coefficients are weakly significant. More specifically, the euro break is significant at 10% and of the expected positive sign, indicating that for this

N. 1 - 2 0 1 3
62
period wages did not react to changes in cyclical unemployment. The specification with the quadratic term (column 4) indicates that this form is not significant between 1965 and 1998 while the euro introduction made the quadratic relation significant. Given the parameter es-timates, we can conclude that during the euro times, the relation between wages and cycle is negative and decreasing with the level of cyclical unemployment, flattening the Phillips curve. Table B2. Estimates of the relation between real wage growth and output gap
Measure of economic activity: Output gap1965-2012 1965-2007 1965-2012 1965-2012 1980-2012 1980-2007 1980-2012 1980-2012
∆log(LP) 0.407*** 0.421*** 0.414*** 0.427*** 0.363*** 0.406*** 0.406*** 0.529***[0.070] [0.072] [0.071] [0.084] [0.095] [0.110] [0.104] [0.104]
∆(P-CPI) 1.022*** 1.023*** 1.022*** 0.999*** 1.012*** 1.006*** 1.009*** 1.038***[0.043] [0.042] [0.042] [0.042] [0.048] [0.047] [0.048] [0.053]
OutGap 0.145* 0.137* 0.141* 0.098 0.363** 0.384** 0.379** 0.424**[0.075] [0.074] [0.075] [0.076] [0.138] [0.120] [0.128] [0.154]
OutGap*Eur -0.173 -0.447** -0.454** -0.388 -0.444** -0.717** -0.692** -0.781[0.136] [0.221] [0.216] [0.470] [0.200] [0.277] [0.269] [0.559]
OutGap*Crisis 0.833* -1.11 0.447 -1.254[0.437] [1.697] [0.456] [2.212]
OutGap^2 -2.22 -1.125[2.53] [4.334]
(OutGap^2)*Euro -1.29 -10.36[16.81] [18.81]
(OutGap^2)*Crisis 8.438 27.48**[8.790] [12.4]
Euro 0.002 0.001 0.002 0.001 0.004 0.002 0.004 0.003[0.003] [0.003] [0.003] [0.003] [0.004] [0.004] [0.004] [0.006]
Crisis -0.008* -0.012** -0.017 -0.008* -0.013** -0.015[0.004] [0.004] [0.023] [0.004] [0.006] [0.028]
N 674 608 674 674 483 417 483 483
Standard errors in brackets.*significant at 10% level; **significant at 5% level; ***significant at 1% level. Estimator: Common Correlated Effects Mean Group estimator (CCEMG). Turning to the output gap (table B2), the main difference lies in the significance of the crisis dummy, which means that on average EU15 real wages increased at a slower pace from 2008 on. The output gap variable is positive and significant in both samples, but more in the

R A P P O R T O C E R
63 63
sample from 1980, which means that the oil shock and the end of Bretton Woods exerted a stronger impact on the output gap than on unemployment. The regime shift in 1999 is signifi-cant and of the expected negative sign, which robustly confirms our first assumption. The crisis break appears to be significant too, but only in the sample from 1965. Its positive sign is in line with our assumptions, because it can be interpreted as a return of the relation between cycle and wages to the pre-euro values. The quadratic relation is significant in the sample from 1980 (column 8) and it is the mirror image of the result with Ucyc: the relation between wages and cycle is increasingly positive for a gap higher than -0.76% while it is flat for values below that threshold (2). Summing up, although the results are not extremely strong, the overall picture does not con-tradict out assumptions. We can then argue that the introduction of the euro broke the rela-tion between wages and the demand gap although this relation came back again after the global financial crisis. ________________________ (2) The value of -0.76% corresponds to the minimum of the relation x=0.424x+27.5x2 estimated in column 8 of table B2.


R A P P O R T O C E R
65 65
Sectorial Imbalances in the Euro Area
Flow of Funds accounting 72 Flow of funds analysis measures financial flows across the economy and presents the financial assets and liabilities of all institutional sectors in the Euro Area, i.e. house-holds, financial and non-financial corporations (NFC) and governments as well as the rest of the world. Flow of funds accounts record balance sheet changes due to eco-nomic activities, including their relations with the rest of the world. Similar to cash flow statements which link profit and loss accounts with balance sheets in business ac-counting, flow of funds accounts provide a coherent and integrated picture of the financial wealth of an economy and its variations. They are tracking funds as they move from sectors, which serve as sources of capital, through intermediaries (such as banks, mutual funds, and pension funds), to sectors that use the capital to acquire physical and financial assets (24). This makes flow of funds statistics is a useful tool for analysing imbalances and changes in competitiveness in the Euro Area. 73 Flow of funds accounts have two distinct parts (25). The economic accounts record “real” economy transactions and show how production activities (GDP) translate into various categories of income allocation, ending up with disposable income, which is either spent on consumption and investment or saved and lent to other agents. The financial accounts are a picture of the financial wealth and record assets and liabili-ties in the different sectors and their variations over time. Variations in stocks are caused by changes due to economic transactions and changes in values of assets and liabilities. The financial transactions indicate, therefore, how the financial net wealth of institutional sectors and economies change in response to real economic activity. Like a cash flow statement in business accounting, the link between the economic and financial accounts is the capital account. Its balance is called the net lending (+) or net borrowing(-) of the different sectors. It shows how savings are used for financial investment. 74 Furthermore, flow of funds show the interdependence between different sectors and, (24) Teplin, A. M. 2001. The U.S. Flow of funds Accounts and Their Uses. Federal Reserve Bulletin, July, pp. 431-441. (25) See also any of the ECB’s Monthly Bulletins General Notes.

N. 1 - 2 0 1 3
66
in the Euro Area, between member states. Because transactions are recorded as net purchases (or net sales) at the current market prices, exchanges within a sector - for example, the sale of equities by one household and the corresponding purchase by another household - cancel each other out and do not show up in the accounts. Transactions between sectors, on the other hand - such as the sale of equities by a household to a mutual fund or the purchase of government bonds by households - are recorded as a negative value for the sector selling the instrument and a positive value for the sector purchasing the instrument (26). Hence, transactions within the same aggregate sector, say between Italian and German non-financial corporations (NFCs), show up in separate national accounts, but they cancel out in the Euro ag-gregate. Yet, total sources of funds must always equal total uses of funds. As a con-sequence, macroeconomic imbalances between member states in the Euro Area will necessarily reflect imbalances between all institutional sectors, and not only be-tween residents and non-residents. Compared to current accounts, this institutional perspective makes flow of funds analysis a superior instrument for analysing macro-economic imbalances. 75 The classic sectorial “imbalance” reflects the fact that, in a market economy, house-holds are the owners of net assets, while corporate capital is recorded as a liability by corporations to households. This implies that households’ revenue must usually ex-ceed their expenditure. Households are therefore saving and lending their funds to the corporate sector, to government and to the rest of the world. By contrast, non-financial Corporations (NFC) are supposed to be borrowers because long-lasting in-vestment expenditure often exceeds income and, therefore, needs to be financed by borrowing against future income from other sectors. Ideally, the government and the external sector are in balance. In reality, this is rarely the case. In Europe, governments often run deficits (i.e. they are net borrowers), and the Euro Area in aggregate has a small current account surplus (i.e. it lends money to the rest of the world). 76 However, a more serious inversion of the traditional logic occurs when the non-financial corporate sector becomes a net lender, as this implies that investment is too low to absorb the corporate savings (i.e. retained earnings). The unspent earnings are then either used to buy financial assets, in which case a non-fiancial corporation starts acting like a bank; or, alternatively, the higher cashflow is used to repay corporate debt, a process called de-leveraging. In a financial crisis, deleveraging will
(26) Teplin, A. M. 2001. The U.S. Flow of funds Accounts and Their Uses. Federal Reserve Bulletin, July, pp. 433.

R A P P O R T O C E R
67 67
become the dominant corporate strategy, because the value of assets has deterio-rated, while many liabilities are nominally fixed, so that corporate equity is reduced (27). Lower net borrowing or even corporate lending will then be a rational strategy for firms whose balance sheets have detriorated due to losses and write offs in asset values. Increases in corporate net lending are negatively associated with economic growth, for investment will set into motion the income multiplier, and if investment becomes negative, income will shrink. It is, of course, possible to absorb the corporate lending by borrowing from the public sector or the rest of the world, but the income-generating mulipliers for government and foreign trade are usually lower than for investment, so that the economy is likely to stagnate as one could observe in Japan over the last 20 years (28). It is therefore useful to analyse net lending and borrowing of the corporate sector, if we wish to understand the drivers behind European growth. 77 Figure 16 show that in the Euro Area as a whole, the corporate sector has been net borrowing during the dot.com boom, but then turned gradually into net lending after the bubble burst in 2000. A similar pattern was observed during the 2004-2008 boom, when companies started to borrow again, but became net lenders after 2008. After each crash investment was reduced, but after 2008 corporate savings were also sig-nificantly increased. In Germany and the Netherlands, investment has stagnated, despite the fact that structural reforms in the labour market and the social welfare system had improved competitiveness, profits and corporate savings. Most of the re-tained earnings of these northern firms were lent to the south of the Euro Area through the banking system. Interestingly, in Greece a similar dynamic was at work before the crisis, but the retained earnings were used to buy government bonds. In France, investment is more volatile than retained earnings and the deteriorating competitiveness does not seem to be reflected in these developments. This indicate that investment in France may be more strongly driven by the non-tradable than by the tradable sector. In Spain and Portugal, retained earnings have fallen before the crisis, reflecting worsening competitiveness positions. The Irish data are overshad-owed by the negative investment due to corporate and banking restructuring in 2010. In Sweden, net lending has gradually been reduced, while it has risen in the United Kingdom until retained earnings fell after the crisis. By contrast, in the United (27) Koo, R. 2002. The Holy Grail of Macroeconomics. Lesson's from Japan’s Great Recession. Wiley and Sons, Singapore. (28) A theoretical explanation is “Ricardian equivalence”, whereby households increase their sav-ings in order to pay future tax liabilities. Empirically, this effect has never been fully confirmed, but it may still reduce the effectiveness of public consumption relative to private investment as far is growth is concerned. One reason is that private investment debt is serviced by increased in-come, while public debt is serviced out of taxes which reduce consumption.

N. 1 - 2 0 1 3
68
Figure 16. Non-financial corporations: investment, saving and net borrow-ing or lending
-4
-3
-2
-1
0
1
7
8
9
10
11
12
13
95 96 97 98 99 00 01 02 03 04 05 06 07 08 09 10 11 12
Euro area (12 countries)
-10
-8
-6
-4
-2
0
2
4
6
8
10
12
14
16
95 96 97 98 99 00 01 02 03 04 05 06 07 08 09 10 11 12
Germany
-4
0
4
8
12
4
8
12
16
20
24
95 96 97 98 99 00 01 02 03 04 05 06 07 08 09 10 11 12
Netherlands
-4
-3
-2
-1
0
1
7
8
9
10
11
12
95 96 97 98 99 00 01 02 03 04 05 06 07 08 09 10 11 12
France
-8
-6
-4
-2
0
7
8
9
10
11
12
95 96 97 98 99 00 01 02 03 04 05 06 07 08 09 10 11 12
Italy
-12
-8
-4
0
4
6
8
10
12
14
16
18
95 96 97 98 99 00 01 02 03 04 05 06 07 08 09 10 11 12
Spain
-8
-6
-4
-2
0
2
6
8
10
12
14
16
18
95 96 97 98 99 00 01 02 03 04 05 06 07 08 09 10 11 12
Portugal
-8
-4
0
4
8
12
4
8
12
16
20
95 96 97 98 99 00 01 02 03 04 05 06 07 08 09 10 11 12
Greece
-12
-8
-4
0
4
8
-20
-10
0
10
20
95 96 97 98 99 00 01 02 03 04 05 06 07 08 09 10 11 12
Ireland
-2
0
2
4
6
8
8
10
12
14
16
18
20
95 96 97 98 99 00 01 02 03 04 05 06 07 08 09 10 11 12
Sweden
-4
-2
0
2
4
66
8
10
12
14
16
18
95 96 97 98 99 00 01 02 03 04 05 06 07 08 09 10 11 12
Inv estment Sav ings (retained earnings) Net lending (+)/ Net borrowing (-)
United Kingdom
-4
-2
0
2
4
6
6
8
10
12
14
95 96 97 98 99 00 01 02 03 04 05 06 07 08 09 10 11 12
United States
Source: AMECO. States, corporate retained earnings have increased dramatically and investment has followed. Hence, we find that improvements in competitiveness and retained earnings do not automatically generate higher investment in countries with significant austerity, such as the Netherlands, Italy, Spain, and Greece. By contrast, where austerity is less pro-nounced, such as in the USA or Sweden, the need for deleveraging is less urgent and economic growth is less handicapped. 78 The mirror image to corporate borrowing should be household lending. We find that household savings often fall during booms and rise in a crisis. Presumably precaution-

R A P P O R T O C E R
69 69
ary motives in a climate of heightened uncertainty are the reason, although we do not observe such behaviour in Italy and Greece after 2008, and lately also not in Spain. It has often been argued that the lack of an efficient social welfare system, which puts the burden of social assistance on families, may be a cause for this atypi-cal savings behaviour in the south. By contrast, household investment, primarily in real estate, was an important driver before and after the crisis. Before 2008 household in-vestment rose in Spain, Greece, Ireland, the UK and the United States, but it fell in Germany, the Netherlands and Portugal, while it stagnated in Italy. In Germany and the Netherlands, household investment has picked up recently, which may be one of the drivers of better performance than in the rest of the Euro Area (figure 17). Figure 17. Households: investment, saving and net lending
1
2
3
4
5
4
6
8
10
12
96 98 00 02 04 06 08 10 12
Euro Area
2
3
4
5
6
7
4
6
8
10
12
14
96 98 00 02 04 06 08 10 12
Germany
3.0
3.5
4.0
4.5
5.0
5.5
4
6
8
10
12
96 98 00 02 04 06 08 10 12
France
0
2
4
6
8
104
8
12
16
20
96 98 00 02 04 06 08 10 12
Italy
-4
0
4
8
4
6
8
10
12
14
96 98 00 02 04 06 08 10 12
Spain
-2
0
2
4
6
2
4
6
8
10
96 98 00 02 04 06 08 10 12
Portugal
-15
-10
-5
0
5
0
4
8
12
16
96 98 00 02 04 06 08 10 12
Ireland
-12
-8
-4
0
4
8
-4
0
4
8
12
16
96 98 00 02 04 06 08 10 12
Greece
-10
-5
0
5
10
0
4
8
12
16
96 98 00 02 04 06 08 10 12
Cyprus
0
2
4
6
0
2
4
6
8
10
96 98 00 02 04 06 08 10 12
Sw eden
-6
-4
-2
0
2
4
0
2
4
6
8
96 98 00 02 04 06 08 10 12
Saving Investment Net Lending (+)/ Net Borrowing (-)
United Kingdom
-4
-2
0
2
4
6
2
4
6
8
10
96 98 00 02 04 06 08 10 12
United States
Source: AMECO.

N. 1 - 2 0 1 3
70
79 The overall lesson from these considerations is clear. While the financial crisis has re-duced the supply and demand for credit, with banks deleveraging their balance sheets and the corporate sector cutting costs, austerity, i.e. reduced spending for private and public consumption, has destroyed the incentives for further investment in Europe. Only exports are presently a source for economic growth. This means that the economic woos of the Euro Area are largely self-made: the collapse of domestic demand leads to a slowdown of long run economic growth, rising unemployment and social problems and a worsening of public finances.

R A P P O R T O C E R
71 71
The Italian debate on austerity
What is wrong with Europe? 80 The debate on austerity in Italy is not very different from any other member state in the Euro Area. The orthodox policy line is defended by centre-right parties, most of them in government. Centre-left parties do not know what they should do. Some-times they support the mainstream, sometimes they oppose it. Without a clear vision, they are triturated and powerless. Opposition arises on the extreme right and left. For the extreme right, European integration has given too much power to foreign pow-ers, and betrays national interests. The answer is to affirm national preferences, take power back, exit the euro and even the European Union. For the extreme left, Euro-pean integration has given too much power to the market and destroys the welfare state. The solution is to put up protection, stop globalisation and return to national currencies. In this report, we have shown that the current economic and financial cri-sis is not the fault of the euro, but of wrong policies which are amplified by inade-quate policy making institutions. In Italy as elsewhere, academics and economists have proposed alternative policies and ways of thinking, which include new fiscal policies, new forms of governance for both the EU and the EMU and a new welfare system. However, it is also clear that in the medium term, these solutions would need more efficient and more democratic institutions. We will now quickly review some of these ideas. 81 The orthodox mainstream argument has blamed the public sector as the main culprit for the crisis. Because of excessive public debt markets have started to doubt mem-ber states’ capacity to stay solvent, so that interest rates on public debt have gone up. In many member states, the public sector is unproductive and overgrown be-cause of corruption by self-seeking politicians. Hence, it ought to be cut and leave room for the more efficient private sector. The economic and financial crisis is there-fore a God-given occasion for imposing structural reforms. 82 This orthodox vision, led by Germany (29) and endorsed by the majority of conserva-tive governments and EU institutions, has a correlate, which is based on two assump- (29) Interestingly, the German word for debt, i.e. Schuld, also means fault, clearly showing the moralistic connotations to this debate.

N. 1 - 2 0 1 3
72
tions. First, inspired by the ‘New Political Economics’ school, it is argued that all politi-cians act like economic actors and seek to maximize their own interests (mainly, to be re-elected) rather than the common good. For this reason democratic processes would not lead to optimal outcomes and more powers should be transferred to technicians and “independent” institutions. Secondly, the ‘public’ cannot be trusted with making rational and unbiased budget policy decisions either, but EMU could nevertheless exist without a fiscal and political union because markets behave ra-tionally and would “punish” misbehaving governments. The logical policy conclusion is unconditional support for markets and the mechanisms of competition (30). In or-der to reassure markets, debt must be brought down and austerity is the way to do it. 83 For these critics, austerity is not the only policy option: in many EU member states op-position to the official policy consensus is rising, and the Italian case is no exception. The strongest argument against austerity is, of course, that it is not working. Reduced public spending, higher taxes and lower wages have not brought the crisis to an end; they have made it worse. There are three reasons that explain this failure. First, the theoretical foundations of austerity are wrong, for the causes of the crisis cannot be linked to vices of the public sector alone. Secondly, restrictive fiscal policies have not stopped the debt-GDP ratios from rising; they are even counterproductive. Lastly, the institutional framework of the Economic and Monetary Union is incomplete and this flaw has contributed to the crisis. 84 Right wing critics are often voicing the pressures and worries clustered around small and medium-sized businesses in sectors of non-tradable goods. For big businesses European integration is a source of strength, because they reap benefits from econo-mies of scale. This is not so for small local companies, which see their terms of trade de-teriorate and their profit margins under threat. Given that they have no market power, they wish to reduce taxes in order to increase their retained profits, or use the State in order to extract rents in their favour. These critics believe that Europe either interferes too much with markets by forcing governments to raise taxes, or prevents local busi-nesses from capturing local governments to their own benefits by imposing tougher competition. Thus, they either want to roll back the public sector, or increase protec-tionism. Either way, Europe is seen as an obstacle that needs to be dismantled. 85 Left-wing critics believe that neoliberal ideologies of government roll-back have cre-
(30) Bagnai, A., (2012), Il tramonto dell’Euro, Imprimatur ed., 21–24; D’Antoni, M. e Mazzocchi, R., (2012), L’Europa non è finita, Ed. Internazionali Riuniti, 20.

R A P P O R T O C E R
73 73
ated institutional flaws which have sharpened Europe’s economic quandaries. The Single European Act and the Maastricht Treaty have wrongly assumed perfect ra-tionality of markets and economic agents, and have therefore ignored that a mone-tary union cannot function efficiently without political, macroeconomic and fiscal union. Instead, European Treaties have deepened the democratic deficit. For these critics, neoliberal scepticism about democracy has overshadowed the construction of the European Union, including the ECB’s design. The independence of the ECB is criticised as excessive, because its members are not elected, nor are they account-able to elected bodies other than the European Parliament. The Euro Area’s institu-tional arrangements and dominant ideology have generated new social injustices and the euro’s existence can, therefore, no longer be justified. 86 On the other hand, the incomplete institutional centralisation of the Euro Area gov-ernance is an opportunity to pursue alternative policies. Although monetary policy is centralised in the hands of the ECB, fiscal decisions are still in the hands of national authorities and no binding coordination of national budget plans in the general in-terest of the Euro Area can be imposed - despite the conclusion of the so-called Fis-cal Compact (31). The independence of the nation state, and therefore the possibil-ity of opposing mainstream austerity, is confirmed by the fact that even Germany, the dominant sponsor of austerity, did not respect the provisions of the Stability and Growth Pact in 2002-03 (32). So, why could other member states not also pursue their own policies? 87 The “market discipline” argument has also failed to convince critics. The rationality of markets should have led market agents a long time ago to doubt the capacity of repaying national debt. Instead, yields for government debt have converged to minimal spreads of a few base points before 2007. Thus, at least for left wing critics, this is evidence that markets behave irrationally and governments must intervene in order to stabilise them. Somewhat in contradiction with the sovereignty argument, the so-called No-bail-out clause (33) is seen as having prevented the stabilisation of (31) The Fiscal Compact (formally, the Treaty on Stability, Coordination and Governance in the Economic and Monetary Union; also referred to as TSCG or more plainly the Fiscal Stability Treaty), is an intergovernmental treaty introduced as a new stricter version of the previous Stability and Growth Pact, signed on 2 March 2012 by all member states of the European Union (EU), except the Czech Republic and the United Kingdom (32) AA.VV., (2012), ‘L’Italia nella Grande Transizione: Europa, lavoro, equità’, Ed. Solaris, 31–42. ; D’Antoni, M. e Mazzocchi, R., (2012), L’Europa non è finita, Ed. Internazionali Riuniti, 57–63, 221 – 225. Bagnai, A., (2012), Il tramonto dell’Euro, Imprimatur ed, 222–224. (33) The Treaty for the Functioning of the European Union (TFEU. Art 125) says: “the Union shall not be liable for or assume the commitments of central governments, regional, local or other public authorities, other bodies governed by public law, or public undertakings of any Member State”.

N. 1 - 2 0 1 3
74
financial markets, and the eventual setting up of bailout funds in the form of the EFSF and ESM for countries in financial distress were too limited in size and their mobilisa-tion can be vetoed by national parliaments. In this case, the ECB should be forced to bail out sovereign debtors. 88 What these critics ignore are the external effects caused by uncoordinated policies. In an integrated and therefore interdependent economy with a single currency, autonomous policy decisions by some member states have inevitably spillover ef-fects into other member states. For example, the budget policies pursued by the Greek Karamanlis government have created huge negative externalities for the whole Euro Area and beyond. Or when the Merkel government refused to bail out debtors in southern member states, this was perfectly coherent with the logic of pro-tecting German taxpayers in the nation state, but totally irresponsible in the context of the monetary union. In each of these cases, national policies reflected democ-ratic choices in a partial constituency, but they caused welfare losses, which could not be legitimated at the European level. This is why in the case of monetary policy, external effects have been brought under the control of a centralised institution, the ECB; in other policy fields, and especially in fiscal policy, this has not happened. In order to avoid centralisation, policy makers talk about voluntary “policy coordina-tion”. But as we can witness every day, in reality voluntary coordination does not work, because governments are responsible for and accountable to their narrow and partial constituencies and not to all the citizens living in monetary union. They derive the legitimacy for their actions from national and not from European elections. Hence, re-nationalising policy making responsibilities for genuine European public goods are no solution for the malfunctioning of monetary union, for this will only in-crease the negative spillover from policy externalities. 89 Another argument critics have ceased are current account deficits. Critics have ar-gued that current account deficits increase “foreign” debt. From a right wing point of view, the evil was excessive public borrowing, for left wingers, that banks have lent ex-cessively to private speculators. Either way, the excessive “foreign” debt was national-ized in the wake of the crisis in order to protect foreign investors and this “socialization of losses” has come at the expense of local taxpayers. If the deficits were caused by high private debt and financed by foreign direct investment and banks, the public sector could not be blamed, but instead the system has sharpened social injustice by bailing out private banks. For left critics, the unequal burden of adjustment should have been shared by the whole currency area and not just by small member states. They also though that EU rules for the EMS bail-out fund agreed in 2011 and 2012 were too strict, while the austerity conditions have ignored the macroeconomic fundamentals and have not regulated or controlled private and foreign debt.

R A P P O R T O C E R
75 75
90 Another flaw in the Euro-governance concerns fiscal rules and the concept of struc-tural balance, a cornerstone of the austerity’s strategy. From the beginning of mone-tary union it has been argued that attaining a structural budget balance would im-pose overly restrictive policies, although in Italy, France, and Spain, this was clearly not the case as Figure 2 has shown. The mainstream has argued that public spending crowds out private investment, especially when public deficits exist, so that fiscal consolidation would generate non-Keynesian growth effects. This idea is falsified by the fact that in some countries, especially in Spain and Ireland, excessive private in-vestment and not public debt has caused the current impasse, and that the role of the public sector in the European national economies has decreased since the 1990s, without experiencing significant increases in private investment (34). 91 Critics on the left have presented an alternative picture of the role of the public sec-tor. They reject the idea that ‘big government’ would impair economic growth and refer to researches showing a positive relationship between growth and public spending through fairer income distribution. During the last 30 years, income polariza-tion has increased and inequality has grown. One explanation is that the returns on education and technological progress have favoured skilled over unskilled workers. This thesis, easily linked with the austerity’s proposal of seeking relative wage deflation in southern European countries, may be useful for explaining the Anglo-Saxons sys-tems’ level of wages, but it fits badly the Italian case, where the return on education is low. Instead, the political weakness of ensuring income redistribution across regions and sectors in the single market is a stronger explanation for rising inequalities. Be-cause one of the main functions of states is redistribution, while no instruments exists for this purpose at the European level, European integration is increasing inequalities. Income inequalities are linked to inequalities in starting points, and to negative reper-cussions on economic growth and standards of living. These differences also prevent individuals from making investments, which would favour themselves and society as a whole. From this perspective, the Euro Area would need to become a “Transfer Union” with more efficient redistribution arrangement, but given that the neoliberal power bloc prevents progress in this direction, one should give up the euro. 92 A similar argument concerns welfare insurance. While the mainstream believes in the rationality of markets provides insurance more efficiently than states, market failures (information asymmetry, externalities, etc.) and risk-aversion make state intervention
(34) Bagnai, A., (2012), Il tramonto dell’Euro, Imprimatur ed., 27–34, 39–41, 48–51, 56–61, 157-158. D’Antoni, M. e Mazzocchi, R., (2012), L’Europa non è finita, Ed. Internazionali Riuniti, 34–36, 208–209.

N. 1 - 2 0 1 3
76
necessary. Insurance encourages the assumption of risks and investments, above all on human capital; it therefore supports economic growth. On the other hand, right wing critics and neoliberals argue that European labour market institutions are too rigid and should be weakened to encourage merit and efficiency (35). Thus, the neoliberal policy orientation of the European Union with “structural reforms” directly clashes with these traditional functions of the welfare state and are seen as a threat to the “European social model”. Preserving this model would then imply less, not more, Europe. 93 The third area of opposition to the current EU policies derives from strictly economic and monetary arguments against the euro. From the beginning, even long before the creation of a common currency in the 1990s, many doubts have been raised about the feasibility of the Eurozone as a monetary union. We will discuss the weak-nesses of these arguments below. A radical position states, however, that the (Euro-pean) monetary unification is always wrong, because if two countries are sufficiently similar in their institutions and macroeconomic fundamentals, they don’t need a common currency, because in the medium run the exchange rate will mirror macro-economic fundamentals. If such similarities do not exist, a common currency is an imposition, which will prevent those countries from using the nominal exchange rate as a tool of economic policy. Without devaluations, deficit countries will find it difficult and painful to rebalance their net foreign positions. Supporters of the euro have always opposed devaluations because they provoke in-flation and are an aggressive and unfair way of competing in international markets. They also have observed that, at least in the European context, they do not work. According to Euro-critics, all these arguments are wrong: first, the effects of the quan-tity of money on inflation are indirect and pass through the demand and supply curves. The relation between devaluation and inflation is not 1:1. Some studies con-sider it to be 3:1 and it takes about one year for devaluation to be completely mir-rored by inflation. This means, of course, that critics take a very short term policy per-spective and ignore long run growth implications. They defend this position by saying that devaluations are, in most cases, defensive acts, not aggressive choices for ob-taining larger share on markets (the Italian devaluation in 1976 and 1992 are reveal-ing in this regard)(36). Hence, the critics conclude that national currencies with “fixed but adjustable” exchange rates would prevent the build-up of severe regional im-balances, while the euro perpetuates them.
(35) D’Antoni, M. e Mazzocchi, R., (2012), L’Europa non è finita, Ed. Internazionali Riuniti, 77–88, 108–114, 121–133, 139–149, 162–168. AA.VV., (2012), ‘L’Italia nella Grande Transizione: Europa, lavoro, equi-tà’, Ed. Solaris, 68–76. (36) D’Antoni, M. e Mazzocchi, R., (2012), L’Europa non è finita, Ed. Internazionali Riuniti, 37–40. Bagnai, A., (2012), Il tramonto dell’Euro, Imprimatur ed., 62–77, 113–124, 201–206.

R A P P O R T O C E R
77 77
94 Finally, the euro has been blamed of having made the economic and financial crisis worse; some economists even state that the common currency has been one of the main causes of today’s situation. This thesis argues that rigidity of exchange rates may amplify a crisis, as has been the case with the fixed exchange rate system of Bretton Woods and the European Monetary System (EMS). Furthermore, the euro has never had a stable external value, because it has fluctuated within a wide range and is probably overvalued. This has impaired exportations and diminished competi-tiveness. The overvaluation cannot be remedied simply by printing money, because the euro has not become a reserve currency comparable to the US dollar. 95 Even the apparently uncontested idea that, thanks to the euro, southern European countries have enjoyed low interest rates, which have supported economic growth, has been challenged. Critics say the argument is contradicted by data showing that in periods of fixed exchange rates Italian growth was lower, because fixed rates caused overvaluations, thereby impairing exports. According to these Eurosceptics, the euro is a fixed exchange rate system, which has downgraded southern Eurozone countries to emerging economy status, because they do not control their own cur-rencies. 96 The old Walters Critique (37) has also re-emerged. Because the Eurozone is believed not to be an Optimum Currency Area, its members are characterised by fundamen-tal macroeconomic and fiscal differences, which would require different interest rates. The ECB, however, cannot handle different interest rates. The resulting draw-backs were plain in the run-up to the current predicament, when economies in the periphery were overheated, so that interest rates should have been increased. Be-cause the ECB cannot favour some countries over others, housing and financial bubbles were inevitable. Even the German chancellor, Angela Merkel has now adopted this argument (38) This argument sees the euro as a zero-sum game, in which Germany or, more widely, Nordic countries are usually winning (39) and the south is losing out. 97 The Italian debate on austerity has not only shown policy flaws, it has also proposed alternative solutions. Bagnai contrasts the Minsky theory of bubble and bursts, in
(37) Sir Alan Arthur Walters (1926 –2009) was a Chief Economic Adviser to Prime Minister Margaret Thatcher and advised her against joining the European Monetary System. (38) http://online.wsj.com/article/SB10001424127887324743704578444853094611218.html (39) Bagnai, A., (2012), Il tramonto dell’Euro, Imprimatur ed., 35–37, 40, 92–102, 154. D’Antoni, M. e Mazzocchi, R., (2012), L’Europa non è finita, Ed. Internazionali Riuniti, 22.

N. 1 - 2 0 1 3
78
which the irrationality of market agents plays a prominent role (40), to the main-stream thesis. They wish to change austerity policies in order to preserve the advan-tages of the euro as a common policy tool. 98 Some critics shy away from destroying the euro, but propose a leap forward to more integration. A radically new approach concerns fiscal policies. The most important proposal concerns the creation of a fiscal union, in order to have a single institution with whom the ECB may interact and cooperate and to guarantee a system of fiscal transfers. A European Debt Agency should be created, with the possibility of issuing Eurobonds or stability bonds, guaranteed by all members simultaneously. These critics oppose the rhetoric of ‘homework’, for which only nation states are responsible, and the idea that a monetary union could exist without a fiscal union. In other words, they claim more solidarity in Europe. Today’s exceptional crisis situation should prompt leg-islators to accept that demand must be boosted by the public sector: this would rep-resent a watershed, insofar as solutions have hitherto focussed on the supply side only (liberalizations, labour market reforms). Bagnai proposes to shift attention from public debt to the foreign debt (accordingly, from the Fiscal Compact to an External Com-pact) (41). Of course, this ignores the fact, explained above, that in a monetary un-ion, “external debt” can only refer to debt denominated in foreign currency. 99 Finally, the architecture of the EU and the Euro area should be subject to a complete revision. Coordination should not be left, in D’Antoni and Mazzocchi’s opinion, to markets. Instead, it should be ensured through a visible and coherent macroeco-nomic policy, although, here again, it remains unclear how better coordination can be achieved without a centralised authority. 100 A banking union should provide better control of financial instruments and flows and the restoration of the interbank activities; it should be made up of a surveillance sys-tem, a mechanism of resolution of banking crisis and a warranty on deposits. The ECB should also be subject to revisions: because monetary decisions have important ef-fects on production, inflation and employment, greater accountability is necessary. Finally, political moves, such as the popular election of the European Commission’s president, would help in restoring democratic accountability and trust in EU’s citizens
(40) Bagnai, A., (2012), Il tramonto dell’Euro, Imprimatur ed., 137, 265–273. (41) AA.VV., (2011), Europa, Italia. Un progetto alternativo per la crescita, Ed. Solaris, 29–30. Monacelli, T. (2012), Il cuore del problema: l’unione fiscale, lavoce.info. Bagnai, A., (2012), Il tramonto dell’Euro, Imprimatur ed., 273–277. See also D’Antoni, M. e Mazzocchi, R., (2012), L’Europa non è finita, Ed. Inter-nazionali Riuniti, 213–217, 227 – 228,

R A P P O R T O C E R
79 79
(42). Some of these ideas have since found their way into the mainstream. 101 To conclude: the opposition to the euro can be divided into two camps. A more extreme vision claims that ‘another euro is not possible’: fiscal union, political union, and a revised ECB are all solutions which do not work. The only feasible alternative is exiting the euro, stop the supranational monetary policy and give up the inde-pendence of the central bank. How to exit the euro is sometimes explained in great detail. The proposals include devaluations and the imposition of capital controls - the consequences of which for economic activity and foreign debt have already proven disastrous in the past. All counterarguments, like the legal impossibility of ex-iting the euro, the risks of hyperinflation and too big devaluations, are dismissed by these critics. 102 Other sceptics are more cautious, however, because such an action would destroy the financial system and would probably mean the end of political and economic integration in Europe (43). They argue that the good functioning of (some elements of) the national welfare systems has prevented the crisis from becoming economi-cally and socially even more destructive. The problem consists in policy mistakes and institutional shortcomings. Austerity and liberal theories have pushed for reforms which aimed at limiting the role of the state and the national welfare systems. In-stead, they propose that welfare should be granted at the European level, as the ‘European social model’ implicitly assumes, although linguistic, cultural and legal dif-ferences, and limited labour mobility, make this social convergence process difficult. However, a European welfare system is necessary to avoid growing inequalities among and within countries. A system of risk sharing would also prove useful in order to better face asymmetric shocks. An example of a more coordinated welfare sys-tem would be the creation of minimum wage standards that oblige member states to let wages grow in line with productivity (44) and a European-wide unemployment insurance scheme (45). Why keep the euro? 103 Given these increasingly wide-spread critiques of European Monetary Union, we will
(42) D’Antoni, M. e Mazzocchi, R., (2012), L’Europa non è finita, Ed. Internazionali Riuniti, 27–28, 194– 04, 224. Bordignon, M., (2012), La federazione necessaria, lavoce.info. (43) Bagnai, A., (2012), Il tramonto dell’Euro, Imprimatur ed., 237, 245 – 252, 277 – 307, 324 – 398. D’Antoni, M. and Mazzocchi, R., (2012), L’Europa non è finita, Ed. Internazionali Riuniti, 244 – 245. (44) D’Antoni, M. and Mazzocchi, R., (2012), L’Europa non è finita, Ed. Internazionali Riuniti, 247 – 261. AA.VV., (2011), Europa, Italia. Un progetto alternativo per la crescita, Ed. Solaris, 33 – 35. (45) See: http://www.diw.de/documents/publikationen/73/diw_01.c.413714.de/diw_econ_bull_2013-01_2.pdf.

N. 1 - 2 0 1 3
80
now address the question, why one should not ditch the euro. The creation of European Monetary Union has been a historic project that took more than half a century to be accomplished. Its sources and reasons were microeco-nomic, macroeconomic, political and philosophical. Libraries have been filled with discussions of the pros and cons. We will here summarize the most important argu-ments in favour of monetary union. Microeconomic reasons 104 Microeconomic arguments for a European currency are the most concrete, and also the most banal, although not the least important. Most obvious are the advantages for tourists travelling in Europe. Using the same currency allows them to compare prices easily and minimise their cash holdings. They save costs for bank commissions and exchange fees. In a familiar monetary environment, foreign travellers are less prone to excessive charges and fraud. These are by no means minor advantages. It is estimated that some 51.9 % of the EU-27’s population took part in tourism in 2011. Residents (aged 15 and above) from within the EU-27 made 1 055 million holiday trips in 2011. Across the EU, the top three most popular destinations for non-resident tourists were Spain, Italy (178.0 million nights) and France (123.0 million nights). Given the relative size of countries, the ratio of travel receipts to GDP was highest in Malta (14.0 %) and Cyprus (10.2 %); in absolute terms, Spain (€ 43.0 billion) France (€ 38.7bn), and Italy (€30.9bn) had the highest earnings, followed by Germany and the United King-dom. With € 60.6bn, Germany was the highest spender on travelling in the European Union (46). These are substantial numbers and one should not underestimate the in-tegrative force of a common currency for Europeans. 105 On a larger scale, similar arguments apply to firms and businesses. Corporations op-erating in the internal markets could reduce costs by rationalising their cash man-agement, having no longer to manage exchange volatility and cutting out banking fees. Input sourcing in a single market without exchange risk made production proc-esses more efficient. Marketing strategies could benefit from forming regional mar-kets unconstrained by artificial monetary barriers. Integrated financial markets were becoming deeper and more liquid, which in principle lowered the cost of capital es-pecially for companies located in Europe’s periphery. 106 The foundation of European unification is the integration of markets, and monetary union was the final crowning of the economic integration process. It all started in
(46) http://epp.eurostat.ec.europa.eu/statistics_explained/index.php/Tourism_trends.

R A P P O R T O C E R
81 81
1951 with the European Coal and Steel Community, and was enlarged to the Euro-pean Economic Community by the Treaties of Rome in 1957. When the European economy was hit by the economic crisis in the 1970s, further integration was increas-ingly seen as a source of economic growth. The Single European Act in 1986 set up the legal framework for the creation of a fully integrated interior market. However, at the same time it became apparent that the coexistence of free flows of goods and services, exchange rate stability and national monetary autonomy were mutual in-consistent. Tommaso Padoa Schioppa described this famously as the “inconsistent quartet”, which required unifying monetary policy under one institution (47). 107 In an efficient single market, competition between firms centres on producing high quality goods and services at minimal cost, so that consumers’ welfare is optimised. This requires investment into skills, research and development, etc. Firms will also reap the advantages of large scale by improving productivity and becoming more profit-able. However, these benefits are unlikely to come forth if exchange rates are vola-tile, because the variations in relative prices do not reflect real production costs or quality improvements, but speculative movements in exchange markets. In the short run, high volatility can be hedged, but this increases parasitic financial costs for firms. In the long run, uncertainty about future prices and returns on capital will prevent firms from making investment into new productive capacity. The systemic handicaps, and the monetary instability they generated in an economy with many small states, are one of the explanations for the long run growth slow-down witnessed in figure 3. Thus, by the 1980s it had become clear that exchange rate stability was a necessary condition for a functioning fully integrated internal market. If a proof was needed, it came in 1992-3, when the major exchange rate realignment in the UK, Italy, Spain, Portugal and Ireland distorted relative prices with respect to France and Germany. Immediately, calls for protectionism and the re-introduction of trade barriers were voiced in France and elsewhere. Those who still claim today that exchange rate de-valuations are an “instrument” to further growth in European member states forget that these devaluations generate damages in other economies where they will not be accept lightly and spill back with negative effects on the originator. Externalities, externalities, externalities – that is the curse of Europe! 108 Exchange rate stability is not enough. Price stability is even more important and this requires a unified monetary policy under the authority of an independent central bank. The European Monetary System (EMS) set up in 1979, did reduce exchange
(47) Padoa-Schioppa, T. (1987). Efficiency, Stability and Equity: A Strategy for the Evolution of the Economic System of the European Community. Oxford: Oxford University Press.

N. 1 - 2 0 1 3
82
rate volatility, even if it allowed the occasional correction and realignments of “fun-damental” exchange rate parities because national monetary policies diverged. This caused competitive distortions in relative price levels. But if relative output prices could be corrected by devaluations and realignments, this so-called “adjustment tool” came at the price of distorting input prices, notably for capital. For, the lack of central bank credibility and the risk of future devaluations pushed up interest rates and the cost of capital for firms operating in the periphery. On the other hand, in low inflation countries like Germany, low interest rates prevailed and they benefited firms in the system’s anchor currency country. Thus, a fixed exchange rate system system-atically generates market distortions for one of the most important input factor which is capital. This policy-induced comparative advantage was one of the driving forces behind the emergence of Germany as the industrial hub of the European Union. A return to national currencies would therefore damage southern economies more than the north. The only real solution to these growth-hampering distortions was get-ting rid of national monetary policies and setting up a fair and equitable monetary union under the authority of the independent European Central Bank. Macroeconomic arguments 109 Macroeconomic discussions of monetary union have been dominated by Optimum Currency Area theory (OCA), first developed in 1961 by Robert Mundell (48). In es-sence this theory argues that there are benefits and costs from joining a currency un-ion. The benefits are the above mentioned microeconomic advantages for busi-nesses and consumers, and, provided proper institutional arrangements such as cen-tral bank independence, monetary stability. The costs consist in giving up the ex-change rate as a policy tool. If labour markets are not flexible, the adjustment to an external and asymmetric shock will be costly in terms of employment. For this reason, OCA theory has postulated that the necessary requisites for an area to be an OCA were mobility of labour and other factors of production, flexibility of wages and prices, economic openness, productive diversification, fiscal integration and inflation rate convergence. Only countries fulfilling these condition or with a high probability of symmetric shocks should join a monetary union. On most of these indicators, EU’s score was bleak: labour mobility was low, fiscal integration lacking, southern coun-tries’ diversification was insufficient. Furthermore, the alternative ‘endogenous OCA theory’, according to which the creation of a common monetary area would create the conditions necessary for its own success by itself, has not been supported by the facts. Critical economists then argued that the common currency was not sustain-able, although a smaller grouping of countries, say Germany, Austria and the Nether-
(48) Mundell, R. 1961. A Theory of Optimum Currency Areas, American Economic Review, 51(Nov.): 509-517.

R A P P O R T O C E R
83 83
lands, may be able to share a currency. Of course, this argument forgets that the first 10 years of the euro, Europe has created more jobs than ever before in its history (fig-ure 18). Even the present crisis has not eliminated all these job gains (figure 19). Figure 18. Annual job creation and distruction in the Euro Area
‐3000
‐2000
‐1000
0
1000
2000
3000
4000
1960
1962
1964
1966
1968
1970
1972
1974
1976
1978
1980
1982
1984
1986
1988
1990
1992
1994
1996
1998
2000
2002
2004
2006
2008
2010
2012
2014
Thou
sand
s of e
mpl
oyee
s
Slovakia
Slovenia
Portugal
Netherlands
Malta
Luxembourg
Italy
Ireland
Greece
France
Finland
Spain
Germany
Cyprus
Belgium
Austria
Bretton WoodsOil crisis
Ger
man
uni
ficat
ion
EURO
Lehm
an
Source: AMECO. Figure 19. Cumulative job creation in the Euro Area
0
2000
4000
6000
8000
10000
12000
14000
16000
18000
20000
1999 2000 2001 2002 2003 2004 2005 2006 2007 2008 2009 2010 2011 2012 2013 2014
thou
sand
s of
jobs
Slovakia
Slovenia
Portugal
Netherlands
Malta
Luxembourg
Italy
Ireland
Greece
France
Finland
Spain
Germany
Cyprus
Belgium
Austria
Germany
Spain
ITALY
France
Source: AMECO. 110 Be this as it may, OCA theory analyses a currency area as a fixed exchange rate re-gime. We have shown above that this is a mistake, because the single currency is the

N. 1 - 2 0 1 3
84
domestic currency for all residents within the monetary union. There is no economic difference between a national and a multinational currency area, although the po-litical differences can cause significant harm. The most important advantage of a single currency area is its economic and finan-cial robustness, which is due to the fact that the central bank is the lender of last re-sort to the banking system. The ECB has repeatedly demonstrated during the crisis that it is fulfilling this function as required. Of course, it is not a lender of last resort to governments, and that is coherent with its function of setting the Euro-economy’s hard budget constraint and maintaining price stability. The currency area is robust, however, because no member state can run out of reserves. As long as banks are solvent, they will get all the liquidity they need from the ECB (i.e. the Eurosystem). This eliminates systemically the risk of balance of payment crises and, therefore, uncer-tainty in financial markets. The problem is, of course, that if large banks become in-solvent, the ECB can no longer provide them with liquidity and the costly resolution of such banks becomes the task of governments drawing on taxpayers. But this is a po-litical problem, not an economic or institutional problem. 111 The advantages of belonging to a robust currency are significant: - At the periphery, the budget constraint of limited foreign reserves is lifted and this allows purchasing inputs from more efficient sources, thereby contributing to long run potential growth. - Stable price structures prevent the import of inflation through devaluations and thereby restore monetary stability, which is good for economic growth. - The robustness of the financial regime reduces uncertainties for investors and there-fore improves long run potential growth. - A central bank that maintains price stability reduces uncertainties for wealth owners and makes investment more attractive. It therefore supports long run potential growth. - The elimination of monetary distortions and greater price transparency re-directs competition toward improving the quality of goods and services and this will increase potential growth. - A large currency area with generates liquidity services, which lower the cost of capital and encourage investment and long run potential growth.
All these factors explain why especially many small member states find it worthwhile to join monetary union and to stay in it, even if the economic management of the currency area is suboptimal. 112 Unfortunately, one may object that the reality in the Euro Area has not confirmed these advantages. This is true. The euro is in crisis. We have argued that this is due to

R A P P O R T O C E R
85 85
the huge demand gap caused by erroneous macroeconomic policies and mis-placed austerity. The problems are made by politics and bad institutions. The institu-tional problem is not the euro or the integrated economy, but the fractured and dis-integrated political system. Member states retain and defend their political “sover-eignty”, although European political philosophy since the English and French revolu-tions has always defined citizens and people and not governments and states as the sovereign. The distinction is important. For, if governments are the sovereign, they can decide to do what they want, which in the European case implies that they will serve exclusively a narrow constituency by which they are elected. They do not need to take into account the external effects of their actions for citizens in other parts of the Union. By contrast, if citizens are the sovereign, they alone have the authority to de-termine policy orientations. They must have the liberty of choice. But this, they do not have. European economic policies are made by intergovernmental compro-mises and not by the democratic choice of citizens concerned. This is why voters are rebelling. These are ambitious goals. They can be achieved, but only if the euro is preserved and if common institutions are changed to serve the European ideal: democracy and solidarity.


![Festival della Filosofia Instabilità1].01.05.06... · Emanuela Fornari bibliografia e ricerche Lucio Saviani testi e ricerche Domenico Zampaglione testi e ricerche ... “instabili”](https://img.dokumen.tips/doc/110x75/5c6b69ca09d3f28d128ba1b1/festival-della-filosofia-instabilita-1010506-emanuela-fornari-bibliografia.jpg)