Embed Size (px)
DESCRIPTION
Multi Modal Medical Image Fusion Using Weighted Least Squares Filter
Citation preview

IJRET: International Journal of Research in Engineering and Technology eISSN: 2319-1163 | pISSN: 2321-7308
_______________________________________________________________________________________
Volume: 03 Issue: 06 | June-2014, Available @ http://www.ijret.org 134
MULTI MODAL MEDICAL IMAGE FUSION USING WEIGHTED
LEAST SQUARES FILTER
B.S. Saini1, Vivek Venugopal
2
1Associate Professor, ECE Dept., Dr B.R Ambedkar NIT Jalandhar, Jalandhar, Punjab, India
2M.Tech Student, ECE Dept., Dr B.R Ambedkar NIT Jalandhar, Jalandhar, Punjab, India
Abstract A novel multi modal medical image fusion method based on weighted least squares filter is proposed. To perform the image
fusion, a two-scale decomposition of the input images is performed. Then weighted least squares filter is used to calculate the
weight maps for the base and detail layers and then a weighted average of the base and detail layer is performed to obtain the
fused image. The performance of the proposed method was compared with several other image fusion methods using five quality
metrics based on information present (QMI), structural information retained (QY and QC), features retained (QG and QP) and it
was found that the proposed method produces a robust performance for fusion of multi-modal images.
Keywords—Medical Image, Multimodality, Image Fusion, Weighted Least Squares Filter
---------------------------------------------------------------------***---------------------------------------------------------------------
1. INTRODUCTION
Medical imaging has advanced in the last few decades with
the advent of various modalities of imaging such as CT
(Computed Tomography), MRI (Magnetic Resonance
Imaging) etc. Medical images are broadly classified, on the
basis of modality, into structural images, which provide high
resolution images with anatomical detail and precise
localization capability, and functional images, which provide
low resolution images with functional information which can
be used for diagnosis purpose.[1] [2] The emergence of these
multimodal medical images has prompted researchers to
delve into a range of applications like classification,
registration, denoising, fusion, etc.[3] Out of these
applications, medical image fusion is the process of
registering and combining complementary information
present in 2 or more medical images which vary in modality
there by providing a more complete and accurate description.
There has been extensive research in the field of medical
image fusion and various image fusion algorithms have been
devised for the same. Some of them include pixel level
techniques like Principal Component Analysis (PCA),
averaging, transform based techniques like wavelet
transform, Multi-scale Geometric Analysis (MGA)
techniques (contourlet, ripplet, etc), optimization based
techniques like neural networks, fuzzy logic, etc. [4]-[7]
pixel level techniques suffer from spectral degradation even
though they provide better results. Wavelet transform cannot
detect the smoothness along the edges. Moreover, wavelet
transform provide limited directional information since
wavelet decomposes image in only three directional highpass
subbands, namely, vertical, horizontal and diagonal. This
limits the ability to preserve the salient features of the source
images and probably introduces some artifacts and
inconsistency in the fused results. In the case of MGA
techniques, it is not possible to measure the
importance/contribution of individual source image in the
fused image. Moreover, finding an effective way of
combining the two source images is still an open problem.[2]
Optimization based techniques are time consuming in nature
since they require multiple iterations and they also tend to
over smooth the edges which is not ideal as far as fusion is
concerned. [8]
To solve the above mentioned problems, a novel method
based on weighted least squares filter has been proposed in
this paper. The remainder of the paper is organized as
follows. Section II gives a brief insight on the weighted least
squares filtering. Section III describes the proposed fusion
algorithm. Section IV deals with the experimental results and
discussions and conclusion is provided in section V.
2. WEIGHTED LEAST SQUARES FILTER
Edge preserving filters like guided filter, bilateral filter and
weighted least squares filter have been an active research
topic in image processing since they do not blur the strong
edges in the decomposition process there by reducing the
ringing artifacts.
In edge preserving filtering, we try to find a new image u
from the input image g which on one hand is as close as
possible to g and at the same time is as smooth as possible
across everywhere except at places where there is a
significant gradient in g. This can be seen as a minimization
of the expression[9]
2 2 2
x,g , , ,
1 1
(u(i, j) (i, j)) (a (i, j)( ) a (i, j)( ) ) (1)M N
i j y g i j
i j
u ug
x y
where the first term in the summation is the data term, whose
objective is to minimize the distance between u and g. The
second term in the summation is called as the regularization
term , whose objective is to achieve smoothness by
minimizing the partial derivative of u. λ provides a balance
between the two terms. Increasing the value of λ leads to
IJRET: International Journal of Research in Engineering and Technology eISSN: 2319-1163 | pISSN: 2321-7308
_______________________________________________________________________________________
Volume: 03 Issue: 06 | June-2014, Available @ http://www.ijret.org 135
progressively smoother images. x,ga (i, j) and
,a (i, j)y gare the
smoothness weights along x and y and is dependent on g. It
is given as
1
x,g
i, j
1
y,g
i, j
a (i, j) ( ) (2)
a (i, j) ( ) (3)
l
x
l
y
Where l is the log-luminance channel of the input image g, α
decides the sensitivity to the gradients of g, and ε is a
constant whose value is 0.0001 and comes of purpose where
ever g is constant.
3. IMAGE FUSION WITH WEIGHTED LEAST
SQUARES FILTER
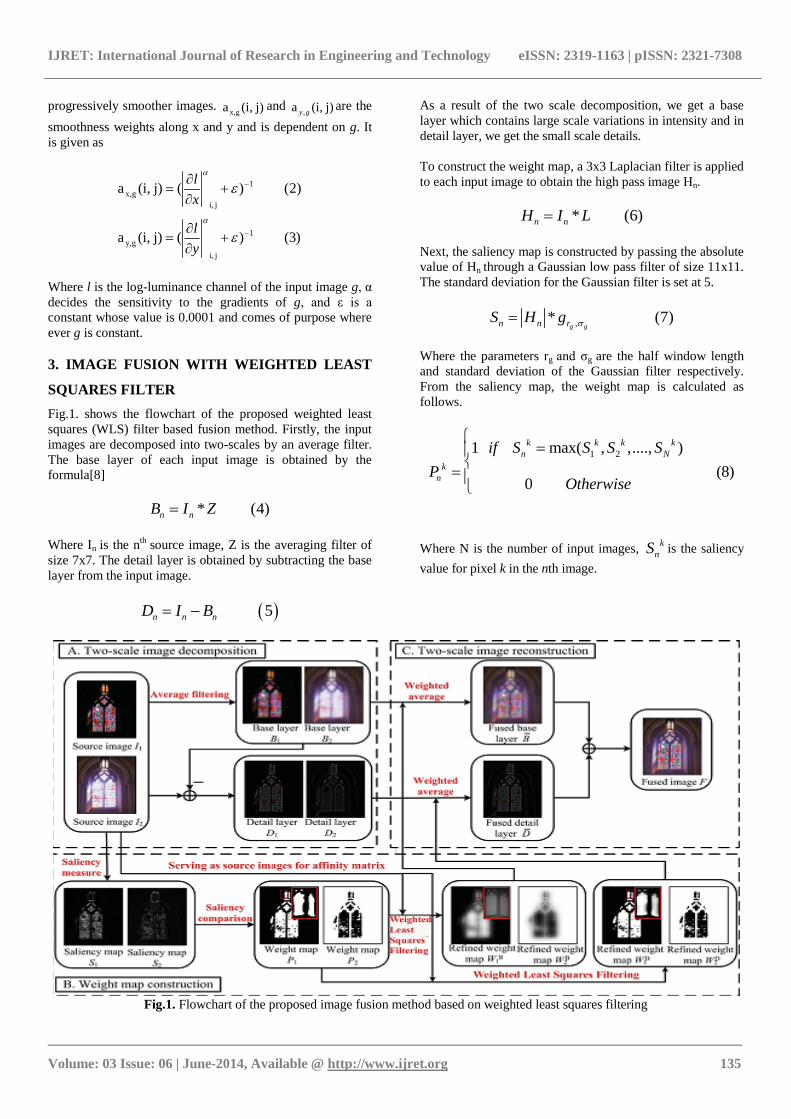
Fig.1. shows the flowchart of the proposed weighted least
squares (WLS) filter based fusion method. Firstly, the input
images are decomposed into two-scales by an average filter.
The base layer of each input image is obtained by the
formula[8]
* (4)n nB I Z
Where In is the nth
source image, Z is the averaging filter of
size 7x7. The detail layer is obtained by subtracting the base
layer from the input image.
5n n nD I B
As a result of the two scale decomposition, we get a base
layer which contains large scale variations in intensity and in
detail layer, we get the small scale details.
To construct the weight map, a 3x3 Laplacian filter is applied
to each input image to obtain the high pass image Hn.
* (6)n nH I L
Next, the saliency map is constructed by passing the absolute
value of Hn through a Gaussian low pass filter of size 11x11.
The standard deviation for the Gaussian filter is set at 5.
,* (7)g gn n rS H g
Where the parameters rg and σg are the half window length
and standard deviation of the Gaussian filter respectively.
From the saliency map, the weight map is calculated as
follows.
1 21 max( , ,...., )
(8)0
k k k k
n N
k
n
if S S S S
POtherwise
Where N is the number of input images, k
nS is the saliency
value for pixel k in the nth image.
Fig.1. Flowchart of the proposed image fusion method based on weighted least squares filtering

IJRET: International Journal of Research in Engineering and Technology eISSN: 2319-1163 | pISSN: 2321-7308
_______________________________________________________________________________________
Volume: 03 Issue: 06 | June-2014, Available @ http://www.ijret.org 136
However, the weight maps obtained through the above
process are usually noisy and are not aligned with the object
boundaries. Therefore, we pass the weight maps through a
weighted least squares filter for refining the weights and the
resulting weights are normalized so that the sum of all
weights for a particular pixel becomes one.
1 1
2 2
, n n
, n n
(P , log(I )) (9)
(P , log(I )) (10)
B
n
D
n
W W
W W
Where λ1 , α1, λ2 , α2 are the parameters of the weighted least
squares filter. B
nW and D
nW are the refined weight maps for
the base and detail layer respectively. Then, the base and
detail layer of different input images are fused together by
weighted averaging.
1
1
(11)
(12)
NB
n n
n
ND
n n
n
B W B
D W D
The fused image is obtained by adding the fused base and
detail layer.
(13)F B D
4. EXPERIMENTS AND DISCUSSION
4.1 Experimental Setup
For the comparison of the proposed technique with other
existing image fusion algorithms, an image database of 10
pairs of PET and MRI images of the head from the Harvard
brain atlas database is considered. The PET image provides
details pertaining to the functional aspect of the brain, in this
case regarding whether the person is suffering from mild
Alzheimer‟s disease or not and the MRI image provides
details pertaining to the structural aspect of the brain.
Fig.2. Sample Images of the multi-modal image database
Fig.2. shows some of the images of the multi-modal image
database. The proposed Weighted Least Squares filter based
fusion (WLS) has been compared with eight other image
fusion algorithms based on Laplacian pyramid (LAP)[10],
shift invariant wavelet transform (SWT)[11], curvelet
transform (CVT)[12], non subsampled contourlet transform
(NSCT), generalized random walks (GRW)[13], wavelet-
based statistical sharpness measure (WSSM)[14] and higher
order singular value decomposition (HOSVD)[15]
respectively. The parameter settings for the above mentioned
methods have been obtained from [2] and for the WLS based
fusion the value of λ and α are 3 and 5 for the base layer
images and 0.1 and 10 for the detail layer images.
4.2 Image Fusion Quality Metrics
In order to compare the performance of different fusion
algorithms with the proposed WLS based fusion, 5 different
quality metrics based on information present (QMI), structural
information retained (QY and QC), features retained (QG and
QP) have been considered.
4.2.1 Normalized Mutual Information (QMI)
Traditional mutual information based quality metrics suffer
from being unstable and also bias the measure towards the
source image with the highest entropy. Therefore Hossny et
al[16] devised a normalized mutual information based
quality metric to measure how well the information from the
source images is preserved in the fused image. It is given by
the formula
MI
MI(A, F) MI(B,F)Q =2 + (14)
H(A)+H(F) H(B)+H(F)
Where MI(A,F) is the mutual information between input
image A and fused image F and H(A) and H(F) are the
entropy of A and F respectively. The mutual information
between 2 images is given by the formula
MI(A,F)=H(A)+H(F)-H(A,F) (15)
Where H(A,F) is the joint entropy of images A and F. The
larger the value of the QMI , better the quality of the image
resulting from fusion.
4.2.2 Yang et. al’s Quality Metric (QY)
Yang‟s metric[17] measures how well the structural
information of the source images is preserved in the fused
image.It is mathematically defined as
w w w w w w
Y
w w w w w w
SSIM(A ,F )+(1- )SSIM(B ,F ),if SSIM(A ,B |w) 0.75Q = (16)
max{SSIM(A ,F ),SSIM(B ,F )}, if SSIM(A ,B |w)<0.75
w w
Where A and B are the input images and F is the fused
image, w is a window of size 7x7, λw is the local weight
given by the formula

IJRET: International Journal of Research in Engineering and Technology eISSN: 2319-1163 | pISSN: 2321-7308
_______________________________________________________________________________________
Volume: 03 Issue: 06 | June-2014, Available @ http://www.ijret.org 137
w
w w
(A )(17)
(A ) ( )w
s
s s B
Where s(Aw) and s(Bw) gives the variance of the input
images A and B within the window w respectively. SSIM is
the structural similarity index given by
1 d 2
w w 2 2 2 2
1 2
(2 )(2 c )(A ,B ) (18)
(( ) ( ) )(( ) ( ) c )
w w
w w w w
A B
A B A B
cSSIM E
c
Where c1 and c2 are constants, wA and
wB are the mean
pixel intensity values of input images A and B in the
window w, wA and
wB are the standard deviation of
images A and B in the window w and d is the covariance
of A and B in the window w. The larger the value of the QY,
better the quality of the image resulting from fusion.
4.2.3 Cjevic et. al’s Quality Metric (QC)
Cjevic‟s metric[18] estimates how well the important
information in the source images is preserved in the fused
image.It is given by the formula
w w w w w w w w w w(A , , ) UIQI(A , ) (1 (A , , )) UIQI( , ) (19)CQ B F F B F B F
Where µ(Aw, Bw, Fw) is the local weight in a window w
given by the formula:
w w w
0 0
(A , , ) 0 1 (20)
1 1
AF
AF BF
AF AF
AF BF AF BF
AF
AF BF
if
B F if
if
Where AF and BF are the covariance of images A and B
with F respectively and UIQI(Aw,Fw) is the universal image
quality index between A and F in the window w. UIQI is
calculated as follows.
w w 2 2
A A
4UIQI(A , ) (21)
( )( )
AF A F
F F
F
Where AF is the covariance of image A with F, A and
F are the average pixel intensity values of images A and
F and A , F are the standard deviation of images A and
F respectively. The larger the value of the QC , better the
quality of the image resulting from fusion.
4.2.4 Gradient Based Index (QG)
The gradient based index (QG )[19]measures how well the
edge information of the source images is preserved and is
given by the formula provided in equation number 22.
A
A
AF F
1 1
1 1
(Q (i, j) (i, j) Q (i, j) (i, j))
(22)
( (i, j) (i, j))
B
B
M N
B
i j
G M N
i j
Q
Where the image is considered of size MxN, QAF(i,j) and
QBF(i,j) are the edge strength at pixel location (i,j) and
A (i, j) and (i, j)B denote the importance of QAF(i,j) and
QBF(i,j) respectively. The larger the value of the QG , better
the quality of the image resulting from fusion.
4.2.5 Phase Congruency Based Index (QP)
QP [8]measures how well the important features present in
the input images are preserved in the fused image and is
given by the formula
M m( ) (P ) (P ) (23)P pQ P
Where Pp, PM, Pm are the phase congruency, maximum and
minimum moment parameters respectively. α, β and γ are
the exponents and is set to one in this paper
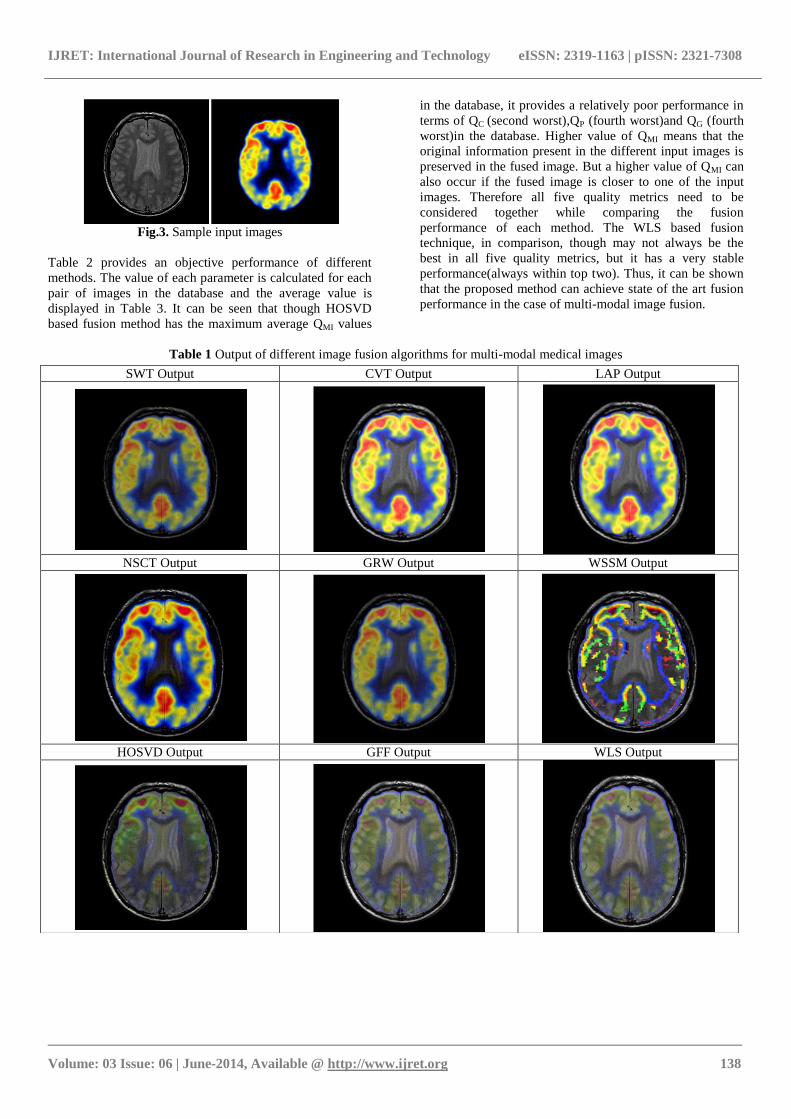
4.3 Experimental Results and Discussions
Fig 3 shows sample of two medical images from the multi-
modal medical image database, Magnetic Resonance
Imaging (MRI) and Positron Emission Tomography (PET)
of a patient suffering from mild Alzheimer‟s disease
respectively. The MRI image shows the structure and the
PET image shows the metabolic activity present inside the
human head. Table I shows the result of the fusion of the
two images using the proposed method and other exisitng
image fusion algorithms. The result produced by SWT and
GRW method reduces the brightness of the overall fused
image there by making some details unclear. The WSSM
based method does not work for this set of images because it
introduces serious artifacts in the fused image. The HOSVD
based method reduces the brightness in the metabolic
information there by losing some important metabolic
information. Though, the GFF and WLS based fusion
algorithms are able to preserve the features of the input
images without any visible artifacts and brightness
distortions, and are also able to preserve the complementary
information present in both the input images.
IJRET: International Journal of Research in Engineering and Technology eISSN: 2319-1163 | pISSN: 2321-7308
_______________________________________________________________________________________
Volume: 03 Issue: 06 | June-2014, Available @ http://www.ijret.org 138
Fig.3. Sample input images
Table 2 provides an objective performance of different
methods. The value of each parameter is calculated for each
pair of images in the database and the average value is
displayed in Table 3. It can be seen that though HOSVD
based fusion method has the maximum average QMI values
in the database, it provides a relatively poor performance in
terms of QC (second worst),QP (fourth worst)and QG (fourth
worst)in the database. Higher value of QMI means that the
original information present in the different input images is
preserved in the fused image. But a higher value of QMI can
also occur if the fused image is closer to one of the input
images. Therefore all five quality metrics need to be
considered together while comparing the fusion
performance of each method. The WLS based fusion
technique, in comparison, though may not always be the
best in all five quality metrics, but it has a very stable
performance(always within top two). Thus, it can be shown
that the proposed method can achieve state of the art fusion
performance in the case of multi-modal image fusion.
Table 1 Output of different image fusion algorithms for multi-modal medical images
SWT Output CVT Output LAP Output
NSCT Output GRW Output WSSM Output
HOSVD Output GFF Output WLS Output

IJRET: International Journal of Research in Engineering and Technology eISSN: 2319-1163 | pISSN: 2321-7308
_______________________________________________________________________________________
Volume: 03 Issue: 06 | June-2014, Available @ http://www.ijret.org 139
Table 2 Objective performances of different image fusion methods
5. CONCLUSIONS
In this paper, a novel image fusion method based on
weighted least squares filter was presented for multi-modal
medical image fusion. The proposed method uses a two-
scale representation using an average filter. The weighted
least squares filter is used in a novel way for refinining the
weight maps of the base and detail layers. Experiments
show that the proposed method can preserve the
complementary information present in multiple input images
without introducing any artifacts or distortions. The
proposed method also gives a robust performance in terms
of the different quality metrics. Future work in this area
could be setting the different parameters of the weighted
least squares in adaptively to improve the performance of
the proposed method
REFERENCES
[1] S. Das, M. Chowdhury, M. K. Kundu “Medical
Image Fusion Based On Ripplet Transform Type-I”,
Progress In Electromagnetics Research B, Vol. 30,
355-370, 2011
[2] S. Das, M.K Kundu “A Neuro-Fuzzy Approach for
Medical Image Fusion”, IEEE Transactions On
Biomedical Engineering, Vol. 60, 3347-3353,2013
[3] R. Singh , R. Srivastava, O. Prakash, A. Khare.
“Mixed Scheme Based Multimodal Medical Image
Fusion using Daubechies Complex Wavelet
Transform”, IEEE/OSA/IAPR International
Conference on Informatics, Electronics & Vision
2012
[4] C. He, Q. Liu, H. Li, H. Wang, “Multimodal Medical
Image Fusion Based on IHS and PCA”, Symposium
on Security Detection and Information Processing,
2010.
[5] Q. Guihong, Z. Dali, Y. Pingfan, “ Medical Image
Fusion by Wavelet Transform Modulus Maxima”,
Optics Express 9 (4), 184-190, 2001.
[6] L. Yang, B.L. Guo, W. Ni, and Y. Tagawa,
“Multimodality Medical Image Fusion Based on
Multiscale Geometric Analysis of Contourlet
Transform,” Neurocomputing 72 ,203–211,2008
[7] A. Villeger, L. Ouchchane, J.J Lemaire, J.Y Boire, “
Data Fusion and Fuzzy Spatial Relationships for
Locating Deep Brain Stimulation Targets in
Magnetic Resonance Images ” in Advanced Concepts
for Intelligent Vision Systems, Springer, 909-919,
2006
[8] S. Li, X. Kang, S. Member, and J. Hu, “Image Fusion
with Guided Filtering,” vol. 22, no. 7, pp. 2864–
2875, 2013.
[9] Z. Farbman, D. Lischinski, and R. Szeliski, “Edge-
Preserving Decompositions for Multi-Scale Tone and
Detail Manipulation,” 2007.
[10] P. Burt and E. Adelson, “The Laplacian pyramid as a
compact image code,” Commun. IEEE Trans., vol. C,
no. 4, pp. 532–540, 1983.
[11] O. Rockinger, “Image Sequence Fusion Using a
Shift-Invariant Wavelet Transform,” pp. 288–291,
1997.
[12] F. E. Ali, A. A. Saad, and F. E. A. El-samie, “Fusion
of MR and CT Images Using The Curvelet
Transform,” no. Nrsc, 2008.
[13] R. Shen, I. Cheng , and J. Shi, “Generalized Random
Walks for Fusion of Multi-exposure images,” vol. 20,
no. 12, pp. 1–13, 2011.
[14] J. Tian and L. Chen, “Adaptive multi-focus image
fusion using a wavelet-based statistical sharpness
measure,” Signal Processing, vol. 92, no. 9, pp.
2137–2146, 2012.
[15] Junli Liang, Yang He, Ding Liu, and Xianju Zeng,
“Image Fusion Using Higher Order Singular Value
Decomposition,” vol. 21, no. 5, pp. 2898–2909,
2012.
[16] M. Hossny, S. Nahavandi, and D. Creighton,
“Comments on „ Information measure for
performance of image fusion ,‟” vol. 44, no. 18, pp.
2–3, 2008.
[17] C. Yang, J.-Q. Zhang, X.-R. Wang, and X. Liu, “A
novel similarity based quality metric for image
fusion,” Inf. Fusion, vol. 9, no. 2, pp. 156–160, Apr.
2008.
[18] N. Cvejic, A. Łoza, D. Bull, and N. Canagarajah, “A
Similarity Metric for Assessment of Image Fusion
Algorithms,” vol. 1, no. 4.
[19] C.S. Xydeas, V. Petrovic, “Objective Image Fusion
Performance Measure,” Electronics Letters vol. 36,
no. 4, pp. 308–309, 2000.
Source
Images Index SWT CVT LAP NSCT GRW WSSM HOSVD GFF WLS
Harward
Medical
Database
QY 0.6975 0.7019 0.7621 0.7685 0.6851 0.7914 0.9133 0.8943 0.9281
QC 0.6108 0.6470 0.6645 0.6815 0.5425 0.7132 0.6085 0.7734 0.8092
QG 0.5752 0.5481 0.6670 0.6384 0.4429 0.6193 0.6006 0.6802 0.7043
QP 0.5215 0.4722 0.5742 0.5443 0.4050 0.3392 0.5182 0.6310 0.6743
QMI 0.5754 0.5192 0.5302 0.6700 0.5614 0.7136 0.8608 0.6848 0.7222


