Embed Size (px)
Citation preview

International Journal of Innovative Research in Advanced Engineering (IJIRAE) ISSN: 2349-2163 Issue 2, Volume 2 (February 2015) www.ijirae.com
___________________________________________________________________________________________________ © 2015, IJIRAE- All Rights Reserved Page - 101
Test of Raw Water Processing Model Using Natural Zeolite from South Sulawesi as Filtration for
Heavy Metal Lead (Pb) Sukmasari Antaria Mary Selintung Muh. Saleh Pallu Mukhsan Putra Hatta
Doctoral Student, Professor, Professor, Lecturer, Civil Engineering, Civil Engineeri ng, Civil Engineering, Civil Engineering Hasanuddin University Hasanuddin University Hasanuddin University Hasanuddin University
Abstract--- This study aims to observe the characteristics of natural zeolite from South Sulawesi which is used as a filter of heavy metals lead (Pb) in the raw water. Zeolites are activated by heated 100 °C, 200 °C, 300 °C and 400 °C. The zeolite is characterized by XRD (X-Ray Difraction) and SEM (Scanning Electron Microscope). Furthermore, the activated zeolites already crushed or pulverized with a mesh sized 170 or 3 mm, and then weighed with the weight of 20 g, 35 g and 50 g, respectively. Water sample of Jeneberang river, taken from three locations on the river Dam Jeneberang. Reservoir is filled with 8 liters of raw water that has been injected with 5 ppm of heavy metals lead (Pb). Then streamed or run on the water treatment models and the contact time is calculated to produce clean water of 1000mL. Similar treatment is performed at each weight variation of zeolite. Result of the water processed is tested by means of AAS (Atomic Absorption Spectrophotometry). Absorbance values obtained are 20 g (0.000), 35 g (0.000) and 50 g (-0.001) respectively. The result of analysis with a model testing is obtained, the Langmuir model (R=99,8 %), and the Freudlich model (R=98,1 %).
Keywords--- Natural Zeolites of South Sulawesi, Water Treatment Model, Raw Water, Heavy Metal Lead (Pb)
I. INTRODUCTION Aspects of the deterioration of the quality of life and its influence, requiring handling in concrete is the aspect of
pollution on water. Considering that the human body consists of 70 % water, then in his life human always requires clean water / drinking water (Sumirat, 1994).
Pollution of the marine environment, resulted in the fact that the water consumed for everyday. Mostly, the clean water/drinking water used by urban hoseholds does not meet the health requirement and even in some places is no longer suitable for drinking. The water ADW contains hazardous toxic material (heavy metal) (Rahman, 2004).
If heavy metals are accumulated in the human body in large amount can cause a variety of health problems. For example; heavy metals of Lead (Pb), if it accumulates in the human body resulting in disorders of the brain, kidneys, bones and mental retardation in children who are growing. The maximum levels allowed in drinking water is 0.05 mg / Liter (Moore, 1991 in Effendi, 2003).
The binding of toxic substance and heavy metals contained in the raw water requires a means of costly equipment and materials. However, in Kasinggiran Hamlet and Sangkaropi Hamlet in Sangkaropi Village, Toao and Mendilla district of Sa’dang Balusu in North Toraja Regency and Luwu in South Sulawesi, discovered the mineral zeolites by many researchers, used as a versatile mineral that includes; dehidrater, as adsorbent and molecular sieves, as well as the catalyst and ion exchange (ion exchanger).
In this study, natural zeolite South Sulawesi is used to reduce toxic materials contained in the raw water. Adsorption and filtration method is used in this processing. The processed water is expected to meet the quality requirements, in accordance with the Regulation of the Minister of Health of the Republic of Indonesia (492 / Menkes / Per/ IV/ 2010).
According to the description of the background, the aims of the research are: What is the characteristic of South Sulawesi zeolite nature ? What about the ability of natural zeolite South Sulawesi as raw water filtration Jeneberang River ? How to determine the relations between actual concentrating and absorbance ?
II. BIBLOGRAPHY A.Water Quality Issues on River System in Indonesia
According to Sennang (1995), in 2020 Indonesian people was predicted to increase and reached ±262,409,000 people. South Sulawesi would reach ±9,800,000 people. The needs of water will increase whether the quantities, qualities, or types of use. The fulfill of water availability for people will be more depending on quality of Stream River Area at down stream. The result from Water Resource Research Center, about reservoir water quality in Indonesia, that for 1996-2010 period, including Bili-Bili Reservoir in South Sulawesi which has high sedimentation level. The dame having water turbidity from 29,00-152.000 NTU, going across the limit, 6000 NTU (Nhepelometric Turbidity Unit) (SEPLH Journal In Hamzah, 2010). B. Drinking Water Supplying Requairentment

International Journal of Innovative Research in Advanced Engineering (IJIRAE) ISSN: 2349-2163 Issue 2, Volume 2 (February 2015) www.ijirae.com
___________________________________________________________________________________________________ © 2015, IJIRAE- All Rights Reserved Page - 102
Based on Nusa & Satmoko (2008), the main problem which still been facing in drinking water supply in Indonesia are: a. The level of service is low. b. Amount of water in rainy season and dry season is flutiative. c. The red technology for processing is less suitable with the water condition which quality is decreasing.
The water that is properly drink, has requairentment standart,those are physis, chemical, bacteriologist requairentment, of which is one unit. If there is on parameter that can not fulfill the requairentment, the water is not proper to drink. According to Ministry of Health (No.492/MenKes/Per/IV/2010) Republic of Indonesia. C. Water Processing Theory
According to Joko (2010), there are two kinds of water processing which is commonly used for this, namely: 1. Complete processing; here, the standard water experienced complete processing namely: physical, chemical, and
bacteriological processing. This processing is done for standard water of the turbid / dirty river 2. Partial Processing; standard water only experience chemistry and or bacteriological processing.
In the complete processing, there are three levels of processing, namely: a. Physical Processing; to reduce / eliminate rough impurities, isolate mud and sand, reduce organic substances that
exist in the water which will be processed. Physical processing is done without additional chemistry substance b. Chemical Processing; to help out the next processing, for example, placing alum that cut down on existing turbidity. c. Biology Processing; to kill/destroy bacteria especially bacterium which cause disease contained in water, for
example: coliform bacteria causes stomachache. One of processing is increasing disinfectant (alum) D. Filtration Theory
Filtration is a process which is used in water processing to separate pollutants (particulate) that is contained in water. In the process, water seeps and passes through the filter media so it will be accumulated on the surface of the filter and collected throughout the depth of the media in its path. Filters also have the ability to separate all the sizes of particulates including algae, viruses and soil colloids
Several types of media filter, namely: 1. Single media filter is a filtration process which requiring a single media types, usually sand or anthracite (dissolving
coal). 2. Dual-media filter is a filtration process requiring two kinds of media types, usually sand and anthracite. 3. Multi-media filter is a filtration process requiring three or more kinds of media types, usually use sand, anthracite and
granite. E. Zeolite Theory
According to Agung, et al (2007) zeolite was first discovered by Swede mineral expert in 1756, named AF Cronstedt. Naming zeolite came from the Greek, meaning "scum stone", agree with its nature, it will effervesce when it is heated at temperatures of 100 °C - 150 °C.
The composition of natural zeolite consist of a compound of alumino silicate hydrate and alkali metal element with chemical and physical properties such as a high degree of hydration, low space density, capable of cation exchange, uniform molecular channels in hydrated crystals, catalyst and conductivity of the flow of electricity (energy services and mineral resources of South Sulawesi province, 2001).
The basic framework of zeolite structure consist of tetrahedral units [AIO4] and [SiO4] which are interconnected through O atoms (Barrer 1987).
Fig. 1 The main framework of the zeolite
The structure Si4+ can be replaced by Al3+ (Figure 1), so the general formula of zeolite composition can be expressed as follows:
Mx/n
[(AlO2)
x(SiO
2)
y] m H
2O (Auerbach, et.al, 2003) (1)
With n: the valence of cation M (alkali / alkaline), x, y = number per unit cell of tetrahedron m = number per unit cell of water molecules and M = cation alkali / soil alkaline. F. The Properties of Zeolite Zeolites have chemical properties, including: a. Dehydration
According Barrer (1992), the nature of zeolite dehydration affect the nature of absorbtion. The uniqueness lies in the specific structure of zeolite pore. In natural zeolite, in the pores are cations or water molecules. When cations or water molecules are removed from the pores with a particular treatment, it will leave the empty zeolite pores.

International Journal of Innovative Research in Advanced Engineering (IJIRAE) ISSN: 2349-2163 Issue 2, Volume 2 (February 2015) www.ijirae.com
___________________________________________________________________________________________________ © 2015, IJIRAE- All Rights Reserved Page - 103
b. Absorption According to Khairinal (2000), under condition normal, void pores of zeolite crystal are filled with water molecules around the cation when heated the water will be released. The already heated zeolite can be used as gas or liquid adsorber.
c. Ion exchanger According to Bambang, et. Al (1995), Ions in the pores are used to keep it under neutral condition. These ions can freely move so that the accurring ion exchange depends on their kind, size, and charge. Ion exchange characteristic of zeolite relies on their cation, anion, and temperature.
d. Filter According to Bambang et. Al (1995), zeolite can filter or separate molecules based on their polarity, size, and shape because zeolite has a large pore and void. The Smaller molecule than void and pore of zeolite can go through the pore but the big one will be trapped.
G. Zeolite Function According to Department of Energy and Mineral Resource, South Sulawesi (2001), zeolite can be used as :
1. Agricultural use, such as fertilizer 2. Animal feed supplement 3. Ammonium ion adsorber and other poisons in soil or for remediation of formerly mined land, and as filter in water
purification system. H. Zeolite Potency
According to South Sulawesi Department of Energy and Mineral Resource (2001), natural zeolite potency has been found in Sangkaropi and Kasinggiran Village, Toao and Mendilla, Sa’dang Balusu subdistrict, Luwu and North Toraja Regency. 122,952,000 ton zeolite has been found in 153.5 ha land with 59.27 hectares land filed using mining license.
III. METHOD This research is divided into several stages : 1. Preparation Researches
At this stage of preparation and collection of research material, such as manufacturing of water treatment apparatus, sampling of natural zeolite in the district of North Toraja on South Sulawesi and sampling of Jeneberang river water were also prepared materials and laboratory equipment.
2. Implementation Research Implementation of the research includes : a. Test of Raw Water of Jeneberang River
- Raw water sampling of Jeneberang river is tested by means of AAS (Atomic Absorption Spectrophotometer), conducted to determine the metal content of Lead (Pb) in the raw water, but what is also observed : pH, DO, BOD5 and COD.
- Place of swamp water sampling, location of water taken into the dam, amid dam and the water coming out of the dam.
b. Activation of natural zeolite - Cleaned sample of Zeolite, then dried in the open air - Variety of heats : 100 °C, 200 °C, 300 °C and 400 °C - Samples of zeolites are crushed or pulverized and then sieved with a 170 mesh sieve to get the grain size of 170
mesh or 3 mm. c. The activated zeolite samples are taken sufficiently to characterize using XRD type Rigakuminifleks II and SEM
(Scanning Electron Microscope) or energy Dispersive Spectrocopy (SEM-EDX) type 3 Vega Tescan. The samples
Fig.2 (a) Zeolit of Sangkaropi Fig. 2 (b). Zeolit of Kasinggiran

International Journal of Innovative Research in Advanced Engineering (IJIRAE) ISSN: 2349-2163 Issue 2, Volume 2 (February 2015) www.ijirae.com
___________________________________________________________________________________________________ © 2015, IJIRAE- All Rights Reserved Page - 104
-100000
100002000030000400005000060000700008000090000
38.
14 13.…
18.…
23.…
28.7 33
.…38
.…44
.…49
.…54
.4 59.…
64.…
69.…
74.…
Inte
nsita
s (cp
s)
2 Theta
Zeolit akt 400 mesh 170Zeolit akt 400 mesh 150Zeolit 300Zeolit akt 200Zeolit akt 100Zeloit LautZeolit Darat
were characterized to determine the content of compounds and natural zeolite pore surface of Toraja in South Sulawesi
d. Test of raw water treatment model - Reservoir was filled by 8 liters of raw water that has been injected wih 5 ppm of heavy metal lead (Pb) - Samples of zeolites that have been activated, weighed each; 20 grams, 35 grams, and 50 grams. Then put in a
water treatment apparatus that is on the tube 2, 3, and 4. - Reservoir faucet is opened and drained for running into the water treatment apparatus and the contact time is
calculated to produce clean water 1000ml. Same treatment for each weight variety. - The processed water is tested by means of AAS (Atomic Absorption Spectrophotometer) type Shimadzu AA
7000. The results showed that the value of concentration and the decreasing of the actual absorbance.
IV. RESULTS AND DISCUSSION 1. Test Result of Samples in the Jeneberang River
Jeneberang river water sampling taken at three places, namely ; taking incoming dams, the water in the dam and the water coming out of the dam. The water samples were tested by means of AAS (Atomic Absorption Spectrophotometer), to determine the metal content of lead (Pb) in the raw water, the result can be observed in Table 1.
Table 1. AAS Test Results Lead (Pb) Jeneberang River
Sungai Jeneberang Bendungan Bili-Bili Hasil AAS Pb DO (mg/lt) DHL (Ω-1) BOD5
(mg/lt) COD
(mg/lt)
pH (5,8) Air masuk bendungan -0,001 ppm 9,2 114,4 1,76 2,46
pH (6) Air di dalam bendungan -0,000 ppm 10,8 103,9 1,36 2,10
pH (5,5) Air keluar dari bendungan -0,001 ppm 9,8 128,2 1,76 3,20 2. Results Characterization of Zeolite Toraja in South Sulawesi
a. Figure of difragtogram Natural Zeolite Toraja, with the activation of heating; 100 ºC, 200 ºC, 300 ºC and 400 ºC by using X-Ray Diffraction type Rigaku Minifleks.
Fig. 3 Difragtogram natural Zeolite of South Sulawesi
TABLE 2. COMPOSITION OF ZEOLITES IN TORAJA WITH VARIATION OF TEMPERATURE
Conten of zeolite Temperatute
100 ºC (%) 200 ºC (%) 300 ºC (%) 400 ºC (%) Quartz, syn 90 45
Potassium Chloride 3,9 Zeolite P, (Na)
Quartz low HP, syn 2.98
Muscovite-2M1 71.1
Zeolite P, (Na) 25.9
Quartz low, syn 66.1

International Journal of Innovative Research in Advanced Engineering (IJIRAE) ISSN: 2349-2163 Issue 2, Volume 2 (February 2015) www.ijirae.com
___________________________________________________________________________________________________ © 2015, IJIRAE- All Rights Reserved Page - 105
Muscovite-2M1 20 14 Zeolite F (Na), Pentasodiumtecto-pdentaalumo pentasilicate
nonahydrate 13.9
Albite, ordered 26
Potassium Tecto-Alumotrisilicate 9
Zeolite Nu-6(2), Silicon Dioxide 2.5
Sodalite 3.1
b. Pore surface SEM image of natural zeolite results Toraja in South Sulawesi with activation of heating 100 ºC, 200 ºC, 300 ºC and 400 ºC
Fig. 4 Scanning Electron Microscope- Energy Dispersive Spectroscopy (SEM-EDX) tipe TESCAN 3 VEGA Activation of Natural Zeolite (100 ºC, 200 ºC, 300 ºC dan 400 ºC)
3. Test Results Water Treatment Equipment Hasil running air baku yang telah disuntik dengan 5 ppm logam berat timbal (Pb)
Table 3. Hasil Uji Pengolahan Air Baku No. Activation Zeolite
(Gram) Thickness
(cm) Begin
pH End pH Water Volume
(mL) Time Contact
(minutes)
1. 100 0C 20 1 5 6 1000 38 35 2 5 6 1000 44 50 3 5 5 1000 50
2. 200 0C 20 1 5 6 1000 28 35 2 5 6 1000 32 50 3 5 5 1000 60
3. 300 0C 20 1 5 6 1000 26 35 2 5 6 1000 39 50 3 5 5 1000 45
4. 400 0C 20 1 5 6 1000 44 35 2 5 6 1000 60 50 3 5 5 1000 77
4. Water Treatment results using AAS The processed water is taken as 100 mL to be tested or injected into the AAS instrument, before the injected first made a
standard solution or a standard curve in order to obtain test results as follows: Zeolite : 20 gram Table 4. Manufacture of standard solutions The regression equation is: y= 0,0205푥 + 0,0007
International Journal of Innovative Research in Advanced Engineering (IJIRAE) ISSN: 2349-2163 Issue 2, Volume 2 (February 2015) www.ijirae.com
___________________________________________________________________________________________________ © 2015, IJIRAE- All Rights Reserved Page - 106
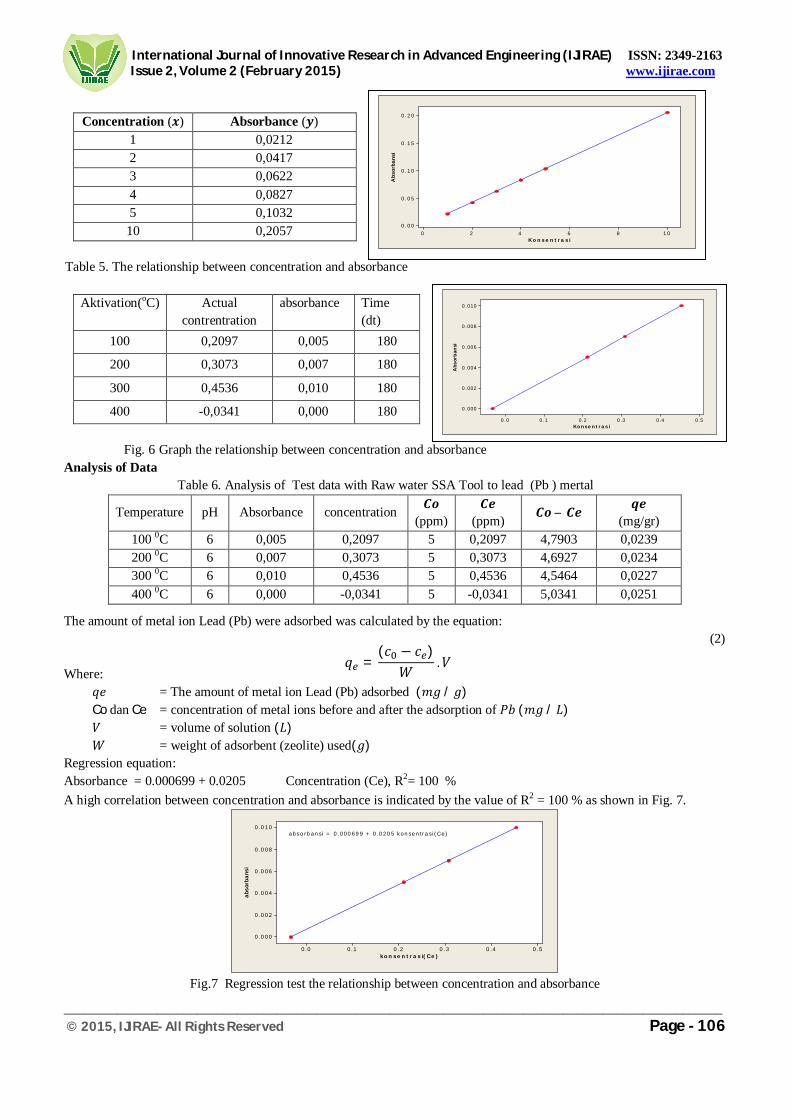
Concentration (풙) Absorbance (풚)
1 0,0212 2 0,0417 3 0,0622 4 0,0827 5 0,1032 10 0,2057
Fig. 5 Standard curva Table 5. The relationship between concentration and absorbance
Aktivation(oC) Actual contrentration
absorbance Time (dt)
100 0,2097 0,005 180
200 0,3073 0,007 180
300 0,4536 0,010 180
400 -0,0341 0,000 180 Fig. 6 Graph the relationship between concentration and absorbance Analysis of Data
Table 6. Analysis of Test data with Raw water SSA Tool to lead (Pb ) mertal
Temperature pH Absorbance concentration 푪풐 (ppm)
푪풆 (ppm) 푪풐– 푪풆 풒풆
(mg/gr) 100 0C 6 0,005 0,2097 5 0,2097 4,7903 0,0239 200 0C 6 0,007 0,3073 5 0,3073 4,6927 0,0234 300 0C 6 0,010 0,4536 5 0,4536 4,5464 0,0227 400 0C 6 0,000 -0,0341 5 -0,0341 5,0341 0,0251
The amount of metal ion Lead (Pb) were adsorbed was calculated by the equation: (2) Where:
푞푒 = The amount of metal ion Lead (Pb) adsorbed (푚푔/푔) CodanCe = concentration of metal ions before and after the adsorption of 푃푏(푚푔/퐿) 푉 = volume of solution (퐿) 푊 = weight of adsorbent (zeolite) used(푔)
Regression equation: Absorbance = 0.000699 + 0.0205 Concentration (Ce), R2= 100 %
A high correlation between concentration and absorbance is indicated by the value of R2 = 100 % as shown in Fig. 7.
0 . 50 .40 .30 .20 .10 .0
0 .0 10
0 .0 08
0 .0 06
0 .0 04
0 .0 02
0 .0 00
ko n s e n t r a s i( Ce )
abso
rban
si
a bs o rb a n s i = 0 . 000 69 9 + 0 .0 20 5 kon se n tr a s i (C e )
Fig.7 Regression test the relationship between concentration and absorbance
1 086420
0 .2 0
0 .1 5
0 .1 0
0 .0 5
0 .0 0
K o n s e n t r a s i
Abs
orba
nsi
0.50.40 .30.20 .10 .0
0 .010
0 .008
0 .006
0 .004
0 .002
0 .000
Ko nse nt r a s i
Abs
orb
ansi
푞 =(푐 − 푐 )
푊.푉

International Journal of Innovative Research in Advanced Engineering (IJIRAE) ISSN: 2349-2163 Issue 2, Volume 2 (February 2015) www.ijirae.com
___________________________________________________________________________________________________ © 2015, IJIRAE- All Rights Reserved Page - 107
A high correlation between concentration and absorbance is indicated by the value of R2 = 100 % as shown in Table 7. Analysis of testing
Table 7. Analysis of testing Langmuir model and Freudlich 20 gram
Absorbance Concentration (Ce) qe log (ce) log (qe) ce/qe 0.005 0.2097 0.0239 -0.6784 -1.6216 8.774059 0.007 0.3073 0.0234 -0.51244 -1.63078 13.13248 0.01 0.4536 0.0227 -0.34333 -1.64397 19.98238
0 -0.0341 0.0251 #NUM! -1.60033 -1.35857 Langmuir Model Regression equation: ce/qe = - 0.076 + 43.6 Concentration (Ce), R2= 99,8 %
Equilibrium model (isothermal) absorption conducted to determine the effectiveness of a process of absorption of the metal ions Pb and adsorbent (zeolite) or based on the linearity of the relationship Ce / qe vs. Ce
0 .50 .40 .30 .20 .10 .0
2 0
1 5
1 0
5
0
ko n s e n t ra s i(Ce )
ce/q
e
ce /q e = - 0 .076 + 4 3 .6 ko ns e n tr a s i(C e )
Fig. 8 Graph testing Langmuir models
A high correlation between ce / qe versus ce, this is indicated by the value of R2 = 99.8 %
Freundlich Model Regression equation: log (qe) = - 1,67 - 0,0668 log (ce), R2= 98,1 % Freundlich isothermal or equilibrium models, also observed by the linearity of the relationship log qe versus log Ce shown in Fig. 9.
- 0 ,3- 0 ,4- 0 ,5- 0 ,6- 0 ,7
- 1 ,6 2 0
- 1 ,6 2 5
- 1 ,6 3 0
- 1 ,6 3 5
- 1 ,6 4 0
- 1 ,6 4 5
lo g ( c e )
log
(qe)
lo g ( q e ) = - 1 ,6 7 - 0 , 0 6 6 8 lo g ( c e )
Fig. 9 Graph Testing Freundlich models
A high correlation between log qe versus log ce, this is indicated by the value of R2 = 98.1 % Zeolite : 35 gram
International Journal of Innovative Research in Advanced Engineering (IJIRAE) ISSN: 2349-2163 Issue 2, Volume 2 (February 2015) www.ijirae.com
___________________________________________________________________________________________________ © 2015, IJIRAE- All Rights Reserved Page - 108
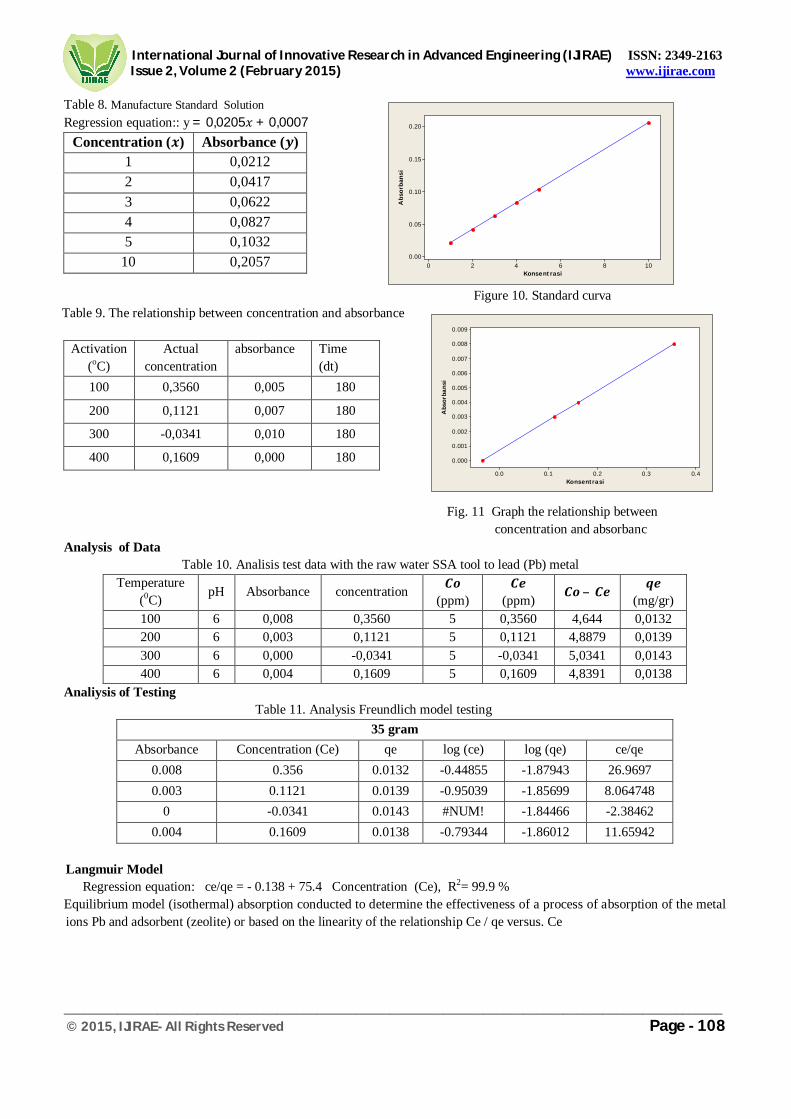
Table 8. Manufacture Standard Solution Regression equation:: y= 0,0205푥 + 0,0007
Concentration (풙) Absorbance (풚) 1 0,0212 2 0,0417 3 0,0622 4 0,0827 5 0,1032
10 0,2057
Figure 10. Standard curva Table 9. The relationship between concentration and absorbance
Activation (oC)
Actual concentration
absorbance Time (dt)
100 0,3560 0,005 180
200 0,1121 0,007 180
300 -0,0341 0,010 180
400 0,1609 0,000 180
Fig. 11 Graph the relationship between concentration and absorbanc
Analysis of Data Table 10. Analisis test data with the raw water SSA tool to lead (Pb) metal
Temperature (0C) pH Absorbance concentration 푪풐
(ppm) 푪풆
(ppm) 푪풐– 푪풆 풒풆 (mg/gr)
100 6 0,008 0,3560 5 0,3560 4,644 0,0132 200 6 0,003 0,1121 5 0,1121 4,8879 0,0139 300 6 0,000 -0,0341 5 -0,0341 5,0341 0,0143 400 6 0,004 0,1609 5 0,1609 4,8391 0,0138
Analiysis of Testing Table 11. Analysis Freundlich model testing
35 gram Absorbance Concentration (Ce) qe log (ce) log (qe) ce/qe
0.008 0.356 0.0132 -0.44855 -1.87943 26.9697 0.003 0.1121 0.0139 -0.95039 -1.85699 8.064748
0 -0.0341 0.0143 #NUM! -1.84466 -2.38462 0.004 0.1609 0.0138 -0.79344 -1.86012 11.65942
Langmuir Model
Regression equation: ce/qe = - 0.138 + 75.4 Concentration (Ce), R2= 99.9 % Equilibrium model (isothermal) absorption conducted to determine the effectiveness of a process of absorption of the metal ions Pb and adsorbent (zeolite) or based on the linearity of the relationship Ce / qe versus. Ce
1086420
0.20
0.15
0.10
0.05
0.00
Konsentrasi
Abs
orba
nsi
0.40.30.20.10.0
0.009
0.008
0.007
0.006
0.005
0.004
0.003
0.002
0.001
0.000
Konsentrasi
Abs
orba
nsi
International Journal of Innovative Research in Advanced Engineering (IJIRAE) ISSN: 2349-2163 Issue 2, Volume 2 (February 2015) www.ijirae.com
___________________________________________________________________________________________________ © 2015, IJIRAE- All Rights Reserved Page - 109
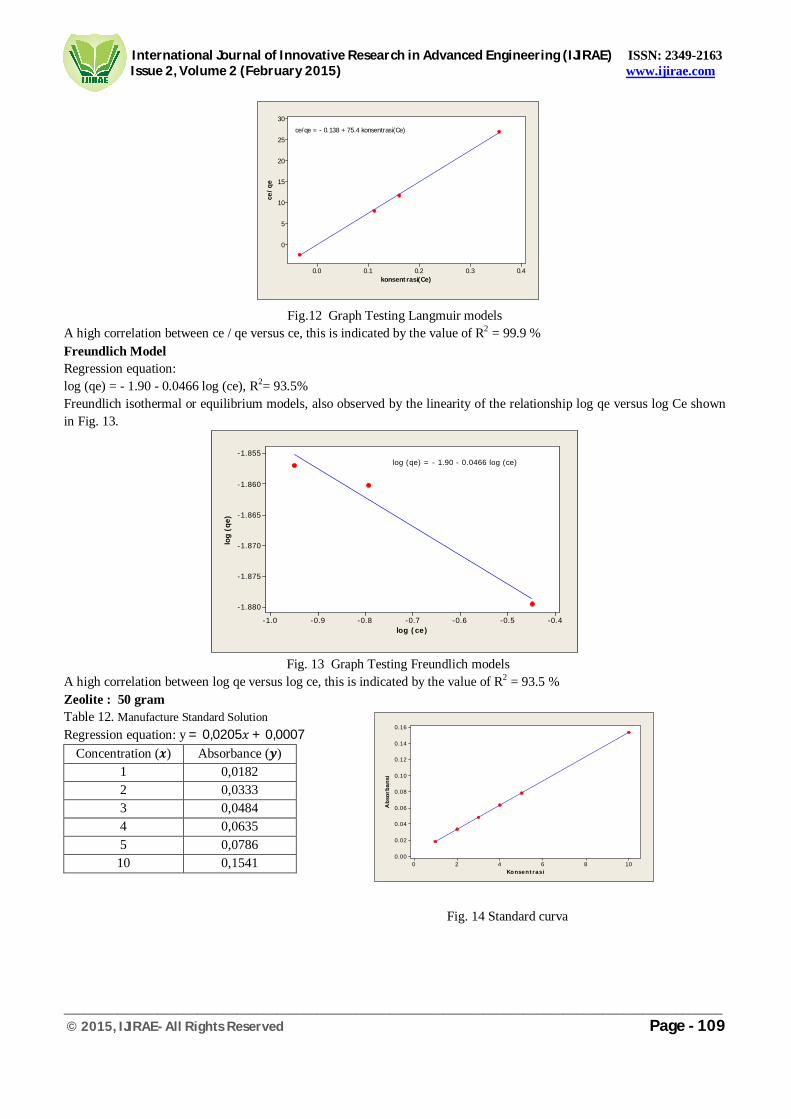
Fig.12 Graph Testing Langmuir models A high correlation between ce / qe versus ce, this is indicated by the value of R2 = 99.9 % Freundlich Model Regression equation: log (qe) = - 1.90 - 0.0466 log (ce), R2= 93.5% Freundlich isothermal or equilibrium models, also observed by the linearity of the relationship log qe versus log Ce shown in Fig. 13.
-0.4-0.5-0.6-0.7-0.8-0.9-1.0
-1.855
-1.860
-1.865
-1.870
-1.875
-1.880
log (ce)
log
(qe)
log (qe) = - 1.90 - 0.0466 log (ce)
Fig. 13 Graph Testing Freundlich models
A high correlation between log qe versus log ce, this is indicated by the value of R2 = 93.5 % Zeolite : 50 gram Table 12. Manufacture Standard Solution Regression equation: y= 0,0205푥 + 0,0007
Concentration (풙) Absorbance (풚) 1 0,0182 2 0,0333 3 0,0484 4 0,0635 5 0,0786 10 0,1541
Fig. 14 Standard curva
1086420
0.16
0.14
0.12
0.10
0.08
0.06
0.04
0.02
0.00
Konsentrasi
Abs
orba
nsi
0.40.30.20.10.0
30
25
20
15
10
5
0
konsentrasi(Ce)
ce/q
e
ce/qe = - 0.138 + 75.4 konsentrasi(Ce)

International Journal of Innovative Research in Advanced Engineering (IJIRAE) ISSN: 2349-2163 Issue 2, Volume 2 (February 2015) www.ijirae.com
___________________________________________________________________________________________________ © 2015, IJIRAE- All Rights Reserved Page - 110
Table 13. The relationship between concentration and absorbance
Activation (oC)
Actual Concentration
Absorbance Time(풅풕)
100 -0,1986 0,0001 180
200 -0,2119 -0,0001 180
300 -0,2119 -0,0001 180
400 0,2582 0,0071 180
Fig. 15 Graph the relationship between concentration and absorbance
Analysis of Data Equilibrium model (isothermal) absorption conducted to determine the effectiveness of a process of absorption of the
metal ions Pb and adsorbent (zeolite) or based on the linearity of the relationship Ce / qe vs. Ce
Table 14. Analisis of test data with the raw water SSA Tool to lead (Pb) metal Temperature
(0C) pH Absorbance concentration 푪풐 (ppm)
푪풆 (ppm) 푪풐– 푪풆
풒풆 (mg/gr)
100 5 0,0001 -0,1986 5 -0,1986 5,1986 0,0103 200 5 -0,0001 -0,2119 5 -0,2119 5,2119 0,0104 300 5 -0,0001 -0,2119 5 -0,2119 5,2119 0,0104 400 5 0,0071 0,2582 5 0,2582 4,7418 0,0094
Regression equation: Absorbance= 0.00314 + 0.0153 Concentration (Ce), R2= 100 %
Fig. 16 Regression test the relationship between concentration and absorbance
A high correlation between concentration and absorbance is indicated by the value of R2 = 100 % as shown in Fig. 16. Analysis of Testing
Table 15. Analysis testing Langmuir model 50 gram
absorbance concentration (Ce) qe log (ce) log (qe) ce/qe 0.0001 -0.1986 0.0103 #NUM! -1.98716 -19.2816 -0.0001 -0.2119 0.0104 #NUM! -1.98297 -20.375 -0.0001 -0.2119 0.0104 #NUM! -1.98297 -20.375 0.0071 0.2582 0.0094 -0.58804 -2.02687 27.46809
0.30 .20 .10 .0-0 .1-0 .2
0 .007
0.006
0.005
0.004
0.003
0.002
0.001
0.000
Kon s e nt ra s i
Abs
orb
ansi
0.30.20.10.0-0.1-0.2
0.008
0.007
0.006
0.005
0.004
0.003
0.002
0.001
0.000
konsentrasi(Ce)
abso
rban
si
absorbansi = 0.00314 + 0.0153 konsentrasi(Ce)

International Journal of Innovative Research in Advanced Engineering (IJIRAE) ISSN: 2349-2163 Issue 2, Volume 2 (February 2015) www.ijirae.com
___________________________________________________________________________________________________ © 2015, IJIRAE- All Rights Reserved Page - 111
Langmuir Model Regression equation: ce/qe = 1.14 + 102 concentration (Ce), R2= 100 %
0 .30 .20 .10.0-0.1-0 .2
30
20
10
0
-10
-20
kons e nt ra s i(Ce)
ce/q
e
ce/qe = 1.14 + 102 konse ntra si(C e )
Fig. 17 Graph Testing Langmuir models
A high correlation between ce / qe versus ce, this is indicated by the value of R2 = 100 %
V. CONCLUSIONS 1. Characteristic examination result of natural zeolite in South Sulawesi using XRD and SEM obtained as follows :
a. Using XRD instrument 1. Natural land zeolite (without activation)
Cristobatelite-beta high 9.8 % Alunite 95.2%
2. Natural sea zeolite Sodium alumos silicate 8.3 % Zeolite Nu, Silicon 91.7 % 3. Sea Zeolite (100 ˚C activation) 170 mesh particle size
Quarts, Syn 90 % Potassium Chloride 3.9 % Zeolite P, Na 5.7 %
4. Sea Zeolite (200 ˚C activation) 170 mesh particle size Quarts Low Hp, Syn 2.98 % Muscovite, 2M1 71.1 % Zeolite P, Na 25.9 %
5. Sea Zeolite (300 ˚C activation) 170 mesh particle size Quarts Low, Syn 66.1 % Muscovite, 2M1 20 % Zeolite F (Na) 13.9 %
6. Sea Zeolite (400 ˚C activation) 170 mesh particle size Quarts, Syn 45 % Albute, ordered 26 % Potassium tecto-aluminosilicate 9 % Zeolite Nu-silicondioxide 2.5 % Muscovite, 2M1 14 % Sodalite 3.1 %
b. Using SEM SEM result shows that surface pore of zeolite will be opened after 200 ˚C and C 100 ˚C heating while at 400 ˚C and 300 ˚C heating make the pore decline.
2. The absorbance of test results SSA tool (Atomic Absorption Spectrophotometer) for heavy metals lead (Pb) obtained ● Absorbance value of 0000 to a weight of 20 grams ● Absorbance value of 0.000 for the weight 35 grams ● Absorbance value of -0001 to the weight of 50 grams
3. Results of regression analyzes the relationship between the absorbance with concentration obtained: R2 = 100 % 4. Langmuir model test results obtained: R2 = 99.8 % 5. Freundlich model test results obtained: R2 = 98.1 % 6. South Sulawesi natural zeolite can reduce the acid on the water.

International Journal of Innovative Research in Advanced Engineering (IJIRAE) ISSN: 2349-2163 Issue 2, Volume 2 (February 2015) www.ijirae.com
___________________________________________________________________________________________________ © 2015, IJIRAE- All Rights Reserved Page - 112
ACKNOWLEDGMENT 1. This zeolite can be a cheap and easy material for water purification. 2. South Sulawesi natural zeolite can be the best solution to reduce pollutant or Pb ion in the environment. 3. This article can be used as the information for water treatment department.
REFERENCES
[1] Effendi, H., 2003, Study quality of water for management resource and marine environment, Kanisius. [2] Hamzah, Y.et al., 2010, Publication of Scientific and Research Plan, Doctoral Program in Civil Engineering Graduate
Program Hasanuddin University Vol. 1, page 1- 12. [3] Joko, T., 2010, Production Unit in Water Supply System, Yogyakarta, Graha Science. [4] Nusa, I. S., and Satmoko, Y., 2008, Issues and Strategies in Indonesian Water Supply, (http://www.kelair.bppt.go.id /
publications / books of drinking water.Html). [5] Rahman, A., and Hartono, B., 2004, Water Filtration With Natural Zeolite To Lower Levels of Iron and Manganese,
Makara Journal, Health, 1 (8) (http://www.journal.ui.ac.id/upload/artikel/01-filtration water-ARahman.pdf). [6] Report of Pre-Feasibility Study, 2001, Factory Development of Zeolite in North Toraja and Luwu Regency,
Department of Energy and Mineral Resources of South Sulawesi. [7] Selintung, M., dan Syahrir. S., 2012, Study of Water Management through Quartz Sand Filter (Case Study Tiroang
River), Department of Civil Engineering, University of Hasanuddin. [8] Sennang, S., 2010, Availability Issues and Challenges the Municipality Water of Ujung Pandang , HATHI Ujung
Pandang Branch, 1995. [9] Sinle, E.P., 2007, Zeolites As Multipurpose Minerals, http://www.chem-is-try.org/artikel - Chemistry/chemistry -
material/Zeolite - multy-fungtion- Decision Matter of Health of the Republic of Indonesia No 907/ Health Minister/SK/VII/2002 Terms of Safeguarding Drinking Water Quality.
[10] Srihapsari, D., 2006, Use of Natural Zeolite that has been activated with HCl solution to Absorb Metals Causes of Water Hardness, Chemical Thesis, State University of Semarang.
[11] Sujarwadi, 1997, Overview About Zeolite, Development Center of Mineral Technology in Bandung.