Embed Size (px)
Citation preview


iii
© Adamu Aminu Idris
2015

iv
Dedication
I dedicate this piece of work to Almighty Allah “SUBHAANAHU WA TA’ALAA”

v
Acknowledgement
I must begin by glorifying Almighty Allah the all-knowing, the omnipotent and the
merciful for everything. Everlasting peace and blessings of Allah be upon his most
beloved messenger prophet Muhammad (S.A.W).
It is my pleasure to thank the kingdom of Saudi Arabia and King Fahd University of
petroleum and minerals for this privilege of scholarship to study a master degree. My also
goes gratitude to the chemistry department and its entire community. Specifically, I
acknowledge the support, help and encouragement given to me by my advisor Dr. Abdul
Rahman Al-Betar throughout the thesis. I am grateful to my committee members, Dr.
Tawfik Saleh, Dr. Oki Muraza, Dr. Nisar Ullah and Dr. Abdel-Nseer Kawde for the
immense contribution to the achievement of the research objectives.
I also thank the chairman of the chemistry department. I appreciate the help of Mr.
Muhammad Arab, Mansur Al-Zaki for their assistant in NMR session I thank Mr.
Nadeem Baig and Mr. Azeem Akbar for their support. I appreciated the mutual and
rigorous discussion we had with Ismail Abdul Aziz which contribute immensely to the
success of the wok. I also extend my profound gratitude to CENT and its members
particularly, Dr. Abbas, Mr. Ibrar, Saheed Ganiyyu, Idrees bakare.
At end I wish to thank my family for their continuous and tireless support,
encouragement and prayers.

vi
Table of Content
ACKNOWLEDGEMENT ................................................................................................. V
TABLE OF CONTENT .................................................................................................... VI
LIST OF TABLE .............................................................................................................. IX
LIST OF FIGURES ........................................................................................................... X
LIST OF EQUATIONS ................................................................................................. XIV
LIST OF SCHEMES........................................................................................................ XV
LIST OF ABBREVIATION .......................................................................................... XVI
THESIS ABSTRACT (ENGLISH) ............................................................................. XVIII
THESIS ABSTRACT (ARABIC) ................................................................................. XIX
CHAPTER ONE ................................................................................................................. 1
GENERAL INTRODUCTION ........................................................................................... 1
1.1 ZEOLITES ....................................................................................................................... 1
1.2 APPLICATION OF ZEOLITES ............................................................................................. 4
1.2.1 Catalysis ..................................................................................................................... 4
1.2.2 Gas separation ............................................................................................................ 5
1.2.3 Ion Exchange ............................................................................................................. 5
1.3 SYNTHESIS OF ZEOLITES ................................................................................................. 5
1.4 VOLTAMMETRY ............................................................................................................. 6
1.4.1 Cyclic Voltammetry ................................................................................................... 6
1.4.2 Square Wave Voltammetry ........................................................................................ 9
1.5 LITERATURE REVIEW .................................................................................................... 10
CHAPTER TWO .............................................................................................................. 25
SYNTHESIS ZONE OF OSDA-FREE AND SEED-FREE MORDENITE .................... 25
ABSTRACT ......................................................................................................................... 25
2.1 BACKGROUND .............................................................................................................. 26
2.2 EXPERIMENTAL ............................................................................................................ 28
2.2.1 Materials .................................................................................................................. 28
2.2.2 Procedure ................................................................................................................. 28
2.2.3 Characterization ....................................................................................................... 29
2.3 RESULT AND DISCUSSION ............................................................................................. 30
2.3.1 Effect of alkalinity ratio Na/Si ratio ......................................................................... 30
2.3.2 Effect of Silica source .............................................................................................. 36
2.3.3 Effect of Si/Al molar ratio ....................................................................................... 38
2.3.4 Effect of Crystallization temperature ....................................................................... 41
2.3.5 Effect of aging time ................................................................................................. 42

vii
2.4 CONCLUSION ................................................................................................................ 44
CHAPTER THREE .......................................................................................................... 45
SYNTHESIS, CHARACTERIZATION AND APPLICATION OF PHOSPHATE-
MODIFIED MORDENITE ZEOLITE: ENHANCED CYCLIC VOLTAMMETRIC
RESPONSE IN FERRO/FERRIC CYANIDE SYSTEM AND ELECTROCATALYTIC
DETECTION OF THIOCYANATE ................................................................................ 45
ABSTRACT ......................................................................................................................... 45
3.1 BACKGROUND .............................................................................................................. 46
3.2 EXPERIMENTAL ............................................................................................................ 51
3.2.1 Materials .................................................................................................................. 51
3.2.2 Synthesis and phosphorus modification of mordenite zeolite ................................. 51
3.2.3 Characterization of the phosphate mordenite .......................................................... 52
3.3 ELECTROCHEMICAL CHARACTERIZATION ..................................................................... 52
3.3.1 Preparation of zeolite modified electrode ................................................................ 52
3.3.2 Voltammetric measurement using cyclic voltammetry ........................................... 53
3.4. RESULTS AND DISCUSSION .......................................................................................... 54
3.4.1 Characterization of mordenite zeolite and phosphate mordenite zeolite ................. 54
3.5 ELECTROCHEMICAL EVALUATION ................................................................................ 57
3.5.1 Effect of percentage of mordenite in carbon paste electrode ................................... 57
3.5.2 Effect of scan rate .................................................................................................... 60
3.5.3 Oxidation of thiocyanate .......................................................................................... 64
3.5.4 Effect of pH.............................................................................................................. 66
3.5.5 Calibration plots ....................................................................................................... 68
3.6 CONCLUSIONS .............................................................................................................. 69
CHAPTER FOUR ............................................................................................................. 70
ABSTRACT ......................................................................................................................... 70
4.1 BACKGROUND .............................................................................................................. 71
4.2 EXPERIMENTAL ............................................................................................................ 73
4.2.1 Materials .................................................................................................................. 73
4.2.2 Synthesis of mordenite zeolite ................................................................................. 74
4.2.3 Phosphate modification ............................................................................................ 75
4.2.4 Characterization ....................................................................................................... 75
4.3 ELECTROCHEMICAL CHARACTERIZATION ..................................................................... 76
4.3.1 Preparation of phosphate mordenite carbon paste electrode .................................... 76
4.3.2 Voltammetric measurement ..................................................................................... 77
4.4 RESULTS AND DISCUSSION ........................................................................................... 78
4.4.1 Crystallinity mordenite zeolite and phosphate mordenite zeolite ............................ 78
4.4.2 Morphology.............................................................................................................. 83
4.4.3 Effect of phosphorus impregnation .......................................................................... 86
4.4.4 FT-iR studies ............................................................................................................ 96
4.5 ELECTROCHEMICAL EVALUATION .............................................................................. 100

viii
4.5.1 Optimization of P-loading and the bulk Si/Al ratio for NO2- detection ................. 100
4.5.2 Influence of the proportion of phosphate mordenite in the carbon paste .............. 105
4.5.3 Comparison with bare carbon paste using CV ....................................................... 109
4.5.4 Effect of scan rate .................................................................................................. 111
4.5.5 Effect of buffer as electrolyte solution ................................................................... 114
4.5.6 pH dependence of the electrocatalytic oxidation of nitrite .................................... 117
4.5.7 Calibration for nitrite oxidation ............................................................................. 118
4.6 CONCLUSION .............................................................................................................. 120
CHAPTER FIVE ............................................................................................................ 121
5.1 CONCLUSIONS ............................................................................................................ 121
5.2 RECOMMENDATIONS .................................................................................................. 121
REFERENCES ............................................................................................................... 123
VITAE............................................................................................................................. 142

ix
List of Table
Table 1. 1 Gel parameters for Mordenite Synthesis using different OSDA ..................... 12
Table 1. 2 Mordenite Gel parameters from different Template-free processes ................ 13
Table 1. 3 Optimum P-loading for different zeolites from literature ................................ 17
Table 1. 4 Different phosphorus zeolites applied in production of olefins Values in
bracket represent selectivity to propylene. ....................................................... 18
Table 1. 5 Review of different zeolite modified electrodes in electroanalytical
applications ....................................................................................................... 23
Table 3. 1 Review of some zeolite modified electrodes ................................................... 49
Table. 4. 1 Synthesis plan for different phosphorous-modified mordenite ...................... 76
Table. 4. 2 EDX results on the effect of P-loading on the framework Si/Al of MOR ...... 86
Table. 4. 3 Amount of phosphorous incorporated results obtained from XRF................. 87
Table. 4. 4 Electrodes composition ................................................................................. 106

x
List of Figures
Fig. 1. 1 Chemical structure of zeolite[8] ......................................................................... 2
Fig. 1. 2 3D structure of MOR type zeolite[9] ................................................................. 3
Fig. 1. 3 Peak current against scan rate[22] ...................................................................... 7
Fig. 1. 4 Potential waveforms for cyclic voltammetry and the resulting
voltammograms[22] ........................................................................................... 8
Fig. 2. 1 XRD patterns of mordenite zeolites synthesized with different
Na/Si ratios at fixed Si/Al of 20 at 180 oC for 48 h using silica
gel and sodium aluminate ................................................................................. 31
Fig. 2. 2 SEM of MOR samples at Si/Al ratio 20 synthesized at 180 oC in
48 h from gel with Na/Si of; (a) 0.52 (b) 0.54 .................................................. 32
Fig. 2. 3 XRD patterns of mordenite zeolites synthesized with different
Na/Si ratios at fixed Si/Al of 25 at 180 oC for 48 h using silica
gel and sodium aluminate ................................................................................. 33
Fig. 2. 4 XRD patterns of mordenite zeolites with different Na/Si ratios
at fixed Si/Al of 50 synthesized at 180 o
C for 48 h. using silica
gel and sodium aluminate ................................................................................. 34
Fig. 2. 5 XRD patterns of pure MOR with different Si/Al obtained at
different -OH/Si ratios synthesized at 180 oC in 48 h using
silica gel and sodium aluminate ....................................................................... 35
Fig. 2. 6 XRD patterns of MOR samples at Si/Al ratio 15 synthesized
at 180 oC for 48 h using different Silica source ................................................ 37
Fig. 2. 7 SEM of MOR samples with 15 Si/Al molar ratio and 0.52
Na/Si molar ratio synthesized at 180 oC for 48 h using different
Silica source (a) Silica gel (b) Fumed silica (c) Colloidal silica ...................... 38
Fig. 2. 8 XRD patterns of mordenite zeolites with different Si/Al ratios
at fixed Na/Si of 0.52 synthesized at 180 oC for 48 h ...................................... 40
Fig. 2. 9 FE-SEM micrographs of mordenite zeolites with different Si/Al
ratios at fixed Na/Si of 0.52 synthesized at 180 oC for 48 h
(a) 15, (b) 20, (c) 25 and (d) 30 ........................................................................ 40
Fig. 2. 10 XRD patterns of Mordenite using colloidal silica synthesized
at 180 oC for 48 h at different temperatures using colloidal silica ................... 41
Fig. 2. 11 FE-SEM micrographs of MOR zeolites of 15 Si/Al molar ratio
and 0.52Na/Si molar ratio synthesized at different temperatures
(a) 160 oC, (b) 170
oC ....................................................................................... 42
Fig. 2. 12 XRD of MOR synthesized using colloidal silica at different aging
time in 48 h ....................................................................................................... 43

xi
Fig. 2. 13 FE-SEM micrographs of MOR zeolites of 15Si/Al molar ratio
and 0.52Na/Si molar ratio prepared at different aging time
(a)1h (b) 12 h and (c) 24 h ................................................................................ 43
Fig. 3. 1 XRD patterns of mordenite zeolites (a) Parent HMOR and
(b) 5P-MOR with 0.52 Na/Si molar ratio and 20 Si/Al molar ratio
synthesized at 180 oC for 48 h using silica gel ................................................. 55
Fig. 3. 2 FE-SEM micrographs of Mordenite zeolites of 20 Si/Al
molar ratio and 0.52 Na/Si molar ratio crystallize at 180 oC
(a) H-MOR, (b) 5P-MOR ................................................................................. 55
Fig. 3. 3 Aluminium 27Al NMR of (a) H-MOR, (b) 27
Al NMR of 5P-MOR ................ 56
Fig. 3. 4 Phosphorus 31
P NMR of 5P-MOR with 0.52 Na/Si molar ratio
and 20 Si/Al molar ratio ................................................................................... 57
Fig. 3. 5 (A) Comparison of CVs (B) Plot of peak current vs % modifier
of carbon paste electrode containing (a) 5%5P-MOR (5-5P-MCPE),
(b) 0% 5P-MOR (0-5P-MCPE) (c) 20% 5P-MOR (20-5P-MCPE),
(d) 15% 5P-MOR (15-5P-MCPE) (e) 10% 5P-MOR (10-5P-MCPE)
in 10 mM K4Fe(CN)6 ...................................................................................... 59
Fig. 3. 6 (A) CV of 5-5P-MCPE at different scan rates a. 5 mV b. 10 mV
c. 20 mV d. 50 mV e. 100mV f. 200mV g. 300 mV
and h. 400 mVs-1 in 10 mM K4Fe(CN)6 and 0.1 M KCl
(B)Plot of peak current vs scan rate ................................................................. 62
Fig. 3. 7 Plot of Peak current vs scan rate in the presence of 10 mM
K4Fe(CN)6 in 0.1 M KCl on (A) 5-5P-MCPE and
(B) bare carbon paste electrode ........................................................................ 63
Fig. 3. 8 (A) Comparison of SWV of (a) 5-5P-MCPE and (b) Bare CPE.
(B) SWV of 5-5P-MCPE in pH 7 buffer (a) in the presence of
50 μM SCN- (b) in the absence of SCN
- .......................................................... 65
Fig. 3. 9 SWV of 5-5P-MCPE in 50 μM SCN- in phosphate buffer of
different pH. Inset is the relationship of peak current ad pH. .......................... 67
Fig. 3. 10 Calibration, dependence of the peak current on concentration
of SCN- (10 μM to 150 μM) Graph. Inset is the relationship
of peak current with concentration. .................................................................. 68
Fig. 4. 1 XRD powdered pattern of mordenite prepared from gel of
different Si/Al ratios synthesized at 180 oC for 48 h using
silica gel ............................................................................................................ 79
Fig. 4. 2 XRD powdered pattern of mordenite sample Si/Al 15 synthesized
at 180 oC for 48 h using silica gel impregnated with 0.5, 0.75 and
1.0 wt.% Phosphorous. ..................................................................................... 80

xii
Fig. 4. 3 XRD powdered pattern of mordenite sample Si/Al 20
synthesized at 180 oC for 48 h using silica gel impregnated
with 0.5, 0.75 and 1.0 wt.% Phosphorous. ....................................................... 81
Fig. 4. 4 XRD powdered pattern of mordenite sample Si/Al 25 synthesized
at 180 oC for 48 h using silica gel impregnated with 0.5, 0.75
and 1.0 wt. % Phosphorous. ............................................................................. 82
Fig. 4. 5 FE-SEM of MOR samples 15 Si/Al molar ratio and 0.52 Na/Si
molar ratio crystallized at 180 oC in 4 h impregnated with different
P-loading on 0.5g MOR (a) H-MOR (b) 0.5P-MOR (c) 0.75P-MOR
(d) 1.0P-MOR ................................................................................................... 83
Fig. 4. 6 FE-SEM of MOR 20 Si/Al molar ratio and 0.52 Na/Si molar ratio
crystallized at 180 oC in 4 h impregnated with different P-loading
(a) H-MOR (b) 0.5P-MOR (c) 0.75P-MOR (d) 1.0P-MOR ............................ 84
Fig. 4. 7 FE-SEM of MOR samples 20 Si/Al molar ratio and 0.52 Na/Si
molar ratio crystallized at 180 oC in 4 h impregnated with different
P-loading (a) H-MOR (b) 0.5P-MOR (c) 0.75P-MOR (d) 1.0P-MOR ............ 85
Fig. 4. 8 EDX spectrum of MOR of 15 Si/Al molar ratio impregnated
with different p-loading (a) 0.5P-MOR-15, (b) 0.75P-MOR-15
and (c) 1.0P-MOR-15 ....................................................................................... 88
Fig. 4. 9 EDX spectrum of MOR of 15 Si/Al molar ratio impregnated
with different p-loading (a) 0.5P-MOR-15, (b) 0.75P-MOR-15
and (c) 1.0P-MOR-15 ....................................................................................... 89
Fig. 4. 10 EDX spectrum of MOR of 15 Si/Al molar ratio impregnated with
different p- loading (a) 0.5P-MOR-15, (b) 0.75P-MOR-15 and
(c) 1.0P-MOR-15 .............................................................................................. 90
Fig. 4. 11 27
Al NMR P-MOR-15 of 15 Si/Al molar ratio impregnated with
different P-loadings .......................................................................................... 92
Fig. 4. 12 27
Al NMR P-MOR-15 of 15 Si/Al molar ratio impregnated with
different P-loadings .......................................................................................... 93
Fig. 4. 13 27
Al NMR P-MOR-15 of 15 Si/Al molar ratio impregnated with
different P-loadings .......................................................................................... 94
Fig. 4. 14 31
P NMR P-MOR-15 of 15 Si/Al molar ratios impregnated with
different P- loadings ......................................................................................... 95
Fig. 4. 15 FT-iR Spectra of P-MOR Si/Al = 15, Na/Si = 0.52 synthesized at
180 oC for 48 h (a) parent (b) 0.5P-MOR (c) 0.75P-MOR and
(d) 1.0P-MOR ................................................................................................... 97
Fig. 4. 16 FT-iR Spectra of P-MOR Si/Al = 20, Na/Si = 0.52 synthesized
at 180 oC for 48 h (a) parent (b) 0.5P-MOR (c) 0.75P-MOR and
(d) 1.0P-MOR ................................................................................................... 98

xiii
Fig. 4. 17 FT-iR Spectra of P-MOR Si/Al = 25, Na/Si = 0.56 synthesized
at 180 oC for 48 h (a) parent (b) 0.5P-MOR (c) 0.75PMOR and
(d) 1.0P-MOR ................................................................................................... 99
Fig. 4. 18 Chart showing the relation between peak current and phosphorous
loading data obtained from CVs of carbon paste electrodes prepared
from P-MOR-15 containing different P-loading, at a potential
window of 0 mV to 1.8 mV and scan rate of 100 mV s-1
............................... 102
Fig. 4. 19 Chart showing the relation between peak current and phosphorous
loading, data obtained from CVs of carbon paste electrodes
prepared from P-MOR-20 containing different P-loading,
at a potential window of 0 mV to 1.8 mV and scan rate of 100 mV s-1
......... 103
Fig. 4. 20 Chart showing the relation between peak current and phosphorous
loading data obtained from CVs of carbon paste electrodes prepared
from P-MOR-25 containing different P-loading, at a potential
window of 0 mV to 1.8 mV and scan rate of 100 mV s-1
............................... 104
Fig. 4. 21 Comparison of SWVs of carbon paste electrodes prepared
from P-MOR-25 containing different P-loading, in the presence
of 10 mM NO2- in 0.1 M KCl ......................................................................... 105
Fig. 4. 22 Comparison of SWVs of different carbon paste electrodes,
in presence of 5 mM NO2- in phosphate buffer at pH 7.
Inset is the relationship of peak current vs % 0.75-P-MOR ........................... 107
Fig. 4. 23 Comparison of blanks SWVs of different carbon paste electrodes
(P, Q, R, S and T) ........................................................................................... 108
Fig. 4. 24 CV of 15-0.75P-MCPE in the presence of 5 mM NO2-
in 0.1 M phosphate buffer pH 7 at 100 mV s-1
scan rate ................................ 110
Fig. 4. 25 CVs of the variation of peak current with scan rate potential
at the electrode S in 5 mM NO2- solution in 0.1 M phosphate
buffer pH 7. Inset is the plot of peak current vs square root of scan rate ....... 112
Fig. 4. 26 Plot of peak current vs scan rate ..................................................................... 113
Fig. 4. 27 SWV of electrode S in the presence of 5 mM NO2- in different
buffer solutions (a) 0.1 M Phosphate buffer pH7
(b) 0.1 M Acetate buffer (e) 0.1 M sulphate buffer pH 7 ............................... 115
Fig. 4. 28 Dependence of peak current on buffer solution for nitrite
detection (data collected from SWV of 5 Mm NO2- in 0.1 M
solution of each of the buffers) ....................................................................... 116
Fig. 4. 29 CV of electrode S in the presence of 5 mM NO2- in phosphate buffer
at different pH (a) 7, (b) 8, (c) 6, (d) 5, (e) 4 and (f) 3. ................................. 117
Fig. 4. 30 SWV showing dependence of the peak current on
NO2- ion concentration. Inset is the relationship of peak current with
concentration .................................................................................................. 119

xiv
List of equations
Eqn. 1. 1 ΔΕ = 𝑬𝒑𝒂 − 𝑬𝑷 𝒄 = 𝟓𝟗𝒏 mV .................................................................. 6
Eqn. 1. 2 𝑰𝒑𝒂𝑰𝒑𝒄 = 𝟏 .................................................................................................. 6
Eqn. 1. 3 O -+ e → R ..................................................................................................... 9
Eqn. 1. 4 ∆𝒊𝒑 = 𝒏𝑭𝑨𝑫𝒐𝟏𝟐𝑪𝒐 ∗ 𝝅𝟏𝟐𝒕𝒑𝟏𝟐∆𝜳𝒑 ....................................................... 9
Eqn. 3.1 ip = 2.69 x 10⁵ n
3/2 v
1/2D
1/2 AC ................................................................. 60
Eqn. 3. 2 Ip =𝒏𝟐 𝑭𝟐 𝑨𝜞 ∗ 𝒗𝟒𝑹𝑻 .............................................................................. 61
Eqn. 3. 3 Γ = 𝑸𝒏𝑭𝑨 ................................................................................................. 61
Eqn. 4. 1 NO2- → NO2 + e
- ..................................................................................... 109
Eqn. 4. 2 𝑰𝒑 = 𝒏𝟐𝑭𝟐𝑨 Г ∗ 𝒗𝟒𝑹𝑻 ......................................................................... 111
Eqn. 4. 3 Ip (µA) = 0.0142[NO2-] + 0.0313 ......................................................... 118

xv
List of Schemes
Scheme 1. 1 Proposed model of phosphoric acid interaction with zeolite Y
Pannervelsam et al
[51]..………………………………………………………………………14
Scheme 1. 2 Proposed interaction models of phosphate with ZSM-5 framework
(a) Kaeding et al [54] and Vedrine et al. [55] (b) Lercher et
al [56] (c) and (d) Corma et al [57]; (e) Zaiku et al [52] ............................ 15
Scheme 4. 1 Adopted mechanism for phosphate zeolite interaction [50] ..................... 101
Scheme 4. 2 Mechanism of Nitrite Oxidation .............................................................. 109

xvi
List of Abbreviation
Ag/AgCl : Silver, silver chloride
CV : Cyclic voltammetry
DME : Dimethyl ether
EDX : Energy Dispersion X-ray Spectrophotometer
FE-SEM : Field Emission Scanning Microscope
FT-iR : Fourier Transform Infrared
HMDA : Hexamethylenediamine
HMI : Hexamethyleneimine
H-MOR : Proton mordenite
KCl : Potassium chloride
LDH : Layered Double Hydroxide
MOR : Mordenite
Na/Si : Sodium to Silicon ratio
NMR : Nuclear Magnetic Resonance
NO2-
: Nitrite ion
OFAl : Octahedral Framework Aluminium
OPDA : o-phenylenediamine
OSDA : Organic Structure Directing Agent
P/Al : Phosphorous to Aluminium ratio
P-MCPE : Phosphate Mordenite Carbon Paste Electrode
P-MOR : Phosphate Mordenite
P-ZSM-5 : Phosphate ZSM-5
SCN- : Thiocyanate
Si/Al : Silica to Alumina ratio
SWV : Square wave voltammetry
TEABr : Tetraethyl Ammonium Bromide

xvii
TEAOH : Tetraethyl Ammonium Hydroxide
XRD : X-ray diffraction
ZCPE : Zeolite Carbon Paste Electrode
ZME : Zeolite Modified Electrode

xviii
Thesis Abstract (English)
Name: Adamu Aminu Idris
Thesis Title: Electrochemical Behavior and Application of Phosphorous
Modified Zeolite Carbon Paste Electrode
Major Field: Chemistry
Date: May, 2015
We report the synthesis and phosphate modification of pure mordenite crystal
with Si/Al molar ratios 15, 20 and 25 in the absence of organic structure directing agent
and without seed addition. Both parent and modified zeolite were characterized using
XRD, SEM, FT-iR, NMR, and XRF. The phosphate mordenite was used as a modifier in
carbon paste electrode and its electrochemical behavior was investigated in the cyclic
voltammetry of potassium ferrocyanide (K4Fe(CN)6). The composite electrode containing
5% phosphate mordenite (Si/Al = 20), showed good linearity within thiocyanate
concentration range of 10 µM to 150 µM (R2 = 0.997) in phosphate buffer (pH 8). While
the composite electrode containing 15 % phosphate mordenite (Si/Al = 25), showed
strong linearity between nitrite concentration range of 10 µM to 250 µM (R2 = 1) in
phosphate buffer (pH 7). Both composite electrodes showed excellent reproducibility
with RSD values of 2.3 % and 3.3 % in the detection of thiocyanate and nitrite
respectively. Hence, the composite electrodes showed a promising application for real
sample analysis.
Master of Science Degree
King Fahd University of Petroleum and Minerals
Dhahran, Saudi Arabia

xix
Thesis Abstract (Arabic)
الرسالة خالصة
أدم إدريس االســـــــــــــــم
التصرف االلكتروكيميائي و التطبيقات للقطب الكهربائي المكون من عنوان الرسالة الموردنايت معدل بالفوسفورس وعجينة الكربون زيواليت
كيمياء التخصــــــــص
2015مايو التاريـــــــــــخ
لقد قومنا بتصنيع بلورات المردينايت من الزيوليت الصافي و إدخال الفوسفورس عليه في غياب المعامل
. 25، 20، 15العضوي الموجه وبدون إضافة اية بذور. وقد كانت نسب السيليكون الى االلمونيوم هي:
لمعدل الموردينايت ا . XRD, SEM, FT-iR, NMRوتمت التشخيصات بواسطة كال من االجهزة
بالفوسفورس استخدم في تحسين اداء عجينة الكربون. وقد تم اختبار هذا القطب من الخليط بواسطة
. القطب (K4Fe(CN)6)( مع البوتاسيوم فيروسينايت cyclic voltammetryالفولتميتري الدائري )
، 20ومونيوم = % من الفوسفورس ونسبة السيليكون الى االل5الكهربائي المكون من الخليط يحتوي على
( في محلول SCN( من الثيوسينايت )µM - 150 µM 10اظهر تجاوب خطي جيدا لتراكيز منخفضة )
. (pH 8)الفوسفيت ثابت الحامضية
% فوسفيت موردنايت تجاوبا لقياس اكسدة النيتريت في 15بينما أظهر القطب الكهربائي الذي يحتوي على
. كلى القطبين اظهرا (pH 7)ل الفوسفيت ثابت الحامضية ( في محلوµM - 250 µM 10التراكيز )
% في قياس كال من الثيوسينايت 3.3% و 2.3تجاوبا ممتازا عند اعادة القياس لعدة مرات بثابت انحراف
والنيتريت. وبهذا أصبح القطب الكهربائي المعدل ذو تطبيقات واعدة في تحليل عينات الحقيقية.
ومدرجة الماجستير في العل
جامعة الملك فهد للبترول والمعادن
المملكة العربية السعودي -لظهرانا

1
Chapter One
General Introduction
1.1 Zeolites
Zeolites are a well-established materials used in a range of processes in different
industries. The occurrence of zeolites in nature as aluminosilicates can be dated back to
250 years ago [1]. The name “zeolite” which has the Greek interpretation (zein, ‘‘to
boil’’; lithos, ‘‘a stone’’) was given to them by the Swedish mineralogist Axel Friedrich
Cronstedt in 1756 after he discovered that upon rapid heating they produced huge amount
of steam from adsorbed water [2]. The implicit properties of zeolites were believed to be
a consequence of this phenomenon. They occur as natural aluminosilicates with
characteristic microporous crystal structure [3]. To name but few include faujasite,
mordenite, offretite, ferrierite erionite and chabazite. Zeolite structures play important
role as catalysts with limited applications attached to the naturally occurring ones. The
exploitation the porous materials in catalysis began during 1945 to 1955, after the advent
of their synthetic form by the work of Barrer and Milton [1]. The replacement of
amorphous aluminosilicates as cracking catalyst outbreaks the application of zeolites in
the 1960s [4].
Structurally, zeolites contain tetrahedral silicon and aluminum atoms, linked
together through oxygen atom forming a framework of tetrahedral TO4 (T = Si or Al).
Therefore, zeolites, comprise SiO2 and AlO2 units that are chemically combined together
[5]. The unbalance negative charges in zeolites resulting from the substitution of silion
with aluminium is usually compensated by extra-framework cations normally alkali or
alkaline earth metals [3]. The characteristic windows and cages of zeolites rings were the

2
consequence of the tetrahedral linkages [6]. The number of rings is a factor of the
tetrahedral atoms which grouped to form pores of sizes ranging from 8-, 10- and 12-
membered rings [7].
Fig. 1. 1 Chemical structure of zeolite[8]

3
Fig. 1. 2 3D structure of MOR type zeolite [9]
The catalytic activity and stability of zeolites are requisite to the distribution of
aluminium atom in the framework [10]. This is because the acidity of zeolites is a
functional property of the location of aluminium. The distribution of bronsted acid sites
in zeolites, their categorization and their accessibility have been shown to essentially
depend on the number of aluminium atoms [5]. Hydrothermal treatment in hot water lead
to the partial loss of crystallinity due to the hydrolysis of Si-O-Al bonds and the
subsequent removal of octerhedrally coordinated Al-framework. Thus, forming
amorphous extra-Al cationic specie at the surface of the zeolites [11].

4
1.2 Application of zeolites
Zeolites are important group of heterogeneous catalyst existing mainly as
crystalline solids. The molecular sieves [12] allow their easy separation from reaction
fluids making them more applicable in industry than liquid catalyst [13]. Adaptability to
either batch or flow reactors, ease of recovery and low cost, are reason for their excessive
demand in heterogeneous catalysis [12].
Possession of micropores with active acidic sites and large surface area have
made zeolites suitable for application in gas separation, adsorption, ion-exchange and
catalytic reactions [14]. Due to their thermal and chemical stability, zeolites have shown
a remarkable stability and functionalities in the so-called zeolite imidazole framework
ZIF [15]. The presence of cages and windows of different sizes in zeolites allow them to
host different functional material that can manifest an unusual property [6].
Consequently, chemical and physical treatment to modify zeolite structure, porosity,
acidity, reactivity and selectivity emerged as advanced technology in zeolites [16, 17].
This has broaden the applications of zeolite from not only being a catalyst but also for
chemical and gas sensing applications [18]. Some major applications of the material
include the following:
1.2.1 Catalysis
Zeolite acidity with different pore dimension is key feature responsible for their
catalytic property. The intracrystalline holes of zeolites contain exchangeable cations that
can be exchange with cations of specific catalytic activity such as proton, phosphates
organosilanes. The possession of bronsted acid sites and Lewis acid sites has also make
them good acid catalyst in many variety of industrial processes

5
1.2.2 Gas separation
This is due to the ability of zeolite to partially and discriminatingly adsorb one
molecule from a mixture of gases. The property can be attributed to the sieving property
provided by the pore sizes of the material, which allow only molecule of specific size to
pass through. Thus, offering a molecular sieving property. The property gave zeolites
ability to be used as desiccants and drying agents
1.2.3 Ion Exchange
The cations that compensate the framework negative charge are loosely bound.
Hence when zeolites are introduced to an aqueous solution containing other cations, an
equilibrium condition is established at which the cations in the framework are exchange
with those in the solution. This property allow for the incorporation of different metals
with catalytic property both in electrochemical process and cracking reactions
1.3 Synthesis of zeolites
Hydrothermal crystallization of reactive alkali metal aluminosilicates gels at high
pH and typically above 100 oC and ambient pressure was the original method for the
chemical preparation of zeolites. Alkali cations direct the formation of structured
crystalline material, although materials with low to intermediate silica to alumina ratio
are formed. The pioneering work of Barrer opens the door to the use of Organic Structure
Directing Agent (OSDA) commonly known as template to obtain high silica zeolites. The
cost of its procurement and environmental pollution render the OSDA process
unfavorable [3]. Several organic compounds since then have been in use for zeolites
synthesis adding a necessary post synthesis calcination process to remove the organic-
template. The OSDA-free hydrothermal synthesis of zeolite remains a green route to

6
zeolite. Recently, a group of researchers are working on solvent-free and OSDA-free
synthesis of zeolites [19, 20]. Although, pure zeolites were possible through this process,
the size of the zeolite is uncontrollable. Therefore the addition of solvent during the gel
preparation is important.
1.4 Voltammetry
1.4.1 Cyclic Voltammetry
Although it was only proposed in the 1950s, cyclic voltammetry has today
become a powerful tool for rationalizing the chemical reactivity of species. The three-
electrode system has the dynamic nature that allows the use of different working
electrode. When the working electrode is dipped in a solution containing electrolyte
compound, the movement of charged species and products is suppressed. Consequently,
the electrode process is limited to diffusion [21].
The defined characteristics of cyclic voltammetry for a reversible electrochemical
reactions as reported in [22] are; (i) current peaks interval , (ii) scan rate is independent of
peak position, (iii) forward peak current is proportional to reverse (iv) scan rate is
proportional to the square of peak currents. These are demonstrated in Equation 1.1 and
Equation 1.2 and the waveforms are shown in Fig. 1.3 and 1.4
ΔΕ = 𝑬𝒑𝒂 − 𝑬𝑷
𝒄 = 𝟓𝟗
𝒏 mV Eqn. 1. 1
𝑰𝒑𝒂
𝑰𝒑𝒄 = 𝟏 Eqn. 1. 2
In voltammetric studies, zeolites are used in the fabrication of composite
electrodes, which facilitate mass transport of analyte and affect the electrode total surface
coverage. Thus, the current limitation will be determined by the added zeolites [23]. In

7
electrochemical studies current is produce as a measure of rate, which depend on the
mass transport of analyte species govern by either convection as in stirred cells, migration
as in charged electrode or diffusion where a concentration gradient led to the formation of
a diffused layer across which analyte move [24].
Fig. 1. 3 Peak current against scan rate [22]

8
Fig. 1. 4 Potential waveforms for cyclic voltammetry and the resulting voltammograms
[22]

9
1.4.2 Square Wave Voltammetry
In 1957 Baker reported Square wave voltammetry. However, the technique has
not become feasibly practicable until the recent advancement achieved in electronics
[25]. Square wave differs from differential pulse technique in the sense that it can be run
at much higher scan rate of up to 1 V. Thus, a run, which will take 3 min in differential
pulse, can be done in 3 seconds using square wave. Practically, it involves induction
period; the working electrode is held at an initial potential, then shifting it to a forward
and reverse potential and finally relaxation period. For instance, in a reaction involving
reduction of specie O, the working electrode is held at an initial potential higher than that
for reduction potential O, in the forward pulse while more positive potential should be
applied in the reverse step. The peak height is calculated using Equation 1.4.2.2
O -+ e → R Eqn. 1. 3
∆𝒊𝒑 =𝒏𝑭𝑨𝑫𝒐
𝟏𝟐⁄
𝑪𝒐∗
𝝅𝟏
𝟐⁄ 𝒕𝒑
𝟏𝟐⁄
∆𝜳𝒑 Eqn. 1. 4
Where n = number of electrons,
F = Faraday constant (96500 C/mol)
A = Electrode Area in cm2
DO = Diffusion coefficient for O (cm2/s)
CO = Specie O concentration (mol/cm3)
tp = time of pulse and Δψp = Unit less.

10
1.5 Literature review
The crystallinity and crystal size of zeolites particularly mordenite type zeolite
have been proofed to depend not only on gel composition but also on the gel preparation
mode, crystallization time and temperature [26]. Hincapie and co-workers claimed to
obtained small and highly crystalline mordenite in a shorter crystallization time and at
lower temperature with 389 m-2
g-1
BET (Brunauer Emmett And Teller) surface area by
dissolving the silica source rather than dispersing it to mixed with the alumina source
[26].
The addition of template Organic Structure Directing Agent (OSDA) to the gel in
mordenite synthesis had successfully led to nanocrystalline material at relatively lower
temperatures [27-31]. The BET area of mordenite was also improved by Dual templating
system [32]. However, inclusion of organic template in hydrothermal process requires a
longer synthesis time and a necessary post synthesis calcination step to remove template
matrix, which also course environmental pollution.
Mordenite of high BET area at shorter crystallization time has been achieved from
direct synthesis of mordenite without organic template [33]. Mordenite framework
possessing high Si/Al was successfully synthesized in template-free process [34]. The
presence of alkali metal cations in the gel assist crystal growth and the formation of the
specific structure in direct synthesis [35]. Very recently, Wu Q et al [19] reported the
catalytic activity of Beta and ZSM-5 zeolites obtained from solvent-free and template-
free synthesis. They found that there are great similarities in the catalytic properties with
the conventional ones. It has also been shown elsewhere that zeolite product yield
dramatically increased in a solvent-free process, which is true of the fact that some

11
silicate and alumina are not transported during the crystal growth in the solvent synthesis
[20]. Table 1.1 and 1.2 summarize some synthesis parameters and physico-chemical
properties of mordenite zeolites obtained from OSDA and OSDA-free processes,
respectively. Mordenite large crystal was obtained in row 7 of Table 1.1 although the gel
silica to alumina ratio was low (6.2), uniform crystal with accessible micropore volume
of 0.17 cm3/g was obtained, which has great interest for application in functional devices.
In the last row of Table 1.2 Wang J et al achieved high silica mordenite in template-free
and fluoride free process with lower crystallization time of less than one day at 160 oC
[34].

12
Table 1. 1 Gel parameters for Mordenite Synthesis using different OSDA
MOR-Zeolite Composition Templ
ate
Temp oC
Time
h
Si/Al BET
m2g
-1 Ref.
NaMOR 7.4 H2O/Si,
20 Si/Al,
0.23Q/Si,4
OH/Al
TEAO
H
170 72 18.1 434 [27]
MFI/MOR
Overgrowth
6Na2O:0.84
Al2O3:16.8
SiO2:8TEAB
r: 1000H2O
TEABr 170 48 19.4 480 [36]
NaMOR 38 Si/Al, 0.5
Na2O/Si,
0.0299 Q/Si,
16 H2O/Si
OPDA 160 144 38 324 [30]
HMOR -- TEABr 150 72 20 390 [37]
DMOR (TEA)2O:Na2
O:A12OSiO2:
H20
TEABr 170 120 86.9 [38]
NaMOR NH4+/Si=0.0
5, Na+/Al=18
, Si/Al=60,
TEA/Si=0.12
, HMI=0.17
TEAO
H &
HMI
170 72 37.1 518 [32]
NaMOR 10SiO2:Al2O
3:3Na2O:500
H2O:4.0C6H6
O2
Benzen
e-1,2-
diol
140 264 32.2 - [39]
NaMOR 10SiO2:Al2O
3:3Na2O:500
H2O
Benzen
e-1,2-
diol
140 48 10.8 - [39]
MOR SAR=32 HMDA 150 90 22 544 [40]

13
Table 1. 2 Mordenite Gel parameters from different Template-free processes
MOR-
Zeolite
Composition Temp.
(oC)
Time
h
Si/Al
BET
m2g
-1 Ref.
NaMOR 6Na2O:Al2O3:30SiO2:780H2O 150 24 15 389 [26]
PMOR 16.6SiO2:Al2O3:7.5Na2O:900
H2O
170 24 8.3 419 [41]
PMOR 20SiO2:Al2O3:7.5Na2O:900H2
O
170 24 10.2 485 [41]
HMOR 6Na2O:Al2O3:30SiO2:780H2O 180 24 15 [42]
NaMOR 12Na2O:2Al2O3:100SiO2:500
H2O
180 120 16 52.14 [43]
NaMOR 1.0Na2O:0.56Al2O3:10SiO2:22
5H2O
164 60 15.7 429 [44]
NaMOR 1.0SiO2:0.052Al2O3:0.23Na2O
15.2H2O
170 96 6.20 480 [45]
HMOR 6Na2O:Al2O3:30SiO2:780H2O 170 36 64 389 [46]
NaMOR 6Na2O:Al2O3:30SiO2:780H2O 170 24 20.9 331 [47]
NaMOR SAR 80, NaOH:SiO2= 0.50,
H2O:SiO2
433 20 31.0 378 [34]
The early application of Phosphorus is seen in the selectivity to p-xylene during
disproportionation toluene pioneered by kaeding [48]. Phosphate zeolite later emerged as
steam resistant functional catalyst during steam-assisted catalytic cracking reactions [49].
The stabilizing effect of phosphorous on ZSM-5 in steam has been investigated [50].
Although cations of the rare earth element were first used for stabilizing zeolite Y
framework [50]. In the case ZSM-5, steam treatment after P-impregnation not only
stabilizes the aluminium framework but also preserves enormous Bronsted acid sites,
increase catalytic activity and selectivity to lighter olefins in cracking of n-decane [50]

14
The mechanism of interaction of Phosphorus added to zeolite Y by impregnation
has been reported by Pannervelsam et al [51]. Zaiku el al reported the different models of
phosphorus interaction with the bronsted acidity of ZSM-5 [52]. The computational
model of Hung et al however, favors the kaeding model in which he concluded that
strong Hydrogen bonding interaction occur between the framework tetrahedral oxygen
atom and a hydrogen atom from the phosphoric acid [53]. The schemes of these proposed
mechanisms were shown below
Scheme 1. 1 Proposed model of phosphoric acid interaction with zeolite Y Pannervelsam
et al [51]

15
Scheme 1. 2 Proposed interaction models of phosphate with ZSM-5 framework (a)
Kaeding et al [54] and Vedrine et al. [55] (b) Lercher et al [56] (c) and (d) Corma et
al [57]; (e) Zaiku et al [52]
The 1H NMR self-diffusion experiment conducted by Caro et al [58] on ZSM-5
shown that the phosphoric acid entered the channel system of the zeolite. The removal of
octahedral extra-aluminium framework by oxalic acid treatment has also showed some
decrease in silanol groups while nitric acid treatment led to creation of mesopores by
leaching silica [59]. The proposal of Zhuang et al [60] showed that phosphorous can take
silicon position in the framework after hydrothermal treatment of P-ZSM-5. The study of
Van der et al [61] reveals that agglomeration of zeolites was caused by direct phosphate
modification in ZSM-5 type zeolite. Van et al [62] reported that the difficulty in
accessing the micropore in mordenite is caused by the presence of extra-framework
aluminium in the micropore. They found that mild oxalic acid treatment greatly improved
the adsorption capacity of n-hexane as the model compound.

16
The shape selectivity and stability of phosphate zeolites in catalytic reactions is
available in literature [63-66]. Corma et al. [63] reported the optimum phosphorous
loading based on the framework Si/Al of ZSM-5. Table 1.3 and 1.4 respectively present a
survey of optimum p-loading, catalytic activity and selectivity of P-zeolites in some
selected reactions.

17
Table 1. 3 Optimum P-loading for different zeolites from literature
Zeolite P-loading Si/Al Feed Con.(%) Olefin
selectivity
(%)
Ref.
P-
HZSM-
5St.
0.5 wt.%
NH4H2PO4
25 naphtha
100 97
(80.4)
propylene
[67]
P-ZSM-
St.
1.0 wt.%
NH4H2PO4
25 naphtha 88 (74.2)
propylene
[67]
P-ZSM-
5St.
1.0 wt.% H3PO4 25 n-decane @40 7.60 C3= [57]
P-ZSM-
5
0.1wt.% H3PO4
220 methanol
TOS 100hrs
70 70
(70)
propylene
[68]
P-ZSM-
5/ZSM-
11
4 wt.% H3PO4 103 methanol 99.9 85
(51)
propylene
[69]
P-ZSM-
5
2.1 wt.% H3PO4 C4-olefins 64 57.5
(45)
propylene
[70]
SAPO-
34
30% 1-hexene 42.35 92.88
(72.79)
propylene
[71]
P-
MCM-
22
3 wt.%
(NH4)2HPO4
15 methanol 100 70
(50)
propylene
[72]
P-ZSM-
5
5 wt.%
NH4H2PO4
21.3 methanol 100 80 [66]

18
Table 1. 4 Different phosphorus zeolites applied in production of olefins Values in
bracket represent selectivity to propylene.
Catalyst
P-loading Reaction
Condition
Con.
%
Feed Stock Olefins
Selectivi
ty
Ref.
P-ZSM-5
1.5 wt.%
H3PO4
600 oC , 1ATM,
in N2 WHSV of
3.2h-1
, 2.0g of
cat, after 50hr
TOS
71 C-4 olefins 57.5
(42.5)
[70]
P-ZSM-5 2.1 wt.%
H3PO4
600 oC 1ATM,
N2, WHSV of
3.2h-1
, 2.0g of
cat, after 50hr
TOS
64 C-4 olefins 57.5%
(45)
[70]
P-ZSM-5
Si/Al=55
4 wt.%
H3PO4
500 oC
1atm, N2, cat.
Loading 60mg
WHSV=2h-1
96% methanol 70%
(42.5)
[69]
P-ZSM-
5/ZSM-
11intergrow
th
Si/Al=103
4 wt.%
H3PO4
500 oC
1atm, N2,
Loading 60mg
WHSV=2h-1
99.9
%
methanol 85%
(51)
[69]
PHAPTMS
-MOR
Si/Al=8.3
9 mol%
PHAPTMS
420 oC, 2hrs,
0.15g catalyst
1atm
56.6
%
7.5 g
LDPE
(pellets)
45% of
C1-C5
[41]
PHAPTMS-
MOR
Si/Al=10.2
22 mol%
PHAPTMS
420 oC, 2hrs,
0.15g catalyst
1atm
57.1
%
7.5 g
LDPE
(pellets)
28% of
C1-C5
[41]
P-HZSM-5
Si/Al=25
0.1% wt.
(NH4)2HP
O4
650 oC, 1atm, N2,
300mg cat
99% C4 alkanes
(n-butane
and i-
butane)
48.7%
(17.1)
[73]
P-HZSM-5
Si/Al=25
0.5 wt.%
(NH4)2HP
O4
650 oC, 1atm, N2,
300mg cat
99.3
%
C4 alkanes
(n-butane
and i-
butane)
55.7%
(19.0)
[73]
P-HZSM-5
Si/Al=25
1.0 wt.%
(NH4)2HP
O4
650 oC, 1atm, N2,
300mg cat
96.1
%
C4 alkanes
(n-butane
and i-
butane)
53.0%
(26.6)
[73]

19
Table 1. 4 (cont’d)
Catalyst
P-loading Reaction
Condition
Con.
%
Feed Stock Olefins
Selectivi
ty
Ref.
P-HZSM-5
Si/Al=25
0.5 wt.%
NH4H2PO4
923K, 1atm
He carrier gas,
100
%
naphtha
C5-C12
97%
(80.4)
[67]
P-HZSM-5
Si/Al=25
1.0 wt.%
NH4H2PO4
923K, 1atm
He carrier gas
100
%
Naphtha
C5-C12
88%
(74.2)
[67]
P-ZSM-5 3.48 wt.%
P(OCH3)3
in n-octane
600 oC, 1ATM,
WHSV=2.3h—1
100
%
DME 74.6%
(38.7)
[74]
ZSM-5
Si/Al=9.3
1.1 wt.%
P(OCH3)3
in n-octane
470 oC, 0.1g cat.
WHSV 11.2 h-1
93% 3 mol%
DME
5%mol
methanol
70%
(40)
[75]
P-ZSM-5
Si/Al=12.6
1.1 wt.%
P(OCH3)3
in n-octane
470 oC, 0.1g cat.
N2 carrier gas
WHSV 12.1 h-1
83% 11 mol%
DME
6%mol
methanol
71%
(40)
[75]
W-
P/HZSM-5
Si/Al=35
(NH4)2HP
O4, &
((NH4)6H2
W12O40)
803K, 0.1 MPa,
N2 20 mlmin-1
,
WHSV of 13h-1
,
cat. loading
10mg
75% 1-butene
N2/1-
Butene=3
60.6
(47.8)
[76]
W-
P/HZSM-5-
ST Si/Al=35
2wt.%
Each of
(NH4)2HP
O4,
((NH4)6H2
W12O40)
803K, 0.1 MPa,
N2 20 mlmin-1
,
WHSV of 13h-1
,
cat. loading
10mg
57.4
%
1-butene
N2/1-
Butene=3
56.8%
(50)
[76]
P-ZSM-5
Si/Al=35
2 wt.%
(NH4)2HP
O4,
803K, 0.1 MPa,
N2 20 mlmin-1
,
WHSV of 13h-1
,
cat. loading
10mg
69% 1-butene
N2/C4=3
55.1%
(46.5)
[76]
P-ZSM-5-
ST
Si/Al=35
1.54wt%.
(NH4)2HP
O4
803K, 101KPa,
WHSV=10h-1
,
75.5 84 vol. %
butane
16vol%
butane
N2/C4=3
55.9
(43.1)
[77]

20
Table 1. 4 (cont’d)
Catalyst
P-loading Reaction
Condition
Con.
%
Feed Stock Olefins
Selectivi
ty
Ref.
P-ZSM-5
Si/Al=220
0.1 wt.%
H3PO4
733 K weightily
hour velocity
0.75 h-1
atm
MeOH: H2O =
1:5, cat. Loading
0.5g
3hrs TOS
100
%
methanol 72.2%
(46.4)
[68]
P-ZSM-5
Si/Al=220
0.1 wt.%
H3PO4
460 oC; LHSV
0.75 h-1
atm
MeOH: H2O =
1:5, cat. Loading
0.5g
100hrs TOS
70% methanol 70%
(55.6)
[68]
MCM-22
Si/Al=15
0.5 wt.%
(NH4)2HP
O4
723K,
WHSV=1h-1
,
40hrs TOS, 0.4g
cat. In N2
100
%
methanol 50%
(38)
[78]
P-MCM-22
Si/Al=15
1wt.%
(NH4)2HP
O4
723K,
WHSV=1h-1
,
40hrs, 0.4g cat.
In N2
100
%
methanol 65%
(40)
[78]
P-MCM-22
Si/Al=15
2 wt.%
(NH4)2HP
O4
723K,
WHSV=1h-1
,
40hrs, 0.4g cat.
In N2
100
%
methanol 68%
(47)
[78]
P-MCM-22
Si/Al=15
3 wt.%
(NH4)2HP
O4
723K,
WHSV=1h-1
,
40hrs, 0.4g cat.
In N2
100
%
methanol 70%
(50)
[78]
P-MCM-22
Si/Al=15
4 wt.%
(NH4)2HP
O4
723K,
WHSV=1h-1
,
40hrs, 0.4g cat.
In N2
100
%
methanol 57%
(42)
[78]
30% SAPO-
34
H3PO4 500 oC,
0.12MPa,
WHSV=2h-1
,
TOS, 1.5 min
42.3
5%
hexane 92.88%
(72.79)
[79]
30% SAPO-
34
H3PO4 550 oC,
0.02MPa,
WHSV=1.98h-1
,
TOS, 1.5 min
60% hexane
95%
(67)
[79]

21
Table 1. 4 (cont’d)
Catalyst
P-loading Reaction
Condition
Con.
%
Feed Stock Olefins
Selectivi
ty
Ref.
P-ZSM-5
Si/Al=21.3
5 wt.%
NH4H2PO4
723K. WHSV=4
h-1
100 methanol 80 [66]
Ni-P-ZSM-5
Si/Al=25
5 wt.%
(NH4)2HP
O4 and
2wt. %
Ni(NO3)2
550 oC under N2
at 1 atm. 20-40
mesh of cat.
Steam/feed
0.5g/g
WHSV=5 h-1
42.4
1
1-butene 87.84
(55.66)
[80]
Ni-P-ZSM-5
Si/Al=25
2 wt.%
(NH4)2HP
O4 and
2wt. %
Ni(NO3)2
550 oC under N2
at 1 atm. 20-40
mesh of cat.
Steam/feed
0.5g/g
WHSV=5 h-1
79.9
3
1-butene 74.08
(43.54)
[80]
Ni-P-ZSM-5
Si/Al=25
1 wt.%
(NH4)2HP
O4 and
2wt. %
Ni(NO3)2
550 oC under N2
at 1 atm. 20-40
mesh of cat.
Steam/feed
0.5g/g
WHSV=5 h-1
82.5
6
1-butene 69.5
(41.07)
[80]
Ni-ZSM-5
Si/Al=25
0wt% P
2 wt. %
Ni(NO3)2
550 oC under N2
at 1 atm. 20-40
mesh of cat.
Steam/feed
0.5g/g
WHSV=5 h-1
88.0
1
1-butene 52.84
(25.0)
[80]
P/C-ZSM-5
Si/Al=33
0.3 wt.%
H3PO4
600 oC, 12 hrs. 96 c5-reffinate 59 E&P [81]
La-P/C-
ZSM-5
Si/Al=33
0.3 wt.%
H3PO4
0.7 La/Al
La(NO3)3.6
H2O
600 oC, 12 hrs. 95 c5-reffinate 63 E&P [81]
P-ZSM-5
Si/Al=280
1 wt.%
H3PO4
500 oC 5g cat.
1.35 bar
70.1 1-butene 52.7
(46.9)
[82]
PITQ
Si/Al=100
0.5 wt.%
NH4H2PO4
0.3 cat. 500 oC
WHSV=3.5 h−1
,
101.325kpa TOS
5min
95.6 1-butene 57.3
(41.6)
[83]

22
From Patwardhan’s report, it was observed that ion-exchange ability of zeolites
can be increased by decreasing framework Si/Al ratio [35]. Thus, zeolites with low to
intermediate Si/Al ratios are better in ion exchange voltammetry [84]. This property
together with the availability of adsorption sites provided by their porosity, have made
zeolites very important component of composite electrodes [85]. The framework negative
charge of zeolite A was successfully reversed by surfactant ion which showed excellent
selectivity to nitrate in potentiometric determination [86]. The fact that solid materials
including zeolites, clays and other non-conducting oxides such as alumina and LDH,
affect the rate of electron transfer has been established long time ago by Shaw et al [87].
Shaw et. al. reported that carbon paste composite electrodes have the advantage of
surface renewability and reproducibility by polishing. Zeolites, in carbon paste electrode
affects the total surface coverage which affects the mode of current limitation, kinetic of
electron movement to and from the supporting graphite and stability of the fabricated
sensor [23]. The observed Improved sensitivity was a consequence of the pore size of 3, 4
and 5 Å, of zeolite A which facilitated the chemical deposition of the cobalt ions [88].
Table 1.5.5 show review of application of some ZCPEs

23
Table 1. 5 Review of different zeolite modified electrodes in electroanalytical
applications
SN Zeolite Modified
Electrodes
(ZMEs)
Characterization
technique
Application Comments Ref.
1 Mordenite
MOR/ZCPE
Amperometry Determination of
ascorbic acid
Ease of
preparation and
high sensitivity
[90]
2 Nickel Phosphate
VSB-5.- ZME
Cyclic
voltammetry
Electrocatalytic
oxidation of
methanol
Improve
activity
[91]
3 Fe-Y Zeolite
ZME
Square wave
voltammetry
Electrocatalytic
oxidation of
ascorbic acid
Enhancement o
f anodic peak
current
with lowering e
ffect on
overpotential
[92]
4 NH4-Y-ZME Voltammetry Detection of lead
and cadmium
Excellent
reproducibility
[93]
5 ZSM-5 Cyclic
voltammetry
Electrocatalytic
oxidation of
methanol
Reduced
overvoltage in
diffusion
control process
Improved
efficiency
[94]
6 Ag-zeolite Cyclic
voltammetry cyclic
voltammetry MPA
Simultaneous
determination of
nitrates and
nitrites
Reproducibility
and
strong dynamic
range
against nitrates
concentration
of 1-10 mM
and nitrites
concentration
[95]
7 Ni-zeolite Y
Carbon electrode
Cyclic
voltammetry
Oxidation of
methanol
Stabile surface
and strong
dynamic range
[96]

24
Although enough data was gathered from the study of P-zeolites, there is
disagreement between results documented. Thus, study on the exact zeolite-phosphate
interaction is still an open field of discussion. Phosphate mordenite has seldom been
reported or not at all available. The electrochemical characterization and electrocatalytic
behavior of phosphate mordenite have never been attempted.
This current work aimed to obtain mordenite from direct hydrothermal synthesis
without seed and organic template. Phosphorous impregnation was carried out to modify
the diffusivity and acidity of the mordenite. The electrocatalytic performance of the
phosphate mordenite was investigate in detection of some toxic anionic species was
investigated and reported in this document.

25
Chapter Two
Synthesis zone of OSDA-free and seed-free Mordenite
Abstract
Direct hydrothermal synthesis of mordenite without the addition of both seed and
organic template is reports in this work. The role of inorganic cations in crystal purity and
directing the mordenite structure was actualized. It was observed that higher Si/Al ratio
requires higher alkalinity ratio of the gel. Pure mordenite was obtained using silica gel,
colloidal silica and fumed silica, while TEOS and water could not produce mordenite
phase due to the difficulty in silica dissolution and transportation. Smaller crystals were
achieved at 160 oC. Framework Si/Al ratio can be raised to as high as 50 using silica gel
in template-free process. At fixed Na/Si ratio of 0.52 pure mordenite Si/Al molar ratios of
only 15 and 20 can be obtained. The FE-SEM revealed the formation long flat prism
crystals in 48 h using silica gel. While much shorter small prismatic crystal was obtained
in 24 h using the fumed silica.
26
2.1 Background
The suitability of zeolites as catalyst in many important industrial processes can
be said to be due to their porosity, interconnected channels and acidic sites [97].
Important features of zeolites that made them unique include surface area, microporous,
sieving ability, exchangeable cations, internal surface area with acidic sites, ability to
resist hash temperature in the presence of water and their attraction to charge species.
They are inorganic polymeric materials [98].
The structural chemistry of zeolites is based on two functional units constituting
silicon or aluminium atom (or some other elements) bonded to four oxygen atoms
forming a tetrahedral, with the oxygen liked to two tetrahedral atoms normally bent (ca
145 o) which are link together to form a ring containing commonly 4, 5, 6, 8, 10 and 12
[3].
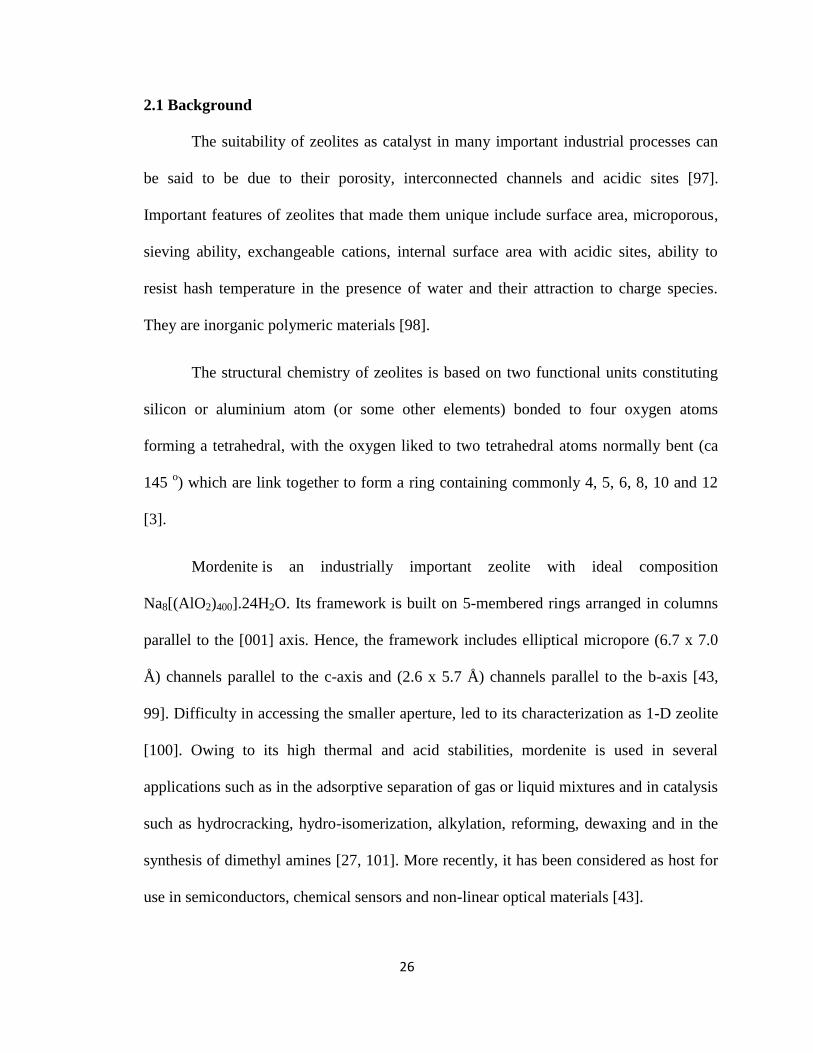
Mordenite is an industrially important zeolite with ideal composition
Na8[(AlO2)400].24H2O. Its framework is built on 5-membered rings arranged in columns
parallel to the [001] axis. Hence, the framework includes elliptical micropore (6.7 x 7.0
Å) channels parallel to the c-axis and (2.6 x 5.7 Å) channels parallel to the b-axis [43,
99]. Difficulty in accessing the smaller aperture, led to its characterization as 1-D zeolite
[100]. Owing to its high thermal and acid stabilities, mordenite is used in several
applications such as in the adsorptive separation of gas or liquid mixtures and in catalysis
such as hydrocracking, hydro-isomerization, alkylation, reforming, dewaxing and in the
synthesis of dimethyl amines [27, 101]. More recently, it has been considered as host for
use in semiconductors, chemical sensors and non-linear optical materials [43].

27
The crystallization parameters that might affect the morphology of zeolites
synthesized using aluminium sulfate as aluminum source were reported recently [102].
Various parameters determine the crystallinity and the crystal size in the hydrothermal
synthesis of zeolites [30]. For instance, different cations; NH4+
, Ca2+
, Li+, H
+ and Ni
+
were used to understand the effect of ion-exchange on crystallinity and morphology of
EU-1 zeolite [103].
Hincapie et. al. obtained a 62 nm mordenite crystal from low Si/Al gel in a seed
assisted template-free synthesis, the group claimed to obtained small and highly
crystalline mordenite in a shorter crystallization time and lower temperature with a good
BET surface area. by dissolving the silica source rather than dispersing to mixed with the
alumina source [26]. Zhang et al in [44] and [45]obtained mordenites with high BET area
of respectively 429 and 480 in a template-free hydrothermal process.
Although, Hincapie et al [26] reported the synthesis of mordenite without seed
addition. However, other factors affecting the formation of pure mordenite phase were
limited in the literature. In this work, direct hydrothermal synthesis of mordenite type
zeolite crystals is reported. The factors that affect mordenite crystal growth and crystal
purity, especially inorganic cations content and alkali ion concentration in seed-free and
template-free synthesis were studied. The morphology of mordenite crystals obtained
from different silica source were revealed using FE-SEM.

28
2.2 Experimental
2.2.1 Materials
PTFE-lined stainless steel autoclaves with a volume of 100 ml were used
throughout the synthesis. No OSDA used in this research. Colloidal silica (40 wt. %
suspension in water, Ludox AS-40 Sigma Aldrich), Silica gel (Sigma Aldrich grade 7734
pore size 60Å, 70-230 mesh), water glass (sodium orthosilicate reagent grade) and fumed
silica were utilized as silica sources. Sodium Aluminate 13404 Sigma Aldrich was used
as Aluminium sources. Sodium hydroxide (NaOH) pellets PRS-CODEX 98% was used
to control alkalinity.
2.2.2 Procedure
Mordenite synthesis was started according to the gel dispersion procedure
reported by Hincapie et. al. [26]. Adding extra Silica sources stated above did
modification of synthesis procedure; also in contrast, seed was not used in our procedure.
The initial sol-gel mixture was prepared by dissolving 2.097 g of NaOH in 54.13 g of
deionized (DI) water, followed by the addition of 0.632 g of sodium Aluminate under
stirring condition at room temperature. After a clear solution was obtained the silica
source (silica gel in the first case) in then added. The gel composition
6Na2O:Al2O3:30SiO2:780H2O obtained was continuously stirred at room temperature for
one hour before transferring to Teflon-lined stainless steel autoclave. The crystallization
was initially performed at 180 oC
for 48hrs in the absence of both seed and organic
template. To study the effect of Si/Al ratio, the gel composition was conditioned to Si/Al
of 15, 20, 25 and 30. When different silica source or aluminium source were used the
appropriate amount of silica or aluminium required were calculate from stoichiometric

29
equations. Moreover morphology at fix Si/Al ratio was also studied by changing silica
source (water glass, TEOS, Colloidal silica, silica gel). All products were washed by
deionized water until the pH of the product was 7 using a centrifuge. The products were
dried in air circulating fume hood for 24 h. All zeolite synthesis experiments were carried
out under static condition.
Ion exchange was performed under microwave irradiation. 2 M Ammonium
nitrate (NH4(NO3) was prepared by adding 16 g of ammonium nitrate in 100 ml of DI
water. Then 20 g of this solution was used against each 1 g of the zeolite. The
temperature of the microwave was ramped to 85 C in 2 min. Then, it was dwelled at 85 C
for 10 min. After two sequential ion-exchange steps, the products were washed once by
DI time each and finally the products were washed three times by the DI water using
centrifuge. The products were dried in fume hood for 24 h, thereafter, calcination done
under airflow for 15 h. The temperature was ramped from ambient temperature to 550 C
in 3 h. Then the temperature was dwelled at 550 C for 12 h. Finally the sample was
obtained in the H-MOR formed.
2.2.3 Characterization
Mordenite peak patterns were confirmed using a diffractometer (Miniflex,
Rigaku) equipped with Cu Kα radiation (1.5405 Å). XRD patterns were recorded at
2θ from 5° to 50° using a scan of 0.03° per step and a counting time of 3 s for each step.
The morphology of the synthesized mordenite were revealed by Field-emission scanning
electron microscopy (FE-SEM) LYRA 3 Dual Beam (Tescan) equipped with energy
dispersive X-ray spectrometry (EDX, Oxford Instruments) to give the elemental
5 15 25 35 45
Inte
nsi
ty (
a.u
)
2θ (Degrees)

30
composition, operated at an acceleration voltage of 30 kV. The elemental composition of
the samples was obtained from the EDX.
2.3 Result and discussion
2.3.1 Effect of alkalinity ratio Na/Si ratio
To understand the effect of the alkalinity ratio, the Na/Si ratio was varied for each
the gels with Si/Al molar ratios of 20, 25 and 50. For the sample prepared from gel of
Si/Al 20 it was observed that the crystallinity was improved by increasing the Na/Si ratio
from 0.52 to 0.54 (corresponding to –OH/Si = 0.49). It was also observed that the
morphology of the product is becoming richer in the prism-like crystals with
disappearance of the sphere-like crystals compared to the sample prepared at 0.52 Na/Si
ratios. This showed that the alkali acts as seed or structure directing agent. Seronu et al.
[104] reported the spheres present in the samples with less Na/Si ratio as Analcime
which accounted for the decreased crystallinity of former sample. From the diffractogram
in Fig 2.1, it is seen that the broadening of the peaks decrease with increasing Na/Si
concentration as a result of the disappearance of the spheres. Fig. 2.2 shows the FE-SEM
images of the samples at Na/Si ratios of 0.52 and 0.54. It can be further justified that,
there are no much sphere like crystals in the sample with higher alkalinity ratio. Although
the morphology of the materials are similar but the variation in the parameter has led to
increased purity and size. Nucleation was the first stage in Mordenite synthesis followed
by a crystal growth in a continuous nucleation stage [7] which led to larger crystal. Thus,
in the presence of higher alkali and metals cations concentrations, the rate of nucleation
increase continuously even in crystal growth forming a bigger crystal.

31
Fig. 2. 1 XRD patterns of mordenite zeolites synthesized with different Na/Si ratios at
fixed Si/Al of 20 at 180 oC for 48 h using silica gel and sodium aluminate

32
Fig. 2. 2 SEM of MOR samples at Si/Al ratio 20 synthesized at 180
oC in 48 h from gel
with Na/Si of; (a) 0.52 (b) 0.54
Fig 2.3 and Fig 2.4 present the differactograms of the variation of Na/Si from 0.40
to 0.56 at Si/Al ratio of 25 and from 0.60 to 0.70 at Si/Al ratio of 50. The same argument
discussed above is enough to justify the trend. The broadening of the peaks in both cases
decrease due to the increase in purity and crystallinity corresponding to the effect of high
alkali concentration. At lower aluminium content the silica requires higher alkali
concentration to be incorporated in to the framework as discussed earlier.
(a) (b)

33
Fig. 2. 3 XRD patterns of mordenite zeolites synthesized with different Na/Si ratios at
fixed Si/Al of 25 at 180 oC for 48 h using silica gel and sodium aluminate

34
Fig. 2. 4 XRD patterns of mordenite zeolites with different Na/Si ratios at fixed Si/Al of
50 synthesized at 180 oC for 48 h. using silica gel and sodium aluminate
Fig. 2.5 summarizes the differactograms of pure mordenites obtained at different
Si/Al and the corresponding Na/Si ratios at which pure phase of the mordenite were
obtained. It was clear that pure products of different gel Si/Al ratios were obtained at
different cationic content of the gel. Thus, concentration of the alkali is the driving force
to pure crystals. The alkalinity of the gel solution is also a determining factor for
mordenite crystallinity, morphology and crystal purity. In the absence of seed and
template the alkali acts as the structure-directing agent. Eventual increase in the –OH
concentration due to increase in the Na/Si ratio allows for the control growth of pure
mordenite at higher silica content which controls the transport of the silicates in solutions
probably during the ageing time to give the pure products. The –OH modifies the

35
nucleation process [35] by increasing the rate of crystal growth of the mordenite [30].
Hincapie et al [26] was the first to obtained small mordenite from low gel Si/Al which he
justified using the Lowenstein’s rule, which was in accord with effect of the alkali
concentration that determine the framework to be obtained [35]. The increase in the
crystal size with increase in the –OH/Si ratio was due to the increase in the pores and an
eventual crystal size growth. It was also reported elsewhere [30] that the increase in
crystal size and crystallinity was due to the increasing in the gel Na/Si content as
observed in this studies.
Fig. 2. 5 XRD patterns of pure MOR with different Si/Al obtained at different -OH/Si
ratios synthesized at 180 oC in 48 h using silica gel and sodium aluminate

36
2.3.2 Effect of Silica source
Fig. 2.6 is a typical differactograms depicting the effect of different silica source
on the crystallinity of mordenite synthesized from a gel with 15 Si/Al molar ratio.
Mordenite synthesized from water glass and tetra ethyl orthosilicate, displayed a strong
sharp peak, which is attributed to silica [105], but no evidence of mordenite peaks is
present in the differactograms. In the case of tetra ethyl orthosilicate, this could be due to
the effect of ethanol by product formed during the aging, formation of which affect the
solvent polarity by reducing the concentration of the alkali OH present. Consequently
affecting the dissolution and transport of silicates which cause slower crystal growth,
giving mainly the silica as the product [105]. Furthermore, there is evidence of formation
of diethyl ether during the aging reactions, which was noticed by formation of organic
phase in the main solvent (water) and prevents the silica transport.
The XRD patterns showed pure mordenite was obtained with Colloidal silica,
Silica gel and fumed silica. When fumed silica was used the gel composition was
modified due to the lower density of fume silica, 100 grams of water was used to obtain a
homogeneous mixture. To understand the Morphology of these pure MOR the FE-SEM
images were snapped. A prism-like morphology was obtained using colloidal silica which
could be attributed to the well dispersed hydrated SiO2 of the colloidal silica [44]. While
a short prism-like crystals were observed when fumed silica was used and longer flat
prism when the silica gel was used (Fig. 2.7). Similar morphology was reported
elsewhere [45], which was said to be due to the gel dispersion procedure. These prism-
like crystals of size range 6-7 µm were also reported elsewhere [43]. The small
spherically shaped crystals of size 1 µm observed growing along with prismatic

37
morphology, were reported by Wang et al when he used TEAOH as an organic template
[106].
Fig. 2. 6 XRD patterns of MOR samples at Si/Al ratio 15 synthesized at 180
oC for 48 h
using different Silica source

38
Fig. 2. 7 SEM of MOR samples with 15 Si/Al molar ratio and 0.52 Na/Si molar ratio
synthesized at 180 oC for 48 h using different Silica source (a) Silica gel (b) Fumed silica
(c) Colloidal silica
2.3.3 Effect of Si/Al molar ratio
Fig. 2.8 displays the differactograms of mordenite synthesized from gel of
different Si/Al ratio in the range of 15-30 at constant Na/Si ratio of 0.52. Pure mordenite
at a fixed Na/Si of 0.52 was obtained for only Si/Al ratio of 15 and 20, while experiments
with Si/Al ratio of 25 and 50 produce Analcime peaks along with the mordenite phase,
which is regarded as impurity. The Analcime is becoming more obvious as the Si/Al is
increased at the same Na/Si ratio. Pure mordenite at Si/Al ratio 25 and 50 were obtained
by changing Na/Si contents. It was observed that by increasing the Na/Si ratio pure
MORs at higher Si/Al ratios were successfully formed as discussed and justified above.

39
Inorganic cationic species are known to induce crystallization in zeolites and affect
crystal purity and morphology as reported in [35].
Fig. 2.9 Display the FE-SEM micrographs of mordenite synthesized from gel of
different Si/Al ratios. It was noticed that the crystal size increase with increased Si/Al
ratio. The morphologies of the products vary with the Si/Al ratio. At the lowest Si/Al of
15, formation of spherically aggregated crystals in addition to the prisms was observed.
The small spheres have been first reported by Mao et. al. [107] as assembly of small
stripe-like crystals and contributed to the broadening of the peaks in the differactograms.
By increasing the gel Si/Al ratio from 25 to 30 the morphology is changing from flat
prism to rod-like crystals. At Si/Al molar ratio of 30 a rod-like morphology was 100 %.
However, the Analcime peaks were sharp and almost 30 %. In conclusion it can inferred
that the crystal size and shape increase as the Si/Al ratio is increased, also the uniformity
and morphology of the crystals is improved as the Si/Al is increased

40
Fig. 2. 8 XRD patterns of mordenite zeolites with different Si/Al ratios at fixed Na/Si of
0.52 synthesized at 180 oC for 48 h
Fig. 2. 9 FE-SEM micrographs of mordenite zeolites with different Si/Al ratios at fixed
Na/Si of 0.52 synthesized at 180 oC for 48 h (a) 15, (b) 20, (c) 25 and (d) 30

41
2.3.4 Effect of Crystallization temperature
To study the effect of crystallization temperature mordenite synthesized with
colloidal silica at Si/Al 15 was hydrothermally treated at 150 o
C, 160 o
C and 170 oC.
Sample synthesized at 150 oC was amorphous. While sample treated at 160
oC and 170
oC displayed a typical mordenite differactograms as shown in Fig. 2.10. The sample
heated at 160 oC exhibit good crystallinity and smaller size as can be justified from the
diffraction peaks which were less broadened, less intense and sharped. Increasing the
temperature leads to larger crystals and high crystallinity [26, 108]. Although its known
that zeolites crystal growth increase with temperature in an active crystallization mode,
but an anisotropic effect is observed in most cases [109]. From the SEM images in Fig.
2.11 the sample synthesized at 160 showed a short prism-like structure in contrast to that
prepared at 170 oC that displayed irregular crystals structure and size.
Fig. 2. 10 XRD patterns of mordenite using colloidal silica synthesized at 180 oC for 48
h at different temperatures using colloidal silica

42
Fig. 2. 11 FE-SEM micrographs of MOR zeolites of 15 Si/Al molar ratio and 0.52Na/Si
molar ratio synthesized at different temperatures (a) 160 oC, (b) 170
oC
2.3.5 Effect of aging time
To investigate the effect of aging time 1h, 12 h and 24 h ageing was performed
using colloidal silica with a gel of 15 Si/Al molar ratios. Fig. 2.12 showed the
differactograms, both ageing produce pure mordenite with a typical powdered pattern as
obtained by Aly et. al. [43] who also used 20 h aging for mordenite synthesis without
organic template. The morphology of the products were studied by FE-SEM shown in
Fig. 2.13 It was found that mordenite aged at 24 h exhibit a 100% short small platy prism
structure. While ageing performed in 12 h produce an unusual white jointed particles
crystal that could not be actually distinguished. Comparing sample obtained from 24 h
aging with the former experiment conducted with 1 h ageing the morphology was a
mixture of sphere like crystals and prism-like crystal. As reported by Simoncic Petra
[110] allowing more time lead to complete dissolution of the silica and formation of
larger crystals, while giving less time lead incomplete nucleation or crystal growth.

43
Fig. 2. 12 XRD of MOR synthesized at 180
oC using colloidal silica at different aging
time in 48 h
Fig. 2. 13 FE-SEM micrographs of MOR zeolites of 15 Si/Al molar ratio and 0.52Na/Si
molar ratio aged at different times (a)1h (b) 12 h and (c) 24 h

44
2.4 Conclusion
A novel Organic template-free and seeded-free synthesis of mordenite zeolite was
successful. The influence or the control effect of the alkalinity ratio was evident in
aluminosilicates synthesis. Mordenite zeolite of Si/Al ratio 15, 20, 25 and 50 were
successfully obtained by playing with the alkali concentration, which was the major
controlling factor in the crystallization of pure mordenite phase. It was observed that
higher Si/Al ratio requires higher Na/Si ratio. Crystallization of mordenite with higher
Si/Al at the same Na/Si ratio produced Analcime.
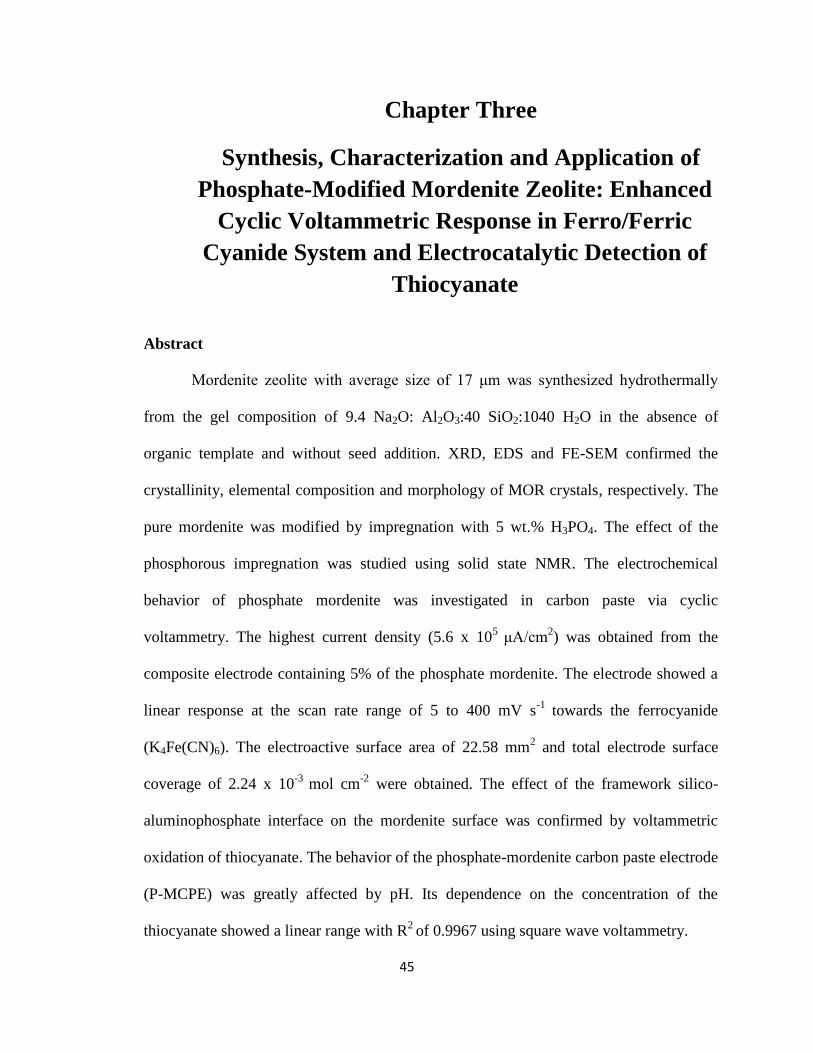
45
Chapter Three
Synthesis, Characterization and Application of
Phosphate-Modified Mordenite Zeolite: Enhanced
Cyclic Voltammetric Response in Ferro/Ferric
Cyanide System and Electrocatalytic Detection of
Thiocyanate
Abstract
Mordenite zeolite with average size of 17 μm was synthesized hydrothermally
from the gel composition of 9.4 Na2O: Al2O3:40 SiO2:1040 H2O in the absence of
organic template and without seed addition. XRD, EDS and FE-SEM confirmed the
crystallinity, elemental composition and morphology of MOR crystals, respectively. The
pure mordenite was modified by impregnation with 5 wt.% H3PO4. The effect of the
phosphorous impregnation was studied using solid state NMR. The electrochemical
behavior of phosphate mordenite was investigated in carbon paste via cyclic
voltammetry. The highest current density (5.6 x 10⁵
μA/cm2) was obtained from the
composite electrode containing 5% of the phosphate mordenite. The electrode showed a
linear response at the scan rate range of 5 to 400 mV s-1
towards the ferrocyanide
(K4Fe(CN)6). The electroactive surface area of 22.58 mm2 and total electrode surface
coverage of 2.24 x 10⁻³
mol cm-2
were obtained. The effect of the framework silico-
aluminophosphate interface on the mordenite surface was confirmed by voltammetric
oxidation of thiocyanate. The behavior of the phosphate-mordenite carbon paste electrode
(P-MCPE) was greatly affected by pH. Its dependence on the concentration of the
thiocyanate showed a linear range with R2
of 0.9967 using square wave voltammetry.

46
3.1 Background
Zeolites, particularly aluminosilicates, are well known for their industrial
application especially in oil refining, petrochemicals and fine chemicals production
owing to their large surface area, pore volume, acidity, uniform microporous channel and
excellent hydrothermal and chemical stabilities [19].
Mordenite is a high-silica, hydrophobic and 1-dimensional zeolite with the typical
composition Na8 Al8 Si40 O96 (H2O)24 as first discovered and reported by Meier [111].
The siliceous (high silica content) material, is normally an assembly of channels which
were enclosed by 8 and 12-membered rings of SiO4 and AlO4 with a unit cell parameters
a = 18.1 Å, b = 20.5 Å & c = 7.5 Å, while the void volume is 0.14 ccg-1
(cubic centimeter
per gram) and framework density of 17.2 T atoms / 1000 Å3 (where T is tetrahedral Si or
Al ) [41, 112]. Mordenite has orthorhombic symmetry, and belongs to the cmcm space
group. The framework in the (001) direction contains elliptical micropore (6.7 x 7.0 Å)
channels parallel to c-axis and (2.6 x 5.7 Å) channels parallel to the b-axis leading to the
uni-dimensional nature as a result of difficulty to sorption of most molecules due to the
tightness of the later channels of mordenite [41, 113].
Mordenite has been recently reported to be a suitable substrate for hosting
semiconductors, chemical sensors and non-linear optical materials owing to its shape
selectivity, acidity and thermal stability [113]. Ion-exchange in the zeolite is
accompanied by changes in pore size, ion-conductivity, adsorption, catalytic activity and
selectivity [113]. Thus, metal ion incorporation, pore size engineering and partial
dealumination are most common chemical modification procedures employed to adjust
the characteristics properties of mordenite [113]. Partial and controlled dealumination of

47
zeolites is mostly achieved by mild acid treatment, which resulted in removing
aluminium extra-framework and narrowing the pore diameter [114]. As an innovative
modification method, changing zeolites diffusivity with phosphorous has attracted great
concern [52]. It was found that even at low phosphorous loading, shape selectivity of
zeolites is improved due to contraction of the pore diameter [114]. The introduction of
phosphorus into zeolites has been proven to facilitate the adjustment of acid sites and
more effective control of hydrogen transfer reaction [83]. Most of the effort invested on
phosphorus modification has been invested to increased para-selectivity during the
isomerization of xylene or disproportionation of toluene [114]. In recent years,
phosphorus modification of zeolites has been used to enhance selectivity to lighter olefins
[68, 69, 72, 80, 83, 115-117].
Owing to the negative charge in the zeolites framework, potential selectivity
should be observred based on the charge on a molecule. Xu et al reported that the
absorbed molecules-zeolite interaction, hydrophobicity or hydrophilicity, and ion-
exchanged capacity of zeolite can all be altered by changing the framework Si/Al molar
ratio [6]. In chemical and gas sensors applications, compound with desirable sensing
property is assembled into the zeolite cages or channels to enhance and modify the
intrinsic zeolite property [6]. These intrinsic properties may be coupled with an
electrochemical reaction of interest to generate a new responsive electrochemical surface
that can be categorized in the so-called chemically modified electrodes (zeolites modified
electrodes). The composition, response time, ionic strength, thermal stability and usable
pH range of the material surface can be electrochemically investigated [85]. The first use
of zeolite as a membrane electrode in potentiometric technique led to the eventual

48
advances in zeolite modified electrodes (ZMEs) [118]. Zeolite modified electrodes
received great interest in the late 1980s due to their high stability low cost and potential
industrial applications [85].
Manea et al successfully established the composition of zeolite doped with silver
in composite electrode using cyclic voltammetry (CV). The electrode showed a linear
dependence of current against both analytes during simultaneous determination of nitrites
and nitrates in aqueous solution using Multiple-pulse Amperometry [95]. It was
investigated and reported elsewhere that the peak current depends on electroactive
surface area from cyclic voltammetry data [119]. The electrochemical mechanism in
mordenite zeolite catalytic process in mordenite-poly (ethylene oxide) oligomer electrode
was investigated using cyclic voltammetry, the mordenite framework Al-O bond was
found to be prone to destruction at high positive potential, owing to the negative charge
of the framework aluminium [120]. Table 3.1 summarizes some ZMEs and the
techniques used in their characterization and application.

49
Table 3. 1 Review of some zeolite modified electrodes
SN Zeolite
Modified
Electrodes
(ZMEs)
Characteriza
tion
technique
Application Comments Ref.
1 Surfactant
modified
zeolite
FT-IR,
Potentiometry
Potentiometric
determination
of nitrates in
water
Linear response to 1 x
10 -6
to 1 x 10 -3
M
nitrates species with a
detection limit of 1 x
10-6
M and slope of
59.4±0.7mV per
decade
[121]
2 SiO2-Al2O3
mixed oxide
carbon paste
Cyclic
voltammetry
Anodic
stripping
voltammetric
determination
of Lead (II)
Three times Decreased
detection limit 1.07 x
10-9
mol L-1
.
Selectivity linear
increase in peak
current
[122]
3 Mordenite
MOR-CPE
Cyclic
Voltammetry
Determination
of Atenolol
Enhanced sensitivity
with low cost of
preparation
[123]
4 Mordenite in
poly (ethylene
oxide
oligomer)
Cyclic
Voltammetry
Probing
electrochemic
al mechanism
in catalytic
process
Resistance to high
potential and the risk
of losing Al-O bond in
the tetrahedral Al
framework
[120]
5 Nickel
dispersed on
natural
phosphate
fixed on
copper.
Cyclic
voltammetry
Electrocatalyti
c oxidation of
methanol
Better electrocatalytic
activity than Ni. Linear
increase with
concentration
[124]

50
Thiocyanate commonly exists as potassium thiocyanate or sodium thiocyanate. It
is a conjugate base to thiocyanic acid. The anion is oxidized to sulfate and cyanide during
metabolism in acidic medium by peroxidase [125]. As a result, discrimination of smokers
can be made by thiocyanate measurement for its high production due to tobacco smoke
degradation [126]. Higher concentration of thiocyanate might leads to coma condition as
it affect the process of dialysis of protein [127]. Moreover, thiocyanate as part of
industrial effluents might present significant toxicity to aquatic lives and hence its
detection is a highly important research pursuit. Although spectroscopic and
chromatographic approaches have been employed in this experimentation, the ease of
preparation, stability, selectivity and sensitivity of the so-called chemically modified
electrode might be advantageous. The electrochemical technique employed for
thiocyanate detection depends mainly on the construction of potentiometric sensors. The
used of superconducting material based on copper oxide for the oxidation of thiocyanate
was reported by Badri et al [127]. However, cyclic voltammetry was used which less
sensitive technique compared to the square wave voltammetry.
The aim of this work was to investigate the behavior of a novel phosphate
mordenite carbon paste electrode (P-MCPE). The synthesized mordenite was converted
into the proton form by ion-exchange using ammonium nitrate solution, afterward post
synthesis phosphorous impregnation was carried out. A novel phosphate mordenite
carbon paste electrode (P-MCPE) was constructed from the phosphate mordenite. Cyclic
voltammetry was used to further investigate the electrode properties. The best new
composite electrode was employed in the electrochemical detection of potassium
thiocyanate via square wave voltammetry.

51
3.2 Experimental
3.2.1 Materials
PTFE-line autoclave was used in the zeolite synthesis. Silica gel (Sigma-Aldrich
grade 7734 pore size 60Å, 70-230 mesh) was used as silica source, Sodium aluminate
13404 Sigma- Aldrich was used as aluminium source. Sodium hydroxide pellets PRS-
CODEX 98% was used to control pH of the gel. Orthophosphoric acid (85% Sigma-
Aldrich) was used for the post synthesis impregnation. For the electrochemical
characterization, Potassium ferrocyanide K4Fe(CN)6 was as the analyte in characterizing
the electrode and KCl was used as supporting electrolyte, anhydrous sodium phosphate
monobasic (Sigma-Aldrich), anhydrous sodium phosphate dibasic (Sigma-Aldrich) and
phosphoric acid were used to make buffer of different pH (3 to 9) which were used to
study the effect of pH. Potassium thiocyanate was used to study the efficacy of the
electrode in the electrocatalytic oxidation of thiocyanate. Low viscosity paraffin oil was
used as a binder in the preparation of the carbon paste electrode. Parent proton mordenite
H-MOR and phosphate mordenite zeolite 5P-MOR were synthesized. Mortar and pestle
was used for mixing carbon graphite and phosphate zeolite. Ag/AgCl electrode was used
as the reference electrode and platinum as the counter electrode in the electrochemical
measurements. All experiments were conducted at room temperature.
3.2.2 Synthesis and phosphorus modification of mordenite zeolite
Mordenite synthesis was started according to the gel dispersion procedure
reported by Hincapie et al. [26]. A gel with composition 9.4 Na2O: Al2O3:40 SiO2:1040
H2O was treated hydrothermally in a PTFE-lined autoclaves at 180 oC
for 48 h in the
absence of both seed and organic template. The Product was washed several times until

52
the pH became less than or equal to 7. The product was then calcined in air circulating
oven at 550 oC. The proton form (acidic mordenite) was obtained by converting it to
ammonium form by ion-exchanged using ammonium nitrate, which was calcined to get
the pure proton form.
Phosphorus modification was done based on the post synthesis impregnation
procedure reported by Dyballa et al [66]. A predetermined amount of mordenite zeolites
was suspended in 1.5 ml of 5wt. % H3PO4 and the slurry was allowed to evaporate by
heating at 40 oC after which the product was calcined.
3.2.3 Characterization of the phosphate mordenite
The morphology of the mordenite and phosphates mordenite zeolite was
investigated by field-emission scanning electron microscopy (FE-SEM) using LYRA 3
Dual Beam (Tescan). The crystallinity was confirmed by using a diffractometer
(Miniflex, Rigaku) equipped with Cu Kα radiation (1.5405 Å) at 2θ 5° to 50° using a
scan rate of 0.03° per step and a counting time of 3 s for each step. 27
Al NMR of both
parent and modified samples and 31
P NMR of the phosphorus mordenite were conducted
to investigate the effect of phosphorus impregnation using Bruker Lamda-200 Multi
Nuclear Magnetic Resonance (NMR) Spectrometer with Solid-state facility.
3.3 Electrochemical characterization
3.3.1 Preparation of zeolite modified electrode
Phosphate mordenite carbon paste electrode was prepared as guided by the work
of Ardakani et al [89]. A mixture of 100 mg containing constant amount of 30% low
viscosity paraffin oil as binder and different ratios of the graphite to phosphate mordenite

53
zeolite was mixed manually in a mortar. The Paraffin oil was added by means of a
dropper and mixed for 20 min until a uniformly wetted paste was obtained. The paste was
then packed into the end of 40 mm Teflon tube at the end of which a 0.1 mm hole
electrode contact surface was made. Pushing an excess of the paste out of the tube and
polishing it on a weighing paper obtained a new surface. Carbon paste electrode was
prepared in the same way without adding zeolites to the mixture. The amount of the 5P-
MOR was varied from 5% to 20% with a constant amount of paraffin oil at 30% while
graphite was varied with the zeolite amount. The electrodes were named 0-5P-MCPE, 5-
5P-MCPE, 10-5P-MCPE, 15-5P-MCPE and 20-5P-MCPE according to whether the
carbon paste electrode contain 5%, 10%, 15% and 20% of the 5P-MOR, respectively.
3.3.2 Voltammetric measurement using cyclic voltammetry
The electroactive surface area, the current dependence in ferrocyanide and
working potential of the phosphate-mordenite carbon paste electrode were obtained by
cyclic voltammetry using a CHI 760E Potentiostat equipped with a three-electrode cell.
The phosphate mordenite carbon paste electrode (PMCPE), a platinum wire as auxiliary
electrode, and a KCl saturated Ag/AgCl reference electrode. The Ag/AgCl reference is
kept in 1 M KCl solution when not in use. The electrochemical behavior of 5P-MCPE
was examined in potassium ferrocyanide K4Fe(CN)6. The electrode was then used for the
electrocatalytic oxidation of thiocyanate ion in phosphate buffer, the effect of different
pH of the phosphate buffer of 0.1 M concentrations was studied and a calibration curve
was established.

54
3.4. Results and Discussion
3.4.1 Characterization of mordenite zeolite and phosphate mordenite zeolite
The XRD powder pattern of the synthesized mordenite (H-MOR) and
phosphorous modified mordenite (P-MOR) zeolites is shown in the Fig. 3.1 The sample
peaks where typical of a mordenite phase and the morphology was compared to that
published elsewhere [107] and confirmed that a pure mordenite phase was obtained. It is
also noted that the crystallinity of the mordenite was highly retained after phosphorus
modification. Flat prism-like crystals were the dominant phase of the morphology as
shown in Fig. 3.2. The phosphorus modification was confirmed by energy dispersion X-
ray spectroscopy (EDS) that gave an average phosphorus surface amount of 2.20 wt.% of
total zeolite amount of 1.0 g.
The effect of phosphoric acid treatment was further investigated by solid state
27Al NMR and
31P NMR. Fig. 3.3 shows the
27 Al NMR of the parent mordenite and the
phosphorus modified mordenite zeolite. The signal at around 55 ppm is attributed to the
tetrahedral Al-framework while the small and broader signal occurring around 0 ppm is
attributed to the octahedral framework aluminium (OFAl) as reported in the literature
elsewhere [128]. From the two spectra, it is observed that the gross amount of Al has
decreased after phosphorus modification, with a sharp decrease of octahedral Al signal.
This indicates the formation of new local silico-aluminophosphate (SAPO) surface as
reported in [57, 65]. To confirm the addition of phosphorus 31
P NMR was conducted on
the modified mordenite sample and the spectrum is shown in Fig. 3.4 A clear sharp peak
at around -30 ppm evolved, confirming strong chemical interaction between the
phosphate from the phosphoric acid and the zeolite bronsted acidity which is in

55
accordance with the hydrogen bonding formation as proposed by Kaeding in his model
[54]
Fig. 3. 1 XRD patterns of mordenite zeolites (a) Parent HMOR and (b) 5P-MOR
with 0.52 Na/Si molar ratio and 20 Si/Al molar ratio synthesized at 180 oC for 48
h using silica gel
Fig. 3. 2 FE-SEM micrographs of mordenite zeolites of 20 Si/Al molar ratio and 0.52
Na/Si molar ratio crystallize at 180 oC (a) H-MOR, (b) 5P-MOR

56
Fig. 3. 3 Aluminium
27Al NMR of (a) H-MOR, (b) 27Al NMR of 5P-MOR

57
Fig. 3. 4 Phosphorus
31P NMR of 5P-MOR with 0.52 Na/Si molar ratio and 20 Si/Al
molar ratio
3.5 Electrochemical Evaluation
3.5.1 Effect of percentage of mordenite in carbon paste electrode
The cyclic voltammograms of the 5P-MCPEs were shown in Fig. 3.5A. The
percentage of the 5P-MOR was varied from 0% to 20% 5P-MCPE composite at constant
paraffin oil content of 30% to give five different carbon paste electrodes designated as 0-
5P-MCPE, 5-5P-MCPE, 10-5P-MCPE, 15-5P-MCPE and 20-5P-MCPE, in all cases the
initial number indicates the percent of the 5P-MOR. The CV of the 5% 5P-MCPE was
recorded between -0.4 V to 0.8 V at 100 mV s-1
, a current approximately 5.6 x 10⁵
μA/cm2 was obtained. The bare carbon paste (containing 0% of 5P-MOR) gave 4.8 x 10
5
μA/cm2, following the 5-5P-MCPE. Thus, as reported the zeolite in the composite

58
electrodes enhance ion accessibility of the ferrocyanide species to its pores and channels
which at lowest concentration, increased the accumulation of the analyte at electrode
surface [87]. It can be seen that, the highest (threshold) electrode surface coverage was
attained which is proportional to the peak current. In the higher concentrations, this
threshold electrode surface coverage was exceeded. It was also reported elsewhere [23]
that the surface saturation occur when the population of redox species at the electrode
surface surpass the total area of the electrode and hence an overlapping and steric effect
result in lower ion accessibility. This effect leads to a decreased electroactive area and
peak current at high coverage owing to higher amount of the phosphate mordenite. We,
therefore, propose that the current limitation due to the aluminophosphate surface of the
mordenite is obeying diffusional model.
Fig. 3.5B shows the peak current trend in graphical manner. The plot of the peak
current versus the percentage modifier showed a non-linear increase of the peak current
with maxima at 5% 5P-M0R.

59
Fig. 3. 5 (A) Comparison of CVs (B) Plot of peak current vs % modifier of carbon paste
electrode containing (a) 5%5P-MOR (5-5P-MCPE), (b) 0% 5P-MOR (0-5P-MCPE) (c)
20% 5P-MOR (20-5P-MCPE), (d) 15% 5P-MOR (15-5P-MCPE) (e) 10% 5P-MOR (10-
5P-MCPE) in 10 mM K4Fe(CN)6

60
3.5.2 Effect of scan rate
The 5% 5P-MCPE (5-5P-MCPE) behaves linearly with respect to the ferro/ferric
cyanide system from 5 mV s-1
to 400 mV s-1
with R2 of 0.9921, suggesting a pure
diffusion behavior as reported elsewhere [129]. Fig. 3.6 shows the voltammograms at
various scan rates. The relationship between peak current and square root of the scan rate
obtained from the Randles-Sevcik Equation (Equation 3.1) is shown in Fig. 3.6. The
electroactive surface area (A) of the electrode was estimated.
ip = 2.69 x 10⁵ n
3/2 v
1/2D
1/2 AC Eqn. 3. 1
Where ip is the anodic peak current, n the number electron transfer, A the electrode
surface area, D the diffusion coefficient, v the scan rate and C the concentration of the
K4Fe(CN)6. The electroactive surface area was found to be A=22.58 mm2. Compared
with the bare carbon paste electrode, the estimated electroactive surface area was 12.71
mm2. This clearly justified the extended surface area of the 5P-MCPE over the bare
carbon paste electrode.
Assuming that the surface of the electrode is homogeneous and molecules of the
analyte are spherical, then the theoretical number of redox species can be calculated by
dividing the total electrode area by the diameter of the molecules [23]. Thus, the
concentration of the redox species are then directly proportional to the surface area, hence
based on Equation 3.2 below, the immobilized redox species at the surface of the
modified electrode were considered to control the oxidation-reduction current as they are
responsible for the formation of monolayer Langmuir isotherm [23, 94]. It has been
shown that the analyte concentration at the electrode is not the same as in the bulk
solution. The relationship between peak current of the ferrocyanide and scan rate is

61
shown in Fig. 3.7 From these plots the surface coverage of the redox species on the
electrode (Γ*) can be calculated by employing the Equation 3.2, also the charge transfer
corresponding to the surface coverage can be obtained from Equation 3.3
Ip =𝒏𝟐 𝑭𝟐 𝑨𝜞∗𝒗
𝟒𝑹𝑻 Eqn. 3. 2
Γ = 𝑸
𝒏𝑭𝑨 Eqn. 3. 3
Where A is the electrode surface area (7.85 x 10⁻⁵
cm2) calculated from A = πR
2, n
is the number of electrons involved in the reaction (1 electron in this case), Ip is the peak
current. The total surface coverage (Γ*) is then calculated as 2.24 x 10
-3 mol cm
-2.
According Equation 3, this corresponded to charge transfer of 1.70 x 10⁻²
C compared to
1.28 x 10⁻³
mol cm-2
leading charge transfer of 9.7 x 10⁻²
C for the bare carbon paste
electrode. Hence, this justifies further the enhancement achieved with the phosphate
mordenite with less charging current.

62
Fig. 3. 6 (A) CV of 5-5P-MCPE at different scan rates a. 5 mV b. 10 mV c. 20 mV d. 50
mV e. 100mV f. 200mV g. 300 mV and h. 400 mVs-1 in 10 mM K4Fe(CN)6 and 0.1 M
KCl (B) Plot of peak current vs scan rate

63
Fig. 3. 7 Plot of Peak current vs scan rate in the presence of 10 mM K4Fe(CN)6 in 0.1 M
KCl on (A) 5-5P-MCPE and (B) bare carbon paste electrode

64
3.5.3 Oxidation of thiocyanate
Having established that the phosphate in the P-MOR has impact on the activity of
the carbon graphite electrode composition, we thought it was crucial to investigate how
the P-MOR could impact the electrocatalytic behavior of composite electrode as
phosphate zeolites are known for their stability and selectivity in catalytic reactions [65,
130]. For this study, we select thiocyanate SCN-, as a model analyte. Fig. 3.8A shows the
relative square wave voltammograms obtained in 50 μM SCN- solution at 5-5P-MOR and
bare carbon paste electrodes in phosphate buffer saline PSB (pH 7). The buffer was
chosen because of its good record in electrochemical applications and the neutral pH was
used so that the catalytic effect of the P-MOR will be purely understood. An enhanced
current density (5.73 x 10⁴ μA/cm
2 compared to 3.8 x 10
4 μA/cm
2) of the 5-5P-MCPE
was observed. As discussed earlier this resulted from the higher surface coverage
provided by the phosphate mordenite [87]. Figure 3.8 B displays square wave
voltammograms for the electrocatalytic oxidation of 50 μM thiocyanate.
Based on the above observation we proposed a mechanism in which the SCN-
forms hydrogen bonding with the hydrogen of the phosphate group there by fastening the
accumulation and increasing concentration of the SCN- at the electrode surface.
Moreover, electrostatic attraction between the tetrahydroxyphosphonium ion positive
charges also brings the thiocyanate to the graphite surface [40].

65
Fig. 3. 8 (A) Comparison of SWV of (a) 5-5P-MCPE and (b) Bare CPE. (B) SWV of 5-
5P-MCPE in pH 7 buffer (a) in the presence of 50 μM SCN- (b) in the absence of SCN
-

66
3.5.4 Effect of pH
Fig. 3.9 shows the effect of pH, which was studied on 50 μM, SCN-
in 0.1 M
phosphate buffer (pH range 3 to 9) prepared from sodium dihydrogen phosphate,
disodium hydrogen orthophosphate and phosphoric acid. An irregular increase in the
peak current with pH was observed. The highest current was achieved at pH 8 which
confirms the catalytic detection of the SCN- as the pH ensure the reservation of the
hydrogen atoms of the phosphate mordenite and this agrees with our proposed
mechanism. This behavior could be attributed to the phosphorus content of the modifier,
which was reported in [58] to modify the diffusivity of the zeolite material and hence
govern the dynamic process at the electrode surface making it purely diffusion control
and allowing more molecules to converge at the electrode surface.

67
Fig. 3. 9 SWV of 5-5P-MCPE in 50 μM SCN
- in phosphate buffer of different pH. Inset
is the relationship of peak current ad pH.

68
3.5.5 Calibration plots
Fig. 3.10 shows the square wave voltammograms of SCN- and the calibration plot
showing the relationship of peak current with concentration of SCN- (10 to 150 μM). The
peak current showed a linear increase within the concentration range of 1.0 x 10⁻⁷
mol L-1
to 1.50 x 10⁻⁴
mol L-1
of SCN-
(ip = 0.0773[SCN-] + 0.1699) R
2 = 0.997). The
reproducibility and stability of the electrode was determined by registering 7 consecutive
cyclic voltammograms, a relative standard deviation of 2.3 % was observed which
demonstrated excellent precision of the electrode.
Fig. 3. 10 Calibration, dependence of the peak current on concentration of SCN
- (10 μM
to 150 μM) Graph. Inset is the relationship of peak current with concentration.

69
3.6 Conclusions
Hydrothermal alkaline-control, template-free and seed-free synthesis of mordenite
was successful achieved. The addition of phosphorus led to the control diffusivity of the
phosphate mordenite. 27
Al NMR and 31
P NMR confirmed that fundamental chemical
changes occurred due to the phosphate zeolite-interaction. 27
Al NMR studies had
revealed that dealumination of the mordenite aluminium framework occurred due to the
phosphoric acid treatment. The newly generated silico-aluminophosphate surface also
showed an increase in catalytic activity. Cyclic voltammetric technique was utilized for
the characterization of the phosphate zeolite carbon paste electrode in ferro/ferric cyanide
system. The electroactive surface area was determined using the Randles-Sevcik equation
as 22.58 mm 2
and total electrode surface coverage of 2.24 × 10⁻³
mol cm-2
compared
respectively to 12.71 mm2
and 1.28 × 10⁻³
mol cm-2
of the bare. The electrode 5-5P-
MCPE containing 5% of 5P-MOR showed a maximum current density of 5.6 × 10⁵
μA/cm2 in 10 mM ferrocyanide. The electrocatalytic detection of thiocyanate on 5-5P-
MCPE was enhanced and a dynamic range of 10 to 150 μM was obtained. The electrode
demonstrated strong precision (RSD 2.3%). Thus the construction and electrocatalytic
application of phosphate mordenite for the first time was successfully studied and has
shown promising application as electrochemical sensor for industrial applications.

70
Chapter Four
Synthesis, Characterization and Electrocatalytic
Activity of Phosphate Mordenite Towards Nitrite
Oxidation in Aqueous Solution
Abstract
In this work template-free synthesis of mordenite was carried out. Post synthesis
impregnation using phosphoric acid was applied to add phosphate group. The Phosphate
modification leads to disruption of bridging hydroxyl and silanol groups as confirmed by
FT-IR result. The EDX showed that the framework Si/Al ratio decrease with p-loading
and the 27
Al NMR revealed the formation of aluminophosphate at the surface of
mordenite. Using CV and SWV the phosphate mordenite was investigated for the
electrocatalytic oxidation of nitrite. The effect of different electrolyte and pH were
studied and the calibration curve of nitrite at phosphate mordenite carbon paste electrode
showed a linear dependence within nitrite concentration range of 10 μM to 250 μM with
correlation coefficient of R2
=0.9999. Standard deviation of 3.3 % was observed after
registering 5 consecutive cyclic voltammograms of 5 mM NO2-, each time at newly
reproduced surface.

71
4.1 Background
Due to its excessive use as preservatives and additive in consumer products,
nitrite became present in our food and water bodies. Nitrite was used as reactive anode
for corrosion inhibition [131]. Thus, the existence of nitrite in water is indisputable. The
damaging effect of nitrite to human system became obvious from its ability to oxidize
Fe+2
to Fe+3
in the hemoglobin thereby making it unable to bind oxygen [132]. Nitrite has
been also reported as the reactive reagent for the formation of nitrosamines which are
carcinogens [133]. Consequently, investigation and construction of analytical tools to
detect nitrite would ensure environmental safety and promote public safety.
Scientists have taken the challenge by the introduction of various analytical
techniques involving spectroscopic [134], chromatographic [135], electrophoresis [136],
chemiluminescence [137] for nitrite determination. However, the cost associated with
these techniques and the time required for detection encouraged the invention of new
techniques with better feasibility, reproducibility and less time consuming.
Electrochemical techniques have been often utilized in this pursuits due to their
simple setup, fast response, excellent sensitivity above all their availability on small scale
[138]. Carbon paste electrodes have shown great advantages above solid ones owing to
their chemical inertness, appreciable potential range, insignificant capacitive current, ease
of preparation and compatibility with various analysis in different media.
Inclusion of inert material such as zeolites and layered double hydroxides in
composite electrodes has shown intensive interest in electrochemical analysis [139, 140].
Non-conductive materials such as zeolites, layered double hydroxides and clays possess
surfaces that affect the mobility of electron [87]. They offer the following advantages;

72
increasing stability and reproducibility of surfaces, reduced over potential in diffusion
control processes, and limited oxygen interferences. On account of their ion exchange
ability, zeolites allow electron transfer at the surface of their framework when charge
specie is move in or out of the zeolite. The pores of zeolites allowed for ion accessibility
which can facilitate the deposition and adsorption of detectable ions [141].
The aspiration of electrode modification with zeolites, arouse from their potentials
as electrocatalyst and chemical sensors in a size and shape selective analytical
investigation [142]. Mordenite type zeolite, due to its resistance to thermal
decomposition, stability to acidic medium and its ability to being selective, has been used
as substrate in the construction of such devices as chemical sensors. Semiconductors and
optical fibers [143]. The selectivity of mordenite is attributed to its high Si/Al molar ratio
and two channels sizes with one being large 12-membered ring (7.0 x 6.7 Å) and a small
channel of 8-membered ring (5.7 x 2.6 Å) [5]. The later channel is too tight and
accessible only by smaller molecules. Thus, mordenite is considered as 1-D zeolite.
Phosphate zeolites have been extensively developed due to the thermal stability
towards dealumination and propylene selectivity of phosphorous zeolites during catalytic
cracking reactions [63, 64, 66, 83]. When phosphorous is added to zeolite in the form of
phosphoric acid, phosphate group attached itself to the zeolite framework through the
oxygen (O-atom) in the framework. Thereby, constraining the sizes of the channels
windows and pore openings [48]. Mordenite distinctive features can be good requirement
for phosphatation which will lead to highly selective, thermal and acid resistance
aluminophosphate surface in which the reacting Al-framework is protected [61]. Such

73
surfaces, due to the formation of positively charged phosphate group can be selective to
anionic species especially nitrite in electrochemical studies.
This work explores the fundamental chemical and physical changes that followed
phosphorous addition to mordenite type zeolite by some spectroscopic techniques. We
also investigate the electrocatalytic behavior of the modified mordenite in nitrite
electrochemical oxidation in various electrolytic solutions and at different pH.
4.2 Experimental
4.2.1 Materials
Prepared gels were treated in 100 ml PTFE-lined stainless steel autoclaves with a
volume. All samples were synthesized using Silica gel (Sigma Aldrich grade 7734 pore
size 60Å, 70-230 mesh), Sodium Aluminate 13404 Sigma Aldrich was used as
Aluminium sources. The alkalinity of the gel 98% was control Sodium hydroxide
(NaOH) pellets PRS-CODEX alkalinity. Orthophosphoric acid (85% Sigma-Aldrich) was
used in the phosphate modification. Phosphate mordenite zeolite (P-MOR) was
synthesized in our laboratory. Carbon graphite powder was used in the construction of the
carbon paste electrode. The phosphate mordenite and the carbon graphite were bound
using a low viscosity paraffin oil. Mortar and pestle was used for mixing carbon graphite
and phosphate zeolite. The fabricated electrodes were characterized in the analyte
solution KNO2 and KCl (Fluka chemika) was used as supporting electrolyte. The effect of
different electrolytes was investigated in 0.1 M solution of, acetate buffer prepared from
sodium acetate (Fluka chemika) and Acetic acid (Fischer scientific) and phosphate buffer
prepared from phosphoric acid (85% Sigma-Aldrich), anhydrous sodium dihydrogen

74
phosphate (Fischer Scientific), anhydrous disodium hydrogen phosphate (Fischer
Scientific) and sulphate buffer prepared from ammonium sulphate and sulfuric acid.
Ag/AgCl electrode was used as the reference electrode and platinum as the counter
electrode in the electrochemical measurements. All experiments were conducted at room
temperature.
4.2.2 Synthesis of mordenite zeolite
The Gel dispersion method reported by Hincapie et al. [26] was used in the
zeolites synthesis. Gel of different Si/Al at different Na/Si ratios was prepared in the
equal amount of water. Stipulated amount of sodium hydroxide pellets were dissolved in
water followed by the addition of sodium aluminate under stirring condition at room
temperature. After a clear solution was obtained the silica gel was then introduced. All
gels were aged for 1 h before transferring them into a PTFE-lined stainless steel
autoclaves. Hydrothermal treatment was carried out at 180 oC
for 48 h without the
addition of both seed and template. After 48 h the product were removed from the oven,
quenched and washed several times with DI water using centrifuged until the pH became
less than 7. The washed products were dried in an air circulating fume hood.
To obtain the proton form of the Mordenite zeolite (H-MOR), Ion exchange was
performed by microwave irradiation. Two sequential ion exchanges were carried out by
adding 20 g of 2 M Ammonium nitrate (NH4NO3), which was prepared, by adding 16 g
of ammonium nitrate in 100 ml of DI water. Then 20 g of this solution was used against
each 1 g of the zeolite. The temperature of the microwave was ramped to 85 oC in 5 min
and later dwelled at 85 oC for 10 min. the products were washed once by DI after each
ion exchanged and finally, the products were washed three times using DI water in a

75
centrifuge and dried. The dried products were calcined in oven under airflow for 15 h
with ramping rate of 2.9 o
min-1
for 3 hrs. The temperature was then dwelled at 550 oC for
12 h. Products were finally obtained in the H-MOR formed.
4.2.3 Phosphate modification
Phosphorus modification was conducted based on post synthesis impregnation
according to the procedure reported by Corma et al [63]. 1 g mordenite zeolite (H-MOR)
was suspended in aqueous solution of phosphoric acid containing the desired
phosphorous amount. Three different phosphorous loading (0.5 wt.%, 0.75 wt.% and 1.0
wt.%) were prepared. In each case a liquid to solid ratio 10 (wt/wt) was established. The
slurry was evaporated at 60 oC to obtain the solid product. The modified mordenite
samples were described as xP-MOR-n, where x indicates the phosphorous loading and n
indicates the Si/Al ratio of the mordenite zeolite.
4.2.4 Characterization
The crystallinity of the mordenite was checked using a diffractometer (Miniflex,
Rigaku) equipped with Cu Kα radiation (1.5405 Å). Peak patterns were recorded at
2θ from 5 ° to 50 ° using a scan rate of 0.03 ° per step and a counting time of 3 s for each
step. Field-emission scanning electron microscopy (FE-SEM) LYRA 3 Dual Beam
(Tescan) equipped with energy dispersive X-ray spectrometry (EDX, Oxford
Instruments) operated at an acceleration voltage of 30 kV was used to check the
morphology of the purified products. Bruker Lamda-500 Multi Nuclear Magnetic
Resonance (NMR) Spectrometer with solid-state facility (Proton and multinuclear FT
spectra are accessible) was used to investigate the effect of phosphorus impregnation by

76
conducting 27
Al NMR and 31
P NMR on both parent and modified samples. FT-iR was
also used to further characterize the samples after phosphorus addition.
Table. 4. 1 Synthesis plan for different phosphorous-modified mordenite
Si/Al 15 20 25
Al2O3 Source NaAlO2 NaAlO2 NaAlO2
Na2O/SiO2 0.52 0.54 0.56
Silica source Silica gel Silica gel Silica gel
Temperature (oC) 180 180 180
Time (h) 48 48 48
P-Loading
0.5 wt. % 0.5 wt. % 0.5 wt. %
0.75 wt. % 0.75 wt. % 0.75 wt. %
1.0 wt. % 1.0 wt. % 1.0 wt. %
4.3 Electrochemical characterization
4.3.1 Preparation of phosphate mordenite carbon paste electrode
The preparation method of the carbon paste electrode described by Ardakani et al
[89] was adopted in this work. Desired amount of the P-MOR was mixed with graphite
powder while the paraffin oil binder was kept constant at 30 %. A total of 100 mg
mixture was formed in each case. The carbon graphite and P-MOR was first mixed using
mortar and pestle before adding the oil binder. After the paraffin oil was added, it was
mixed again until a homogenously wetted paste is obtained. The pasted was carefully
packed into a 40 mm Teflon tube and a 0.1 mm electrode contact hole was made at one

77
end of the tube. Pushing excess paste out and polishing on a weighing paper created new
surface. The electrodes where named based of the P-loading on mordenite and based on
the percentage of P-MOR in the mixture. Thus, 0-5P-MCPE, 5-5P-MCPE, 10-5P-MCPE,
15-5P-MCPE and 20-5P-MCPE were obtained corresponding respectively to bare, 5%,
10%, 15% and 20% percentages of the P-MOR.
4.3.2 Voltammetric measurement
The characteristic oxidation peak current of nitrite ion on the surface different
phosphate mordenite carbon paste electrodes (P-MCPEs) were recorded via cyclic
voltammetry using CHI 760E Potentiostat equipped with a three electrode cell. The P-
MCPEs were used as the working electrode, platinum wire as auxiliary electrode, and a
KCl saturated Ag/AgCl reference electrode was used. The optimum p-loading, Si/Al
ration and percentage P-MOR were established by recording cyclic voltammograms of 10
mM NO2- ion at the different P-MCPEs. The total surface coverage of the electrode was
determined by varying the potential scan rate. The optimum electrolyte/buffer solution
and working pH were determined. Finally a calibration curve was established and the
stability of the electrode was investigated. The different composite electrodes can be
identified by the letters in the following description, y-xP-MCPE-n in this case y is added
to show the percentage of the phosphate mordenite in the carbon paste electrode, x and n
have been described above.

78
4.4 Results and discussion
4.4.1 Crystallinity mordenite zeolite and phosphate mordenite zeolite
The crystallinity of parent MOR and P-MOR with different Si/Al ratios 15, 20
and 25 and those loaded with varying phosphorous concentration were investigated at 2ϴ
from 5 oC to 50
oC with a rate of 3
o/min. MOR samples with Si/Al ratios of 15, 20 and 25
showed the pure mordenite phase with excellent crystallinity at corresponding Na/Si of
0.52, 0.54 and 0.56 (Fig 4.1). Compared to the work of Hincapie et al [26] mordenite
with Si/Al ratio 20 synthesized for 48 h showed almost 110% crystallinity in a seed
assisted gel dissolution method. Also, compared with the standard mordenite powdered
pattern from IZA (International Zeolite Association), the synthesized mordenites exhibit
excellent crystallinity. Gel Si/Al ratio has shown no observable impact on the
crystallinity of synthesized MOR, as the number and intensity of major peaks were
relatively equal. The XRD peaks showed some broadening at base of the peaks, that is
more obvious in MOR-15 (Si/Al = 15). This is attributed to the uncommon aggregates of
small-sized strip-like crystal that formed spheres as reported elsewhere [107]. Fig. 4.2 to
4.4 show the X-ray powdered pattern of MOR prepared from gel of different Si/Al ratios.

79
Fig. 4. 1 XRD powdered pattern of mordenite prepared from gel of different Si/Al
ratios synthesized at 180 oC for 48 h using silica gel
The crystallinity of the P-MOR samples containing different P-loadings was also
checked between 5 oC to 50
oC
of 2θ. It was observed from the slight diminished peak
intensity that crystal size and particle size were reduced after phosphoric acid treatment.
The broadening effect was marginal due to acid treatment. These could be a consequence
of dealumination [66]. Fig. 4.2 to Fig. 4.4 show the XRD of the P-MOR Si/Al of 15, 20
and 25 respectively, compared to their parents H-MOR.

80
Fig. 4. 2 XRD powdered pattern of mordenite sample Si/Al 15 synthesized at 180 oC for
48 h using silica gel impregnated with 0.5 wt.%, 0.75 wt.% and 1.0 wt.% Phosphorous.

81
Fig. 4. 3 XRD powdered pattern of mordenite sample Si/Al 20 synthesized at 180
oC for
48 h using silica gel impregnated with 0.5 wt.%, 0.75 wt.% and 1.0 wt.% Phosphorous.

82
Fig. 4. 4 XRD powdered pattern of mordenite sample Si/Al 25 synthesized at 180
oC for
48 h using silica gel impregnated with 0.5 wt.%, 0.75 wt.% and 1.0 wt. % Phosphorous.

83
4.4.2 Morphology
Fig. 4.5 to Fig. 4.7 display the FE-SEM micrographs of P-MOR of different Si/Al
ratios each loaded with 3 different P amount. In the case MOR-15 crystal, short prism
morphology was obtained. Moreover, some strength sphere were observed with high
magnification which were all reported elsewhere [107]. The broadening of the base of
XRD peaks was evident to the presence of the spheres. It was confirmed from the FE-
SEM images that the crystal sizes increase as the Si/Al ratio increase. This was actually
due to higher alkali in the case of the MOR-25 leading to higher rate of silica transport
during the crystal growth phase. It could also be due to the decrease in the competition
between Al-framework and Si-framework. As reported elsewhere [144, 145] cations
induce crystal formation and led to large crystal.
Fig. 4. 5 FE-SEM of MOR samples 15 Si/Al molar ratio and 0.52 Na/Si molar ratio
crystallized at 180 oC in 48 h impregnated with different P-loading on 0.5g MOR (a) H-
MOR (b) 0.5P-MOR (c) 0.75P-MOR (d) 1.0P-MOR

84
Fig. 4. 6 FE-SEM of MOR 20 Si/Al molar ratio and 0.52 Na/Si molar ratio crystallized at
180 oC in 4 h impregnated with different P-loading (a) H-MOR (b) 0.5P-MOR (c) 0.75P-
MOR and (d) 1.0P-MOR

85
Fig. 4. 7 FE-SEM of MOR samples 20 Si/Al molar ratio and 0.52 Na/Si molar ratio
crystallized at 180 oC in 4 h impregnated with different P-loading (a) H-MOR (b) 0.5P-
MOR (c) 0.75P-MOR (d) 1.0P-MOR

86
4.4.3 Effect of phosphorus impregnation
To confirm the attachment of phosphorus to the mordenite framework, energy
dispersion X-ray spectroscopy (EDX) was employed on the P-MOR(s). Qualitatively it
shows some peaks of phosphorous in the spectrum. It was a less powerful technique to
quantitatively account for the exact amount of phosphorus loaded on the zeolite
mordenite. However, the elemental composition from the EDX summarized in Table 4.1
shows a systematic drop in the framework Si/Al ratio, which was due to the leach out of
the framework aluminium caused by the direct phosphatation [66]. The actual amount of
phosphorous incorporated at each loading on the different mordenite zeolites was
summarized in Table 4.2. The EDX spectra of the P-MOR samples with Si/Al molar
ratios of 15, 20 and 25 loaded with 3 different amount of phosphate group were shown in
Fig. 4.8 to Fig. 4.10
Table. 4. 2 EDX results on the effect of P-loading on the framework Si/Al of MOR
P-MOR P-loading (wt.%) Framework Si/Al (wt. /wt.)
P-MOR-15
0.5 wt. % of P 7.135
0.75 wt. % of P 7.502
1.0 wt. % of P 7.714
P-MOR-20
0.5 wt. % of P 6.686
0.75 wt. % of P 8.424
1.0 wt. % of P 9.611
P-MOR-25
0.5 wt. % of P 7.538
0.75 wt. % of P 7.897
1.0 wt. % of P 9.080

87
Table. 4. 3 Amount of phosphorous incorporated results obtained from XRF
P-MOR P-Loading (wt.%) P-incorporated (wt.%)
P-MOR-15
0.5 wt.% 0.57
0.75 wt.% 0.70
1.0 wt.% 0.87
P-MOR-20
0.5 wt.% 0.59
0.75 wt.% 0.64
1.0 wt.% 0.83
P-MOR-25
0.5 wt.% 0.64
0.75 wt.% 0.77
1.0 wt.% 0.89

88
Fig. 4. 8 EDX spectrum of MOR of 15 Si/Al molar ratio impregnated with different p-
loading (a) 0.5P-MOR-15, (b) 0.75P-MOR-15 and (c) 1.0P-MOR-15
(c)
(a)
(b)

89
Fig. 4. 9 EDX spectrum of MOR of 15 Si/Al molar ratio impregnated with different p-
loading (a) 0.5P-MOR-20, (b) 0.75P-MOR-20 and (c) 1.0P-MOR-20
(a)
(b)
(c)

90
Fig. 4. 10 EDX spectrum of MOR of 15 Si/Al molar ratio impregnated with different p-
loading (a) 0.5P-MOR-25, (b) 0.75P-MOR-25 and (c) 1.0P-MOR-25
(b)
(c)
(a)

91
Caro et al [58] reported from 1H NMR investigation carried out on ZSM-5, the
phosphoric acid pass through channels. Van Donk [62] reported the existence of extra-
octahedral coordinated Al-framework that increase diffusion limitation in mordenite
which was greatly reduced by mild acid treatment. Guided by the fact that both
coordinated framework can be revealed in 27
Al NMR spectrum, we recorded both 27
Al
NMR and 31
P NMR spectra on MOR and P-MOR samples. Comparing 27
Al of the
phosphate mordenite and that of the parent H-MOR mordenite there is decrease in
intensity of the peaks which is more obvious to the peak corresponding to the octahedral
Al, due to the removal of aluminium from framework.
This direct framework dealumination was a consequence of the orthophosphoric
acid impregnation and post thermal-treatment by calcination and it’s the reason for the
eventual decreased in concentration of Brønsted acid sites as inferred from the work of
Caro et al [146]. The dealumination observation was also confirmed by the wok of
Jianwen Li et al in [80] on phosphorus-Nickel co-modification of ZSM-5. The 27
Al
NMR of the phosphoric acid treated mordenite and the parent mordenite zeolite are
presented. Fig. 4.11 to Fig. 4.13 display the 27
Al NMR of the P-MOR.
The 31
P NMR spectra of the P-MOR-15 samples were recorded to complement
the discussion made on the results of 27
Al NMR. The peak around -30 ppm in Fig. 4.14
corresponding to phosphorous was increasing with increasing P-loading, which is
expected on P-MOR-20 and P-MOR-25. This clearly confirms strong chemical
interaction between the phosphate group and the mordenite framework aluminium
through oxygen, forming aluminophosphate surface reported elsewhere [61, 147]. This is

92
also reaffirmation to the increase in the framework Si/Al ratio due to dealumination
observed by the EDX and the 27
Al NMR.
Fig. 4. 11
27Al NMR P-MOR-15 of 15 Si/Al molar ratio impregnated with different P-
loadings
.

93
Fig. 4. 12
27Al NMR P-MOR-15 of 15 Si/Al molar ratio impregnated with different P-
loadings

94
Fig. 4. 13
27Al NMR P-MOR-15 of 15 Si/Al molar ratio impregnated with different P-
loadings

95
Fig. 4. 14
31P NMR P-MOR-15 of 15 Si/Al molar ratios impregnated with different P-
loadings

96
4.4.4 FT-iR studies
Fourier transform infrared spectroscopy (FT-iR) has been used to obtain structural
information from the bronsted acidity of zeolites. Peculiarly, the stretching region of the
–OH can supply rich information on the type of hydroxyl group bound to the zeolite
which are vital to its chemistry [148]. The acidic hydroxyl group constitutes the so-called
bronsted acidity. Recently, mordenite has been reported to comprise six different –OH
groups at different locations (showing stretches between 3581 to 3625 cm-1
) which are
responsible for the bronsted acidity in the zeolites [5]. Thus, we conducted the FT-iR on
all samples and compared them with the parent material so that important chemical
changes following of phosphoric acid treatment can be understood.
Fig. 4.15 to 4.17 shows the FT-iR spectra of the phosphate mordenites of different
Si/Al ratios (P-MOR-15, P-MOR-20 and P-MOR-25). It was noticed as can be seen in
Figures the sharpness of the strong stretching around 3450-3650 cm-1
corresponding to
the silanol and external bridging groups at the surface [5, 50], were diminishing with
increasing P-loading. While the appearance of a weak band at around 3680 cm-1
was
obvious which is due to –OH group in the amorphously formed aluminium phosphate
[50]. The direct consequence of this, is the generation of a more active hydrophobic
surface with possible mesopores [149], the formation of a protonated amorphous
aluminium phosphate layer [150] and the formation of positively charged phosphate
group [50]. The effect is becoming stiffer as the framework Si/Al is increased, which is
obvious due to the hydrophobic nature of silica and decreased in the bronsted acidity in
the phosphate mordenite.

97
Fig. 4. 15 FT-iR Spectra of P-MOR Si/Al = 15, Na/Si = 0.52 synthesized at 180
oC for 48
h (a) parent (b) 0.5P-MOR (c) 0.75P-MOR and (d) 1.0P-MOR

98
Fig. 4. 16 FT-iR Spectra of P-MOR Si/Al = 20, Na/Si = 0.52 synthesized at 180
oC for
48 h (a) parent (b) 0.5P-MOR (c) 0.75P-MOR and (d) 1.0P-MOR

99
Fig. 4. 17 FT-iR Spectra of P-MOR Si/Al = 25, Na/Si = 0.56 synthesized at 180
oC for 48
h (a) parent (b) 0.5P-MOR (c) 0.75PMOR and (d) 1.0P-MOR

100
4.5 Electrochemical evaluation
4.5.1 Optimization of P-loading and the bulk Si/Al ratio for NO2- detection
Considering the fact that getting maximum current is important, we begin the
electrochemical assessment by screening the different phosphate mordenite possessing
different Si/Al ratios and P/Al ratios. The cyclic voltammograms of 10 mM NO2- in 0.1
M KCl pH 7 at different carbon paste electrodes comprising 5 % each of the phosphate
mordenites, 30 % paraffin oil and 65 % carbon graphite were recorded. Also the CV for
the unmodified mordenite carbon paste electrode was recorded. For instance, in the case
of mordenite with Si/Al ratios of 15 three different phosphate mordenite were produced
three different carbon paste electrodes, and another carbon paste electrode were made
from the H-MOR-15.
Fig. 4.18 to 4.20 show charts of peak current against the phosphorous loading
plotted from the data obtained by CV of 10 mM NO2- in 0.1 M KCl at carbon paste
electrodes prepared from each of the H-MOR having 15, 20 and 25 Si/Al molar ratio and
their respective phosphate mordenite P-MOR. The electrodes are named as follows:
MCPE-15, 0.5P-MCPE-15, 0.75P-MCPE-15 and 1.0P-MCPE-15. It can be clearly seen
the promotional effect on peak current was obvious by the systematic increase in peak
current with p-loading from 0 wt. % to 0.75 wt.%. Thus, the influence of positively
charged aluminophosphate surface formed has significant influence towards the mass
transport of the nitride ion.
Interestingly, the highest peak current in all cases was observed at 0.75 wt.%
phosphorous loading. However, the peak current show some degree on dependence on
the MOR Si/Al molar ratios as the highest peak current was obtained with the MOR-25

101
loaded with 0.75 wt.% phosphorous. Not only the peak current is increased but also a
dramatic decrease in the background current was obvious at P-loading of 0.75 on P-
MOR-25(0.75P-MCPE-25).
To verify further, the square voltammograms (see Fig. 4.21) of the electrodes
prepared from the P-MOR-25 containing varying p-loading were recorded. The same
pattern of current increase was observed which shows the reliability of the electrode on
the phosphate composition.
As discussed earlier, the hydrophobicity of the mordenite increase with increased
Si/Al ratio and phosphoric acid impregnation. However, the structural feature supporting
the nitrite oxidation is the formation of the positively charged phosphate groups at the
surface of the mordenite [50, 151]. This electrocatalytic character, which is supplemented
by the pore-system of the structured catalyst, had in a synergistic manner supported the
mechanism proposed by Corma et al.
Scheme 4. 1 Adopted mechanism for phosphate zeolite interaction [50]

102
Fig. 4. 18 Chart showing the relation between peak current and phosphorous loading data
obtained from CVs of carbon paste electrodes prepared from P-MOR-15 containing
different P-loading, at a potential window of 0 mV to 1.8 mV and scan rate of 100 mV s-1
0
10
20
30
40
50
60
I P/µ
A

103
Fig. 4. 19 Chart showing the relation between peak current and phosphorous loading,
data obtained from CVs of carbon paste electrodes prepared from P-MOR-20 containing
different P-loading, at a potential window of 0 mV to 1.8 mV and scan rate of 100 mV s-1
0
10
20
30
40
50
60
I P/µ
A

104
Fig. 4. 20 Chart showing the relation between peak current and phosphorous loading data
obtained from CVs of carbon paste electrodes prepared from P-MOR-25 containing
different P-loading, at a potential window of 0 mV to 1.8 mV and scan rate of 100 mV s-1
0
10
20
30
40
50
60
70
80
I P/µ
A

105
Fig. 4. 21 Comparison of SWVs of carbon paste electrodes prepared from P-MOR-25
containing different P-loading, in the presence of 10 mM NO2- in 0.1 M KCl
4.5.2 Influence of the proportion of phosphate mordenite in the carbon paste
Having established that 0.75-MCPE-25 was the best composite containing 0.75
wt.% phosphorous loading on mordenite with 25 Si/Al molar ratio. We then investigated
the percentage composition of the 0.75-P-MOR-25 in the carbon paste. By varying the
phosphate mordenite percentage from 0 to 20 % five different composite electrodes were
produced which are summarized in the Table 4. 4

106
Table. 4. 4 Electrodes composition
Paraffin oil Graphite 0.75-P-MOR-25 Composition Name
30 70 0 Bare CPE P
30 65 5 5-0.75-P-MOR-25-
CPE
Q
30 60 10 10-0.75-P-MOR-25-
CPE
R
30 55 15 15-0.75-P-MOR-25-
CPE
S
30 50 20 20-0.75-P-MOR-25-
CPE
T
Fig. 4.22 and Fig. 23 show square wave voltammograms and the blanks of the P,
Q, R, S and T carbon paste electrodes. The characteristic oxidation peak current of 10
mM NO2- in phosphate buffer pH 7, increase steadily with 0.75P-MOR-15 until it
reached 15 % (i.e. composite electrode S) and then sharply drop at 20 % (i.e. composite
electrode T). The current density obtained from square wave voltammograms for the bare
carbon paste (i.e. P) and the Composite electrode S are 51.7× 10⁵
μA/cm2 and 9.5 × 10
5
μA/cm2, respectively. Even R showed higher current than P (which is the bare carbon
paste). The superiority can also be attributed to the adsorption of the nitrite ions to its
micropores and the newly generated mesopores leading to an optimum electrode surface
coverage. However, at the highest proportion of 20 % the surface coverage exceeded it
optimum and electron transfer reaction are retarded due to surface saturation [23].

107
Fig. 4. 22 Comparison of SWVs of different carbon paste electrodes, in presence of 5
mM NO2- in phosphate buffer at pH 7. Inset is the relationship of peak current vs % 0.75-
P-MOR

108
Fig. 4. 23 Comparison of blanks SWVs of different carbon paste electrodes (P, Q, R, S
and T)

109
4.5.3 Comparison with bare carbon paste using CV
Fig. 4.24 shows the compared CVs of the bare carbon paste and the phosphate
mordenite carbon paste composite. The electrocatalytic behavior of the best composite S
was compared to that of the bare in 5 mM NO2- in phosphate buffer pH 7 using cyclic
voltammetry. The composite electrode S depicted a clear irreversible oxidation waveform
much higher than that for the bare carbon paste at exactly E1/2 = 1000 mV. At this
potential oxidation of nitrite was known to occur as demonstrated elsewhere [129, 152,
153]. The irreversibility of the process is obvious by the absence of any reverse peak.
Broder et al [153] reported that oxidation of nitrite in all media proceeds based on
equation 4.1
NO2- → NO2 + e
- Eqn. 4. 1
Presence of water traces favors the nitrite oxidation irreversibly. The nitrite
oxidation is a two-electron process. Owing to the fact that water is present in the
electrolytic solution used for nitrite detection, in this case, direct oxidation nitrite to
nitrate was irreversibly accomplished in one step process. Thus, the following mechanism
holds, based on the phosphate interaction with the mordenite framework see scheme 4.2
Scheme 4. 2 Mechanism of Nitrite Oxidation
+ NO3
-
+ 2H+
+ 2e-
NO2
-
H2O

110
Fig. 4. 24 CV of 15-0.75P-MCPE in the presence of 5 mM NO2- in 0.1 M phosphate
buffer pH 7 at 100 mV s-1
scan rate

111
4.5.4 Effect of scan rate
Fig. 4.25 depicts the CVs of the variation of peak current with scan rate potential
at the S electrode in 5 mM NO2- solution in 0.1 M phosphate buffer pH 7. The inset plot
of the peak current versus square root of scan rate showed a linearity with regression
coefficient of R2 0.9696 demonstrating that the oxidation of nitrate on the phosphate
mordenite carbon paste composite electrode is under diffusion limitation within scan rate
range of 10-500 mV s-1
. Thus, NO2- ions are brought to the surface of the electrode by
mass transport.
It was reported elsewhere that in process govern by mass transport, the total
electrode surface coverage affects the limitation of the current [23] and that current
increase with increased surface coverage. Thus the oxidative peak current Ip, for the
nitrite ions adsorbed is express as.
𝑰𝒑 =𝒏𝟐𝑭𝟐𝑨 Г∗𝒗
𝟒𝑹𝑻 Eqn. 4. 2
Where A is the electrode surface area (7.85 x 10⁻⁵
cm2) calculated from A = πr
2, n is the
number of electrons involved in the reaction (2 electron in this case), Ip is the peak
current, F is the faraday constant 96500 C, R is the molar gas constant, v is the scan rate
and total surface coverage (Γ*) is then calculated to be 8.96 × 10
-4 mol/cm
2. Taking the
nitrite ions to be spherical and electrode surface to be smoothly homogeneous we can
obtain the total electrode surface coverage by plotting the peak current Ip against the scan
rate v. Fig. 4.26 show the variation of peak current with the scan rate. A strong linear
dependence of the scan rate with current is observed with R2
value of 0998

112
Fig. 4. 25 CVs of the variation of peak current with scan rate potential at the electrode S
in 5 mM NO2- solution in 0.1 M phosphate buffer pH 7. Inset is the plot of peak current
vs square root of scan rate

113
Fig. 4. 26 Plot of peak current vs scan rate
y = 0.2644x + 20.542
R² = 0.998
0
20
40
60
80
100
120
140
160
180
0 100 200 300 400 500 600
I p/μ
A
Scan rate (v) mV s-1

114
4.5.5 Effect of buffer as electrolyte solution
Having known that the composition and pH of the electrolytic medium affects the
performance of electrode surfaces in electrochemical studies [154]. We investigated the
effect of different buffer solutions by recording the square wave voltammograms of 5
mM NO2- in 0.1 M solutions at pH 7 each of Acetate buffer, phosphate buffer and
sulphate buffer shown in Figure 4.27. However, the phosphate buffer favored the
oxidation of nitrite as the highest response was produced in the phosphate buffer. Not
only is the current enhanced but also the best shape of the peak is obtained in the
phosphate buffer. Phosphate buffer had a good record in oxidation of nitrite [129, 152,
155]. The superiority of phosphate buffer is clearly depicted in a chart in figure 4.28
Moreover, in phosphate buffer the size of the phosphate ion is sterically hindered
from the positive ion of the protonated phosphate surface of the zeolite, and the cationic
sodium ions are selectively repelled. While in the other electrolytic solution especially in
the sulphate buffer the anionic sulphate ion is a strong base that can easily block the
mechanistic pathway towards nitrite oxidation. The acetate ion is though bulky but a
strong nucleophile and can also competes with nitrite, leading to the broadness and
shorter oxidation peak.

115
Fig. 4. 27 SWV of electrode S in the presence of 5 mM NO2- in different buffer solutions
(a) 0.1 M Phosphate buffer pH7 (b) 0.1 M Acetate buffer (e) 0.1 M sulphate buffer pH 7
(a)
(b)
(c)

116
Fig. 4. 28 Dependence of peak current on buffer solution for nitrite detection (data
collected from SWV of 5 Mm NO2- in 0.1 M solution of each of the buffers at pH 7)
0
5
10
15
20
25
Acetate buffer Phosphate
buffer
Sulphate buffer
I P/µ
A
pH
7
pH
7
pH
7

117
4.5.6 pH dependence of the electrocatalytic oxidation of nitrite
The electrochemical behavior of nitrite ion has been reported to be pH sensitive
[155]. The effect of pH was studied by recording the cyclic voltammograms of 5 mM
NO2- ion in phosphate buffer at different pH. As it can be seen in Fig. 4.29 the oxidation
of nitrate is pH sensitive. The oxidation peak current increase progressively with the pH
until it reaches a maxima at pH 7, the current suddenly drop at pH 8. The weaker
oxidation current of nitrite at lower pH was due to nitrite ion protonation to nitrous acid
or subsequent formation of nitric oxide free radical [155]. At higher pH (˃3) the current
enhancement was attributed to the basicity of the sodium ions that on repulsion from the
positive phosphate charge on the mordenite direct the nitrite ion to the electrode surface
thereby facilitating the mas transport.
Fig. 4. 29 CV of electrode S in the presence of 5 mM NO2
- in phosphate buffer at
different pH (a) 7, (b) 8, (c) 6, (d) 5, (e) 4 and (f) 3.

118
4.5.7 Calibration for nitrite oxidation
Having most parameters for nitrite oxidation optimized, it is valuable to test the
analytical applicability of the phosphate mordenite carbon paste electrode (electrode S).
To achieve this, square wave voltammograms of the electrode in different concentrations
of nitrite were recorded in 0.1 M phosphate buffer pH 7 were registered. The nitrite
oxidation current exhibits excellent linear dependence on nitrite concentration in the
range of 1 × 10⁻⁵
M to 2.5 × 10⁻⁴
M with correlation coefficient of R2 ≈ 1. Such a linear
relationship in wider dynamic range has never been reported using SWV or CV. It is
higher that filed previously using platinum micro rotating electrode [152] with much
higher current and that documented in [138] using CV. Equation 4 gives the equation of
the regression. The voltammograms and the calibration curve are depicted in Fig.4.30
Ip (µA) = 0.0142[NO2-] + 0.0313 Eqn. 4. 3
The stability of the electrode was studied by recording 5 different cycles using
cyclic voltammograms in 5 Mm NO2-. It was found the current is dropping slightly with
number of cycles given a relative standard deviation of 3.3%.

119
Fig. 4. 30 SWV showing dependence of the peak current on NO2
- ion concentration. Inset
is the relationship of peak current with concentration

120
4.6 Conclusion
Phosphate has been successfully imparted on mordenite framework. NMR and
FT-iR have evinced the formation of aluminum phosphate interface on the mordenite.
The continuous dealumination of the mordenite with increasing phosphoric acid
concentration was notably observed by the EDX. The FE-SEM images show that crystal
size increase with increasing gel Na/Si ratio. The cationic phosphate surface SiOAl–
(POH)4+
was the sole agent for the catalytic oxidation of nitrite and framework Si/Al ratio
in phosphate mordenite has great effect on nitrite detection. Phosphate buffer was the best
buffer pH is the best electrolytic condition for nitrite oxidation. The calibration plot for
nitrite oxidation at the electrode 15-0.75-P-MCPE-25 (i.e. S composite) showed an
excellent linearity. The reproducibility of the electrode was determined by computing the
RSD, which was found to be 3.3 %.

121
Chapter Five
5.1 Conclusions
The effective gel composition for Organic Structure Directing Agent (OSDA) free
hydrothermal crystallization of pure mordenite with Si/Al molar ratio of 15, 20 and 25
was established. Purity of the crystals depends greatly on the alkalinity ratio.
Synthesizing with different Si/Al ratios depends on the Na/Si ratios correspondingly. Size
and morphology of the crystal also rely on silica source, Na/Si ratio, crystallization
temperature and time. Phosphate was successfully imparted on mordenite via post
synthesis impregnation. Different phosphate mordenite carbon paste electrodes were
prepared. In catalytic amount phosphate mordenite enhanced the electrochemical
oxidation of thiocyanate to cyanate. The pH has a significant effect on the activity of
electrode. Framework Si/Al ratios of phosphate mordenite and p-loading on mordenite
with different Si/Al ratio have affected the current intensity in nitrite oxidation. A more
hydrophobic phosphate mordenite of Si/Al of 25 showed superior activity in nitrite
detection. A strong linearity was obtained in the calibrations of composite electrode 15-
0.75-P-MCPE-25 (i.e. S composite) in thiocyanate and nitrite stock solutions with R2
values of 0.998 and 0.9999, respectively.
5.2 Recommendations
The mordenite used in this research is in micro meter size, its surface area would
have been better if the nano sized is used which in turn would provide more
electrocatalytic activity. Although it is very challenging, as we experienced, we
recommend that more effort is required to investigate the exact gel condition and
synthesis parameters that could give nanomordenite. The exact composition of the carbon

122
paste electrode containing mordenite can be further investigated as the content of the oil
binder was unaltered in this work. Glassy carbon electrode and platinum electrode can be
used as the working electrode after casting the composite materials onto their surfaces.
Their performances can then be compared with different carbon paste electrodes based on
phosphate zeolites

123
References
1. Weitkamp, J., Zeolites and catalysis. Solid State Ionics, 2000. 131(1–2): p. 175-
188.
2. Rhodes, C.J., Zeolites: physical aspects and environmental applications. Annual
Reports Section "C" (Physical Chemistry), 2007. 103(0): p. 287-325.
3. Busca, G., Chapter 7 - Zeolites and Other Structurally Microporous Solids as
Acid–Base Materials, in Heterogeneous Catalytic Materials, G. Busca, Editor.
2014, Elsevier: Amsterdam. p. 197-249.
4. Hoelderich, W.F. and D. Heinz, Research and development of zeolite catalysis in
the 80ties and in the 90ties as well as forthcoming trends. Research on Chemical
Intermediates, 1998. 24(3): p. 337-348.
5. Lukyanov, D.B., et al., Insights into Brønsted Acid Sites in the Zeolite Mordenite.
The Journal of Physical Chemistry C, 2014. 118(41): p. 23918-23929.
6. Xu, X., J. Wang, and Y. Long, Zeolite-based materials for gas sensors. Sensors,
2006. 6(12): p. 1751-1764.
7. Tago, T. and T. Masuda, Zeolite nanocrystals-synthesis and applications. 2010:
INTECH Open Access Publisher.
8. Chen, N.Y., Hydrophobic properties of zeolites. The Journal of Physical
Chemistry, 1976. 80(1): p. 60-64.
9. F., D., A New Method for Characterization of Natural Zeolites and Organic
Nanostructure Using Atomic Force Microscopy. Nanomaterials 2(1), 79-91, 2012.
2(1): p. 79-91.

124
10. Vjunov, A., et al., Quantitatively Probing the Al Distribution in Zeolites. Journal
of the American Chemical Society, 2014. 136(23): p. 8296-8306.
11. Vjunov, A., et al., Impact of Aqueous Medium on Zeolite Framework Integrity.
Chemistry of Materials, 2015.
12. Chumbhale, V.R., Characterization of Aluminosilicates (Zeolites) by Laboratory
Screening Tests for Selective Synthesis of Value Added Products: Case Studies.
Research Journal of Chemical Sciences, 2013. 3(8): p. 10-17.
13. Busca, G., Chapter 1 - Heterogeneous Catalysts, in Heterogeneous Catalytic
Materials, G. Busca, Editor. 2014, Elsevier: Amsterdam. p. 1-7.
14. Larsen, S.C., Nanocrystalline Zeolites and Zeolite Structures: Synthesis,
Characterization, and Applications. The Journal of Physical Chemistry C, 2007.
111(50): p. 18464-18474.
15. Chen, B., et al., Zeolitic imidazolate framework materials: recent progress in
synthesis and applications. Journal of Materials Chemistry A, 2014. 2(40): p.
16811-16831.
16. Xu, L., et al., Bifunctional Tandem Catalysis on Multilamellar Organic–Inorganic
Hybrid Zeolites. ACS Catalysis, 2014. 4(9): p. 2959-2968.
17. Ledesma, C., et al., Recent Approaches in Mechanistic and Kinetic Studies of
Catalytic Reactions Using SSITKA Technique. ACS Catalysis, 2014. 4(12): p.
4527-4547.
18. Bakker, E. and Y. Qin, Electrochemical Sensors. Analytical Chemistry, 2006.
78(12): p. 3965-3984.

125
19. Wu, Q., et al., Sustainable Synthesis of Zeolites without Addition of Both
Organotemplates and Solvents. Journal of the American Chemical Society, 2014.
136(10): p. 4019-4025.
20. Ren, L., et al., Solvent-Free Synthesis of Zeolites from Solid Raw Materials.
Journal of the American Chemical Society, 2012. 134(37): p. 15173-15176.
21. Bontempelli, G. and R. Toniolo, MEASUREMENT METHODS | Electrochemical:
Linear Sweep and Cyclic Voltammetry, in Encyclopedia of Electrochemical
Power Sources, J. Garche, Editor. 2009, Elsevier: Amsterdam. p. 643-654.
22. Cambridge, U.o., Linear Sweep and Cyclic Voltametry: The Principles.
Department of Chemical Engineering and Biotechnology, 2014.
23. Prodromidis, M.I., et al., The importance of surface coverage in the
electrochemical study of chemically modified electrodes. Electroanalysis, 2000.
12(18): p. 1498-1501.
24. Elqudaby, H., et al., Validated voltammetric method for the determination of some
antiprotozoa drugs based on the reduction at an activated glassy carbon
electrode. Arabian Journal of Chemistry, 2013. 6(3): p. 327-333.
25. Osteryoung, J.G. and R.A. Osteryoung, Square wave voltammetry. Analytical
Chemistry, 1985. 57(1): p. 101A-110A.
26. Hincapie, B.O., et al., Synthesis of mordenite nanocrystals. Microporous and
Mesoporous Materials, 2004. 67(1): p. 19-26.
27. Lu, B., et al., Direct synthesis of high-silica mordenite using seed crystals.
Microporous and mesoporous materials, 2004. 76(1): p. 1-7.

126
28. Al-Shammari, A.A., et al., Catalytic cracking of heavy naphtha-range
hydrocarbons over different zeolites structures. Fuel Processing Technology,
2014. 122: p. 12-22.
29. Zhao, G.-L., et al., Catalytic cracking reactions of C 4-olefin over zeolites H-
ZSM-5, H-mordenite and H-SAPO-34. Studies in Surface Science and Catalysis,
2007. 170: p. 1307-1312.
30. Mohamed, M.M., et al., Synthesis of high silica mordenite nanocrystals using o-
phenylenediamine template. Microporous and mesoporous materials, 2005. 84(1):
p. 84-96.
31. Chumbhale, V., A. Chandwadkar, and B. Rao, Characterization of siliceous
mordenite obtained by direct synthesis or by dealumination. Zeolites, 1992. 12(1):
p. 63-69.
32. Lv, A., et al., Hydrothermal synthesis of high-silica mordenite by dual-templating
method. Microporous and Mesoporous Materials, 2011. 145(1): p. 80-86.
33. Aguado, J., et al., Catalytic cracking of polyethylene over zeolite mordenite with
enhanced textural properties. Journal of Analytical and Applied Pyrolysis, 2009.
85(1): p. 352-358.
34. Wang, J., et al., High-silica MOR type zeolite self-transformed from dry
aluminosilicate gel in OSAs-free and fluoride-free reactant system. Microporous
and Mesoporous Materials, 2006. 96(1–3): p. 307-313.
35. Patwardhan, S., Zeolites: Synthesis, Characterization and Applications. Academic
Press, Boston, 2001.

127
36. Al-Shammari, A.A., et al., Catalytic cracking of heavy naphtha-range
hydrocarbons over different zeolites structures. Fuel Processing Technology,
2014. 122(0): p. 12-22.
37. Zhao, G.L., et al., Catalytic cracking reactions of C4-olefin over zeolites H-ZSM-
5, H-mordenite and H-SAPO-34, in Studies in Surface Science and Catalysis,
Z.G.J.C. Ruren Xu and Y. Wenfu, Editors. 2007, Elsevier. p. 1307-1312.
38. Chumbhale, V.R., A.J. Chandwadkar, and B.S. Rao, Characterization of siliceous
mordenite obtained by direct synthesis or by dealumination. Zeolites, 1992. 12(1):
p. 63-69.
39. Shao, C., et al., Synthesis of high-silica-content mordenite with different
SiO2/Al2O3 ratios by using benzene-1,2-diol as additives. Materials Letters,
2002. 56(1–2): p. 24-29.
40. Jongkind, H., et al., Synthesis and characterisation of zeolites using saturated
cyclic amines as structure-directing agents. Microporous Materials, 1997. 10(4–
6): p. 149-161.
41. Aguado, J., et al., Catalytic cracking of polyethylene over zeolite mordenite with
enhanced textural properties. Journal of Analytical and Applied Pyrolysis, 2009.
85(1-2): p. 352-358.
42. Jyoti Bhadauria, B.K.S., Avinash Tomar and Radha Tomar, Synthesis and
characterization of analogue of mordenite and its role as a catalyst for Friedel-
Crafts acylation of anisole. Journal of Chemical and Pharmaceutical Research
2011. 3(2): p. 245-257

128
43. Aly, H.M., M.E. Moustafa, and E.A. Abdelrahman, Synthesis of mordenite zeolite
in absence of organic template. Advanced Powder Technology, 2012. 23(6): p.
757-760.
44. Zhang, L., et al., Crystallization and morphology of mordenite zeolite influenced
by various parameters in organic-free synthesis. Materials Research Bulletin,
2011. 46(6): p. 894-900.
45. Zhang, L., et al., Synthesis of large mordenite crystals with different aspect ratios.
Microporous and Mesoporous Materials, 2009. 126(1–2): p. 115-124.
46. Moreno-Piraján, J., V. Garcia-Cuello, and L. Giraldo, Synthesis of HMOR and
HZSM-5 and their Behaviour in the Catalytic Conversion of Methanol to
Propylene (MTP). J Thermodyn Catal 1: 101. doi: 10.4172/2157-7544.1000101.
2010, OMICS Publishing Group J Thermodyn Catal ISSN.
47. Mignoni, M.L., et al., Synthesis of mordenite using kaolin as Si and Al source.
Applied Clay Science, 2008. 41(1–2): p. 99-104.
48. Chen, N., T.F. Degnan Jr, and C.M. Smith, Molecular transport and reaction in
zeolites: design and application of shape selective catalysis. 1994: John Wiley &
Sons.
49. Dykeman, R.R., et al., Cover Picture: Rational Design of a Molecular
Nanocatalyst-Stabilizer that Enhances both Catalytic Activity and Nanoparticle
Stability (ChemCatChem 12/2012). ChemCatChem, 2012. 4(12): p. 1865-1865.
50. Blasco, T., A. Corma, and J. Martínez-Triguero, Hydrothermal stabilization of
ZSM-5 catalytic-cracking additives by phosphorus addition. Journal of Catalysis,
2006. 237(2): p. 267-277.

129
51. Panneerselvam, P., et al., Phosphoric acid modified-Y zeolites: A novel, efficient
and versatile ion exchanger. Journal of Hazardous Materials, 2008. 159(2–3): p.
427-434.
52. Zaiku Xie , Z.L., Yangdong Wang, Qihua Yang, Longya Xu and Weiping Ding
An Overview of Recent Development in Composite Catalysts from Porous
Materials for Various Reactions and Processes Int. J. Mol. Sci., 2010. 11(5): p.
2152-2187.
53. Huang, Y., et al., Density Functional Theory study of the structural and electronic
properties of H 3 PO 4/ZSM-5. RSC Advances, 2014. 4(28): p. 14573-14581.
54. Kaeding, W.W. and S.A. Butter, Production of chemicals from methanol: I. Low
molecular weight olefins. Journal of Catalysis, 1980. 61(1): p. 155-164.
55. Coudurier, G., C. Naccache, and J.C. Vedrine, J. Chem. Soc., Chem. Commun.,
1982: p. 1413.
56. Lercher, J. and G. Rumplmayr, Controlled decrease of acid strength by
orthophosphoric acid on ZSM5. Applied catalysis, 1986. 25(1): p. 215-222.
57. Blasco, T., A. Corma, and J. Martineztriguero, Hydrothermal stabilization of
ZSM-5 catalytic-cracking additives by phosphorus addition. Journal of Catalysis,
2006. 237(2): p. 267-277.
58. Caro, J., et al., NMR and IR studies of zeolite H-ZSM-5 modified with
orthophosphoric acid. Journal of Catalysis, 1990. 124(2): p. 367-375.
59. Giudici, R., H.W. Kouwenhoven, and R. Prins, Comparison of nitric and oxalic
acid in the dealumination of mordenite. Applied Catalysis A: General, 2000.
203(1): p. 101-110.

130
60. Zhuang, J., et al., Solid-state MAS NMR studies on the hydrothermal stability of
the zeolite catalysts for residual oil selective catalytic cracking. Journal of
Catalysis, 2004. 228(1): p. 234-242.
61. van der Bij, H.E., et al., Phosphatation of Zeolite H-ZSM-5: A Combined
Microscopy and Spectroscopy Study. ChemPhysChem, 2014. 15(2): p. 283-292.
62. van Donk, S., et al. Probing the micropore accessibility in mordenite crystals
using diffusion and coking studies. in NAM-18. 2003.
63. Corma, A., J. Mengual, and P.J. Miguel, Stabilization of ZSM-5 zeolite catalysts
for steam catalytic cracking of naphtha for production of propene and ethene.
Applied Catalysis A: General, 2012. 421–422(0): p. 121-134.
64. Li, J., et al., Catalytic Cracking of Butene to Propylene over Modified HZSM-5
Zeolites.
65. van der Bij, H.E., et al., Hexane Cracking over Steamed Phosphated Zeolite H-
ZSM-5: Promotional Effect on Catalyst Performance and Stability. Chemistry – A
European Journal, 2014. 20(51): p. 16922-16932.
66. Dyballa, M., et al., Effect of Phosphate Modification on the Brønsted Acidity and
Methanol-to-Olefin Conversion Activity of Zeolite ZSM-5. Chemie Ingenieur
Technik, 2013. 85(11): p. 1719-1725.
67. Corma, A., J. Mengual, and P.J. Miguel, Stabilization of ZSM-5 zeolite catalysts
for steam catalytic cracking of naphtha for production of propene and ethene.
Applied Catalysis A: General, 2012. 421-422: p. 121-134.
68. Liu, J., et al., Methanol to propylene: Effect of phosphorus on a high silica
HZSM-5 catalyst. Catalysis Communications, 2009. 10(11): p. 1506-1509.

131
69. Li, P., et al., Conversion of Methanol to Hydrocarbons over Phosphorus-modified
ZSM-5/ZSM-11 Intergrowth Zeolites. Catalysis Letters, 2009. 134(1-2): p. 124-
130.
70. Zhao, G., et al., Effect of phosphorus on HZSM-5 catalyst for C4-olefin cracking
reactions to produce propylene. Journal of Catalysis, 2007. 248(1): p. 29-37.
71. Z. Nawaz, X.T.a.F.W., Hexene Catalytic Cracking Over 30% Sapo-34 Catalyst
For Propylene Maximization: Influence Of Reaction Conditions And Reaction
Pathway Exploration Brazilian Journal of Chemical Engineering 2009. vol. 26
N0. 04: p. pp. 705 - 712.
72. Wang, X., et al., Phosphorus modified HMCM-22: Characterization and catalytic
application in methanol-to-hydrocarbons conversion. Microporous and
Mesoporous Materials, 2012. 151(0): p. 99-106.
73. Jiang, G., et al., Highly effective P-modified HZSM-5 catalyst for the cracking of
C4 alkanes to produce light olefins. Applied Catalysis A: General, 2008. 340(2):
p. 176-182.
74. Butter, W.W.K.a.s.A., Production of Chemicals from Methanol. Journal of
Catalysis, 1980. 61: p. 155-164.
75. Jacques c. Vẽdrine, A.A., Pierre Dejaifve, Valentin Ducarme, and a.S.Z. Hanna
Hoser, Catalytic and Physical Properties of Phosphorus-Modified ZSM-5 Zeolite.
Journal of Catalysis, 1982. 73: p. 147-160.
76. Xue, N., et al., Synergistic effects of tungsten and phosphorus on catalytic
cracking of butene to propene over HZSM-5. Applied Catalysis A: General, 2009.
352(1-2): p. 87-94.

132
77. Xue, N., et al., Understanding the enhancement of catalytic performance for
olefin cracking: Hydrothermally stable acids in P/HZSM-5. Journal of Catalysis,
2007. 248(1): p. 20-28.
78. Wang, X., et al., Phosphorus modified HMCM-22: Characterization and catalytic
application in methanol-to-hydrocarbons conversion. Microporous and
Mesoporous Materials, 2012. 151: p. 99-106.
79. Z. Nawaz*, X.T.a.F.W., Hexene catalytic cracking over 30% SAPO-34 Catalyst
for Propylrnr maximization: influence of Reaction conditions and Reaction
Pathway exploration. Brazilian Jouranal of Chemical Engineering, October-
December, 2009. 26, 4: p. 702-712.
80. Jianwen Li, H.M., Haitao Zhang, Qiwen Sun, Weiyong Ying, Catalytic Cracking
of Butene to Propylene over Modified HZSM-5 Zeolites. International Journal of
Chemical, Nuclear, Metallurgical and Materials Engineering, 2014. 8: p. 604-608.
81. Lee, J., et al., Catalytic cracking of C5 raffinate to light olefins over lanthanum-
containing phosphorous-modified porous ZSM-5: Effect of lanthanum content.
Fuel Processing Technology, 2013. 109(0): p. 189-195.
82. Epelde, E., et al., Modified HZSM-5 zeolites for intensifying propylene production
in the transformation of 1-butene. Chemical Engineering Journal, 2014. 251(0): p.
80-91.
83. Zeng, P., et al., Preparation of phosphorus-modified PITQ-13 catalysts and their
performance in 1-butene catalytic cracking. Journal of Energy Chemistry, 2014.
23(2): p. 193-200.

133
84. Walcarius, A., T. Barbaise, and J. Bessiere, Factors affecting the analytical
applications of zeolite-modified electrodes preconcentration of electroactive
species. Analytica Chimica Acta, 1997. 340(1–3): p. 61-76.
85. Walcarius, A., Zeolite-modified electrodes in electroanalytical chemistry.
Analytica Chimica Acta, 1999. 384(1): p. 1-16.
86. Nezamzadeh-Ejhieh, A. and Z. Nematollahi, Surfactant modified zeolite carbon
paste electrode (SMZ-CPE) as a nitrate selective electrode. Electrochimica Acta,
2011. 56(24): p. 8334-8341.
87. Shaw, B.R. and K.E. Creasy, Carbon composite electrodes containing alumina,
layered double hydroxides, and zeolites. Journal of Electroanalytical Chemistry
and Interfacial Electrochemistry, 1988. 243(1): p. 209-217.
88. Ardakani, M.M., et al., Accumulation and voltammetric determination of cobalt at
zeolite-modified electrodes. Journal of Analytical Chemistry, 2008. 63(2): p. 184-
191.
89. Ardakani, M.M., et al., Accumulation and voltammetric determination of cobalt at
zeolite-modified electrodes. Journal of Analytical Chemistry, 2008. 63(2): p. 184-
191.
90. Arvand, M., et al., Electrochemical study of methylene blue incorporated into
mordenite type zeolite and its application for amperometric determination of
ascorbic acid in real samples. Analytica Chimica Acta, 2003. 491(2): p. 193-201.
91. Samadi-Maybodi, A., et al., Application of nickel phosphate nanoparticles and
VSB-5 in the modification of carbon paste electrode for electrocatalytic oxidation
of methanol. Journal of Solid State Electrochemistry, 2013. 17(7): p. 2043-2048.

134
92. Nezamzadeh, A., M.K. Amini, and H. Faghihian, Square-wave voltammetric
determination of ascorbic acid based on its electrocatalytic oxidation at zeolite-
modified carbon-paste electrodes. Int j Electrochem Sci, 2007. 2: p. 583-594.
93. Senthilkumar, S. and R. Saraswathi, Electrochemical sensing of cadmium and
lead ions at zeolite-modified electrodes: Optimization and field measurements.
Sensors and Actuators B: Chemical, 2009. 141(1): p. 65-75.
94. Hassaninejad-Darzi, S.K. and M. Rahimnejad, Electrocatalytic oxidation of
methanol by ZSM-5 nanozeolite-modified carbon paste electrode in alkaline
medium. Journal of the Iranian Chemical Society: p. 1-10.
95. Manea, F., et al., Simultaneous electrochemical determination of nitrate and
nitrite in aqueous solution using Ag-doped zeolite-expanded graphite-epoxy
electrode. Talanta, 2010. 83(1): p. 66-71.
96. Ojani, R., et al., Electrochemical behavior of Ni (II) incorporated in zeolite Y-
modified carbon electrode: application for electrocatalytic oxidation of methanol
in alkaline solution. Journal of Solid State Electrochemistry, 2011. 15(9): p. 1935-
1941.
97. Cundy, C.S. and P.A. Cox, The hydrothermal synthesis of zeolites: Precursors,
intermediates and reaction mechanism. Microporous and Mesoporous Materials,
2005. 82(1–2): p. 1-78.
98. Sharma, P., P. Rajaram, and R. Tomar, Synthesis and morphological studies of
nanocrystalline MOR type zeolite material. Journal of Colloid and Interface
Science, 2008. 325(2): p. 547-557.

135
99. Sano, T., et al., Synthesis of large mordenite crystals in the presence of aliphatic
alcohol. Microporous and Mesoporous Materials, 2001. 46(1): p. 67-74.
100. Li, X., R. Prins, and J.A. van Bokhoven, Synthesis and characterization of
mesoporous mordenite. Journal of Catalysis, 2009. 262(2): p. 257-265.
101. Fernandes, L.D., et al., Ethylbenzene hydroisomerization over bifunctional zeolite
based catalysts: The influence of framework and extraframework composition and
zeolite structure. Journal of Catalysis, 1998. 177(2): p. 363-377.
102. Sanhoob, M., et al., Synthesis of ZSM-12 (MTW) with different Al-source:
Towards understanding the effects of crystallization parameters. Microporous and
Mesoporous Materials, 2014. 194(0): p. 31-37.
103. Ahmed, M.H.M., O. Muraza, and A.M. Al Amer, Effect of synthesis parameters
and ion exchange on crystallinity and morphology of EU-1 zeolite. Journal of
Alloys and Compounds, 2014. 617(0): p. 408-412.
104. Seronu, U., H. Munarn, and M. KoIzuMI, Crystallization of mordenite from
aqueous solutions.
105. Ma, Y., et al., Large-pore mesoporous silica spheres: synthesis and application in
HPLC. Colloids and Surfaces A: Physicochemical and Engineering Aspects,
2003. 229(1): p. 1-8.
106. Wang, J., et al., Microporous Mesoporous Mater., 2009. 117: p. 561.
107. Mao, Y., et al., Morphology-controlled synthesis of large mordenite crystals. New
Journal of Chemistry, 2014.

136
108. Zhang, X., D. Tang, and G. Jiang, Synthesis of zeolite NaA at room temperature:
The effect of synthesis parameters on crystal size and its size distribution.
Advanced Powder Technology, 2013. 24(3): p. 689-696.
109. Ramsay, J.D.F. and S. Kallus, Zeolite Membranes, in Membrane Science and
Technology, N.K. Kanellopoulos, Editor. 2000, Elsevier. p. 373-395.
110. Simoncic, P. and T. Armbruster, Cationic methylene blue incorporated into
zeolite mordenite-Na: a single crystal X-ray study. Microporous and mesoporous
materials, 2005. 81(1): p. 87-95.
111. Meier, W.M., The Crystal Structure of Mordenite (ptilolite). Z. Kristallogr., 1961.
115: p. 439-450.
112. O. J. Whittemore JR., Synthesis of Siliceous Mordenite. American Minerologist,
1972. 57: p. 1146-1151.
113. Mohamed, M.M., A.K. Nohman, and M.I. Zaki, Development of catalytic
properties of mordenite zeolite via chemical modification. ChemInform, 2006.
37(38).
114. N. Y. Chen, T.F.D., Jr., C. Morris Smith., , Molecular Transport and Reaction in
Zeolites: Design and Application of Shape Selective Catalysis. Catalyst, wiley,
1994. 94.
115. Caeiro, G., et al., Stabilization effect of phosphorus on steamed H-MFI zeolites.
Applied Catalysis A: General, 2006. 314(2): p. 160-171.
116. Song, Z., et al., Phosphorus-modified ZSM-5 for conversion of ethanol to
propylene. Applied Catalysis A: General, 2010. 384(1–2): p. 201-205.

137
117. Takahashi, A., et al., Effects of added phosphorus on conversion of ethanol to
propylene over ZSM-5 catalysts. Applied Catalysis A: General, 2012. 423–424(0):
p. 162-167.
118. Walcarius, A., Zeolite-modified electrodes: Analytical applications and prospects.
Electroanalysis, 1996. 8(11): p. 971-986.
119. Ndlovu, T., et al., Reactivities of modified and unmodified exfoliated graphite
electrodes in selected redox systems. International Journal of Electrochemical
Science, 2012. 7(10): p. 9441-9453.
120. Gaoquan, S., et al., Electrochemical behavior of MOR zeolite in poly(ethylene
oxide) oligomer. Journal of Electroanalytical Chemistry, 1993. 344(1–2): p. 363-
366.
121. Nezamzadeh-Ejhieh, A. and A. Badri, Surfactant modified ZSM-5 zeolite as an
active component of membrane electrode towards thiocyanate. Desalination,
2011. 281(0): p. 248-256.
122. Ghiaci, M., B. Rezaei, and R.J. Kalbasi, High selective SiO2–Al2O3 mixed-oxide
modified carbon paste electrode for anodic stripping voltammetric determination
of Pb(II). Talanta, 2007. 73(1): p. 37-45.
123. Arvand, M., M. Vaziri, and M. Vejdani, Electrochemical study of atenolol at a
carbon paste electrode modified with mordenite type zeolite. Materials Science
and Engineering: C, 2010. 30(5): p. 709-714.
124. Dehbi, S., H. Massai, and A. Chtaini, Phosphate modified copper electrodes for
methanol fuel cell. Portugaliae Electrochimica Acta, 2010. 28(4): p. 241-252.

138
125. Chung, J. and J.L. Wood, Oxidation of thiocyanate to cyanide catalyzed by
hemoglobin. Journal of Biological Chemistry, 1971. 246(3): p. 555-560.
126. Mohammed Zidane, T.W., Elyas Sadeq Algabhbari, Mansor Ahmad, Kamyar
Shameli, Voltammetric oxidation of potassium thiocyanate using ErBa2Cu3O7
modified glassy carbon electrode. Int. J. Electrochem. Sci., 2013. 8: p. 4818-4826.
127. Badri, A. and P. Pouladsaz, Highly selective and sensitive thiocyanate PVC
membrane electrodes based on modified Zeolite ZSM-5. Int. J. Electrochem. Sci,
2011. 6: p. 3178-3195.
128. Donk, S.v., Adsorption, diffusion and reaction studies of hydrocarbons on zeolite
catalysts. 2002.
129. Marlinda, A., et al., Electrochemical sensing of nitrite using a glassy carbon
electrode modified with reduced functionalized graphene oxide decorated with
flower-like zinc oxide. Microchimica Acta, 2015. 182(5-6): p. 1113-1122.
130. van der Bij, H.E. and B.M. Weckhuysen, Local silico-aluminophosphate
interfaces within phosphated H-ZSM-5 zeolites. Physical Chemistry Chemical
Physics, 2014. 16(21): p. 9892-9903.
131. Wachter, A., Sodium Nitrite as Corrosion Inhibitor for Water. Industrial &
Engineering Chemistry, 1945. 37(8): p. 749-751.
132. Rahim, A., et al., Electrochemical Detection of Nitrite in Meat and Water
Samples Using a Mesoporous Carbon Ceramic SiO2/C Electrode Modified with
In Situ Generated Manganese(II) Phthalocyanine. Electroanalysis, 2014. 26(3): p.
541-547.

139
133. Fan, K. and J. Wu, Construction of a carbon paste electrode based on ionic liquid
for trace electrochemical detection of nitrite in food samples. Analytical Methods,
2013. 5(19): p. 5146-5153.
134. Ianoul, A., T. Coleman, and S.A. Asher, UV Resonance Raman Spectroscopic
Detection of Nitrate and Nitrite in Wastewater Treatment Processes. Analytical
Chemistry, 2002. 74(6): p. 1458-1461.
135. Siu, D.C. and A. Henshall, Ion chromatographic determination of nitrate and
nitrite in meat products. Journal of Chromatography A, 1998. 804(1–2): p. 157-
160.
136. Martínková, E., T. Křžek, and P. Coufal, Determination of nitrites and nitrates in
drinking water using capillary electrophoresis. Chemical Papers, 2014. 68(8): p.
1008-1014.
137. Nagababu, E. and J. Rifkind, Measurement of Plasma Nitrite by
Chemiluminescence, in Free Radicals and Antioxidant Protocols, R.M. Uppu, et
al., Editors. 2010, Humana Press. p. 41-49.
138. Cui, Y., et al., Electrochemical determination of nitrite using a gold
nanoparticles-modified glassy carbon electrode prepared by the seed-mediated
growth technique. Analytical Sciences, 2007. 23(12): p. 1421-1425.
139. Walcarius, A., et al., Amperometric Detection of Nonelectroactive Cations in
Electrolyte-Free Flow Systems at Zeolite Modified Electrodes. Electroanalysis,
1999. 11(6): p. 393-400.

140
140. Xiong, W. and M.D. Baker, Electrochemistry of Zeolites on Thickness Shear
Mode Oscillators. The Journal of Physical Chemistry B, 2005. 109(28): p. 13590-
13596.
141. Muresan, L.M., Zeolite-modified electrodes with analytical applications. Pure and
Applied Chemistry, 2010. 83(2): p. 325-343.
142. Senaratne, C., et al., Zeolite-modified electrodes: intra-versus extrazeolite
electron transfer. The Journal of Physical Chemistry, 1996. 100(14): p. 5849-
5862.
143. Zheng, Y., X. Li, and P.K. Dutta, Exploitation of Unique Properties of Zeolites in
the Development of Gas Sensors. Sensors (Basel, Switzerland), 2012. 12(4): p.
5170-5194.
144. Patwardhan, S., Sol-Gel Synthesis of Zeolites: Effect of Process Parameters.
145. Sol-Gel, Z., Chemistry of silicates and aluminosilicates. Ceramics− Silikáty,
2005. 49(4): p. 287-298.
146. Ahlers, C.B. and J.B. Talbot, Voltammetric behavior of zeolite-modified
electrodes fabricated by electrophoretic deposition. Electrochimica Acta, 2000.
45(20): p. 3379-3387.
147. van der Bij, H.E., et al., Aluminum-Phosphate Binder Formation in Zeolites as
Probed with X-ray Absorption Microscopy. Journal of the American Chemical
Society, 2014. 136(51): p. 17774-17787.
148. Li, G., FT-IR studies of zeolite materials: characterization and environmental
applications. 2005.

141
149. Boveri, M., et al., Steam and acid dealumination of mordenite: characterization
and influence on the catalytic performance in linear alkylbenzene synthesis.
Catalysis today, 2006. 114(2): p. 217-225.
150. Rebenstorf, B., T. Lindblad, and S.L.T. Andersson, Amorphous AIPO4 as catalyst
support 2. Characterization of amorphous aluminum phosphates. Journal of
Catalysis, 1991. 128(2): p. 293-302.
151. Peng, X.D., et al., Use of aluminum phosphate as the dehydration catalyst in
single step dimethyl ether process. 1998, Google Patents.
152. Bertotti, M. and D. Pletcher, A study of nitrite oxidation at platinum
microelectrodes. Journal of the Brazilian Chemical Society, 1997. 8(4): p. 391-
395.
153. Broder, T.L., et al., Electrochemical oxidation of nitrite and the oxidation and
reduction of NO2 in the room temperature ionic liquid [C2mim][NTf2]. The
Journal of Physical Chemistry B, 2007. 111(27): p. 7778-7785.
154. Vaughan-Jones, R.D., Regulation of chloride in quiescent sheep-heart Purkinje
fibres studied using intracellular chloride and pH-sensitive micro-electrodes. The
Journal of Physiology, 1979. 295(1): p. 111-137.
155. Kamyabi, M.A. and F. Aghajanloo, Electrocatalytic oxidation and determination
of nitrite on carbon paste electrode modified with oxovanadium (IV)-4-methyl
salophen. Journal of Electroanalytical Chemistry, 2008. 614(1): p. 157-165.

142
Vitae
Name: Adamu Aminu Idris
Nationality: Nigerian
Date of Birth: 10/20/1983
E-mail: [email protected]
Academic Background: B Tech Industrial Chemistry
Awards: Rapid Hospital and Educational Prize Limited and
Dean School of Science Prize, Abubakar Tafawa Balewa
University, Bauchi
Experience: Graduate Assistant @ Bayero University, Kano. 2012 –
Date
Conferences/symposium: 3rd
Saudi International Technology Conference,
KACST, Riyadh December, 2014
Saudi – Japan Symposium on “Catalyst in Refining and
Petrochemicals” KFUPM December, 2013


![2015 - eprints.kfupm.edu.saeprints.kfupm.edu.sa/139874/1/MSc_Thesis_Report_Yasin_Jemal_Yasin... · Full Name : [Yasin Jemal Yasin] Thesis Title : [GIS application and environmental](https://img.dokumen.tips/doc/110x75/5cabaee188c99320248cfa4e/2015-full-name-yasin-jemal-yasin-thesis-title-gis-application-and-environmental.jpg)


![(EW-492) -Flux Cored Arc Welding-Hobart Institute of Welding Technology[Yasser Tawfik]](https://img.dokumen.tips/doc/110x75/577c786f1a28abe054900583/ew-492-flux-cored-arc-welding-hobart-institute-of-welding-technologyyasser.jpg)


![[miles] immensely - in-Elis](https://img.dokumen.tips/doc/110x75/618ba435205f8e76a45a9550/miles-immensely-in-elis.jpg)