Embed Size (px)
Citation preview

III. Participant Data
2016 Actuarial Valuation Report 35

Overview of System MembershipThe state administers nine retirement systems for state and local public employees. Retirement system membership
is determined according to the participant’s occupation and employer. Employees covered by each system are defined in separate chapters of the Revised Code of Washington.
In addition to the six systems described below, the state also administers benefits for volunteer fire fighters and two small judicial systems, which are not included in this valuation. The volunteer fire fighters have a separate actuarial valuation. The judicial systems are closed to new members, and any judge hired after June 30, 1988, becomes a member of the Public Employees’ Retirement System Plans 2/3.
Beginning with the 2015 valuation period, OSA performed valuations for certain retirement provisions under Higher Education Retirement Plans. These plans are offered to certain employees of colleges and universities in Washington and are not administered by the Department of Retirement Systems. The results of these valuations are provided in separate reports.
PERS - Public Employees’ Retirement System Chapter 41.40 RCW
State employees; employees of all counties and most cities (some exceptions are Tacoma, Seattle, and Spokane); non-teaching employees of institutions of higher learning and community colleges; employees of ports, service districts, Energy Northwest, public utility districts, and judges first elected or appointed after June 30, 1988.
TRS - Teachers' Retirement System Chapter 41.32 RCW
Certificated teachers; administrators; and educational staff associates.
SERS - School Employees' Retirement System Chapter 41.35 RCW
Classified school district employees.
PSERS - Public Safety Employees' Retirement System Chapter 41.37 RCW
Correction officers (state, state community, county, city, and local community); state park rangers; enforcement officers with the Liquor Control Board, Washington State Patrol (commercial vehicle), Gambling Commission, and the Department of Natural Resources.
LEOFF - Law Enforcement Officers' and Fire Fighters' Retirement System Chapter 41.26 RCW
Fire fighters; emergency medical technicians; law enforcement officers including sheriffs; university, port, city police officers, and enforcement officers with the Department of Fish and Wildlife.
WSPRS - Washington State Patrol Retirement System Chapter 43.43 RCW
Commissioned officers of the Washington State Patrol.
2016 Actuarial Valuation Report
III. Participant Data
37
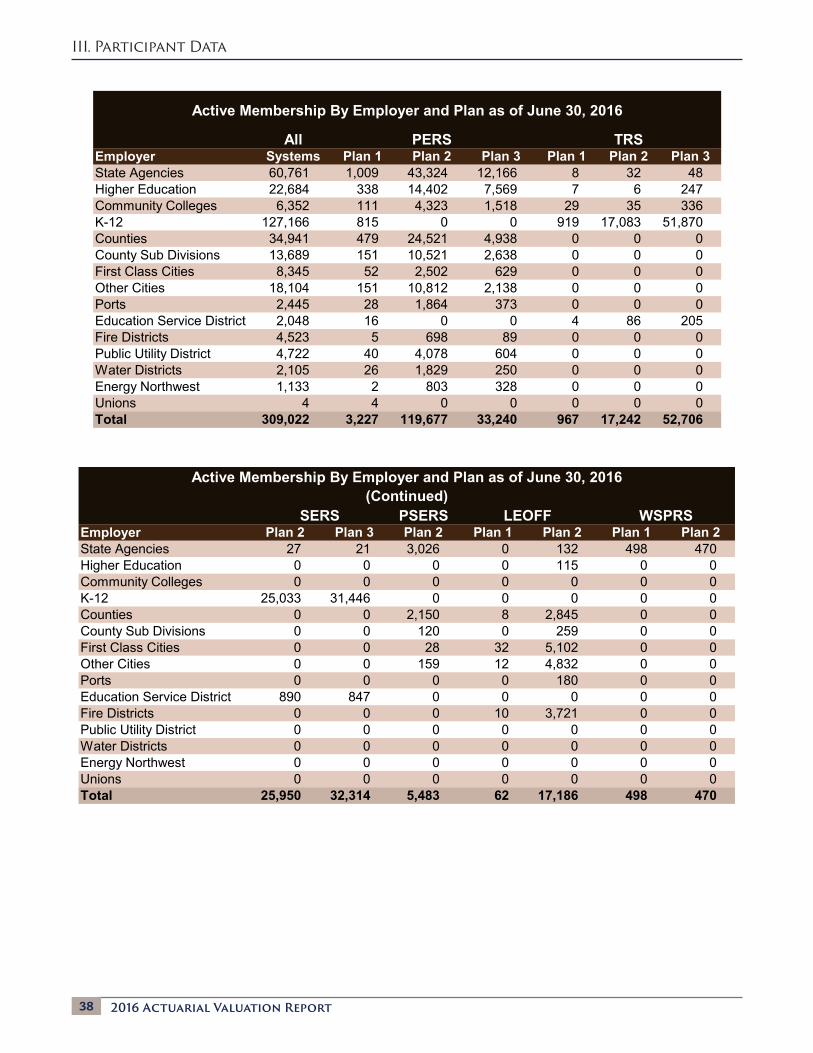
Active Membership By Employer and Plan as of June 30, 2016 Active Membership By Employer and Plan as of June 30, 2016 (Continued)
All PERS TRSEmployer Systems Plan 1 Plan 2 Plan 3 Plan 1 Plan 2 Plan 3State Agencies 60,761 1,009 43,324 12,166 8 32 48Higher Education 22,684 338 14,402 7,569 7 6 247Community Colleges 6,352 111 4,323 1,518 29 35 336K-12 127,166 815 0 0 919 17,083 51,870Counties 34,941 479 24,521 4,938 0 0 0County Sub Divisions 13,689 151 10,521 2,638 0 0 0First Class Cities 8,345 52 2,502 629 0 0 0Other Cities 18,104 151 10,812 2,138 0 0 0Ports 2,445 28 1,864 373 0 0 0Education Service District 2,048 16 0 0 4 86 205Fire Districts 4,523 5 698 89 0 0 0Public Utility District 4,722 40 4,078 604 0 0 0Water Districts 2,105 26 1,829 250 0 0 0Energy Northwest 1,133 2 803 328 0 0 0Unions 4 4 0 0 0 0 0Total 309,022 3,227 119,677 33,240 967 17,242 52,706
Active Membership By Employer and Plan as of June 30, 2016 (Continued) Reconciliation of Participant Data
SERS PSERS LEOFF WSPRSEmployer Plan 2 Plan 3 Plan 2 Plan 1 Plan 2 Plan 1 Plan 2State Agencies 27 21 3,026 0 132 498 470Higher Education 0 0 0 0 115 0 0Community Colleges 0 0 0 0 0 0 0K-12 25,033 31,446 0 0 0 0 0Counties 0 0 2,150 8 2,845 0 0County Sub Divisions 0 0 120 0 259 0 0First Class Cities 0 0 28 32 5,102 0 0Other Cities 0 0 159 12 4,832 0 0Ports 0 0 0 0 180 0 0Education Service District 890 847 0 0 0 0 0Fire Districts 0 0 0 10 3,721 0 0Public Utility District 0 0 0 0 0 0 0Water Districts 0 0 0 0 0 0 0Energy Northwest 0 0 0 0 0 0 0Unions 0 0 0 0 0 0 0Total 25,950 32,314 5,483 62 17,186 498 470
2016 Actuarial Valuation Report
III. Participant Data
38

The following tables show participant data changes from last year’s valuation to this year’s valuation. We divide the participant data into two main categories:
• Actives — members accruing benefits in the plan• Annuitants — members and beneficiaries receiving benefits from the plan.
Reconciliation of Participant Data Reconciliation of Participant Data (Continued)
PERS TRSPlan 1 Plan 2 Plan 3 Total Plan 1 Plan 2 Plan 3 Total
2015 Actives 3,927 117,768 31,602 153,297 1,353 15,342 52,125 68,820 Transfers 0 (246) 4,916 4,670 0 (122) 2,731 2,609 Hires/Rehires 96 13,170 900 14,166 11 3,487 1,999 5,497 New Retirees (711) (2,930) (318) (3,959) (387) (244) (832) (1,463) Deaths (17) (168) (38) (223) (3) (5) (44) (52) Terminations (68) (7,917) (3,822) (11,807) (7) (1,216) (3,273) (4,496)2016 Actives 3,227 119,677 33,240 156,144 967 17,242 52,706 70,9152015 Annuitants 50,270 38,693 3,186 92,149 35,239 4,305 7,453 46,997 New Retirees 933 4,448 515 5,896 447 432 1,407 2,286 Annuitant Deaths (2,253) (840) (51) (3,144) (1,094) (61) (56) (1,211) New Survivors 336 298 34 668 199 12 45 256 Other (18) (8) 0 (26) (4) (1) (6) (11)2016 Annuitants 49,268 42,591 3,684 95,543 34,787 4,687 8,843 48,317Ratio Actives to Annuitants 0.07 2.81 9.02 1.63 0.03 3.68 5.96 1.47
Reconciliation of Participant Data (Continued)
Reconciliation of Participant Data (Continued)
SERS PSERSPlan 2 Plan 3 Total Plan 2
2015 Actives 24,479 31,326 55,805 5,202 Transfers (252) 3,775 3,523 0 Hires/Rehires 4,340 664 5,004 824 New Retirees (547) (624) (1,171) (24) Deaths (35) (31) (66) (2) Terminations (2,035) (2,796) (4,831) (517)2016 Actives 25,950 32,314 58,264 5,4832015 Annuitants 6,562 5,750 12,312 80 New Retirees 891 985 1,876 29 Annuitant Deaths (133) (61) (194) (1) New Survivors 60 35 95 0 Other 0 (1) (1) 02016 Annuitants 7,380 6,708 14,088 108Ratio Actives to Annuitants 3.52 4.82 4.14 50.77
2016 Actuarial Valuation Report
III. Participant Data
39
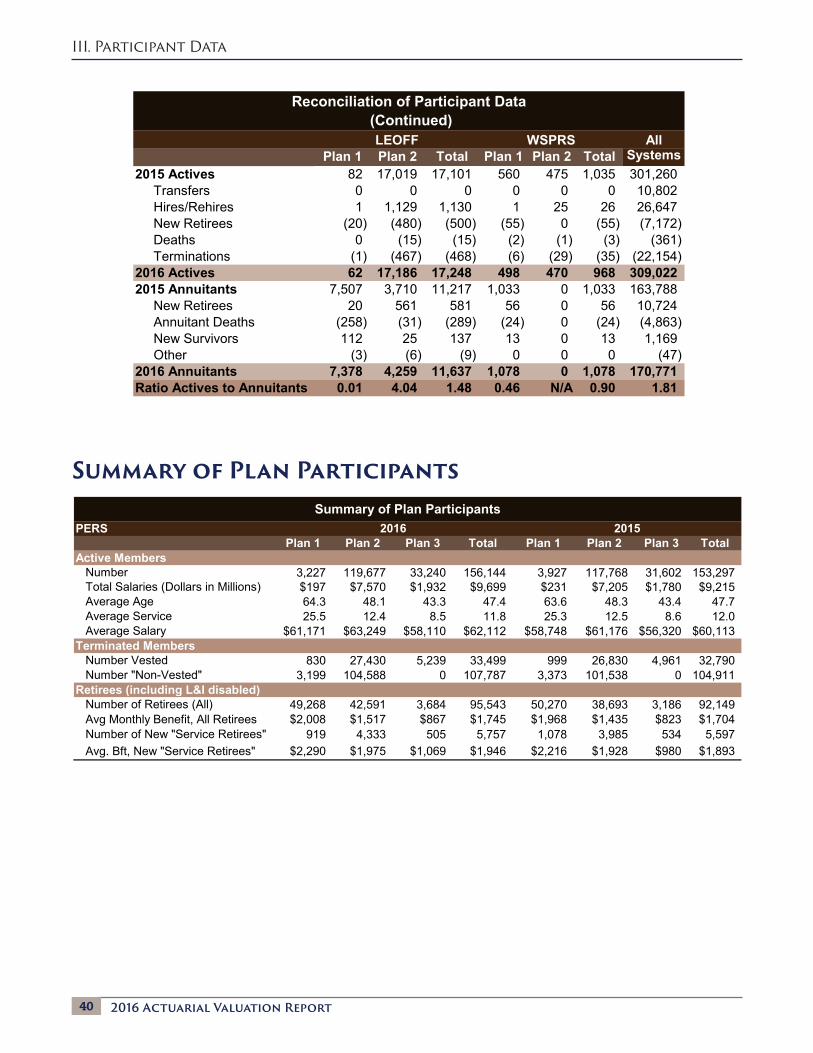
Summary of Plan ParticipantsSummary of Plan Participants
PERS 2016 2015Plan 1 Plan 2 Plan 3 Total Plan 1 Plan 2 Plan 3 Total
Active MembersNumber 3,227 119,677 33,240 156,144 3,927 117,768 31,602 153,297Total Salaries (Dollars in Millions) $197 $7,570 $1,932 $9,699 $231 $7,205 $1,780 $9,215Average Age 64.3 48.1 43.3 47.4 63.6 48.3 43.4 47.7Average Service 25.5 12.4 8.5 11.8 25.3 12.5 8.6 12.0Average Salary $61,171 $63,249 $58,110 $62,112 $58,748 $61,176 $56,320 $60,113
Terminated MembersNumber Vested 830 27,430 5,239 33,499 999 26,830 4,961 32,790Number "Non-Vested" 3,199 104,588 0 107,787 3,373 101,538 0 104,911
Retirees (including L&I disabled)Number of Retirees (All) 49,268 42,591 3,684 95,543 50,270 38,693 3,186 92,149Avg Monthly Benefit, All Retirees $2,008 $1,517 $867 $1,745 $1,968 $1,435 $823 $1,704Number of New "Service Retirees" 919 4,333 505 5,757 1,078 3,985 534 5,597Avg. Bft, New "Service Retirees" $2,290 $1,975 $1,069 $1,946 $2,216 $1,928 $980 $1,893
Reconciliation of Participant Data (Continued)
LEOFF WSPRS AllPlan 1 Plan 2 Total Plan 1 Plan 2 Total Systems
2015 Actives 82 17,019 17,101 560 475 1,035 301,260 Transfers 0 0 0 0 0 0 10,802 Hires/Rehires 1 1,129 1,130 1 25 26 26,647 New Retirees (20) (480) (500) (55) 0 (55) (7,172) Deaths 0 (15) (15) (2) (1) (3) (361) Terminations (1) (467) (468) (6) (29) (35) (22,154)2016 Actives 62 17,186 17,248 498 470 968 309,0222015 Annuitants 7,507 3,710 11,217 1,033 0 1,033 163,788 New Retirees 20 561 581 56 0 56 10,724 Annuitant Deaths (258) (31) (289) (24) 0 (24) (4,863) New Survivors 112 25 137 13 0 13 1,169 Other (3) (6) (9) 0 0 0 (47)2016 Annuitants 7,378 4,259 11,637 1,078 0 1,078 170,771Ratio Actives to Annuitants 0.01 4.04 1.48 0.46 N/A 0.90 1.81
2016 Actuarial Valuation Report
III. Participant Data
40
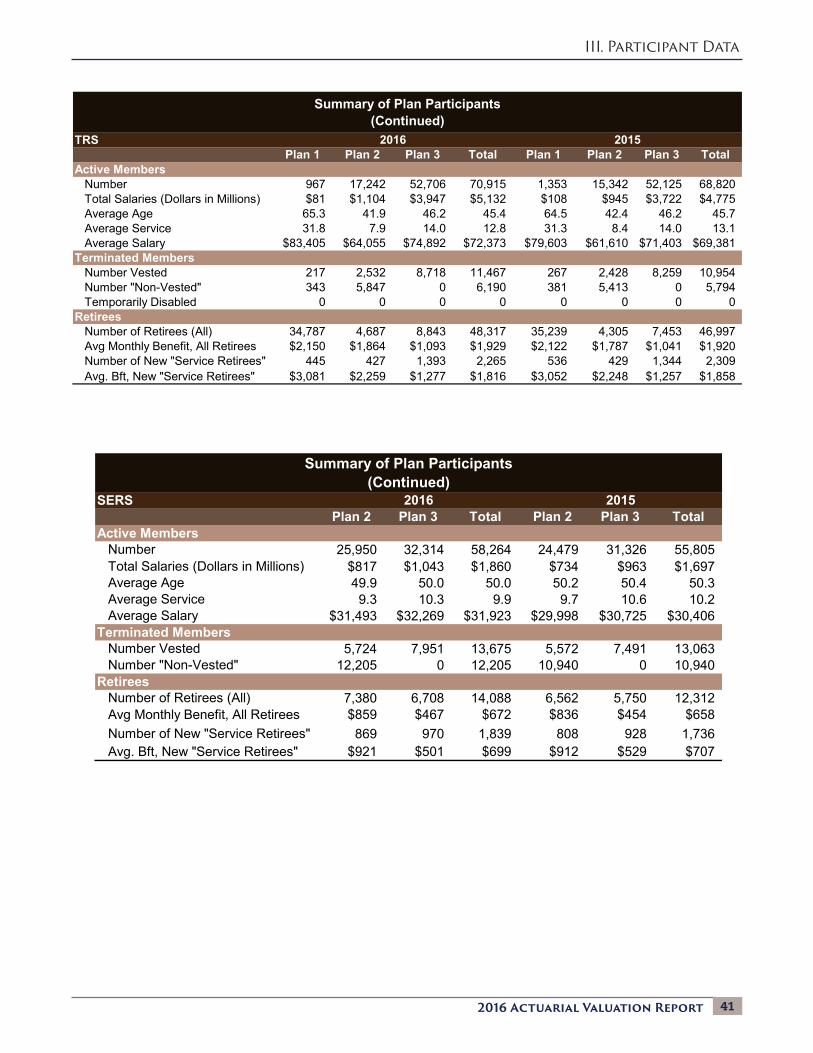
Summary of Plan Participants(Continued)
TRS 2016 2015Plan 1 Plan 2 Plan 3 Total Plan 1 Plan 2 Plan 3 Total
Active MembersNumber 967 17,242 52,706 70,915 1,353 15,342 52,125 68,820Total Salaries (Dollars in Millions) $81 $1,104 $3,947 $5,132 $108 $945 $3,722 $4,775Average Age 65.3 41.9 46.2 45.4 64.5 42.4 46.2 45.7Average Service 31.8 7.9 14.0 12.8 31.3 8.4 14.0 13.1Average Salary $83,405 $64,055 $74,892 $72,373 $79,603 $61,610 $71,403 $69,381
Terminated MembersNumber Vested 217 2,532 8,718 11,467 267 2,428 8,259 10,954Number "Non-Vested" 343 5,847 0 6,190 381 5,413 0 5,794Temporarily Disabled 0 0 0 0 0 0 0 0
Retirees Number of Retirees (All) 34,787 4,687 8,843 48,317 35,239 4,305 7,453 46,997Avg Monthly Benefit, All Retirees $2,150 $1,864 $1,093 $1,929 $2,122 $1,787 $1,041 $1,920Number of New "Service Retirees" 445 427 1,393 2,265 536 429 1,344 2,309Avg. Bft, New "Service Retirees" $3,081 $2,259 $1,277 $1,816 $3,052 $2,248 $1,257 $1,858
Summary of Plan Participants(Continued)
SERS 2016 2015Plan 2 Plan 3 Total Plan 2 Plan 3 Total
Active MembersNumber 25,950 32,314 58,264 24,479 31,326 55,805Total Salaries (Dollars in Millions) $817 $1,043 $1,860 $734 $963 $1,697Average Age 49.9 50.0 50.0 50.2 50.4 50.3Average Service 9.3 10.3 9.9 9.7 10.6 10.2Average Salary $31,493 $32,269 $31,923 $29,998 $30,725 $30,406
Terminated MembersNumber Vested 5,724 7,951 13,675 5,572 7,491 13,063Number "Non-Vested" 12,205 0 12,205 10,940 0 10,940
RetireesNumber of Retirees (All) 7,380 6,708 14,088 6,562 5,750 12,312Avg Monthly Benefit, All Retirees $859 $467 $672 $836 $454 $658Number of New "Service Retirees" 869 970 1,839 808 928 1,736Avg. Bft, New "Service Retirees" $921 $501 $699 $912 $529 $707
2016 Actuarial Valuation Report
III. Participant Data
41
Summary of Plan Participants(Continued)
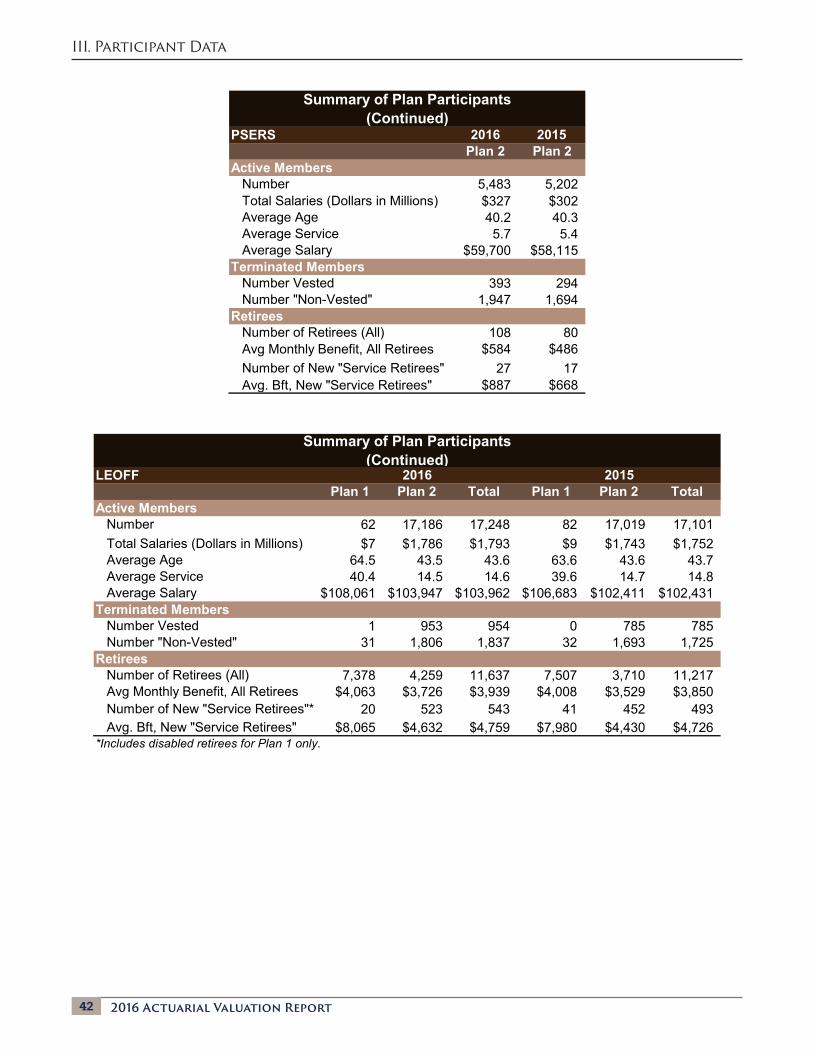
LEOFF 2016 2015Plan 1 Plan 2 Total Plan 1 Plan 2 Total
Active MembersNumber 62 17,186 17,248 82 17,019 17,101Total Salaries (Dollars in Millions) $7 $1,786 $1,793 $9 $1,743 $1,752Average Age 64.5 43.5 43.6 63.6 43.6 43.7Average Service 40.4 14.5 14.6 39.6 14.7 14.8Average Salary $108,061 $103,947 $103,962 $106,683 $102,411 $102,431
Terminated MembersNumber Vested 1 953 954 0 785 785Number "Non-Vested" 31 1,806 1,837 32 1,693 1,725
RetireesNumber of Retirees (All) 7,378 4,259 11,637 7,507 3,710 11,217Avg Monthly Benefit, All Retirees $4,063 $3,726 $3,939 $4,008 $3,529 $3,850Number of New "Service Retirees"* 20 523 543 41 452 493Avg. Bft, New "Service Retirees" $8,065 $4,632 $4,759 $7,980 $4,430 $4,726
*Includes disabled retirees for Plan 1 only.
Summary of Plan Participants(Continued)
PSERS 2016 2015Plan 2 Plan 2
Active MembersNumber 5,483 5,202Total Salaries (Dollars in Millions) $327 $302Average Age 40.2 40.3Average Service 5.7 5.4Average Salary $59,700 $58,115
Terminated MembersNumber Vested 393 294Number "Non-Vested" 1,947 1,694
RetireesNumber of Retirees (All) 108 80Avg Monthly Benefit, All Retirees $584 $486Number of New "Service Retirees" 27 17Avg. Bft, New "Service Retirees" $887 $668
2016 Actuarial Valuation Report
III. Participant Data
42

Summary of Plan Participants(Continued)
WSPRS 2016 2015Plan 1 Plan 2 Total Plan 1 Plan 2 Total
Active MembersNumber 498 470 968 560 475 1,035Total Salaries (Dollars in Millions) $47 $36 $83 $49 $33 $82Average Age 47.5 33.9 40.9 47.0 33.2 40.7Average Service 20.7 7.4 14.2 20.1 6.5 13.9Average Salary $93,338 $77,349 $85,575 $86,535 $70,238 $79,056
Terminated MembersNumber Vested 76 28 104 75 20 95Number "Non-Vested" 17 53 70 17 33 50Disabled Members* 46 0 46 48 0 48
RetireesNumber of Retirees (All) 1,078 0 1,078 1,033 0 1,033Avg Monthly Benefit, All Retirees $4,215 $0 $4,215 $4,088 $0 $4,088Number of New "Service Retirees" 56 0 56 48 0 48Avg. Bft, New "Service Retirees" $4,652 $0 $4,652 $4,091 $0 $4,091
*Benefits provided outside of pension funds.
2016 Actuarial Valuation Report
III. Participant Data
43


![[Date] [Participant Name Participant Address1 …Date] [Participant Name Participant Address1 Participant City ST Zip] Dear Participant: RE: Request for Hardship Distribution under](https://img.dokumen.tips/doc/110x75/5b002b357f8b9af1148c48bc/date-participant-name-participant-address1-date-participant-name-participant.jpg)


![January 10, 2012 [Participant Name] [Participant Street ......January 10, 2012 [Participant Name] [Participant Street Address] [Participant City, State Zip code] Dear [Participant](https://img.dokumen.tips/doc/110x75/5f8ad691c7ddf87a4309ec05/january-10-2012-participant-name-participant-street-january-10-2012.jpg)