Embed Size (px)
Citation preview
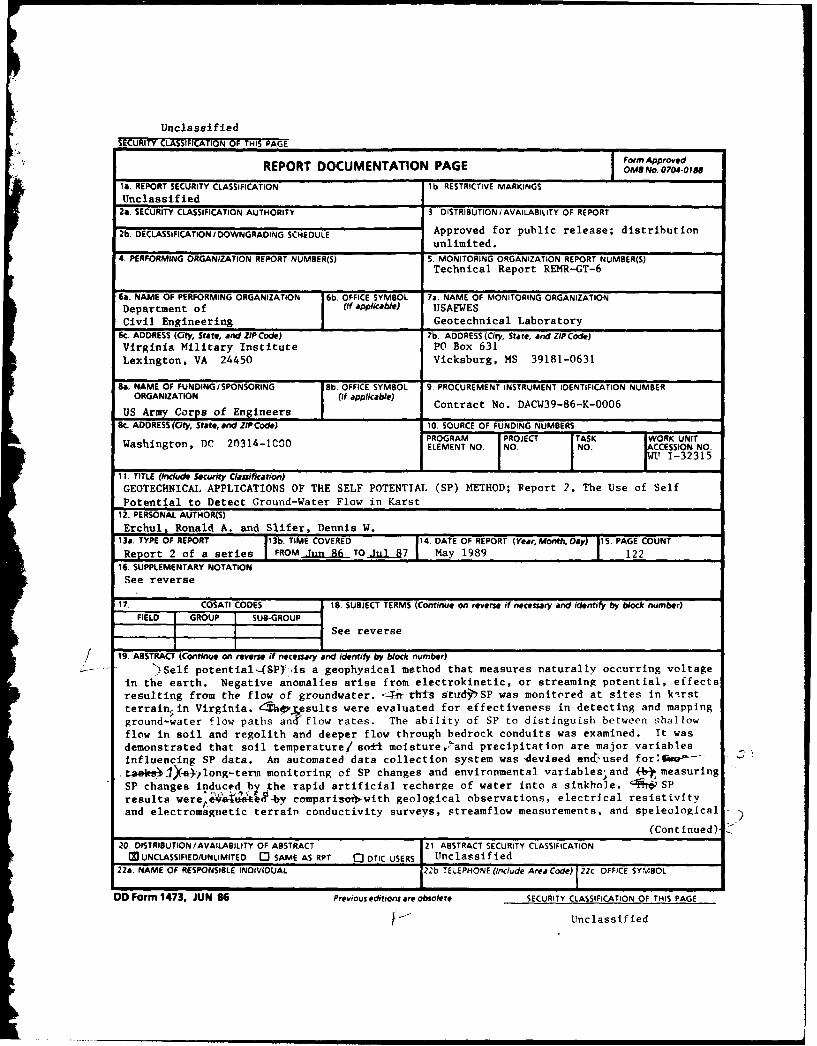
UnclassifiedSECURITY CLASSIFICATION OF THIS PAGE
Form Approved
REPORT DOCUMENTATION PAGE OMS p.070-OFe
1. REPORT SECURITY CLASSIFICATION lb RESTRICTIVE MARKINGSUnclassified
2a. SECURITY CLASSIFICATION AUTHORITY 3 DISTRIBUTION iAVAILABILITY OF REPORT
2b. DECLASSIFICATION/DOWNGRADING SCHEDULE Approved for public release; distribution
unlimited.4. PERFORMING ORGANIZATION REPORT NUMBER(S) S. MONITORING ORGANIZATION REPORT NUMBER(S)
Technical Report REMR-GT-6
6a. NAME OF PERFORMING ORGANIZATION 6b. OFFICE SYMBOL 7a. NAME OF MONITORING ORGANIZATIONDepartment of (If applicable) USAEWES
Civil Engineering Geotechnical Laboratory6c ADDRESS (City, State, and ZIP Code) 7b. ADDRESS (City, State, and ZIP Code)Virginia Military Institute PO Box 631
Lexington, VA 24450 Vicksburg, MS 39181-0631
S.. NAME OF FUNDING/SPONSORING 8b. OFFICE SYMBOL 9. PROCUREMENT INSTRUMENT IDENTIFICATION NUMBERORGANIZATION I(if applicable) Contract No. DACW39-86-K-0006
US Army Corps of Engineers ISc. ADDRESS (City, State, and ZIP Code) 10. SOURCE OF FUNDING NUMBERS
PROGRAM PROJECT ITASK WORK UNITWashington, DC 20314-1000 ELEMENT NO. NO NO. IACCESSION NO.
I__ I EW 1 1 - 3 2 3 1 5
11. TITLE (Include Security Classification)GEOTECHNICAL APPLICATIONS OF THE SELF POTENTIAL (SP) METHOD; Report 2, The Use of Self
Potential to Detect Ground-Water Flow in Karst12. PERSONAL AUTHOR(S)Erchul, Ronald A. and Slifer, Dennis W.
13a. TYPE OF REPORT 13b. TIME COVERED 14. DATE OF REPORT (Year, Month, Day) 15. PAGE COUNT
Report 2 of a series FROM J fiTO Tul R7 May 1989 12216. SUPPLEMENTARY NOTATIONSee reverse
17. COSATI CODES 18. SUBJECT TERMS (Continue on reverse if necessary and identify by block number)FIELD GROUP SUB-GROUP
See reverse
19. ABSTRACT (Continue on reverse if necessary and identify by block number)
')Self potential (SPY is a geophysical method that measures naturally occurring voltagein the earth. Negative anomalies arise from electrokinetic, or streaming potential, effectsresulting from the flow of groundwater. -irf-tbts studySP was monitored at sites in karstterrainin Virginia. rzhpresults were evaluated for effectiveness in detecting and mappingground-water flow paths anci flow rates. The ability of SP to distinguish between shallowflow in soil and regolith and deeper flow through bedrock conduits was examined. It was
demonstrated that soil temperature/ so,I moisture,"and precipitation are major variablesinfluencing SP data. An automated data collection system was devieed enc'used for:G v -taekeso JIA)-long-term monitoring of SP changes and environmental variablesIand 44 measuring
SP changes induced b7 -the rapid artificial recharge of water into a sinkhole. '4I SP
results were 4' Ab-by comparisoiwith geological observations, electrical resistivityand electromagnetic terrain conductivity surveys, streamflow measurements, and speleological
(Contri nued)- C
20. DISTRIBUTION/AVAILABILITY OF ABSTRACT 21 ABSTRACT SECURITY CLASSIFICATION
MUNCLASSIFIED/UNLIMITE D 0 SAME AS RPT C DTIC USERS Unclassified22a. NAME OF RESPONSIBLE INDIVIDUAL I2b TELEPHONE (Include Area Code) I 22c OFFICE SYMBOL
DD Form 1473. JUN 86 Previous editions are obsolete. SECURITY CLASSIFICATION OF THIS PAGE
Unclassified

UnclassifiedSECURITY CLAMIPICATION OP THIS VAGI
16. SUPPLEMENTARY NOTATION (Continued).
A report of the Geotechnical problem area of the Repair, Evaluation, Maintenance and Reha-bilitation (REMR) Research Program. This report is available from the National TechnicalInformation Service, 5285 Port Royal Road, Springfield, VA 22161.
18. SUBJECT TERMS (Continued).
Electrodes Self potential Surface drainageFlow path SinkholeGeophysical technique Subsurface drainage
19. ABSTRACT (Continued).
-surveys. Results indicate that SP can effectively locate and track shallow (ee than)20 m)ground-water flow paths in karst.,arrain.A relationship was observed between SP and changesin flow rate where the flow was through porous material, but SP could not be directlyrelated to flow through solutional channels and conduits. _However -thdpresence of conduitsmay be indicated by SP anomalies where surface soil moisture is drawn into fractures thatsupply water to conduits at greater depths. hij'pfluence of geologic structures on ground-water flow must be considered in interpreting SP resulrs in karst.. Further refinement ofthe SP technique is promising for applications to environmental and geotechnical problems.
SECURIT CLSSIICAifONed TI A
ICCUAITY CLASSIPICATION OP THIS PAGE

PREFACE
The work described herein was performed by Dr. Ronald A. Erchul during
the period from June 1986 to July 1987 under a contract with the Virginia
Military Institute (VMI), Lexington, VA. The work was authorized by the
US Army Engineer Waterways Experiment Station (WES), Vicksburg, MS, under
Contract No. DACW39-86-K-0006. The work was funded by the Repair, Evaluation,
Maintenance, and Rehabilitation (REMR) Research Project "Geophysical Tech-
niques for Assessment of Existing Structural Foundations," Work Unit
No. WU 1-32315. This is the second of two reports in a series of three.
The field work was performed during the period from July 1986 to May
1987 by Messrs. Dennis W. Slifer, Robert Thren, Steven Richards, and
Cadets D. R. Gibbings and R. W. Marsh, VMI. The data analysis phase of the
investigation was performed by Mr. Dennis W. Slifer and Cadets D. R. Gibbings
and R. W. Marsh. This report was written by Dr. Robert A. Erchul and
Mr. Dennis W. Slifer. Principal Investigators for the REMR research project
are Dr. Dwain K. Butler and Mr. Jose L. Llopis, Earthquake Engineering and
Geophysics Division, Geotechnical Laboratory, WES. Mr. Benjamin I. Kelley,
Headquarters, US Army Corps of Engineers, was Technical Monitor for this work.
The report was edited by Ms. Joyce H. Walker, Information Products Division,
Information Technology Laboratory, WES.
Acting Commander and Director of WES during preparation of this
report was LTC Jack R. Stephens, EN. Dr. Robert W. Whalin is Technical
Director.
Accession ForNTIS GRA&I
DT1C TABUnannounced LIJustificat.-n
Distribution/
Availability Codes
Ava i and/or
Dist Special
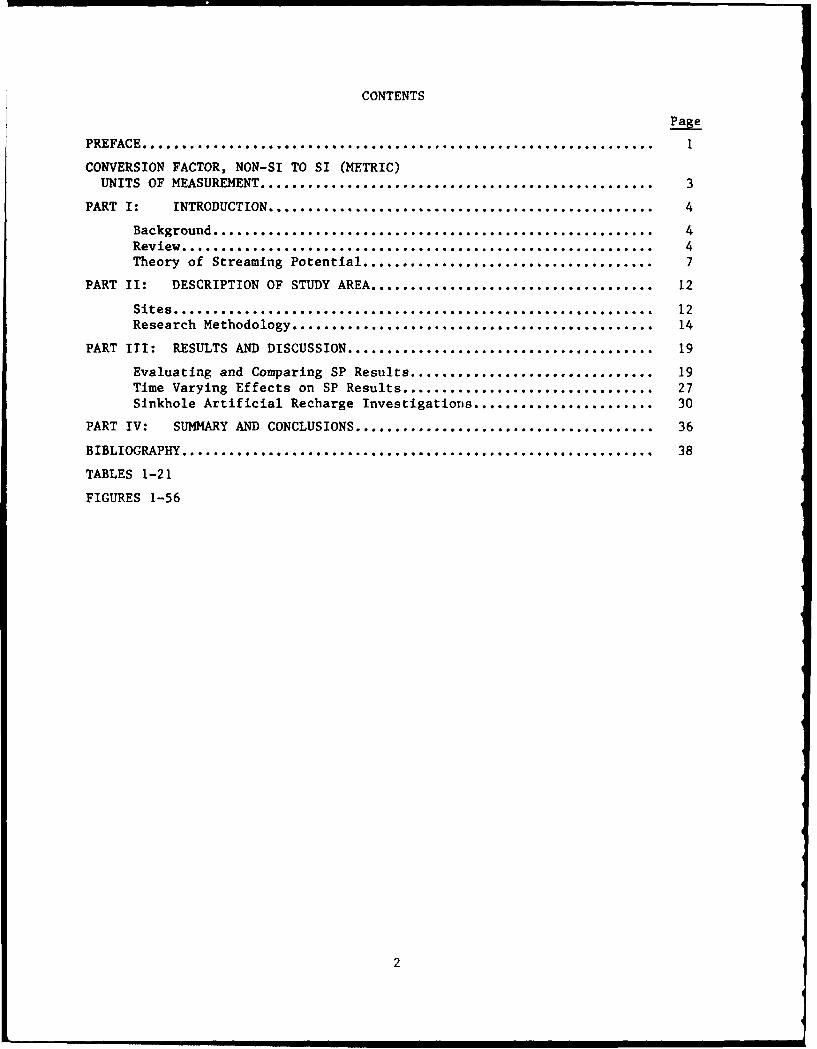
CONTENTS
Page
PREFACE ..................................................................... 1
CONVERSION FACTOR, NON-SI TO SI (METRIC)UNITS OF MEASUREMENT ..................................................... 3
PART I: INTRODUCTION .................................................... 4
Background ........................................................ 4Review ............................ o ............................. 4Theory of Streaming Potential ....................................... 7
PART II: DESCRIPTION OF STUDY AREA ...................................... 12
Sites ............................................................. 12Research Methodology....o ......................................... 14
PART III: RESULTS AND DISCUSSION .......................................... 19
Evaluating and Comparing SP Results ................................. 19Time Varying Effects on SP Results .................................. 27Sinkhole Artificial Recharge Investigations ....................... 30
PART IV: SUMMARY AND CONCLUSIONS ......................................... 36
BIBLIOGRAPHY ............................................................... 38
TABLES 1-21
FIGURES 1-56
2

CONVERSION FACTORS, NON-SI TO SI (METRIC)
UNITS OF MEASUREMENT
Non-SI units of measurement used in this report can be converted to SI (met-
ric) units as follows:
Multiply By To Obtain
degrees (angle) 0.01745329 radians
Fahrenheit degrees 5/9 Celsius degrees or Kelvins*
feet 0.3048 metres
gallons 3.785412 cubic decimetres
inches 25.4 millimetres
miles (US Statute) 1.609347 kilometres
millimbus per foot 3.28 millimbus per metre
ohm-foot 0.3048 ohm-metres
pounds (force) seconds 14.88164 poise
per square foot
pounds (force) per 47.88026 pascals
square foot
To obtain Celsius (C) temperature readings from Fahrenheit (F) readings,
use the following formula: C = (5/9) (F - 32). To obtain Kelvin (K) read-ings, use: K - (5/9) (F - 32) + 273.15.
3

GEOTECHNICAL APPLICATIONS OF THE SELF POTENTIAL (SP) METHOD
The Use of Self Potential to Detect Groundwater Flow in Karst
PART I: INTRODUCTION
Background
1. Report 1 in this series (Erchul 1987) presented a preliminary proof-
of-concept field evaluation of a technique for mapping subsurface water flow
into/from sinkholes and between sinkholes. The evaluation used a novel scheme
consisting of (a) circumferential self potential (SP) electrode arrays to
detect flow into or from sinkholes and then of (b) rectangular SP electrode
arrays to track or map flow paths "cross country" between sinkholes. Results
of the proof-of-concept field evaluation were positive and indicated that the
concept might lead to a simple, inexpensive procedure for mapping subsurface
water flow paths in karst areas. This current report (Report 2) extends the
preliminary work to investigate:
a. Environmental effects (temperature, rain, vegetation, etc.) onSP measurements with metal electrodes.
b. Relationships between flow quantity and SP magnitudes.
c. Limitations of method.
Review
2. Karst regions, areas of soluble carbonate bedrock, have unique
hydrological characteristics. Environmental and engineering problems result
from the solutional removal of bedrock--a process that produces sinkholes,
preferential subsurface drainage, and random soil depths. Water supply and
quality, drainage, flooding, and land use problems are different from those in
nonkarst areas. Karst terrain comprises approximately twenty percent of the
land area of the United States and is extensive worldwide (Quinlan and Ewers
1986). Although this research was conducted in the karst of the Valley and
Ridge Province of the Appalachian region, the results should be applicable to
most other karst regions and perhaps nonkarst areas as well.
4

3. There is always a need for more information about subsurface condi-
tions and processes in the earth. The SP technique promises to be an effec-
tive method for producing such information. Although it is one of the least
understood geophysical methods, recent research and applications indicate that
because of a close relationship between SP and hydrogeologic parameters, SP
may become a valuable and standard technique in hydrogeology (Ernston and
Scherer 1986).
4. SP is an electrical geophysical technique that measures naturally
occurring voltage fields in the earth's surface. SP is one of the oldest geo-
physical methods, first used by Robert Fox in the copper mines of Cornwall,
England in 1830. As a prospecting tool for sulphide ores ana graphite depos-
its, SP has been widely used by geologists around the world. Likewise, SP
logs are commonly made from boreholes and wells to record changes in perme-
ability, pore fluid, and lithology.
5. In recent years, the SP technique has received increased study for a
variety of novel geotechnical applications. Geothermal exploration using SP
has been successfully demonstrated in many locations (Anderson and Johnson
1976; Corwin and Hoover 1978). SP has also been used to detect and track
underground coal mine fires (Rodriguez 1984; Corwin and Hoover 1978). Elec-
tromagnetic anomalies induced by water diffusion prior to earthquakes have
been studied by Fitterman (1978) and Ishido (1981). SP monitoring techniques
in this application may eventually produce a useful predictive tool. Soviet
scientists (Ogilvy, Ayed, and Bogoslovsky 1969; Bogoslovsky and Ogilvy 1972)
were among the first to experiment with SP methods in applied hydrological and
geotechnical uses. They found that SP was able to detect leakages at dams,
reservoirs, and drainage structures, and it is this application that has
potential for REMR applications. Another useful application is evaluating
ground-water patterns relating to landslide processes.
6. In the United States, the application of SP to geotechnical problems
has been studied by the US Army Corps of Engineers at some of its dam sites.
Cooper, Koester and Franklin (1982) conducted an SP survey at Gathright Dam in
Virginia. Other studies include Clearwater Dam in Missouri (Koester, Butler,
Cooper, and Llopis 1984), Mill Creek Dam in Washington (Butler, Wahl, and
Sharp 1984), Medford Cave and Manatee Springs in Florida (Cooper 1983), and
Beaver Dam in Arkansas (Llopis and Butler 1988). Other agencies (US Bureau of
Reclamation) and consulting firms are beginning to use SP
5

methods for seepage analysis and to define hazardous areas in landslide masses
(Markiewiez and Randall 1984).
7. Many of the studies conducted by the Corps of Engineers are of par-
ticular interest because of their locations in karst terrain. Impoundments In
karst areas have always been plagued by leakage problems because of the pres-
ence of caves, sinkholes, erratic and heterogeneous ground-water patterns, and
other solutional features which contribute to unpredictable subsurface condi-
tions. It is not necessary to stop all leakage, but it is necessary to con-
trol it to the extent that there is no danger of piping or uplift-induced
failure. To control leakage from an existing water resources structure or its
foundation, one has first to find the seepage path or paths.
8. Karst terrain is especially vulnerable to ground-water contamina-
tion. Researchers have used other geophysical techniques (electrical resis-
tivity, seismic refraction, gravimetry, terrain conductivity, ground probing
radar, etc.) in studying subsurface features of karst, but SP is attractive as
a cost-effective method for initial investigations of an area. This is due in
part to the use of simple metal electrodes which was pioneered on Corps of
Engineers projects; this adaptation makes the technique relatively fast and
easy to execute. This simplification of the technique combined with the
apparent environmental and engineering applications in sensitive karst areas
are the basis for the present study. As a simple, fast, and inexpensive
method, SP should be valuable for augmenting other geophysical and geotech-
nical subsurface explorative methods. It seems especially well suited for
monitoring changes over relatively long periods of time. In addition to its
utility for helping to solve site-specific geotechnical problems, SP research
in karst areas may contribute to advances in theoretical concepts about
ground-water movement, storage, and recharge processes.
9. The purpose of this research is to evaluate the SP technique (as
developed by the Corps of Engineers) by applying it to a monitoring program at
a variety of karst features within a study area in west central Virginia. The
SP results are evaluated by comparison with site observations, geological
studies, results from other geophysical methods, stream flow measurements,
cave surveys, artificial water injections (recharge) into sinkholes, dye trac-
ing, and monitoring of soil temperature, precipitation, ground-water conduc-
tivity, and other environmental parameters that may affect SP. In addition, a
computerized data collection system is developed for field use. This system
6

greatly increases the capabilities and effectiveness of monitoring both
short-term hydrologic recharge events as well as long-term and seasonal
changes at the study sites.
Theory of Streaming Potential
10. As used in geophysics, SP refers to a phenomenon that originates
from several different mechanisms. Electrochemical SP effects are caused by
differences in solution concentrations and oxidation states of earth mate-
rials. This is the basis for the earth cell or galvanic (battery) cell expla-
nation commonly used in connection with SP anomalies generated by metallic ore
bodies. The electrokinetic (or electrofiltration) mechanism, on the other
hand, generates potentials by the flow of water or heat through a porous
medium. SP originating from this source is known as streaming potential and
is of primary interest in ground-water investigations and the present study.
11. Electrical effects resulting from the application of man-made cur-
rents to the earth are not included in the definition of SP, hence the term
"spontaneous." Telluric currents (elecLromagnetically induced earth currents)
are also excluded from a consideration of SP effects. This is not to say that
cultural or telluric signals can be ignored in SP work; in some situations
they can produce noise which must be recognized and filtered out. Another
possible source for signal noise in SP work may derive from "bioelectric cur-
rents" from vegetation (Nourbehecht 1963). Presumably, this effect can be
recognized as obvious differences in background between wooded and open ter-
rain when conducting traverses across such boundaries. Electrode polarization
effects can also influence SP results. Electrodes and techniques of use have
been debated in the literature. The relatively recent trend toward using
metal electrodes (as opposed to porous ceramic nonpolarizing electrodes) is
still somewhat controversial. More detail on this topic is given later in
this study.
12. Interpretation of the results from the present study is based on
the detection of negative anomalies in the potential field which are assumed
to be primarily due to streaming potential effects. Therefore, an increasing
SP value is one that is becoming more negative; whereas, decreasing SP value
is one that is becoming less negative (or more positive). Ogilvy (1967)
states that the most significant results are obtained in karst regions where
7
considerable quantities of water are lost in sinkholes. He recommended trac-
ing shallow near-horizontal ground-water flows using radial configurations of
electrodes and reported that streaming potentials are a maximum in the direc-
tion of flow.
13. Cooper, Koep'er, and Franklin (1982) reported that the electrochem-
ical and telluric contribution to SP are relatively minor and that one may
assume that values measured relative to a local reference in a similar geo-
logic condition are due to the electrokinetic contribution or streaming poten-
tial. Likewise, Corwin and Hoover (1978) have demonstrated that, for models
of similar geometry, SP anomalies generated by electrokinetic coupling are
larger in amplitude than those generated by other mechanisms. Nourbehecht
(1963) determined that streaming potential mechanisms are capable of producing
anomalies of "several hundred millivolts." These figures are consistent with
the anomalies commonly measured in Lhe present study (as great as -500 my).
Streaming potentials may produce very large anomalies on the surface. Accord-
ing to Corry (1985), areas with large amplitude streaming potentials are char-
acterized by high rainfall and steep topography. An i.xtreme example is the
-2,693-mv anomaly found on Agadak Volcano in Alaska (Corwin and Hoover 1978)
and the -1,600-mv anomaly associated with Kilauea Volcano in Hawaii.
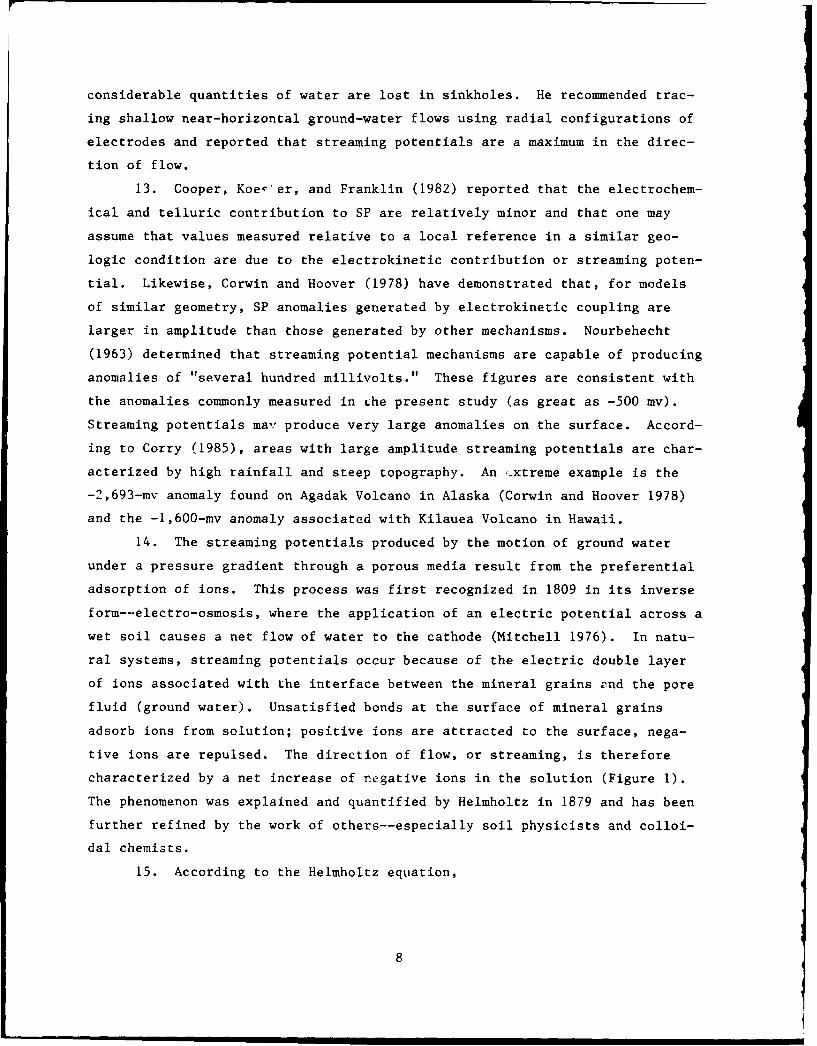
14. The streaming potentials produced by the motion of ground water
under a pressure gradient through a porous media result from the preferential
adsorption of ions. This process was first recognized in 1809 in its inverse
form--electro-osmosis, where the application of an electric potential across a
wet soil causes a net flow of water to the cathode (Mitchell 1976). In natu-
ral systems, streaming potentials occur because of the electric double layer
of ions associated with the interface between the mineral grains end the pore
fluid (ground water). Unsatisfied bonds at the surface of mineral grains
adsorb ions from solution; positive ions are attracted to the surface, nega-
tive ions are repulsed. The direction of flow, or streaming, is therefore
characterized by a net increase of negative ions in the solution (Figure 1).
The phenomenon was explained and quantified by Helmholtz in 1879 and has been
further refined by the work of others--especially soil physicists and colloi-
dal chemists.
15. According to the Helmholtz equation,
8
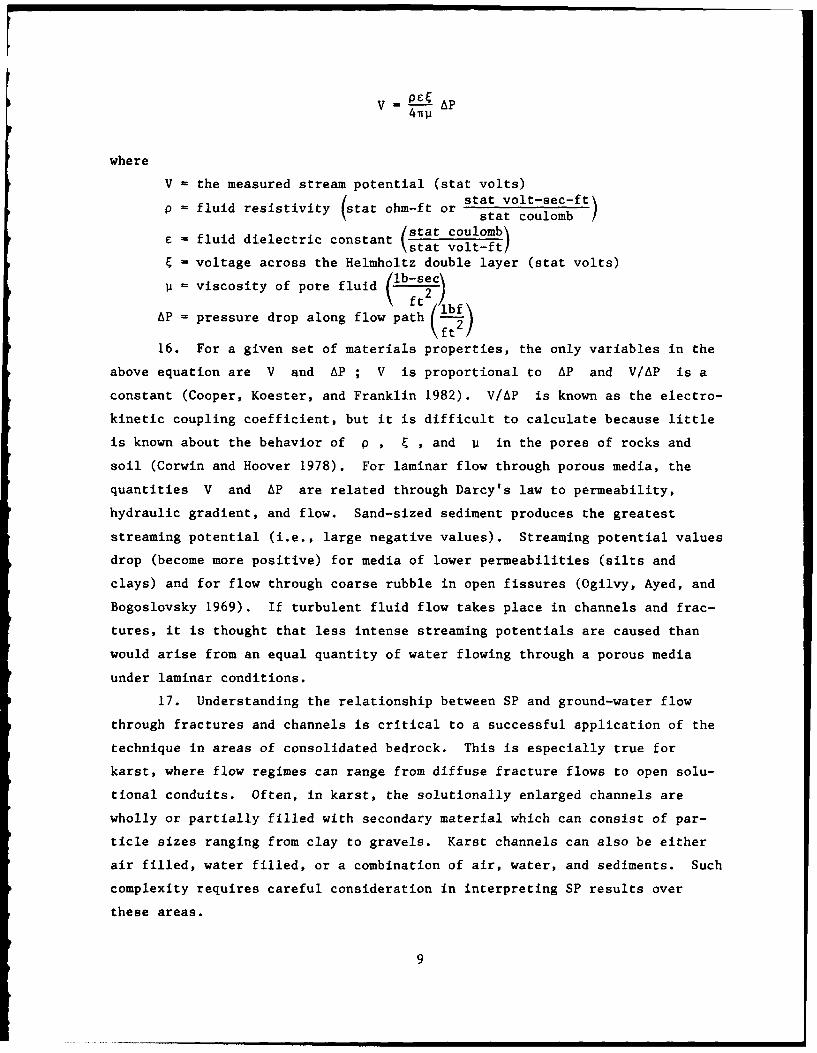
v = PE-- AP4rrp
where
V - the measured stream potential (stat volts)
P fluid resistivity tat ohm-ft or stat volt-sec-ftcs (stat coulombc
e - fluid dielectric constant st volt-ft
E voltage across the Helmholtz double layer (stat volts)
viscosity of pore fluid (lb-sec)-- t)AP =pressure drop along flow path (!f)16. For a given set of materials properties, the only variables in the
above equation are V and AP ; V is proportional to AP and V/AP is a
constant (Cooper, Koester, and Franklin 1982). V/AP is known as the electro-
kinetic coupling coefficient, but it is difficult to calculate because little
is known about the behavior of p , E , and U in the pores of rocks and
soil (Corwin and Hoover 1978). For laminar flow through porous media, the
quantities V and AP are related through Darcy's law to permeability,
hydraulic gradient, and flow. Sand-sized sediment produces the greatest
streaming potential (i.e., large negative values). Streaming potential values
drop (become more positive) for media of lower permeabilities (silts and
clays) and for flow through coarse rubble in open fissures (Ogilvy, Ayed, and
Bogoslovsky 1969). If turbulent fluid flow takes place in channels and frac-
tures, it is thought that less intense streaming potentials are caused than
would arise from an equal quantity of water flowing through a porous media
under laminar conditions.
17. Understanding the relationship between SP and ground-water flow
through fractures and channels is critical to a successful application of the
technique in areas of consolidated bedrock. This is especially true for
karst, where flow regimes can range from diffuse fracture flows to open solu-
tional conduits. Often, in karst, the solutionally enlarged channels are
wholly or partially filled with secondary material which can consist of par-
ticle sizes ranging from clay to gravels. Karst channels can also be either
air filled, water filled, or a combination of air, water, and sediments. Such
complexity requires careful consideration in interpreting SP results over
these areas.
9

18. The literature is scant regarding streaming potentials produced in
fracture or conduit flow conditions. Laboratory experiments have been con-
ducted by Ahmad (1964) and Bogoslovsky and Ogilvy (1972) to study streaming
potentials in channel flow models. Both studies affirm the proportional rela-
tionship between SP and AP , or hydraulic head (the driving force behind the
fluid movement). Otherwise, they found that SP fields in fissured media dif-
fer from those in unconsolidated porous media. For instance, at similar pres-
sures (AP) the SP values produced in fissures 2 to 6 mm in width are several
orders of magnitude smaller than those produced in media-grained sand
(Bogoslovsky and Ogilvy 1972). SP values were found to decrease with the
opening of fissures, i.e., larger fissures (6 mm) produce SP values approach-
ing zero or positive values while smaller fissures (2 mm) produce SP values
that are more negative. However, the presence of sand fill in the fissures
considerably increased the SP over values obtained for empty fissures. A
filling of 40 percent sand produced the maximum SP; whereas, introducing a
clay fraction to the fill resulted in a decrease in the SP. Ahmad (1964) con-
cluded that the geometry of flow was relatively unimportant in its effect on
SP in fissured flow and that SP decreases as salinity of the electrolyte (pore
fluid) increases.
19. Ogilvy, Ayed, and Bogoslovsky (1969) reported that clay-filled fis-
sures with low permeabilities are characterized by low SP values. As support-
ing evidence for this, they cited the relatively high positive values of SP
associated with clay layers in borehole geophysical logs. They also claimed
that salinization also leads to a decrease in SP values. Warriner and Taylor
(1986) conducted laboratory experiments in an attempt to model streaming
potential mechanisms and parameters. They also found that the presence of
clay in or near the flow path degrades SP magnitudes, and also mentioned the
positive SP values for shale layers in well logs as confirmation. In their
experiments, all measured streaming potentials were negative.
20. The dependency between SP values and AP has been further demon-
strated at various Corps of Engineers reservoirs. Perturbations to the water
flow regimes were created by changing the level of the reservoir pool. These
changes in hydraulic head correlated to SP fluctuations at electrodes located
over seepage zones, indicating that flow rate affects SP (Warriner and Taylor
1982).
10

21. Some insight into depth resolution and the ability of SP to detect
water-filled conduits was gained in an SP survey over Manatee Springs in
Florida (Cooper 1983). Manatee Springs is a large water-filled solution con-
duit and was detected by SP at a depth of 90 ft.* Florida's karst often has
high diffuse permeability and may also contain appreciable amounts of sand;
this may explain the significant streaming potential anomalies encountered at
this test site. Further evidence of SP depth capability was demonstrated by a
Corps of Engineers survey at Waterbury Dam in Vermont, where there was a good
correlation of negative anomalies with man-made outlet works conduits at a
depth of 120 ft below the embankment on which the surveys were conducted.
22. It is important to refine the SP technique and our interpretation
of its results to distinguish between different types of ground-water flow
regimes. Most basic would be differentation between filtration flow (seepage)
through soil and unconsolidated sediments and concentrated flow in fractures
or channels. Within karst terrain this amounts to detecting shallow recharge
ground water percolating through soil and regolith, water confined to solu-
tionally developed channels in the epikarst and moving laterally or verti-
cally, and deeper flow through solution conduits in either vadose or phreatic
conditions. This variety of conditions entails a multitude of variables which
could affect SP generation and interpretation, such as:
a. Local relief, which could influence hydraulic gradients.
b. Lithology (insolubles would affect permeability of fill).
c. Variations in water and soil chemistry.
d. Bedrock structure and deformation.
e. Degree of karstification, extent of subsurface drainage.
f. Depth to "water table" or major conduits.
. Climatic and seasonal parameters.
* A table of factors for converting non-SI to SI (metric) units of measure-
ment is presented on page 3.
11

PART II: DESCRIPTION OF STUDY AREA
Sites
23. In this research, SP was studied by means of observations and data
from a number of sites in Rockbridge County, VA--within the Valley and Ridge
Province. All of the sites are underlain by Ordovician limestones and dolo-
mites. Karst topography is well developed locally; numerous sinkholes, caves,
karren, and sinking streams are present. Elevation is about 360 m above sea
level.
24. Nine sites were selected for study. Six sites are sinkholes
(one contains a cave entrance), two sites are sinking streams, and one site is
at an intermittent stream bed. Figure 2 shows the location of Rockbridge
County and several of the study sites. The sites were chosen to represent a
range of karst features (collapse sinks, subsidence sinks, sinkholes with
known cave passages under them, sinkholes above springs, fault-related sink-
holes and sinking streams, and a failed sinkhole pond). All are examples of
ground-water recharge points, and, as such, should exhibit high streaming
potential values.
Harris and Hunter sinkholes
25. Two of the sites (Harris and Hunter sinkholes) were monitored in
1985; for all the other sites, study began in July 1986. Unfortunately, the
commencement of this research in 1986 coincided with a prolonged and severe
drought that caused record low water levels throughout the area. The natural
oscillations in water levels and flow volumes that were anticipated in the
design of this research did not occur until the spring of 1987. The Harris
and Hunter sinkholes are located in open pasture land on Kiger Hill and are
developed in the Beekmantown Formation on an anticlinal fold. The Harris
sinkhole collapsed during heavy rain in August 1984 and now displays a blind
shaft at its bottom. The Hunter sinkhole is a more shallow subsidence feature
and is located 180 m up-gradient from the Harris site.
Moore sinkholes
26. The Moore sinkhole site is also in open pasture land about I mile
west of Lexington. It is underlain by the Lincolnshire limestone which dis-
plays numerous large sinkholes in the immediate area. The Moore sinkhole "A"
was developed into a farm pond in the 1970's and apparently held water
12

(surface runoff) successfully for several years until leakage failure occurred
around 1980. It has been dry since then, although there is currently another
pond holding water 90 m away (which is not a sinkhole). The Moore sinkhole A
is aligned with other adjacent sinkholes in a northeasterly bearing (along
strike). A small transverse fault (striking E-W) is exposed one-half mile
east of the site. Two other sinkholes (Moore "B" and "C") are located down-
gradient from and close to sinkhole A. These three sinkholes form a related
complex and were monitored for SP, electrical resistivity (ER), and electro-
magnetic conductivity (EM) data beginning in December 1986 to determine the
nature of their relationship and to look for any hydrologic connections
implied by the data.
McHenry sinkholes and cave
27. The McHenry site contains two sinkholes (A and B) and a cave named
Whose Hole. This area is located at the base of Little Camp Mountain (local
relief is 450 m) in the Lincolnshire limestone. The structure here is com-
plex, consisting of a series of small, compressed folds and minor faulting.
Whose Hole Cave contains a permanent stream which flows northeast, along
strike, for 0.4 km to discharge at a spring immediately below sinkhole B.
Sinkhole B is developed in the trough of a small syncline and contains a rela-
tively recently collapsed blind shaft (although no connection can be made here
into the cave passage that is presumed to underlie it). A fluorescent dye
trace established the hydrologic connection between the cave stream and the
spring at sinkhole B. Sinkhole A at the McHenry site is located between the
cave and sinkhole B. It is a shallow but well defined feature and contains
good exposures of bedrock that suggest that a fault cuts through this sink-
hole. An intermittent stream course is adjacent to the sinkhole entrance of
Whose Hole Cave and trends easterly to join the stream that flows from the
spring discharge of the cave. A long-term electrode monitoring station has
been installed across this normally dry streambed at a point 270 m east of the
cave entrance. All of the McHenry sites are in pasture land except for the
cave site which is wooded.
Spring Branch sinking stream
28. One of the sinking stream sites is located on Spring Branch about
1.6 km east of the McHenry site. The Spring Branch site is also developed in
the Lincolnshire limestone. This is technically a loosing stream in that nor-
mally only a portion of the flow in Spring Branch is lost underground here
13
through a series of four or five enlarged joints in the bed and bank of the
stream. However, between July 1986 and January 1987, the entire flow of
Spring Branch was lost underground because of the low flow levels resulting
from drought. A thrust fault runs parallel to Spring Branch and has been sug-
gested as a plausible cause of the watershed piracy that has been observed in
the area (Johnson 1980 and MacMillan 1980). It is likely that the Spring
Branch site is related to this fault and that the water lost from Spring
Branch is diverted to another watershed (South Buffalo Creek).
Ford site's sinking stream
29. The Ford site is another example of a sinking stream; overflow from
a spring is lost into solutional fissures in a rocky streambed 1 km west of
Lexington. This site is underlain by Lincolnshire limestone as well. The
extreme surface rockiness and numerous sinkholes nearby suggest a high degree
of solutional weathering has taken place here. During very heavy precipita-
tion some of the water continues beyond the normal point of loss for about
45 m to the entrance of a small cave passage where it is finally lost to
underground channels.
Research Methodology
30. An array of electrodes was installed at each site and monitored for
SP over a period of months. A double ring concentric configuration was used
for sinkholes and a rectilinear grid pattern was used at sinking stream sites
and as a tracking array between sinkholes. Electrodes were numbered with ref-
erence to the compass so that spatial patterns of anomalies could be related
to other directional features (such as geologic structure, stream flow direc-
tions, etc.). A reference electrode was located at least 25 m distant from
the test electrodes in a direction up-surface elevation gradient from the
array. Some sites received two or more reference electrodes (for instance, in
the center of a sinkhole) as a check on the results.
31. SP values were read for each site at approximately weekly inter-
vals, with special attention following precipitation events. Although SP val-
ues for electrodes varied considerably over time, the relationship between
electrodes remained constant (i.e., the strongly negative anomalies were
always in the same location). The locations of consistently anomalous elec-
trodes were presumed to represent areas of concentrated ground-water flow
14

(maximum streaming potential). SP readings were taken with a high impedance
digital voltmeter by connecting wire leads between the reference electrode
(always common, or ground, for polarity convention) and each test electrode.
SP values ranged between +400 and -500 mv and were steady while reading (fluc-
tuating only one or two my).
32. Other types of data were collected to confirm interpretation of SP
anomalies as areas of increased ground-water flow. Electrical resistivity
(both Wenner and Lee arrays) and electromagnetic conductivity surveys were
conducted at the Moore and cave sites to provide an alternate geophysical
interpretation of parameters such as anisotropy and permeability. Precipita-
tion (from rain gages) and soil temperature data (by thermometer and thermo-
couple probes) were recorded for each site. Fluctuations in stream levels
were determined by constructing weirs above sinking stream sites and from a
float/electrical resistance device in the cave stream. In addition, visual
observation of surface runoff patterns along with geological study of nearby
outcrops provided clues for interpreting subsurface conditions and related SP
effects.
33. The electrodes used were copper-clad steel rods, 2 cm in diameter
and 60 cm in length, and were driven into the ground about 50 cm. This type
of electrode was successfully used to detect SP anomalies over zones of leak-
age in dams by the Corps of Engineers (results were confirmed by both drill-
ing and other geophysical methods). This is a departure from the traditional
technique of using nonpolarizing (NP) SP electrodes. NP electrodes are com-
monly employed in mineral and geothermal surveys and in corrosion control
applications. NP electrodes consist of a copper rod immersed in a saturated
solution of copper sulphate with a porous ceramic tip that allows ionic dif-
fusion and electrical contact between the soil and electrolyte. The purpose
of this design is to eliminate the effects of local polarization (concentra-
tion cells) that may occur on metallic electrode surfaces.
34. Although the use of metal electrodes does introduce some local
polarization effects into SP data, it appears that they are effective in long-
term monitoring of streaming potential and that polarization effects are mini-
mal and tend to be averaged out. The NP electrodes would be preferable for
instant readings of one-time surveys over large areas and for applications
where anomalies are small and accuracy requirements are great. For use in
small areas of uniform geologic setting, metal electrodes are apparently
15
adequate for long-term monitoring of large-scale anomalies and systematic
changes in SP. A process of equilibrium occurs for metal electrodes after
being placed in the ground; the time required for this may vary from 1 day to
I week. SP values become relatively stable when this equilibrium of polari-
zation effects takes place. The polarization equilibrium process for several
test site electrodes is recorded in Figure 3. Adequate time should be allowed
before reading SP values after initial electrode placement. Electrodes are
then left in place for as long as needed. Polarization effects are further
minimized because the high internal resistance of the metres that are used
allows practically no current flow to occur. The use of a bimetallic elec-
trode (copper-clad steel) may be advantageous in that the exposed steel tip
acts as a sacrificial anode, thereby reducing corrosion and polarization
effects on the copper sheath. The advantages of metal electrodes over the NP
electrodes are their low cost, ease of placement and use, and durability. NP
electrodes were used to verify the results obtained from metal electrodes at
some of the sites in this research. The actual SP values were different, but
in most cases there was general agreement of relative values between electrode
locations (lowest values were in the same places, etc.).
35. In addition to the manual collection of data with voltmeters, an
automated data collection system was devised and implemented. This system
consisted of a portable battery powered computer, an analog/digital signal
converter interface and temperature/soil moisture sensors. The entire system
was housed in a weatherproof case and could be left in the field and pro-
grammed to gather data at any desired frequency. The metal electrodes were
wired directly to the signal inputs of the interface. The automated data col-
lection (ADC) system was used for two tasks--to monitor the effects of envi-
ronmental variables on SP over time and to monitor SP changes induced by the
artificial recharge (dumping) of water into a sinkhole. The long-term moni-
toring of electrode behavior was conducted at the intermittent streambed site
east of the cave on the McHenry site. The water dumping experiment took place
at the Moore sinkhole A near Lexington. An example of the ADC record from the
long-term monitoring is shown in Table 1, and from the water dumping test in
Table 2.
36. Two water dump tests were conducted--4 and 18 October 1986. For
both tests 15,900 Z of water were discharged into the center of the sinkhole
from four trucks over a period of several minutes. SP measurements were taken
16
before, during, and after the dumping, both by voltmeter and by the ADC sys-
tem. The purpose of this test was to look for SP response to the flow of a
known amount of water into the sinkhole system, with the hope that SP changes
could be related to flow rate in a soil-regolith recharge setting.
37. Other experiments aimed at understanding SP changes relative to
ground-water flow were conducted at Whose Hole Cave on the McHenry site. The
cave was accurately surveyed, and electrodes were placed on the surface at
locations that could be related to underlying cave features. A weir was con-
structed across the cave stream and a flow measuring device was installed and
wired to the surface so that stream level changes could be conveniently moni-
tored. This device consisted of a float attached to a potentiometer; changes
in float height could then be detected as a linear change of resistance and
calibrated in relation to water levels at the weir.
38. An array of electrodes was installed on the surface in rows perpen-
dicular to the cave stream passage at a point directly above the weir loca-
tion. The vertical distance from the center of this array to the cave stream
was calculated to be 25 m. In addition, a ring of electrodes was placed
around the sinkhole entrance to the cave so that SP data could be related to
underlying cave features at depths ranging from 10 to 20 m. An initial ring
of 12 electrodes was used from September to December, 1986, after which the
standard double ring of 32 electrodes was installed in the sinkhole. In
December 1986 an EM conductivity survey was conducted at this sinkhole using
intercoil spacings of 10 m.
39. For all the sites, the SP data show considerable variability as
seen in the standard deviations of individual electrode readings. Although
the relative values between electrodes remain fairly constant, it is difficult
to interpret meaningful trends from masses of variable numbers. Others have
attempted to gain better resolution in their data by determining and removing
a mean regional SP value (Cooper 1983). The mean regional SP is determined by
averaging all the SP values for a given reading and subtracting this value
from each individual value for that date.
40. The present research suggests that the time varying influence of
temperature and moisture introduces systematic shifts in the SP data. This
influence can mask or exaggerate the streaming potential values. An effort
was made to filter the data by using ranks to preserve the ability of the data
to document negative anomalies and variability while removing the seemingly
17
erratic swings in the raw data. Negative readings are shown as low rankings
and positive readings are shown as high rankings (Erchul 1987). The major
advantage is the removal of systematic changes in the data. The major disad-
vantage is the insensitivity to factors which exaggerate scale. A more nega-
tive reading due to increased ground-water flow is not visible in the ranked
data until one reading passes another. A comparison of the spatial patterns
of SP anomalies calculated by both averaging and ranking shows that no signif-
icant difference is obtained. This suggests that the use of averaging may be
adequate for plotting SP values to infer flow paths and that systematic data
changes of whatever source are cancelled by averaging. Further refinements in
quantifying SP data for use in flow rate studies, however, will probably
necessitate development of additional statistical treatment.
18

PART III: RESULTS AND DISCUSSION
Evaluating and Comparing SP Results
41. This research set out to examine several basic questions by evalu-
ating and comparing SP results from various sites having different character-
istics. Of primary concern are the following issues:
a. How effective is SP in detecting flow paths in karst features?
b. Are detected anomalies characterized by percolation and seepage
flow or by fracture-conduit flow?
c. Can SP results be related to flow rates?
d. What is the relationship between SP variations and environ-mental variables?
42. At every site significant SP anomalies have been measured. These
anomalies differ by as much as an order of magnitude from the SP values of the
surrounding electrodes, and their locations remain fixed within the electrode
array space. The magnitudes vary with time, but the relative values between
electrodes remain fairly consistent. At the Harris and Hunter sinkholes,
anomalies were linked and used to infer flow paths within and between the two
sinkholes over a distance of 180 m (Erchul 1987). The plotted SP values were
calculated by averaging all readings for each date and also by ranking the
data (lowest reading electrode for a given date equal to one, etc.). For pur-
poses of plotting the values to infer flow paths, the spatial relationships
produced by these two methods of calculation do not differ signIficantly
(i.e., the anomalies do not change relative to each other, and connecting them
creates the same flow paths). At the Harris and Hunter site, the flow paths
are aligned with the geologic strike of the underlying bedrock (N 500 E) and
with joint or fracture orientations perpendicular to the strike. An electri-
cal resistivity survey showed anisotropy in the form of an ellipse oriented in
the strike direction, also. In addition, nearby caves (there are five within
1.5 km of the site) are predominately strike controlled in their passage
development (Figure 4). It is reasonable to assume that the flow paths
inferred by the SP data at the Harris and Hunter site represent strike and
offset joint control that has created areas of preferential water movement.
Figure 5 shows electrode arrays and inferred flow paths at the Harris and
Hunter sinkholes (Erchul 1987).
19

Spring Branch site results
43. The Spring Branch site was selected because it is a sinking stream
ar.: appears to be related to a fault that may divert ground water out of the
watershed. A grid array of electrodes spaced on 7.5-m centers was placed on
the hillside above the point of stream loss (swallet). A weir was constructed
above the swallet to measure fluctuations in flow. An experiment was con-
ducted with two reference electrodes at this site. The results are shown in
Figure 6 and indicate excellent agreement between SP values for all elec-
trodes. Data were collected weekly for about 3 months and used to calcu]ate
average SP values. Figure 7 shows the Spring Branch site with the electrode
array and an SP (mv) contour map. Anomalous areas are identifiable as concen-
trations of contours (areas of maximum SP gradient). The bedrock here strikes
northeast and dips 150 SE. The stream sinks into a solutionally enlarged
joint striking SE (direction of dip) which coincides with the orientation of
the zone of maximum SP gradient. The contours indicate preferential water
movement in this southeasterly direction and also to the east. From examina-
tion of outcrops exposed along the streambed, a set of joints has been mea-
sured striking N 850 E. The two linear trends displayed on the SP contour map
and marked B-B and C-C are interpreted as ground-water flow paths based on
observation of outcrop features (dip and joint strikes being the dominant
structural controls). No physical evidence of faulting is displayed at the
site, but the geologic map (Spencer 1968) indicates a low angle thrust fault
in the vicinity, dipping east. MacMillan (1980) and Johnson (1980) have iden-
tified this fault and this portion of Spring Branch as the most likely source
of watershed loss into the adjacent watershed to the east. The SP data appear
to confirm this interpretation by indicating a major anomalous zone below the
swallet. This could be the point where the fault captures the water lost from
Spring Branch.
44. Since the water from Spring Branch is lost into solutional chan-
nels, this site should provide some indication of SP ability to detect chan-
nelized flow. Averages were calculated for the western half of the electrode
array (upstream of the swallet) and for the eastern half (downstream of the
swallet). The results are shown in Figure 8, along with a record of stream
flow and precipitation. The SP values for the eastern half of the array are
more negative than the western half, indicating that those electrodes down-
gradient of the swallet may be measuring increased streaming potential because
20

of channelized flow below them. The entire array is located on a uniformly
north sloping hillside with no obvious differences between the two halves. It
can also be seen from Figure 8 that SP becomes more negative in response to
either precipitation (soil moisture) and/or streamflow. Figure 9 depicts evi-
dence for SP generation because of the nonchannelized flow at Spring Branch
for those electrodes nearest the streambed. The SP data for the two dates
shown indicate a negative shift of about 200 mv at electrodes Nos. 31, 4a, and
5a during a period of increased streamflow. These electrodes are only about
5 m from the bed of the stream. On 10 October the streambed below the swallet
was dry (all the flow was going into the swallet) but on 2 November the added
flow caused the swallet to overflow and this additional water was absorbed
into the sediments of the streambed for a distance of 25 m below the swallet.
This seepage flow through the streambed sediments probably caused an increased
streaming potential that is represented by the negative shift in those
streamside electrodes as depicted in Figure 9. A similar negative SP response
was measured at an electrode of the long-term monitoring site whenever the
normally dry streambed would carry water following heavy rains.
Ford site results
45. The Ford site is a sinking stream also, although no faulting is
known to occur here. Overflow from a spring development for livestock, along
with intermittent surface water runoff, is lost into solutional openings at
the head of a small steep-sided valley. Flood flow produces more water than
can be taken by the swallet and the excess is carried 25 m beyond to the
entrance of a small cave (a single conduit 7 m in length). Figure 10 shows a
map of the Ford site with electrode array and SP values plotted as millivolt
contours. Data for this site does not seem to depict a linear flow path. The
greatest anomaly is on a line connecting the swallet and overflow cave, and
this line coincides with the direction of strike (northeast). Streamflow
(from a weir above the swallet), soil temperature, and average SP for the
array are recorded, for the period June - November, along with SP for elec-
trode No. 9 (the greatest anomaly) in Figure 11. There is no obvious cor-
relation here between streamflow and SP. Soil temperature has a direct effect
on array average SP at times (the month of August, especially), but at other
times this relationship seems less direct, probably the result of precipita-
tion events interacting with temperature change. The response of the anoma-
lous electrode No. 9 differs from the response of the array average,
21

indicating that No. 9 reacts differently to environmental changes or to other
unknown factor(s) that may influence this anomalous zone but not the surround-
ing electrodes. It may be that the anomaly at electrode No. 9 represents a
site where ground water is descending vertically rather than flowing later-
ally. Vertical shafts are not unusual in karst aquifers and are a principal
element in the epikarst model (subcutaneous zone) of Williams (1983) and White
(1977). It is reasonable to assume the existence of vertical ground-water
movement at the Ford site because:
a. The base level (Maury River) is 40 m lower than the Ford site.
b. There are no known major springs or resurgences between theswallet and the Maury River (a distance of 2.4 km).
c. The lithology of the site, and terrain between the site and theMaury River, is soluble carbonates with no perching beds oraquicludes.
46. An examination of the SP data collected at both of the sinking
stream sites (Tables 3 and 4) shows an interesting seasonal trend which is not
evident at any of the other study sites. At both the Spring Branch and Ford
sites the SP values trend from largely negative in the summer and fall (July
to November) to almost entirely positive for the period December through
April. The period July to November corresponds to the severe drought which
began to cease with the return of significant rainfall in December. The only
other site to show a pronounced reaction to the drought was the sinkhole
entrance to Whose Hole Cave, but here the SP response was exactly opposite
(positive during the drought and negative in response to returning normal rain
and ground-water flow). The fact that the sinking stream sites show this
apparently unique reaction may indicate that conduit flow is playing a role in
SP values here, but we do not have an explanation for this phenomenon at this
time. It is difficult to say why the transition from a severe drought to nor-
mal "wetter" weather would cause such wholesale systematic shifts in SP from
negative to positive values.
McHenry site results
47. The McHenry site contains two sinkholes, a cave with a stream in
it, a spring (resurgence of the cave stream), and a typical dry karst (inter-
mittent) surface stream course. All of these features are wiLhin 0.4 km of
each other in an area of complex geologic structure (Figure 12). The McHenry
sinkholes A and B were monitored for SP changes from July to November
22

(Tables 5 and 6). Figure 12 shows the spatial relationship between the two
sinkholes and the spring. Sinkhole A is located about 15 m higher than sink-
hole B, in a direction generally up-dip (to the southeast). The spring
emerges from the base of a steep slope about 10 m lower than sinkhole B. The
flow of ground water can be assumed to be from A to B to the spring. SP data
for sinkhole A is shown as millivolt contours in Figure 13. The strongly
anomalous zone in the southeast quadrant corresponds to a fault that is
exposed in bedrock ledges outcropping here. The linear trend of these con-
toured anomalies is oriented to the northwest in the direction of sinkhole B.
In Figure 14, the fault-related anomalous zone in sinkhole A is shown to have
an equal effect on both the inner and outer rings of electrodes implying that
at least some flow is lateral (towards sinkhole B and the spring). The milli-
volt contour map for sinkhole B (Figure 15) exhibits two main anomalous zones.
The anomaly in the southeast quadrant probably represents the flow path of
water coming from the direction of sinkhole A. The largest anomalous zone, in
the northeast quadrant, represents the outflow of water from sinkhole B toward
the spring. This assumption is supported by observation of outcrops; the
spring emerges from the trough of a small synclinal fold. Ground water in the
vicinity of sinkhole B would therefore flow down-dip on either limb of the
syncline and would have to exit along the axis of the synclinal trough. The
SP results from McHenry sinkholes A and B exhibit especially strong anomalous
zones that demonstrate a linear pattern of connections. The fortuitous expo-
sure of outcrops in the vicinity helps to confirm these interpretations of
flow paths.
48. During the course of monitoring these sinkholes, the phenomena of
short-term anomalies were observed at both sinkholes. In both cases, the
events occurred between mid-August and mid-October. Figure 16 shows an SP
increase of 500 my for two electrodes at sinkhole A (these two electrodes were
unique in this behavior at A). At sinkhole B only one electrode (No. 21)
exhibited a similar SP increase over this time period. These phenomena have
not been observed at any of the other sites during this research. It is pos-
sible that these dramatic but short-term events were related to the condi-
tions of extreme drought that prevailed at the time. The Palmer Index for the
end of September showed all regions of the state in severe drought, according
to the Virginia Water News (Vol 17, No. 10, p 6). Precipitation at the
McHenry site totalled only 13.7 cm between 21 July and 13 October. Figure 17
23

depicts SP changes at sinkhole A. The short-term anomalies at electrodes
Nos. 26 and 29 can be seen in the west and southwest quadrant from 17 and
23 September. On 14 October there was 1.3 cm of rain, which eliminated these
two anomalies. On 19 October, after drying out, these two electrodes again
became negative, but not to the extremes reached previously. These short-term
anomalies occur in outer ring electrodes and apparently are not reflected by
corresponding changes in the inner ring of electrodes. They probably repre-
sent vertical flow or seepage of soil moisture into fractures. To sustain
base flow of ground water at the spring (its output was relatively unaffected
by the drought), water that is tightly held in fractures and soil pores is
pulled downward into conduits and channels as the more accessible storage
water is exhausted from the ground. This supply of ground water, that is oth-
erwise tightly held in storage by capillary forces, would likely generate high
streaming potentials when flowing through very small fractures (or sediment-
filled fissures). Perhaps the reason this effect was observed at the McHenry
sinkholes is because they are close to base level discharge (the spring);
whereas, all the other sites are areas of ground-water recharge. During
extreme drought, areas near a spring may be subjected to conditions that make
extraordinary demands on ground water held in storage, and this could create
ephemeral anomalies that reflect temporary areas of preferential flow.
Whose Hole Cave results
49. At Whose Hole Cave three different arrays of electrodes were
emplaced. A ring of 12 electrodes was placed in the sinkhole containing the
cave entrance (Table 7), and three rows of ten electrodes were placed directly
above that portion of the cave containing the stream (Table 8). An array of
32 electrodes (two concentric rings of 16 each) was emplaced in December 1986
(Table 9). Figure 18 is a map showing the 360 m of passage that have been
surveyed and the relationship of the electrode arrays to the underlying cave
passages. Passages are strike controlled and trend to the northeast toward
the Mcenry sinkholes A and B. The stream inside the cave has been dyed to
establish its connection to the spring at sinkhole B. A weir and water level
measuring device (float attached to a potentiometer) provided streamflow data
for the cave stream. Streamflow could not be related to SP changes at the
array of electrodes over the stream passage. This may be due to the depth of
25 m or to the relatively small stream (flows ranging from 0.002 m/sec to
0.0! m/sec) or to the lack of sand-sized sediment in the fill within the cave
24
(mostly clay and gravels). A profile of average SP for the array over the
stream passage is shown in Figure 19. One might expect an anomalously nega-
tive area directly above the cave. In this case the reverse Is observed--the
positive SP values being over the cave. The two negative anomalies seen on
either side of the array are unexpected. The anomaly at electrodes Nos. 2 and
3 may be the result of the intersection of a joint or fault plane with the
surface here. Such a plane would allow preferential movement of water that
would generate high SP values. As can be seen in Figure 19, this plane is
exposed as a wall in the cave passage. The cave contains numerous tube-like
features that incline at similar angles and which serve as conduits for
descending trickles of water. The anomaly at electrodes Nos. 7 and 8 cannot
be explained. Perhaps another joint or fault that is unknown intersects the
surface here. The implications of this data are that SP results in karst
areas of structural complexity must be interpreted very critically with regard
to underlying structure. The effect of inclined planes on preferential water
movement may mean that the location of SP anomalies is offset from underlying
cavities or features of interest. This research suggests that SP results over
Whose Hole Cave are related to soil water percolating downward into planes of
greater permeability and preferential flow rather than to the flow of the
vadose cave stream. This result is consistent with SP theory as expressed In
the literature.
50. SP results from the sinkhole entrance to the cave can be related to
underlying cave features. Plan views of this portion of the cave with the
associated electrode arrays are given in Figures 20 and 21. For Figure 20,
with an array of 12 electrodes, the anomalous electrodes are Nos. 1, 2, 3, 9,
and 12, while all other electrodes have positive SP values. The anomalous
electrodes are located above cave passages where ground water seeps through
sediment fill (silty clay and gravel deposits) or above steeply inclined nar-
row fissures which channel downward percolating soil water into the cave.
These vertical fissures and tubes are relatively high in the cave and extend
upward in proximity to the surface (especially electrode Nos. I and 3). The
values for electrodes Nos. 9 and 12 are probably explained by the fact that
the passage between them contains a pool of water during wet weather that is
created by a natural "dam" of sediments and breakdown. Water in the pool
percolates slowly through the permeable material in the dam, moving from the
vicinity of electrode No. 9 toward electrode No. 12. This direction of
25

flow can be observed in the cave but is also confirmed by the consistently
greater SP values at electrode No. 12 than at electrode No. 9. During dry
weather there is little or no water feeding into this area and the pool disap-
pears. Water percolating through this dam of sediment would probably generate
large streaming potentials. The series of SP contour maps shown in Fig-
ures 22, 23, and 24 all indicate major anomalous zones within the northeast
quadrant of the array. Also, the contour map of EM conductivity (Figure 25)
shows the northeast quadrant as the principal EM anomaly. The cave passages
under this area are high, narrow fissures that are close to the ground surface
serve as zones of preferential ground-water movement. When the EM conductiv-
ity survey was conducted in December 1986, soil moisture content was fairly
high. It is probable that the soil near the tops of these fissure passages
(and the soil and sediment filling the fracture systems feeding these fis-
sures) was saturated to a greater extent than the surrounding soil. There-
fore, this zone of greater saturation would be more conductive and would
produce the conductivity anomaly scen in Figure 25. Similarly, the percola-
tion of water in this area would generate anomalous streaming potentials also.
51. A temporal effect on SP can be seen in Figure 26. SP values for
the 12 electrodes around the entrance sinkhole are profiled for each reading
date, from September through November. The desiccating effects of drought are
reflected as a gradual shift of SP values from negative to positive. The mid-
dle of October showed all positive values (the anomalous spikes have even been
lost) which correspond to maximum drought conditions. In late October, as
some rain began to return and vegetation became dormant, moisture was
recharged to the ground, and the SP profiles began to shift back toward nega-
tive (with the anomalous peaks returning). In early November, conditions of
increasing seepage were observed in the cave around electrodes Nos. 3 and 9.
The data presented in Figure 26 appear to portray a direct relationship
between drought-induced desiccation effects, the return of more moisture, and
SP values. Although electrodes Nos. 7 and 8 were located over cave passage,
they had a consistent positive value. This was probably because their pas-
sages were relatively deeper than those areas beneath the anomalous electrodes
(about 20 m as opposed to 5 m). Also, even though there is water flowing near
electrodes Nos. 7 and 8, it is a relatively small quantity and the flow is
over bare rock and travertine deposits (a condition that would not be likely
to generate appreciable streaming potentials). At this site then, the SP
26

anomalies are in areas where ground water percolates through a sediment dam or
plug and around high vertical fissures and tubes that approach the surface and
serve as channels to concentrate the entry and downward seepage of moisture
from the soil and epikarst into the cave passages below. Passages about
15 to 20 m deep with water flowing over rock or travertine do not appear as SP
anomalies.
Time Varying Effects on SP Results
52. The time varying effects of soil temperature and precipitation on
SP values have been observed at all the study sites. It is difficult to char-
acterize the exact response of a given site or electrode to these changing
stimuli as the reactions sometimes appear contradictory or erratic because of
an interactive effect of these variables. There may be other factors influ-
encing SP values as well, further complicating the detection of cause and
effect. Such factors would include physical and chemical properties of soil,
depth to bedrock, relief, vegetation, aspect of the site, and seasonal cli-
matic changes. The fluctuations imposed by these factors constitute signal
noise that can mask or exaggerate the streaming potential effects that are
being sought. Not only do the various sites respond differently to changing
environmental factors, but individual electrodes within a given array can
respond differently, as seen in Figure 27. Here the mixed reactions of
four electrodes to 3.4 cm of rain are shown. It may be that such behavior is
attributable to the extreme drought conditions that existed during the study
period, and that during periods of more normal soil moisture the SP responses
are more predictable.
53. Soil moisture is a critical parameter to consider, along with pre-
cipitation, as it can be related to soil saturation conditions and the lag
times between precipitation events and SP values. Soil moisture data also
compensate for the effects of vegetation types and activity on infiltration of
precipitation. In general, increased soil moisture causes an SP increase
(values become more negative), presumably resulting from a greater streaming
potential as the water percolates through the soil and regolith. Figure 28
illustrates this reaction for two test electrodes. A sharp increase in soil
moisture produced an SP change of grater than 100 mv in the negative direc-
tion, but this occurred about 18 hr after the rain began. It can also be seen
27

that the SP returns to its former value very gradually over a period of days.
However, depending on the degree of saturation, some precipitation events may
produce relatively minor SP changes or may even result in a positive change of
value.
54. The time varying influence of temperature also changes SP values.
Thermocouple probes that produce a digital reading on a voltmeter have been
used to measure soil temperature at a depth of about 15 cm. The tip of the
electrodes are deep enough to be at a constant or slowly changing temperature;
whereas, the exposed and near-surface area is subject to fluctuations of up to
100 C. A diurnal cycle in the SP values has been observed that corresponds to
the warming and cooling effect of the surface soil. This effect is more pro-
nounced when soil moisture is at low levels, as can be seen in Figure 28.
Similarly, greater daily temperature extremes produce a larger SP cyclic
change. If the exposed portion of the electrode is warmed by the sun, partic-
ularly on cold mornings, a large SP change can result from the thermocouple
effect. Such changes are systematic and affect the SP values relatively uni-
formly for a site. An SP change of 50 mv has been observed for frosty morn-
ings followed by sunny days that produced a surface soil temperature range of
40 C and an air temperature range of 160 C. Temperature effects on SP are not
yet fully understood, as evidenced by the observation that at some sites SP
increases as temperature increases, and at other sites SP decreases as temper-
ature increases. More work needs to be done to understand the complex inter-
action between temperature, moisture, SP, and other factors which may be site
specific.
55. Until such effects can be isolated and predictably quantified,
using SP results based on averages of many readings may be the only practical
approach for describing the general response of a site to variables. To
understand the nature of individual electrode responses to processes affecting
it, long-term accurate monitoring is required. At the long-term monitoring
site, data were collected from 1 August 1986 to 8 October 1986 using volt-
meters and thermometers (Tables 10, 11, 12, and 13). Data at this site were
collected automatically by the ADC system from 8 October 1986 to 11 May 1987
(Tables 14-19). The automatic data collection system described previously has
great potential for such application. Temperature and moisture sensors can be
placed in the ground and data can be sampled at rates adequate for detecting
subtle changes. The data presented in Figures 28 and 29 were recorded with
28
zmmma. m m mi IIN m ~ lii

the ADC at the electrode monitoring site (dry stream bed below Whose Hole
Cave). From Figure 28, the data show soil moisture responding to diurnal
temperature cycles, but the SP record does not show a similar response when
moisture levels are high. Also, when soil moisture is high, the SP changes,
as a result of additional precipitation, are lessened by a factor of about two
(60-mv change on 5 November as opposed to 140-mv change on 25 October) com-
pared with dry soil conditions.
56. During the eight month period that the ADC system was used to mea-
sure SP at the five electrodes of the long-term monitoring site, electrode
No. 5 was the only electrode that was always negative. The location of elec-
trode No. 5 did not seem to be any different from the other electrodes except
that the soil there appeared to have more clay. Consequently, soil samples
were taken by coring beside each of the five electrodes, and a particle-sized
distribution was determined by sieve and hydrometer analysis. The resulting
gradation curves are shown in Figure 30 and it can be seen that the soil at
electrode No. 5 does indeed contain appreciably more clay than the other elec-
trodes. The coarsest material is the gravelly soil from the streambed at
electrode No. 3 (which was positive when dry and negative when the intermit-
tent stream flowed). The relationship between high clay content and negative
SP, as shown by electrode No. 5, is of interest because this seems to contra-
dict the SP literature, which reports positive charges associated with clay
and negative streaming potentials associated with sand-sized particles.
Although this is only one data point represented here, it seems to be sup-
ported by subjective observations in the field. While pulling electrodes from
the ground at various sites, many electrodes that had been consistently anoma-
lous (negative) were very difficult to extract because of their being in a
sticky, plastic clay. It may be that the greatest negative anomalies in karst
terrain are not a result of streaming potentials in sand-sized material but,
instead, are from ionic charges or membrane activity in clay minerals. The
mineralogy of carbonate residual soils could have a drastically different SP
effect than that of soils derived from siliceous lithologies, and would there-
fore impose different criteria for interpreting ground-water flow regimes from
SP data. Also, the surficial aspect of a short electrode stuck into a high
clay content soil ought to be considered. If the clay overlaid a sandy sub-
soil or permeable regolith through which ground water was flowing, it could be
possible that the ionic charges associated with the clay could mask or amplify
29
any streaming potential charges produced at a greater depth. The vertical
aspect of SP phenomena is an area that needs to be explored, along with the
other factors previously mentioned.
Sinkhole Artificial Recharge Investigations
57. Since the Moore sinkhole A was an unsuccessful pond site, it pre-
sumably contains one or more leakages and would therefore be an ideal place to
conduct an experiment in detecting flow paths and rates. An array of 32 elec-
trodes (two concentric rings with diameter of 15 and 45 m) was installed. SP
data were collected by voltmeter (Table 20). Two separate tests were then
conducted. For each test, water trucks discharged a total of 15,900 1 into
the sinkhole over a period of 4 to 5 min. SP was monitored before, during,
and after the discharge, both by the ADC system and manually by voltmeters.
58. Both the water-dumping tests were successful in demonstrating that
a negative SP shift occurred in response to the water draining through the
sinkhole and that the greatest SP anomaly occurred around the same electrode
(No. 3) on both occasions. Although moisture and temperature conditions dif-
fered for the two tests, the No. 3 electrode produced a strong anomaly in SP
both times, as shown in Figure 31. Since electrode No. 3 is located on the
inner ring of electrodes, one could expect the opposite electrode in the outer
ring (No. 19) to also show a peak if the flow is outward in a lateral plane.
Since this is not the case, it appears that the water was descending vertl-
cally in the vicinity of No. 3, and was not reaching the outer ring of
electrodes.
59. For the first test on 4 October 1986, the ground was extremely dry
from drought conditions (the preceding 2 months had received only 8 cm of
rain, with no rain at all for the month before the test). Diurnal temperature
swings were not great at that time. The discharged water ponded in the bottom
of the sinkhole to a depth of about 10 cm and took 70 min to be absorbed.
This represents a percolation rate of roughly 227 £/min over an area of about
177 m 2. The induced SP changes are shown as a polar plot in Figure 32. Elec-
trode No. 3 experienced an SP change of about 200 my and goes off the scale
compared with the relatively smaller changes of the other electrodes (ranging
from 0 to 32 my). The time required to reach the maximum change varied from
2 to 24 hr for the various electrodes.
30

60. During the first test, the water was dumped in the northeast quad-
rant of the sinkhole and during the discharge process water flowed over elec-
trodes Nos. 1, 2, and 3. Their response was immediate, as can be seen by the
charts in Figure 33. This illustrates the initial response to wetting which
occurs in a matter of seconds. The sudden sharp negative increase followed by
a sharp positive shift is probably the "moto-electric" effect that is
described by Ogilvy, Ayed, and Bogoslovsky (1969). This effect arises when a
metallic electrode is washed by the streaming potential fluid (water, in this
case), which causes a negative SP shift, the magnitude of which is a function
of the metal. Copper is given a value of -26 my, which is about the same
value as the recovery period (positive shift) seen for electrode No. 3. Like-
wise, electrode No. 2 went from an initial value of -8 mv to one of +25 mv (a
total of 33 mv change due to moto-electric effect) before settling into a
steady negative increase.
61. The second test was conducted 2 weeks later on 18 October 1986.
The soil was more moist than during the first test, since 1.8 cm of rain had
fallen 4 days before. Temperature extremes were much greater because of heavy
frost followed by clear sunny days. Figure 34 illustrates the temperature
ranges of 160 C for air and 40 C for surface soil. The corresponding plots of
SP values show a pronounced diurnal cycle because of the influence of tempera-
ture. This effect produced a change in SP of more than 50 mv in a systematic
fashion that served to mask the subtle SP changes that may have been induced
by the water discharge, with the exception of electrode No. 3. Preferential
water movement at electrode No. 3 was again implied by the anomalous SP change
of 94 my, nearly twice the value of all the other electrodes. A polar plot of
the change in SP for the second test is nearly circular with the exception of
a peak at No. 3. For the second test, the water was discharged from the
northwest side of the sinkhole so that electrode No. 3 would not be directly
wetted as occurred during the first test. Data were collected by the ADC sys-
tem for a day following the test, and, as seen in Figure 34, it discloses the
presence of the diurnal temperature cycle influencing the SP values in a
nearly identical manner for both days. The anomalous behavior of electrode
No. 3 to the water discharge tests is also evident from the SP record shown in
Figure 35. Both tests produced significant negative shifts at No. 3, but only
produced a relatively minor negative shift for the array average SP.
31

62. During the second test it took 165 min for the 15,900 £ of water to
percolate down into the soil, a rate of 95 2/mmn for the same area as in
test 1. This slower rate was presumably because of the greater moisture con-
tent of the soil during the second test. Although flow rates for the second
test are less than half the value during the first test, it is difficult to
equate the figures to SP changes because of the large systematic influence of
temperature that masked most of the SP data. However, it is interesting to
note the correspondence between SP change of electrode No. 3 and the flow rate
estimates--a ratio of about 2:1 in both cases:
Flow Rates ASP (my)
(/mn) No. 3
Test 1 227 194
Test 2 95 94
63. From Figure 32 it can be seen that the location of electrode No. 3
is in the northeastern quadrant of the sinkhole. This is on the down-gradient
side of the sinkhole, and it is reasonable to assume that water is probably
leaving the sinkhole in this direction, which corresponds to the strike of the
underlying beds. Figure 32 is a polar plot of azimuthal electrical resistiv-
ity data on several dates, showing an ellipse oriented to the northeast also.
This data suggests that resistivity of the subsurface material is greater
along the direction of strike than it is at right angles to the strike. A
possible explanation for this phenomenon may be that proportionally more fis-
sures or conduits are developed in the strike direction (most cave passages in
the area are strike oriented), and these are mainly empty so that the collec-
tive volume of air-filled spaces increases the resistivity. If this model is
correct, the resistivity along the northeast axis should decrease as more
water enters and fills these channels (water being more conductive than air,
of course). This response does take place for the two dates plotted. The
18 October data were collected several hours after the water was discharged
into the sinkhole. The data for 24 October, nearly a week (with no rain)
later, show that resistivity has increased along the northeast axis of the
ellipse, suggesting that some water has drained out of the fissures and
fractures.
64. Following the two water discharge tests in the Moore sinkhole A,
the investigation at this site was expanded to include two other sinkholes
32

(B and C) which are in close proximity (Table 21). The general vicinity is a
complex of sinkholes, and it was hoped that water draining out of sinkhole A
(the highest in elevation of the three) would be detectable as a flow path
leading to either or both of the sinkholes B and C. In addition to SP mea-
surements, an EM conductivity survey was made at the three sinkholes and the
results are shown in Figures 36-39. Sinkholes A and C appear to be more
closely related to one another in terms of conductivity anomalies. As seen in
Figure 39, the anomalous zones of A and C are also related to topographic
expression as well, being clustered at the point where surface water flow
would enter sinkhole A and seep downward in the center of the sinkhole, then
again where surface water would first concentrate in the western limb of sink-
hole C and flow subterraneously out of C to the northeast toward another large
sinkhole. This northeasterly flow direction out of C also corresponds to the
geologic strike. At sinkhole B the conductivity anomaly is located in the
northwest quadrant where a small (2 m) sinkhole occurs on the edge of B. This
anomaly also aligns on the northeast (strike) direction from the nearby pond.
Based on the conductivity data, one could interpret a ground-water drainage or
flow path entering sinkhole A on the west, descending in the center of the
sinkhole and moving eastward to sinkhole C. In sinkhole C the flow then
appears to be directed along strike toward the next sinkhole adjacent to the
northeast. The locational relationships of the three Moore sinkholes are seen
in Figure 40.
65. The SP data from the Moore sinkhole appear to be compatible with
the interpretation based on EM conductivity. Figures 41, 42, and 43 show SP
contours at sinkholes A, B, and C, respectively. These SP data were collected
in early January 1987, a few days after the EM conductivity survey was made in
later December 1986. The SP anomalies largely agree with the conductivity
anomalies so that the same interpretation of a flow path from A to C seem rea-
sonable. In sinkhole B (Figure 42) a very obvious SP anomaly occurs above the
small 2-m sinkhole in the same location as the EM conductivity anomaly of Fig-
ure 37. Since Moore sinkhole A has been monitored for SP for several months
before sinkholes B and C were studied, these data are shown in Figure 44. The
SP anomalies are slightly different for this time period (which occurred dur-
ing the drought), but they still tend to suggest a flow direction from west to
east and toward sinkhole C. All of this data show a relationship between SP
and EM conductivity, and it also suggests a ground-water flow connection
33

between sinkholes A and C. What it does not help explain is the anomalous SP
response of electrode No. 3 in sinkhole A during the two water discharge
tests. This electrode, in the northeast quadrant of sinkhole A, does not
appear anomalous in any of the other SP or EM conductivity data. Perhaps a
combination of the drought conditions that prevailed in October 1986 and the
fact that flow was artificially induced offer some explanation for the
response of electrode No. 3 at that time. More water discharge tests, exca-
vating sinkhole A to bedrock, or penetrometer tests around electrode No. 3 may
be the only way to ascertain what is really happening. Despite this contra-
diction, the bulk of the data from the Moore site suggests that SP anomalies
around sinkholes can be used to infer flow paths, and that EM conductivity
seems to confirm this. These inferred flow paths are probably shallow--within
a 20-m depth, as the EM data at 10 and 20 m agree with the interpretation, but
the 40-m survey appears rather amorphous in this regard.
66. Other results from the long-term monitoring of SP electrodes and
environmental variables are shown in Figures 45-56 and in Tables 13-22. Ini-
tially these data were collected manually (Tables 13, 14, 15) from 1 August
1986 through 8 October 1986, after which the automated data collection (ADC)
system was employed until termination on 11 May 1987. The graphs shown in
Figures 45-56 were generated by computer (Lotus program) using the digital
data collected automatically and do not reflect the time period 1 August -
8 October. Of the five SP electrodes that were monitored, No. 5 was always
negative, No. 4 was always positive, No. 2 began positive but after November
it changed to negative for the remaining monitored time period, and No. 1
varied between negative and positive values over the entire time period.
Electrode No. 3 (Figure 47) was positive as long as the intermittent streambed
in which it was located remained dry, but when the stream flowed temporarily
after heavy rainfall the SP values became negative, as seen in the sharp peaks
in Figure 52. Presumably, these anomalous SP values are a result of streaming
potentials generated by the flow of water through the sediments of the stream
bed. Figure 55 shows standard deviation of electrode No. 3 and the greatest
values here are because of the extreme changes in SP (within a 24-hr period)
as a result of this streaming potential.
67. The five electrodes at the long-term monitoring site were monitored
at sampling rates of one-half hour to 4 hr, and these data have been averaged
over 24 hr to produce the data in Tables 13-22 and Figures 45-56. Changes in
34

standard deviation shown are thus relative to SP variations within a 24-hr
period. Standard deviation and SP change are proportional as seen in Fig-
ure 54. All of the five electrodes show similar SP responses initially
(October), but the first significant rainfall to occur after implanting the
electrodes (1.35 in. on 25 October) caused a major negative shift in all of
them, after which their SP variations were dissimilar. Throughout the 8-month
period, episodes of major rainfall produced marked negative SP responses in
all five electrodes.
68. The effect of soil moisture (Figure 51) on SP response is less
obvious than that of rainfall. Soil moisture was monitored electronically
(the scale in Figure 51 is in relative "digital" units where high values
represent higher moisture content) from a gypsum block sensor buried at 20-cm
depth in the soil. The pattern of soil moisture in Figure 51 is similar to
that of soil temperature (Figure 50), but this may be from a thermal effect
transmitted from wires exposed to atmospheric temperature changes. There are
undoutably lag times between rainfall and soil moisture/SP effects, but these
are not immediately obvious in the data. The extreme fluctuation of soil
moisture data shown in the beginning of Figure 51 is because of artificial
effects produced by dumping water on the sensor to test its performance.
69. Soil temperature seems to play a more direct role in affecting SP
than does soil moisture. Taken alone, soil temperature seems to be inversely
proportional to SP (at this site), as seen in Figure 53. In this figure the
SP record for electrode No. 2 has been inverted and compared with the soil
temperature record. They agree favorably over most of the time period, but
the pattern is reversed under extremely wet conditions as seen in late March
through April. This implies that soil temperature effects are masked or
reversed when soil moisture reaches a threshold level. This emphasizes the
complex interactive nature of environmental variables on SP. Extreme condi-
tions in the environmental variables will override the other factors and domi-
nate or reverse SP responses.
35
PART IV: SUMMARY AND CONCLUSIONS
70. Spontaneous potential has been monitored at a variety of karst fea-
tures for a period of 5-9 months. Significant SP anomalies were measured at
all sites, and are assumed to be due primarily to streaming potentials created
by ground-water flow. The magnitude of SP anomalies and SP changes is related
to ground-water flow rates along with a host of other factors which make
interpretation difficult. Direction of flow is indicated by concentration of
SP gradients. Flow paths are inferred by SP data at all of the sites and seem
especially well defined at the Moore, Spring Branch, McHenry, and Harris
sites. Geologic studies along with electrical resistivity and EM conductivity
surveys support the interpretation of flow paths at these sites.
71. The detected SP anomalies at these sites appear to be due primarily
to water seepage and percolation through porous material rather than conduit
or fracture flow. There is some evidence from Spring Branch for a general
systematic registering of conduit flow from the electrode array, but individ-
ual electrodes could not be related to changing flow regimes. The stream in
Whose Hole Cave could not be detected by the electrodes overhead. SP probably
provides indirect evidence for conduit flow by indicating anomalies produced
by the seepage of water from soil and regolith into small fractures that sup-
ply water to nearby conduits. It seems possible that SP can distinguish
between lateral and vertical flow, as seen at the Ford and Moore sites. SP
was able to detect underlying cave passages at Whose Hole Cave if they were
relatively shallow (5-10 m) and if they contained water seeping through sedi-
ment fill or else intercepted water seepage from the soil and regolith
storage.
72. On the basis of water discharge tests at Moore sinkhole there seems
to be promise of relating flow rates to flow-induced SP changes. At the sites
where conduit flow is known to exist (Spring Branch, Fords, Whose Hole Cave),
it has not been possible to correlate stream flow with SP.
73. The relationship between SP and environmental variables is complex
and not well understood. Soil temperature, soil moisture, and precipitation
are the primary factors that have been examined, although this research
implies that the influence of soil properties such as clay content or mineral-
ogy may also be a dominant factor in SP, at least in karst areas. The inter-
active nature of these influences, and perhaps others, requires accurate
36

long-term monitoring to isolate and characterize them. If causal relation-
ships and systematic variations can be identified and quantified, it would
allow more precision in interpreting and applying SP results. ADC systems
employing computers and remote sensors are a means of gathering sufficient
data to attack the problems presented by environmental variables. Such a sys-
tem was implemented in the course of this research and has functioned success-
fully. Refinements of this system will allow useful applications to long-term
seepage/flow monitoring. Of theoretical benefit, the nature of recharge and
storage processes in karst aquifers could be better explained with the moni-
toring capabilities inherent in an ADC system. Some practical applications
are geotechnical in nature; for example, foundation studies and stabilization
techniques can be monitored and supplemented, well pump tests can indicate
aquifer characteristics from SP effects, and long-term SP monitoring can
indicate development or increase of anomalous seepage from water retention
structures. Possible environmental applications may exist in areas of salt-
water intrusion and contamination plumes of high conductivity emanating from
waste sites.
74. In summary, the SP technique is an effective method for detecting
and mapping shallow flow paths in soil, regolith, and rock around most karst
features. Its utility in detecting deep flow through conduits is not resolved
in the current study. SP can possibly be related to flow rates if the flow is
primarily through porous material. Computer technology promises to further
develop the SP method for successful applications to hydrogeologic problems in
karst areas and is addressed in Reports 3 and 4 in this series.
37

BIBLIOGRAPHY
Agarwal, N. P. 1984. "Quantitative Interpretation of Self-Potential Anoma-lies," Proceedings, 54th Society of Exploration Geophysicists Meeting,
Atlanta, GA.
Ahmad, M. 1964. "Laboratory Study of Streaming Potential," Geophysical Pros-
pecting, Vol 12, pp 49-64.
Anderson, L. A. and Johnson, G. R. 1976. "Application of the SP Method to
Geothermal Exploration in Long Valley, California," Journal Geophysical
Research, Vol 81, No. 8, pp 1527-1532.
Becker, A. and Telford, W. M. 1964. "Spontaneous Polarization Studies," Geo-
physical Prospecting, Vol 8, pp 174-188.
Black, W. E. and Corwin, R. F. 1984. "Application of Self-Potential Measure-
ments to the Delineation of Ground-Water Seepage in Earth-Fill Embankments,"Proceedings, 54th Society of Exploration Geophysicists Meeting, Atlanta, GA.
Bogoslovsky, V. A. and Ogilvy, A. A. 1973. "Deformations of Natural Electric
Fields Near Drainage Structures," Geophysical Prospecting, Vol 21, pp 716-723.
, 1972. "The Study of Streaming Potentials on Fissured Media
Models," Geophysical Prospecting, Vol 20, pp 109-117.
, 1970. "Natural Potential Anomalies as a Quantitative Index of the
Rate of Seepage from Water Reservoirs," Geophysical Prospecting, Vol 18,
No. 2, pp 261-268.
Brieden, H. J. et al. 1979. "Investigation of Intermediate ElectricalFields-An Effective Method for Cave Detection," Neve Bergbavtech, Vol 9,
No. 5, pp 247-253.
Burr, S. V. 1982. "A Guide to Prospecting by the Self-Potential Method,
Ontario," Geological Survey Miscellaneous Paper 99.
Butler, D. K. 1984. "Geophysical Methods for Seepage Detection, Mapping, andMonitoring," Proceedings, 54th Society of Exploration Geophysicists Meeting,Atlanta, GA.
Butler, D. K., Wahl, R. E., and Sharp, M. K. 1984. "Geophysical SeepageDetection Studies at Mill Creek Dam," Miscellaneous Paper GL-84-16, US ArmyEngineer Waterways Experiment Station, Vicksburg, MS.
Cooper, S. S. 1983. "Cavity Detection and Delineation Research: Report 3,
Acoustic Resonance and Self-Potential Applications: Medford Cave and ManateeSprings Sites, Florida," Technical Report GL-83-1, US Army Engineer WaterwaysExperiment Station, Vicksburg, MS.
Cooper, S. S., Koester, J. P., and Franklin, A. G. 1982. "Geophysical Inves-tigation at Gathright Dam," Miscellaneous Paper GL-82-2, US Army Engineer
Waterways Experiment Station, Vicksburg, MS.
Cooper, S. S. and Bieganousky, W. A. 1978. "Geophysical Survey of Cavernous
Areas, Patoka Dam Indiana," Miscellaneous Paper 5-78-1, US Army Engineer
Waterways Experiment Station, Vicksburg, MS.
38
Cooper, S. S. and Koester, J. P. 1984. "Detection and Delineation of Subsur-face Seepage Using the Spontaneous-Potential Method," Proceedings, 54thSociety of Exploration Geophysicists Meeting, Atlanta, GA.
Corry, C. E. 1985. "Spontaneous Polarization Associated with PorphyrySulfide Mineralization," Geophysics, Vol 50, No. 6, pp 1020-1034.
Corwin, R. F. 1984. "The Self-Potential Method and Its Engineering Applica-tions: An Overview," Proceedings, 54th Society of Exploration GeophysicistsMeeting, Atlanta, GA.
Corwin, R. G. and Hoover, D. B. 1978. "The Self-Potential Method in Geo-thermal Exploration," Geophysics, Vol 44, pp 226-245.
Dzhashi, G. G. and Abramishvile, T. D. 1975. "Change of Electrode Potentialsat the Boundary of the Electronic Conductor and the Surrounding Materials,"Soobshcheniya Akad. Nauk Gruzinskoy SSR, Vol 80, pp 589-592 (Eng. Sum.)
Erchul, R. A. 1987. "Geotechnical Application of Self Potential (SP) Meth-ods: Report 1, The Use of Self Potential in the Detection of Sub-Surface FlowPatterns Around Sinkholes," Technical Report REMR-GT-6, US Army EngineerWaterways Experiment Station, Vicksburg, MS.
. 1986. "The Evaluation of Spontaneous Potential in the Detectionof Sinkhole Drainage Patterns," Letter Report, US Army Engineer WaterwaysExperiment Station, Vicksburg, MS.
Erchul, R. A. and Butler, D. K. 1986. "The Use of Spontaneous Potential inthe Detection of Subterraneous Flow Patterns In and Around Sinkholes," Pro-ceedings, Environmental Problems in Karst Terrains Conference, Bowling Green,KY.
Erchul, R. A. and Slifer, D. W. 1987. "The Use of Spontaneous Potential inthe Detection of Groundwater Flow Patterns and Float Rate in Karst Areas,"Proceedings, Second Multidisciplinary Conference on Sinkholes and Environ-mental Impacts of Karst, Orlando, FL.
Erchul, R. A. 1974. "Ocean Engineering Applications of Electrical Resistiv-ity Techniques," Proceedings, Offshore Technology Conference, Dallas, TX.
Ernston, K. and Scherer, H. U. 1986. "Self-Potential Variations with Timeand Their Relation to Hydrogeologic and Meteorological Parameters," Geophys-ics, Vol 51, No. 10, pp 1967-1977.
Fitterman, D. V. 1979. "Calculations of Self-Potential Anomalies Near Ver-tical Contacts," Geophysics, Vol 44, No. 2, pp 195-205.
_ 1978. "Electrokinetic and Magnetic Anomalies Associated withDilatant Regions in a Layered Earth," Journal Geophysical Research, Vol 83,No. B12, pp 5923-5929.
Gondouin, M. and Scala, C. 1958. "Streaming Potential and the SP Log,"Journal of Petroleum Technology.
Gunn, J. 1981. "Hydrologic Processes in Karst Depressions," Zeitschrist suerGoemorphlogie, Vol 25, pp 313-331.
Holsinger, J. R. 1975. "Descriptions of Virginia Caves," Virginia Divisionof Mineral Resources, Bulletin No. 85, p 450.
39

Johnson, S. 1980. "Hydrology of North Buffalo Creek," unpublished BS thesis,Washington and Lee University.
Kilty, K. T. 1984. "On the Origin and Interpretation of Self-PotentialAnomalies," Geophysical Prospecting, Vol 32, No. 1, pp 51-62.
Koestler, J. P., Bulter, D. K., Cooper, S. S., and Llopis, J. L. 1984. "Geo-physical Investigations in Support of Clearwater Dam Comprehensive SeepageAnalysis," Miscellaneous Paper GL-84-3, US Army Engineer Waterways ExperimentStation, Vicksburg, MS.
Lachaud, J. C. 1983. "Role of Geuphysical Electrical Method Applied to Pros-pection of Ground Water in Fissured Media," L'Eau et ' Industrie, Vol 71,pp 37-40.
Llopis, J. L., and Butler, D. K. 1988. "Geophysical Invesitgation in Supportof Beaver Dam Comprehensive Seepage Investigation," Technical Report GL-88-6,US Army Engineer Waterways Experiment Station, Vicksburg, MS.
MacMillan, K. J. 1980. "Hydrologic Study of the South Buffalo Creek Water-shed," unpublished BS thesis, Washington and Lee University.
Marusiak, I. and Tezky, A. 1977. "Selective and Controlled Self-PotentialMethods," Sb. Geol. Ved., Rada VG, No. 14, pp 119-137. (Russian, Eng. Summ.)
Markiewiez, R. D. and Randall, J. A. 1984. "The Use of Self-Potential Sur-veys in Geotechnical Investigations," Proceedings, 54th Society of ExplorationGeophysicists Meeting, Atlanta, GA.
Meiser, P. 1962. "A Method for Quantitative Interpretation of Self-PotentialMeasurement," Geophysical Prospecting, Vol 10, pp 203-218.
Mitchel, J. K. 1976. Fundamentals of Soil Behavior, Wiley, New York.
Nayak, P. N. 1981. "Electromechanical Potential in Surveys for Sulphides,"Geoexploration, Vol 18, No. 4, pp 311-320.
Nourbehecht, B. 1963. "Irreversible Thermodynamic Effects in InhologeneousMedia and Their Application in Geoelectric Problems," Ph.D. thesis, Massachu-setts Institute of Technology, Cambridge, MA.
Ogilvy, A. A. 1967. "Studies of Underground Water Movement," Geological Sur-vey of Canada, Report No. 26, pp 540-543.
Ogilvy, A. A., Ayed, M. A., and Bogoslovsky, V. A. 1969. "Geophysical Stud-ies of Water Leakages from Reservoirs," Geophysical Prospecting, Vol 27,No. 1, pp 36-62.
Paul, M. K. 1965. "Direct Interpretation of SP Anomalies Caused by InclinedSheets of Indefinite Horizontal Extension," Geophysics, Vol 30, pp 418-423.
Quinlan, J. F. and Ewers, R. 0. 1986. "Practical Karst Hydrogeology withEmphasis on Groundwater Monitoring," Groundwater Monitoring Review, Winter.
Randall, J. A. 1983. "Natural Potential in the Search for Water," Geophysi-cal Laboratory Publication, Guanajuato School of Mines, Mexico.
Rodriques, B. D. 1984. "A Self-Potential Investigation of a Coal Mine Fire,"Proceedings, 54th Society of Exploration Geophysicists Meeting, Atlanta, GA.
Roy, A. 1968. "Bedrock Depth From Surface Potential Measurements," Geophysi-cal Prospecting, Vol 16, pp 447-453.
40
Roy, A. and Chowdhyry, D. K. 1959. "Interpretation of SP Data for TabularBodies," Journal Science and Engineer Research, Vol 3, pp 35-54.
Sill, W. R. 1982. "Self-Potential Effects Due to Hydrothermal Convection-Velocity Crosscoupling," US DOE/ID/2079-68.
. 1983. "Self-Potential Modeling from Primary Flows," Geophysics,
Vol 48, No. 1, pp 76-86.
Slifer, D. W. 1986. "Evaluation of Spontaneous Potential for MonitoringGroundwater Movement in Karst Terrain," unpublished MS thesis, VirginiaPolytechnic Institute, Blackburg, VA.
Spencer, E. W. 1968. "Geology of the Natural Bridge Quadrangle, Virginia,"
Virginia Division of Mineral Resources, Report of Investigation, Vol 3, p 55.
Telford, W. F., Geldart, L. P., Sheriff, R. E., and Keys, D. A. 1976.Applied Geophysics, Cambridge University Press, New York.
Warriner, J. B. and Taylor, P. A. 1982. "Modeling of Electrokinesis," Mis-cellaneous Paper GL-82-13, US Army Engineer Waterways Experiment Station,Vicksburg, MS.
White, W. B. 1977. "Conceptual Models for Karst Aquifer-Revisited, Hydro-logic Problems in Karst Regions," Western Kentucky University, Bowling Green,pp 76-187.
Williams, P. W. 1983. "The Role of the Subcutaneous Zone in Karst Hydrol-ogy," Journal Hydrology, Vol 61, pp 45-67.
Zohdy, A. A., Anderon, L. A., and Muffler, J. P. 1973. "Resistivity, Self-Potential, and Induced-Polarization Surveys of a Vapor Dominated GeothermalSystem," Geophysics, Vol 38, No. 6, pp 1130-1144.
Zohdy, A. A., Eaton, G. P., and Mabey, D. R. 1974. "Application of SurfaceGeophysics to Ground Water Investigations," Techniques of Water-ResourcesInvestigations of the US Geological Survey, Chapter D1, US Geological Survey,Washington, DC.
41

Table 1
Data from ADC System for SP Electrode Monitoring Site,
November 4-6, 1986 (Data used to construct Figure 28;
SP Values in Millivolts for Electrodes Nos. 1-5)
SoilMoistureRelative
Temp UnitsTime No. 1 No. 2 No. 3 No. 4 No. 5 OC (Digital)
18.1397 118 -76 228 228 -169 13 24219.1397 121 -76 231 230 -167 13 24220.1397 117 -80 229 228 -170 13 24121.1397 120 -78 232 231 -167 13 24122.1397 122 -7B 233 232 -167 13 241b23.1397 122 -79 233 232 -166 13 241 be.139722 120 -78 231 230 -167 13 241
1.13972 118 -74 225 225 -165 15 2412.13972 91 -78 197 197 -184 14 252 SP becomes more3.e13972 94 -94 200 202 -189 14 2514.13972 94 -96 202 203 -193 14 2505.13972 97 -105 203 203 -196 14 2496.13972 99 -110 203 203 -201 13 2487.13972 104 -113 207 207 -203 13 2468.13972 106 -115 207 207 -207 13 2449.13972 107 -115 207 207 -210 13 24210.1397 107 -117 207 208 -212 12 24111.1397 108 -119 208 209 -213 12 24012.1397 108 -122 208 211 -214 13 23913.1397 107 -120 204 208 -217 13 23914.1397 96 -119 192 197 -225 12 24015.1397 111 -120 187 195 -221 12 24116.1397 97 -125 187 196 -220 12 24017.1397 94 -131 189 199 -220 12 24018.1397 96 -134 195 205 -218 12 23919.1397 101 -137 199 208 -217 12 238 Rain e 2")
20.1397 101 -135 200 209 -220 12 23821.1397 98 -136 202 211 -224 12 23722.1397 99 -136 204 213 -225 12 23623.1397 98 -134 205 214 -225 12 236.139722 99 -135 207 216 -225 12 2361.13972 98 -134 209 218 -223 12 235 SP become more2.13972 103 -130 215 223 -212 12 2353. 13972 101 -132 215 223 -206 12 2354.13972 103 -130 216 224 -202 12 2355.13972 101 -131 218 226 -199 12 2356.13972 103 -130 220 228 -197 12 2357.13972 104 -129 221 228 -195 12 2358.13972 101 -129 222 229 -191 12 2349.13972 104 -123 222 229 -186 12 23310.1397 104 -117 221 228 -183 12 23211.1397 102 -117 220 .226 -186 12 23312.1397 100 -117 220 226 -187 13 23513.1397 97 -118 216 222 -191 13 23714.1397 98 -117 219 225 -190 14 239
-- -m ,m m m m- -l ll l - - - - -n

cu 10
Z C-
'F4 Cn
4) Z C-4 V-4 W4- .4-44 "d 4 4 -4 W4 -0- 4 "w .4 .1 -414-4-4
0 V4
-H 0
0 10 ~
o j Z o-
4) to ~ 0
0d 1.4 :
E-Z -4
4i 0
5 -4
O 0
-'-4
"~ -w .4
E4 7.J
1A 6 6 6 6 8 6 0 se s. 2 8 em"U . e o . . . . gW040V 4WV 40 4WV 4WW F F
m mmm nV40 ow - G. 49 4- 4V- 4V 4V 4W 4. 4V qV
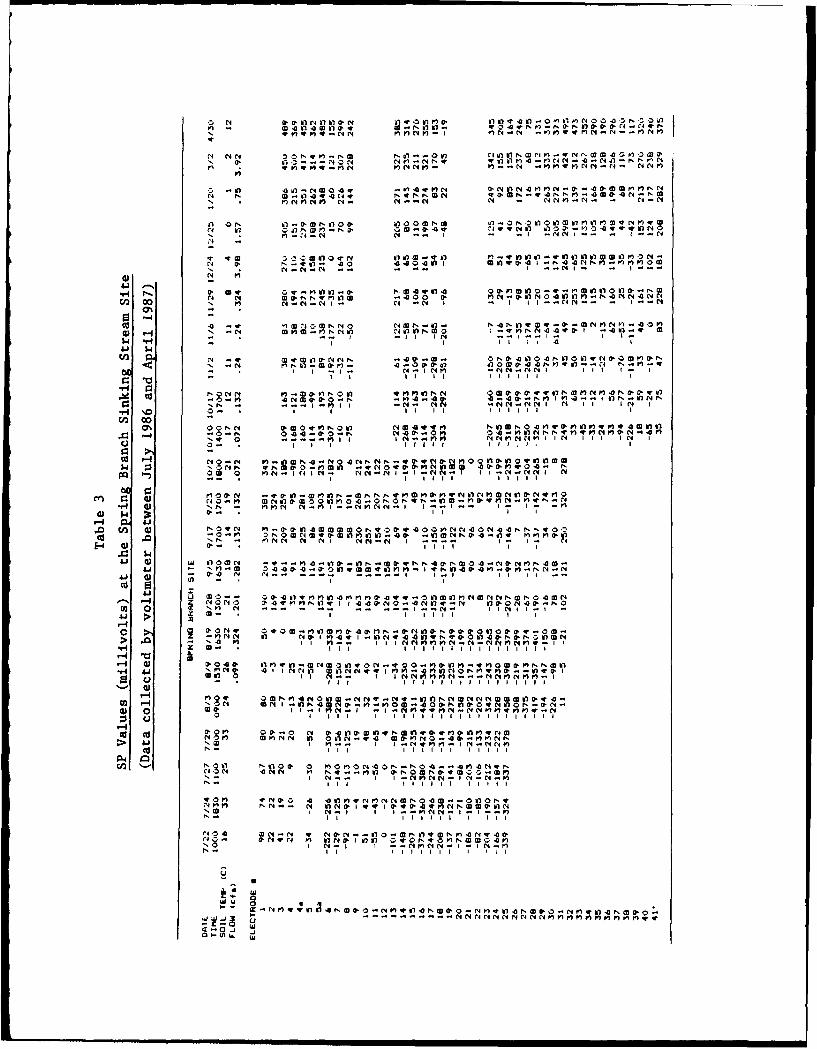
An N i W2N )P1O C4 MWVMN 0CN P, N
V MN w Mw NM- N w N A C V
8"i N " ~'.tN CA' CA-.. C N 8'
I! o CA F - 4 N -- I N N
0 N 8'N
co 00 N N ,0N~8,t Oct Co. N.08N4Iil CNC
NON) N -N - CA i- N N
El i -o C - a N N 0 r4 a) N -
4.1 w 4
Ni t' 0*.. N 67 kO vItt "7 o' N:-I i N it4-4 It It
P? 4toI MQ77 I 1171'ri(fINNNr-- '.--.~tt *N NM -NN N I N t I
N' a- 0 sN 0*P 0Oh N 0 4 vPot
z I - 1111 4t0 Mt
2! :fUT I'- N0. VIMN NC 73. 0:4' N D0.lf q O 08O fO 4 4 . tr. >1 0 'NNN N~ t i N t t ~ ~~
CIS - ii it
-# V 8'tOON N !1 - 1t4 iloIn g v a-3Z A R n to m - VN010'N4P13 0
-H CA 0 M0 0 00'li-M OO00 8"N N n T t!00N4 v NIN . 'IN N-P NI N-C CN I II'- t
i-i 0 j (P- : lIi I
4.1 00 ti I N -a- YAl 0Mww -, 0 N v0 10*' 00 ,NC 0-N 4AANr0
CI 1 0( NC V9 M In P) N- N) -g 13 i :: T ! A- - it Pit
02w 0 oN N i -; , (1 ACIN li (.N N.' 44 43 n" I tilt
-4
o1 >
2. 0 0000 m q00 m0Nq0. 4 N i0'NW a N .t'0,0 N'.
P'W) N (4 N- I iN N-NN)N't'-tm
C'. 000
02~~ 1- (4N in M .W4I 1) 0 0 ' W 0 0N N P,
0) , 0 Iia a, .0 T 4 PP 4 41 NAnM
cis cu0.0 on 0 a, 0 N 0'4WA 8(1,40 4 l ,w Q.lliwN wCU CU~ ~ C N0f F, V N All 08i 4 k281O4'-8)'~
4NN %1 ) 0W-'8 0'pN0U'M0'4tC0 W
I N-I I ITfN tN N . '
40e' 'NO0 0 ' 4W)1)qN1)N OI"4 . 0O1NvNI'. lN- N M10 t 0' n C
An iPt II" I T o t
8' 4 IO 1 818 0 0 ',48'N0N 4Ni- G CN I NI I - N ' I tN I
I I N 0NN N N N I NN N N 1) ' ) )1 n ' l, '

I. ~~ W. 99.N Ino Mi
0 no 9 ~NW N
9 Nl P~NW t. 4 AR9
00f b N4.4 4 9
A, NP. M~lO0f4NP4
OW NN-.t fN
N4 ; al N V4O N
-4
9 J NI IN..
)--I
*I
41 a* - *I I
41
-r4
rP.N0 f n M W.NP. NN
r 09N.4911.

'.~~~ N I .0W MW~ 1 NII AW f NW1IW 0i
W~~ C, &I !V111 a, 1 11 I I
Al 4 1 Sr A1 N N1 II 4 A 1 A A
coIAIA *4p C14 N A A m 0O AWO~ Wl 4PSI N
P1 N I: ! st 1 4 0.~ N v A.Nf N.. flP PP0. NI-P 1 411 A I NV R 20 " n I A A A ot 1 0
ov -7 ! & O N ISW'NiV~A V.~0O4ptf~i Sn - I cm If
' N~-i-g. WNWO NN1 P - 1 .IN
- ~ ~ n (- -N CI rI SIV11 1 1 1 I I I
co 1.NU1OCWN -WIS
Nm W N N W 4NWA -4 g o SN A"W
E- s N A N 1 N111 I II I II I
A N, V 0 - N.NW N 4 0 NWP 4 P'L4NVN V 0-
fl)P M...NP AN11' M~. IN i r N 4 PlN 0*4 N P)1 1 1 1 11 N I 11 1 1
0.'
N - WP, . N N 1l ISP WIIPIl -N211 11 I I I OT I , I
o so494 a CP. N N. 4 N. A 4PWPI & (P.V M
0 n .. 0 0l o N I fl1 Cit IN(4 =
11 f4 1 ang. N a. N 2l NI .I I I el I 1 7I 1 V
M0 N A ve A WN A fl NP NIDON0-o I
>-.
o1 WNfl. N.N P fl i S ' 0- N vP .O.WII NP
.0 V4 Z.O -D .3NlP)1 . n 6 .0 N 0 a A A )PWOa- V0N
N.1 "ZV~ 7-7 1
0J C' III IMAW
LA~~ 0 NO

0 in 4NV4 F-N woo wwm w ),: vvn nN4 Ip,- norN~n-Nn.4wAiuN ZN o41mr
-N--I. - N N"N II In N
MI- 04 0 -) N 0 ,NMMa040NN0a(.Mr
- NO* .n- N-PNNNON..4.... N DY00NN-i e
In 0 vOIO-mWm4N-.MNOnnON00
In N 0 N N
44 N 0NI W O-N M N N N 4 NNN Mpq ~ N II _
0 M 00 flO-U040-mNOONOKnflOsOtNM-0 M t IN I-. N N- N
4 0-
.0 % NON 0 M 0-0 iN N4 7 0r I 4N"Nn iINNN --d 1 -- I0 N VI ICNN
00
Xn r. .' -- - I 11 (
N NI toR I I I I I
EO N OU.-. NNMN.40rO4NO NN -"~m NO'
.0N -ON 1~ 0 -N W-l - - -N, Ob St .WN I N
0 - 0- 61 V
-4 IO- II L
w mw J n
0I Q.0 E

N N
~00 t -4 00 )4 NaN - MN
N 4 1r. 0m -
M I ICP 0 I 0 011
N41 nN 0o N"- W O O0 N m-.ON-
0 N- q' 0 O t 0 N N 04t
C44 h) -*N 0WNMO N l0
0~ 14
4 qt0 -0 b) wo O O' ONN*4 -1 NW M - 1 4 I 0 ;
N0C00
0 C14N0 ~ 'Cl 'I . '
H 0004401-1
W I NF) 0 0,I-O N -O D
0 0-4
U4 N -0 - M - 0 W 0'. N N0 r4 4 NW PI I-4-4 OJ M-U.
V-I N~ 0 -"0OP M N t
N S- 0 -0 N I 4~~ 0,--0a I>- 0 Si .. 4 0 Ia0w tM4
'44 U0 4- 4N -cy.
*-~~~~~~.a 0m)O O '0 C~W O 4 1~~ 61
ow -1 3
'-I 0 (*.0 W ) W OC*0 W
CW U) LL 0)0Xf N4 tlrn-
61~~- Q'. I II'-Il
wu

-N O 4WI0.I' CN Q.0 0rWin V(' ~q C iO r .t 13M-PI * 7-N*NNNNNN 1 17 IN N NCWN NV I n M N-.NN-.N5IN
(1 N tilt M -0( 1 - !NC0 01 0 I I t Ill
M ,%0 NO3 O~ I~ N r, O. C N 00 O 111 11nC14 . i v, *N N 4 N N NNN( IAN('tN cWinW) n N rj N Nt'N N NN
-. m C1 r4~'N ~ 2 -- qrqr r 4N-NWNw~w N
41 W0- N () 0 N N-M CA 0 0 G t441 O NN N -~WW (Dr D a o0 n M CA1 mq
~ ~ Q .N m N O ( 'I " N N INN 4IN I N N "~ - O K 0 0" O W U 1 W I 4 N I ,e r
"AMONO N III AD'i I 11ZN~ "i N 0 4 n A
U * MN '4 04('4('4 I N-4'WIWI 4
M oo- A~~onil MMnN ()I0A 0 N W~'~o-Wc InU '.-N ~NVOOWMIP)'.N W~IWWN -0*000Q0'OtflW
-m * I WIW-- I--N- I N- . .- qqN -~-N~-W
1.4~1 10t l it t III( it'11 It I I i
o C4 P% itt-111 t t N--I W W NWO I-.-
0- ON I I A I I t I AAI I It I40 -
V O n N NN-MONNWOfl 4I tQgN-tNWO NAQ0vO vVO -N '0 - in N- - OI, a. OV4nVMO'.O7-NM O N n V 0 Mt.
1.4 2 0 ti l l 1 1 1111 11 1 1 1 1i it I
o -0-I NN-Wklrmmm- N4N rM OON N ~ o n 4
00 ti l l It 11111 11 t 1 1 1 1 1 t I
4 % 0-T0 cv "OI- 0iW.mO44 0O ~ 1 N - O 40NOIN - Io iad co- (1)WICmWm~ A ~1-~ON e4Nn r~r~ I04UT m -.
$4 4Itl -1 - N-0. 0 r- - -P('411 K W- - - - -.T 1N11.a0 0 I I lt -- Ii N1 1 1 1 I IN I NI NIt
E- j V.- -
1.A 0. M0 W N -0 - OIN A t 0 0 tNN . ,1 Q O iN AoN00A0 1AN N- N C0 I~0O *~ *"- N N I I ----$41 1 l t A1 1 l I I ItA
0A 0
N- -A 4NNO~O'W M*~WONNM-N -CNNOtt3N-qW"
0 14
to.01it. 4 a. IN 0 UCP0WAN'- 4o O OO O O0- NNNOIN~NI NNa,*A*NMNN hOW00NOID.CWIWI
It I t, T .11,11 II t1 Il t1c A0A4 ,NA
0 '.~ i INWII---------I A '- -N.WI I N C -ci 0- II It itI A I 11 1 t1lI I i t I
In 4 MNNNUOO 0PO1N-W -Mcl,00MNNNOCI0 eO Ct4N 0 IN P) fAt t'N 'It M 0N nmor1N- mNO-N
> (P. ltt I t Nl N Ip 174 A I l It1 V
WIO0- M (P 0 M IA CP- ' - 0 11INN tOOON P .Q 0 i rNO 0N N'0 -NN(A - ----- I NNNN..N-.InWN N--r1-- -W
r4.0. WNI 41M N111VA 4N11 1 ON11111111 *
O.ONON~~i~rno') N0. i~ . N ' W - - - - '
(40- - -wv61oWI0 TN*-40CJ)N"" .O ~NnM-eM - 0(.17411 0 - c1CP a 1-M11 II N 1 N111a 0t 110 t IS11
.000 ~ ~ ~ ~ C -i~ . O N - r,4 I WNWII I4-0 0All 0 0 '- O N NQ I i 0 10 O C 0
a.I (n I I I I 1 1 1
N n 0 u C a. -Nri 'WiLn ol, : wo Z-Ntli4.UNMC0
1 . MOMi M0.4 z MOMQiUILw
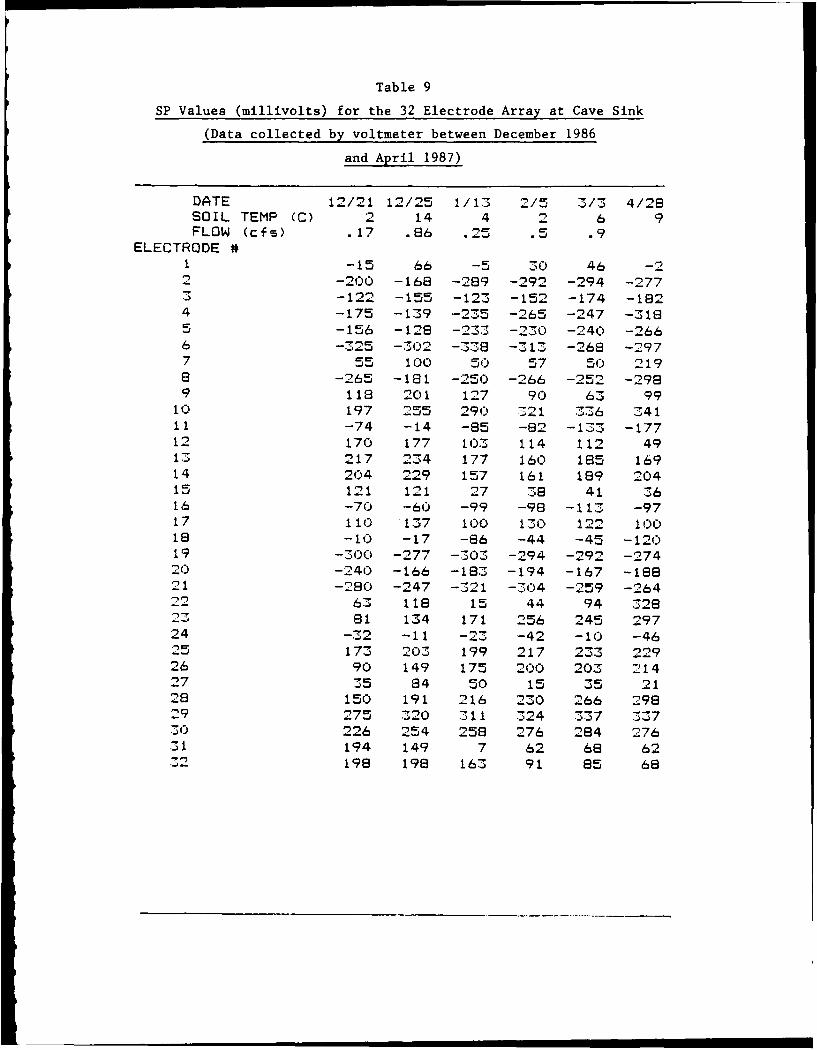
Table 9
SP Values (millivolts) for the 32 Electrode Array at Cave Sink
(Data collected by voltmeter between December 1986
and April 1987)
DATE 12/21 12/25 1/13 2/5 3/3 4/28SOIL TEMP (C) 2 14 4 2 6 9FLOW (cfs) .17 .86 .25 .5 .9
ELECTRODE #1 -15 66 -5 30 46 -2
-200 -168 -289 -292 -294 -2773 -122 -155 -123 -152 -174 -1824 -175 -139 -235 -265 -247 -3185 -156 -128 -233 -230 -240 -2666 -325 -302 -338 -313 -268 -2977 55 100 50 57 50 2196 -265 -181 -250 -266 -252 -2989 118 201 127 90 63 99
10 197 255 290 321 336 34111 -74 -14 -85 -62 -133 -17712 170 177 103 114 112 4913 217 234 177 160 165 16914 204 229 157 161 189 20415 121 121 27 38 41 3616 -70 -60 -99 -98 -113 -9717 110 137 100 130 122 100is -io -17 -86 -44 -45 -12o
19 -300 -277 -303 -294 -292 -27420 -240 -166 -183 -194 -167 -18821 -260 -247 -321 -304 -259 -26422 63 116 15 44 94 32823 81 134 171 256 245 29724 -32 -11 -23 -42 -10 -4625 173 203 199 217 233 22926 90 149 175 200 203 21427 35 84 50 15 35 2128 150 191 216 230 266 29829 275 320 311 324 337 33730 226 254 258 276 284 27631 194 149 7 62 68 6232 198 198 163 91 85 68

Table 10
SP Values in Millivolts for Long-Term Monitoring
Array of Electrodes
ELECTRODES SOIL TEMP RAINFALLDATE TIME #1 #2 #3 #4 #5 6"1 AUG 1100 251 121 233 187 214 23
1200 269 120 269 210 192 241300 290 129 302 235 172 241400 304 140 323 252 171 241500 313 150 338 264 167 241700 327 167 358 284 169 241800 331 171 368 295 164 251900 334 176 376 300 162 242000 334 184 378 302 159 242300 314 182 375 292 127 23
2 AUG 0700 316 198 399 314 101 210800 328 209 408 328 108 211000 343 224 433 349 115 231200 349 233 442 358 117 241400 355 243 444 368 120 241600 364 260 454 383 124 241800 367 267 456 389 122 242000 369 273 460 393 121 24
3 AUG 0700 341 263 446 386 85 210900 340 262 448 387 85 221100 353 275 464 404 92 231300 361 285 471 416 102 241500 365 287 472 419 101 251700 366 292 478 422 102 251900 367 293 457 424 100 252100 343 280 446 402 82 23
4 AUG 0600 320 259 436 391 49 210800 3Z7 272 457 411 62 211000 348 280 470 425 74 221500 358 289 473 435 81 231700 359 289 473 437 0 1900 358 289 474 436 78 232100 352 288 465 433 73 23
5 AUG 0600 324 264 447 415 43 220800 333 271 457 426 52 r,1700 356 290 480 450 72 232200 345 287 466 442 66 23
6 AUG 0600 326 269 450 432 41 221700 60 55 119 127 4 23 .8"' @15001900 65 61 115 133 -6 232100 66 50 112 140 -20 222300 67 69 112 145 -25 2
7 AUG 0600 66 72 119 156 -260800 65 71 120 155 -27 'I2000 74 80 147 164 -14 23
8 AUG o700 66 76 167 171 -31 231000 67 77 166 173 -29 21300 69 78 168 174 -24 2.1800 73 82 173 179 -16

Table 11
SP Values in Millivolts for Long-Term Monitoring
Array of Electrodes
ELECTRODES SOIL TEMP RAINFALLDATE TIME #1 #2 #3 #4 #5 6"9 AUG 0800 67 75 177 182 -40 21
1000 69 75 179 184 -35 211200 77 83 188 192 -20 232000 82 88 194 198 -19 24
10 AUG 0800 81 88 202 205 -33 221300 91 96 211 214 -12 252000 93 98 211 215 -17 24 0.1"
1900 102 109 230 233 -14 2412 AUG 0800 104 112 239 241 -23 22
1900 128 136 265 268 1 2313 AUG 0700 122 132 263 266 -16 21
1900 147 157 291 293 7 2214 AUG 0800 143 154 291 292 -3 21
18 AUG 1600 141 166 276 289 4 23 .5"(18 AUG)20 AUG 1500 -34 -41 70 58 -263 21 .6"(19 AUG)
1800 -18 -41 63 42 -260 21 1.1"(20 AUG)2000 -12 -47 65 44 -257 21 .4"
21 AUG 0800 30 -84 66 8 -262 21 .2"1800 51 -96 82 -2 -254 22
22 AUG 0800 77 -132 87 -43 -259 211800 85 -121 98 -36 -242 24
23 AUG 0800 79 -132 114 -32 -210 211800 81 -109 118 -8 -193 25
24 AUG 0900 75 -120 126 25 -167 191800 83 -100 134 43 -171 22
25 AUG 0700 67 -123 135 61 -156 211800 80 -85 139 93 -142 24
26 AUG 0800 63 -109 140 100 -131 201800 75 -81 144 114 -129 23
27 AUG 0700 65 -92 150 120 -123 221900 66 -65 149 127 -109 24
28 AUG 0800 60 -57 150 131 -98 20 .1" @06001800 71 -31 154 141 -103 19
29 AUG 0800 59 -16 157 143 -97 131800 79 18 160 153 -78 17
30 AUG 0800 64 22 159 150 -87 131800 79 39 160 157 -73 17
31 AUG 0800 67 36 159 153 -76 15200 75 45 159 157 -66 18
I SEP 0800 68 44 159 155 -77 17 .2"1200 68 43 157 154 -74 181600 69 44 156 153 -60 161800 70 44 155 153 -67 17 .1"
2 SEP 0800 61 38 144 147 -167 17 .4"1800 78 33 156 155 -202 18.

Table 12
SP Values in Millivolts for Long-Term Monitoring
Array of Electrodes
ELECTRODES SOIL TEMP RAINFALLDATE TIME #1 #2 #3 #4 #5 6"3 SEP 0800 108 34 180 176 -205 18 .2"
1800 130 26 197 191 -204 184 SEP 0700 133 11 202 197 -208 18 .1"
180 146 0 213 206 -208 195 SEP 0800 149 -49 217 210 -212 18 .2"
2100 164 -78 231 219 -178 196 SEP 0900 167 -87 238 228 -198 18
2000 172 -77 238 229 -182 197 SEP 0800 158 -85 230 228 -179 17
1800 161 -65 228 227 -150 198 SEP 0800 157 -30 230 232 -133 18
1800 164 -3 230 235 -114 189 SEP 0800 146 -26 223 229 -105 16
1900 147 1 217 225 -101 1710 SEP 0700 143 1 222 229 -92 16
1800 142 27 220 229 -76 1811 SEP 0800 129 21 222 230 -76 18
1800 134 39 221 229 -71 1912 SEP 0800 126 44 222 230 -75 19
1800 131 57 223 231 -76 1913 SEP 0900 119 63 222 230 -64 18
1800 127 76 220 228 -51 1914 SEP 0800 115 78 221 228 -61 16
1700 127 88 221 230 -45 1815 SEP 0700 113 82 216 224 -61 17
1800 119 89 217 226 -52 1916 SEP 0800 114 86 217 225 -59 18
1800 119 91 216 225 -41 1917 SEP 0700 110 87 217 225 -60 1518 SEP 0800 118 91 221 231 -51 15
1600 126 97 222 232 -34 1719 SEP 0800 120 92 221 229 -50 17
1900 123 92 218 227 -44 1820 SEP 0900 123 93 222 230 -52 1721 SEP 0800 121 92 221 230 -61 1722 SEP 0700 127 98 225 234 -59 1823 SEP 0800 131 100 228 239 -62 18
2000 139 106 234 234 -54 2024 SEP 0700 139 108 239 238 -58 19
1900 121 87 217 215 -76 2025 SEP 1900 126 89 218 216 -76 2126 SEP 2000 127 88 218 217 -78 2127 SEP 1400 129 90 221 222 -80 2128 SEP 1400 134 90 225 225 -80 2130 SEP 0800 126 88 226 231 -114 191 OCT 1100 141 97 236 242 -105 212 OCT 1700 145 94 233 239 -109 213 OCT 1200 144 94 236 243 -112 196 OCT 0800 139 87 235 242 -128 187 OCT 0800 134 5 233 243 -129 168 OCT 0900 132 88 234 247 -129 18
1800 147 95 241 253 -110 18
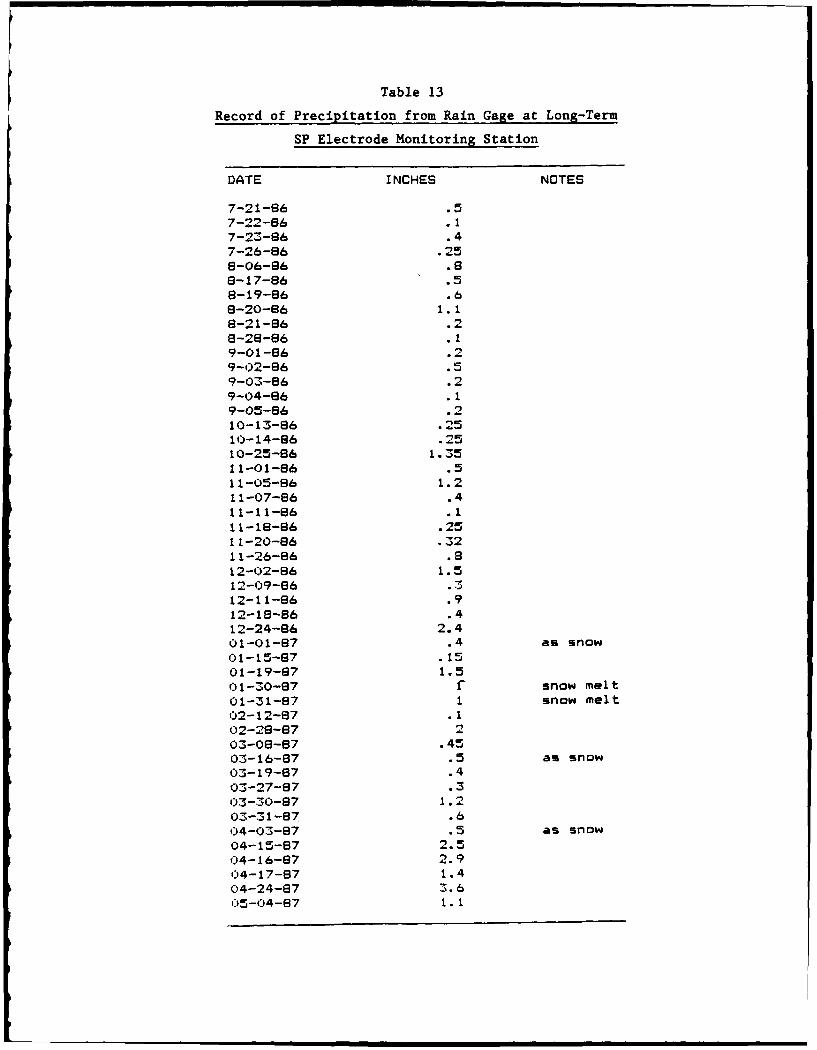
Table 13
Record of Precipitation from Rain Gage at Long-Term
SP Electrode Monitoring Station
DATE INCHES NOTES
7-21-86 .57-22-86 .17-23-86 .47-26-86 .258-06-86 .88-17-86 .58-19-86 .68-20-96 1. 18-21-86 .28-28-86 .19-01-86 .29-02-86 . 59-03-86 .29-04-86 . 19-05-86 .210-13-86 .2510-14-86 .2510-25-86 1.3511-01-86 .511-05-86 1.211-07-86 .411-11-86 .111-18-86 .2511-20-86 .3211-26-86 .812-02-86 1.512-09-86 .312-11-86 .912-18-86 .412-24-86 2.401-01-87 .4 as snow01-15-87 .1501-19-87 1.501-30-87 f snow melt
01-31-87 1 snow melt02-12-87 .102-28-87 203-08-87 .4503-16-87 .5 as snow03-19-87 .403-27-87 .303-30-87 1. 203-31-87 .604-03-87 .5 as snow04-15-87 2.504-16-87 2.904-17-87 1.404-24-87 3. 605-04-87 1. I

Z'A
Eoi
0- C4 IN
4.1 -
4.4
Z~ 0 i
cc 0 511
P 0 44 it~W 0 0 O G W N24 ~ t~- O o 0 V 0 0~
14----- ------ - - - - - - - -
4.11
0 0 01 vN4.1
a 0m
M 0t M hfdtw 4 v . 0 .-4 - 0 - .:
44::
0 o W!Not M9 -wp 9MMOM 0 01 N Nn Wn W Nn nnW N* 0 400Utog.EliV~r --,- frw 0 w - w v c o C
o oY r0 .0W or a-"vW - M00 C)v -4O
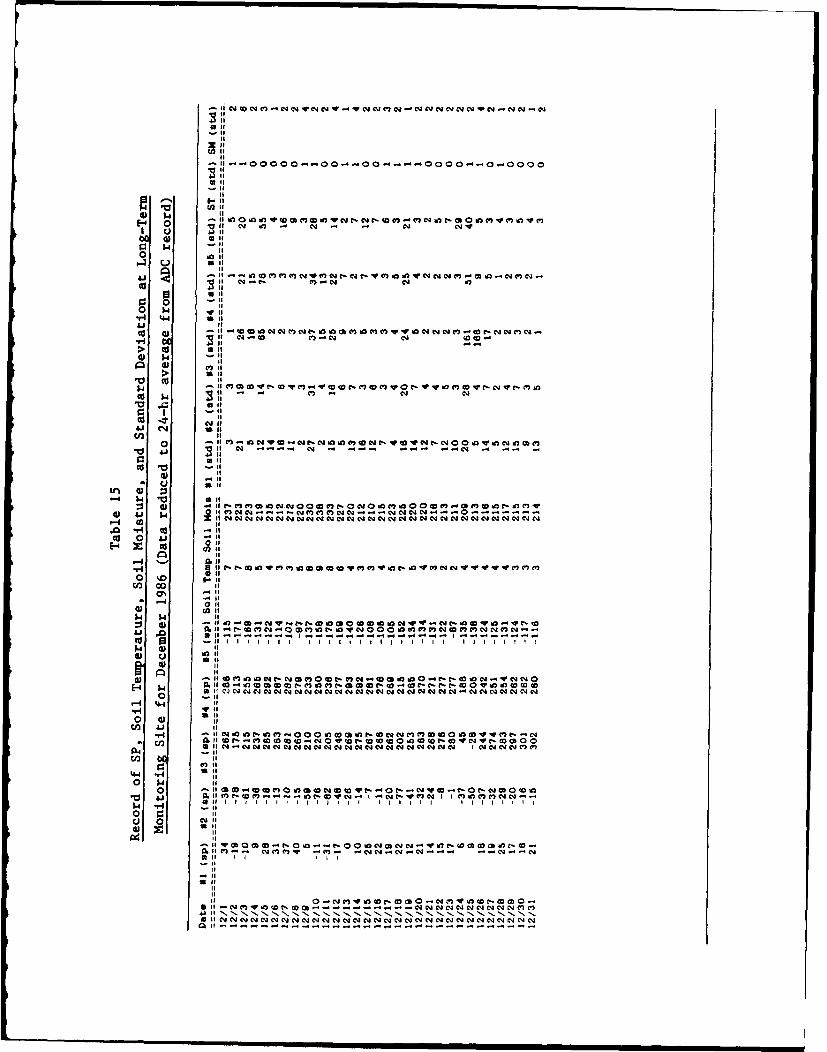
E4~~~ 0 n o oaommv
to-IcII
0a w-H 44
.1j ) 4.1
>- C all
412 04. .
0 o 1m-4"V 1NV
r. all
0 V.
0 0
N r-0 a m moo*cc Vm m VO0 1. 0 WIMP N" 4'('.C-,m
0 1.
w. . I I I IIn$4I
0 all" " M NN "
0 (I
CI flC.-c j" N ('2 N' N cj NN NO N' N' ON0N(20 0c '~ ' C 0 24
0 0 -
all I I I N NN NN N NNNINNNINr.
u Cu co
if
o i II
on 0. IS 0 aCA ~ II
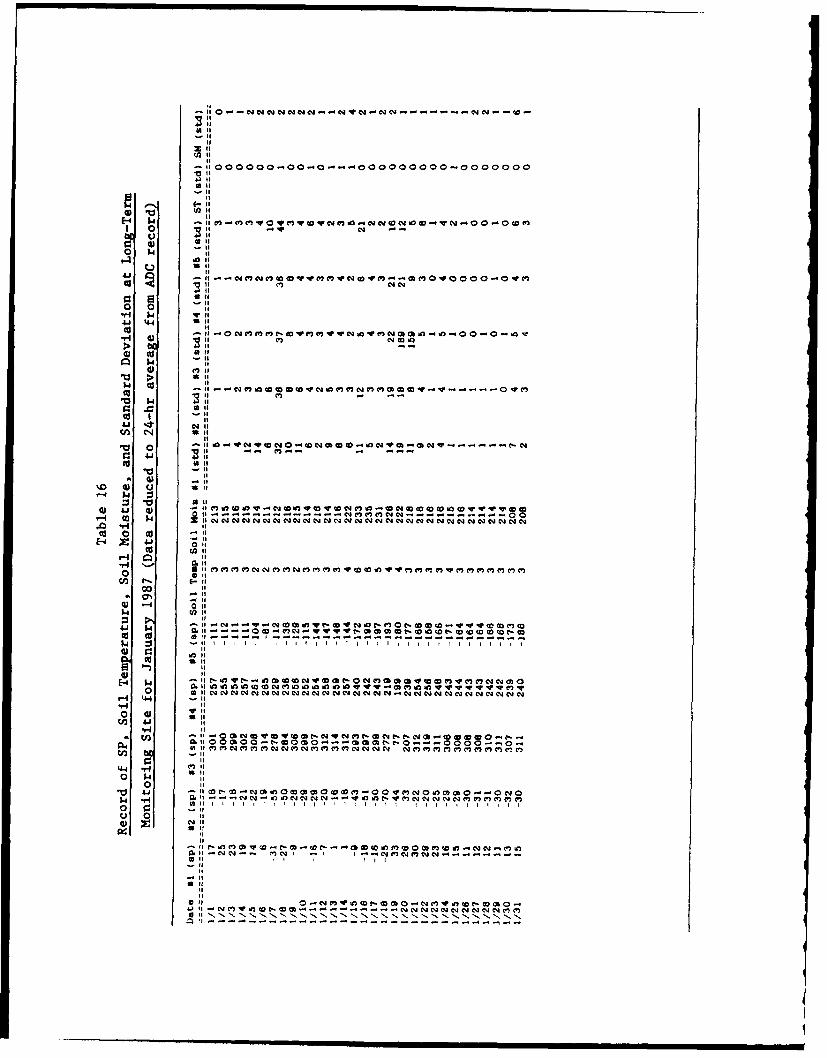
1* I
tic ur. 101
It
0- 9. 11 ' N N 1 .V g0 -0 0
-H a)~~~ i :,mN cII
0o 0
0 41coI
0 0i0
5.4 0J
E4 *4 Nilnvrm" o
-HI
l0 Q) Zii
0 0 0 - t
0 a ll0 4) 0 C,3 V. ~ 0V1 Nl 01 N 0 0 01 1 1 ' ' ' ' 1 1
cc ~ ~ ~ 1 N.. Oi fl"IN 0
lii~~~~ -NN-NN-NN -NN- NN- 4N-NN-NN-

00 3,
CII
0 - N.
*1-4 44 aa It
44I be il: - --> tv oil0 0 4
Od 1.4 C C CN NI 'V
J~r) C'I Niait
-14 '0
.0 01- 01
0 0 414
$4 >1 0 11:o 4 It
IsI
$4 V 0 .1 Nf 0 N
r-4 oil
0. 0 Va 00O10''V00V--'
CIO ll0 0 0f-v N l0 M C- 100 t- 0 r- 000 C- m V 04
0 14 0I
0 all
u It
-N "N " CIA C41

II N ---N--- v4 -N-N- --- NWON
r. (1 0 i:
0 4' WI'
j.. $4i. NN N
0.1 0 I;
-1- !: 0) C) (A WC c Cl) CCl -13 - C,3'C-
> 4)
0 Oj
CIS 41 1f
Go 0ie i
11 l l ""W" "WNN N SN CI)C) -- l CCW C-4 N C.0 V4 Cl4 - ti O -
C 0 0 t
-
0 00 ,m 1 0 co-'
-l 41 w
E4 0
-4 0) 10 41 V 1111- - -
(n "-I
0 0~o41 - C~
10 0
lu~(DI
ad all
j-4 ~ ~ ~ ~ ~ ~ C .ICC'CCOC.SNCCOCCCCCWC
V.1 C O l)CCCCCCC CD NN NW C -0
mm-mmm mo mm mmlo m--mNNNN NNNN NNNmNNmNNN nNm

EU 4
4.1 ~ ~ IUD11
4.1 0-i
> It r- 0 N0 Woo l. m 0 V 0 r- 1- 0 0e 0 W 0 0 0 .0 N~ t4 M . NO M n a me 0
oi co4 # N ---- -MN m
4.1 CIS - :i110 N It
4. 0 '
cU 4.o 4)ll- M - -- -N M
>1*
1 01 -0 - - C N O -0
oil
~~--- -U -W - - - -. ~n 1 -
C3 44.8
4.1 CU v V
E I'
$4~0 - N 2~~ Ott NNW WC N -0% o ~ 41
01 4. .1Ni
w-v t - N'UO$_ M M 0- MMMMM"Noeee -Ct- ec- t00ONMeo.."NNo-.
To 7. CU-7 I Cr1
*ii4I.4C-00e0O.-~N..N~0o*~*** 000**40404*
SOil vvv w v v

N ~ Vb)4- NN- I".NMNn0Nl""-~-NN 0'-W) I I n-NNo1 I I I
N "
N~~ .1 NNIN ~ .NfN ~ ) ~" *3.
V% 0I N In W~ M tM"- 00 -N IT 4- 0 q N N N0
m I I 1 1I C1-4
.0 N0 01 O't' I4 N 1-M. N .N4N' M - V* N . 0~ 0, -4 0 - a- m
ON* NI I I I I IN
0
0.. 0 'O V -N n - c
o1 N. .4 1flW 4
-4 ON I I I I I I inI I -4 III r)0 W
-4 0 If) ). I N NII " N n 1
W4 N4 I I
0 - .4 N
0
-aOC -If4l1P)N-' -AV Nb a I V I ,I I -04 q, " - I') 1.4o c 0- NI I N I~ I Na 11
0
C14C. 0 QN.-VI0- -aVi'O -4 N1N-rWNt-cU if) I I 1 1 I
t,%
~~~~a LO iW ON WNj~0 W ( 1r4~ ~ aO''.' l 4 Ok N)' No NO 'l-a I I~~) I 411C3
NW N. Ii N NIN N N N N N N N I" ntNO E "I
C00 t') (n -~l (1 Ut' N-~lIf'II - b4W~W4- .1

N N N. N N-( I I i4 .4 -CA 1 I n ~N F). I N.- I I
4N -Or o--1N -4. -l -.4 .4 1 -I4.4 4-4 1 1 NI I f
t -02 N 4.0 N -4 V)C -1)1)b - N -D M4 N -4 0 it'- N t 0-
co s.- ON N I N 4 N n - 'r 1, N NN-444 ~N " 04 N 0I4 C4 1 I I
0Rr0 -0WNc - 0NNMW00 T0P h
$4
0, N N N N I N -4 -4NP)' I NI -4N-
0 70
V% 4 -a 4 1 4 N - 0 0 4N 0 M 4 N -4-4
0
4
L
N ritw17 I 0 N N NO NOC-4 OUN 0 N 0 N 0 N 0 M-4~.0 EoNN N Iii-N -4 -4 N I.-4 I.
P44'
I..
w j . N N NI N4 -1 I- n " W
5 En4-'. J 40.?10 u 4- - 4 - 4. .
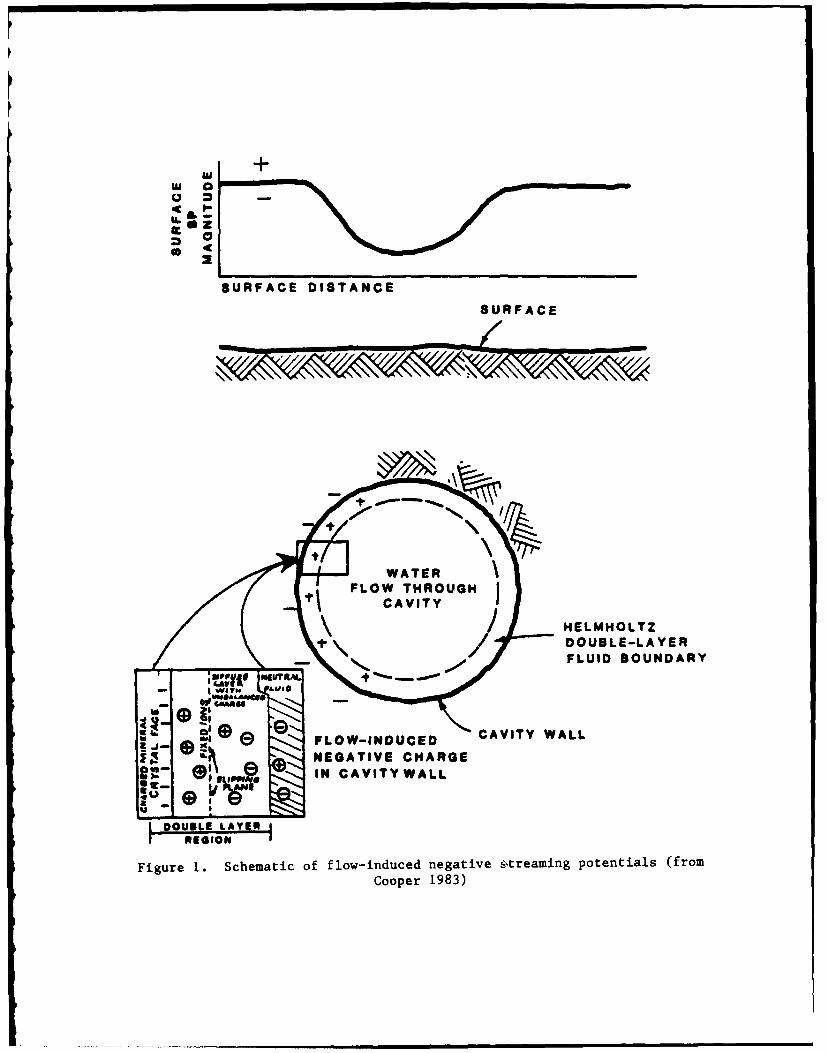
4 ..
SURFACE DISTANCESURFACE
HELMHOLTZ+ DOUBLE-LAYER
FLUID BOUNDARY
Cooerw983
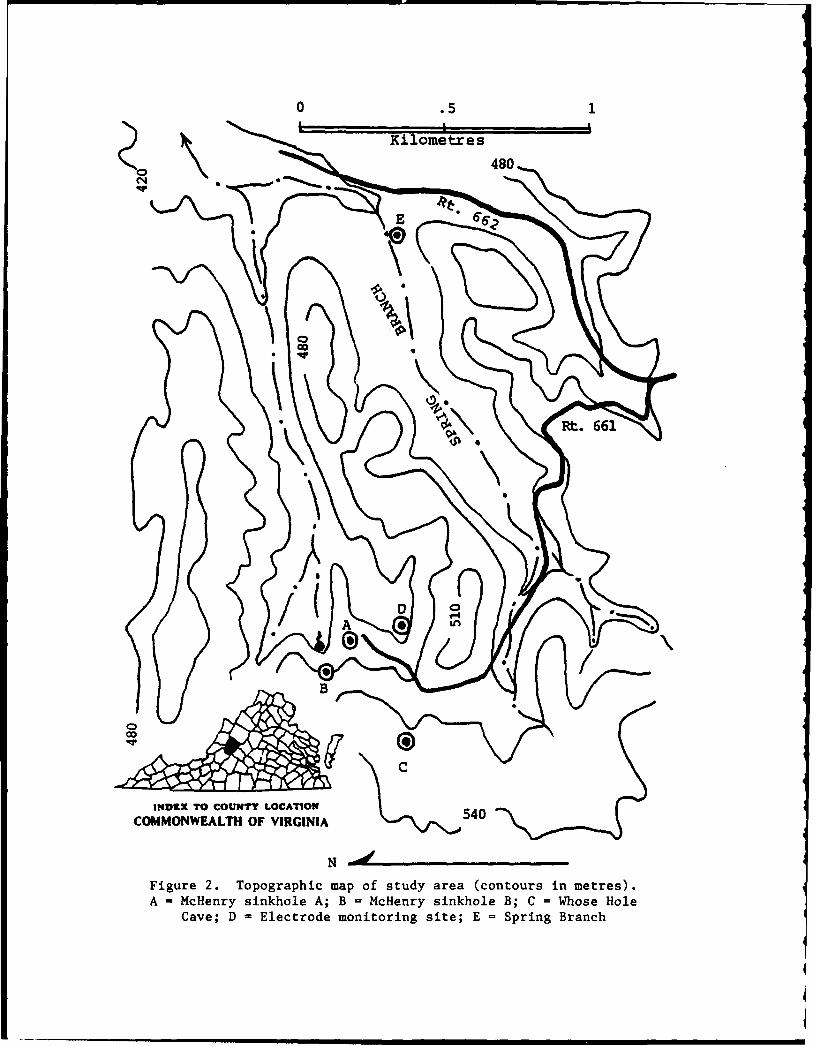
0 .5 1
Kilometres
480,,
__ Rt. 661
COMMONWEALTH OF VIRGINIA
Figure 2. Topographic map of study area (contours in metres).
A =McHenry sinkhole A; B = McHenry sinkhole B; C = Whose HoleCave; D = Electrode monitoring site; E = Spring Branch

initial electrode placement (8/1/86)
100'-/0. No. 1
0 0"4
-4
-100..4
200
-300 No. 5 c
-300 rain
0 2 3 46
Time (days)
Figure 3. Polarization equilibrium of electrodes followinginitial placement at the electrode monitoring test site

Ceiling heights, ft
Figure 4. Map of Swinks Cave, near the Harris-Hunter sinkholesite, showing passage development along strike direction (from
Holsinger 1978)

Rouite 612
Metres3 44
0 0
Huntersinkhol
array
*Inferred ground-water
flow paths
~ 'jg te ti~f
6 a the U at is unte r inkho e sjte D
El ~ecrode COfi&E~utonspatthe Rnfred by SP anomalies
Figure hOwifl groufdwater lwahiner

200.
100.Reference B
0
o -100-
S-200
Reference A
tn -300.
-400
1 ' ' I I w il l I w a l # g . I s e u l t*
1 2 3 4 5 6 7 8 9 10 11 12 13 14 15 16 17 18 19 20 21 22 23 24 25
Electrode Number
Figure 6. SP for electrode array for two different referenceelectrodes, 3 August 1986, Spring Branch site
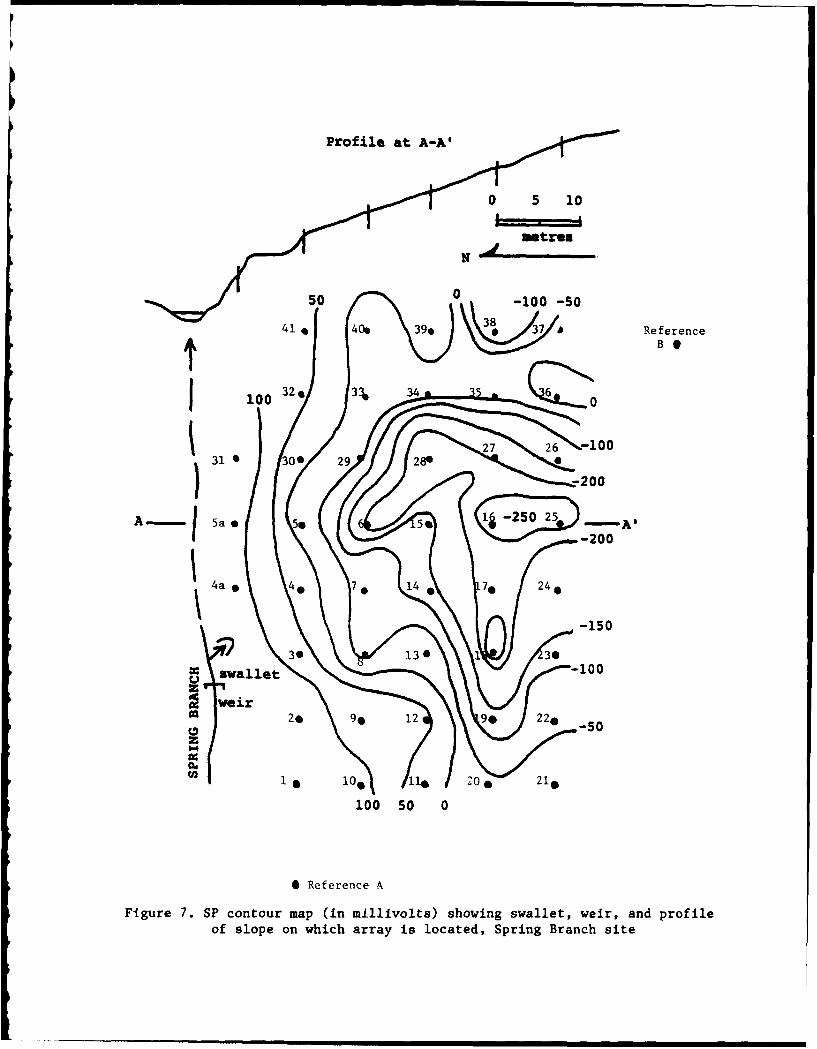
so 0 100 -50
41 % 40* 31e 7 aRe ferencet~ BS
A 5a e 6 &-2025 - At
515
w eir2* 90 12 90 220 5
'-4
04
100 s0 0
0 Reference A
FIgure 7. SP contour map (in millivolts) showing swallet, weir, and profileof slope on which array is located, Spring Branch site

SP above swallet(western half ofarray)
-100SP below swallet(eastern half of
array)
.32U
4 j
- 0 /00
oM
22.
to/-100
s r a f o.- ZOO
.12
1.35 in.
Rainfall
"' 'iI l!'1 ! ! i!i
16 Oct 88 Time (Days)
Figure 8. SP, streamflow, and rainfall, Spring Branch site. SP data
show different magnitudes for the two halves of the array, relativeto their position in relation to the stream sink (swallet)

0
N 0C-4
-4
0
01oN 0
00
0w
C-4 0 4
(J)
0"
0 ,4
opG (4)64 .4
00
oct'4~~O 10Ot~~~a
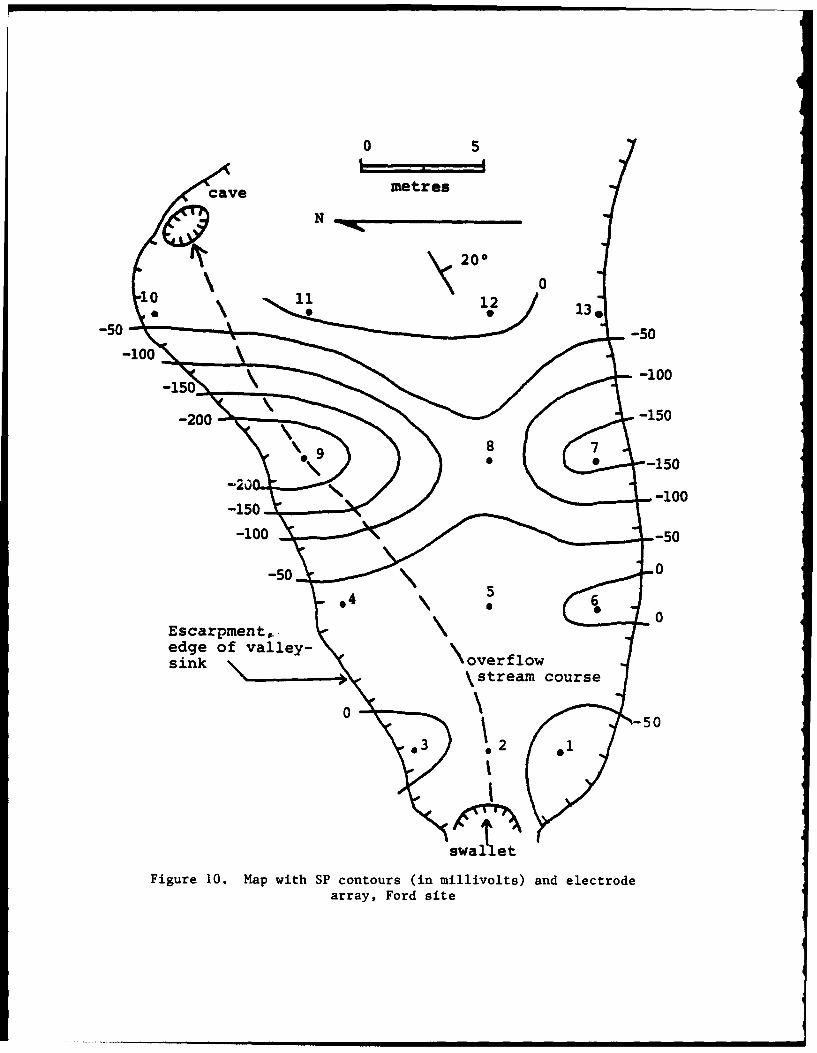
I!.-
cave metresN__ _
20
-500 _ -100
-5 -50
100.100-,-00__5
-15150-10100
Escarpment,edge of valley- \overflowsink\oeflwcus
\stream course
0 -50
03 2 61
Figure 10. Map with SP contours (in millivolts) and electrodearray, Ford site
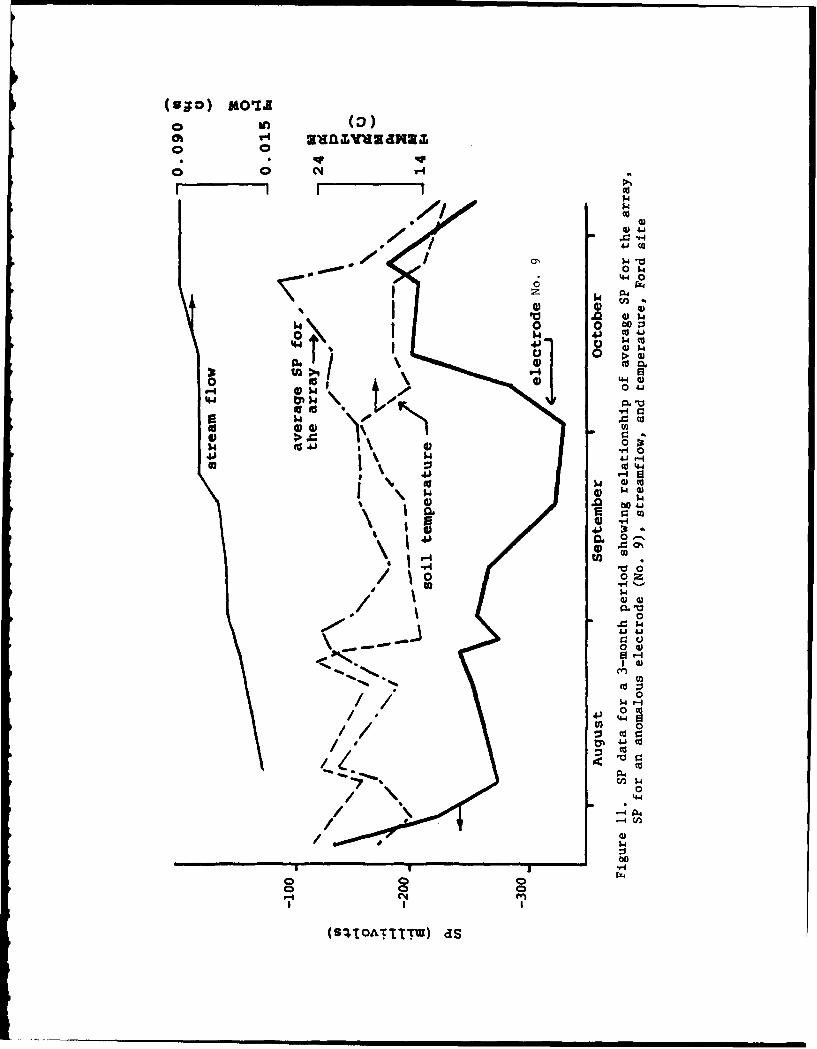
o 0a
4
0 $4
14 04J
$4 0 41~44 4
\ 10' 4~ a 144
W d
0
0 o o
o 0 0
.. 001 I4(S~t~tttm) 0
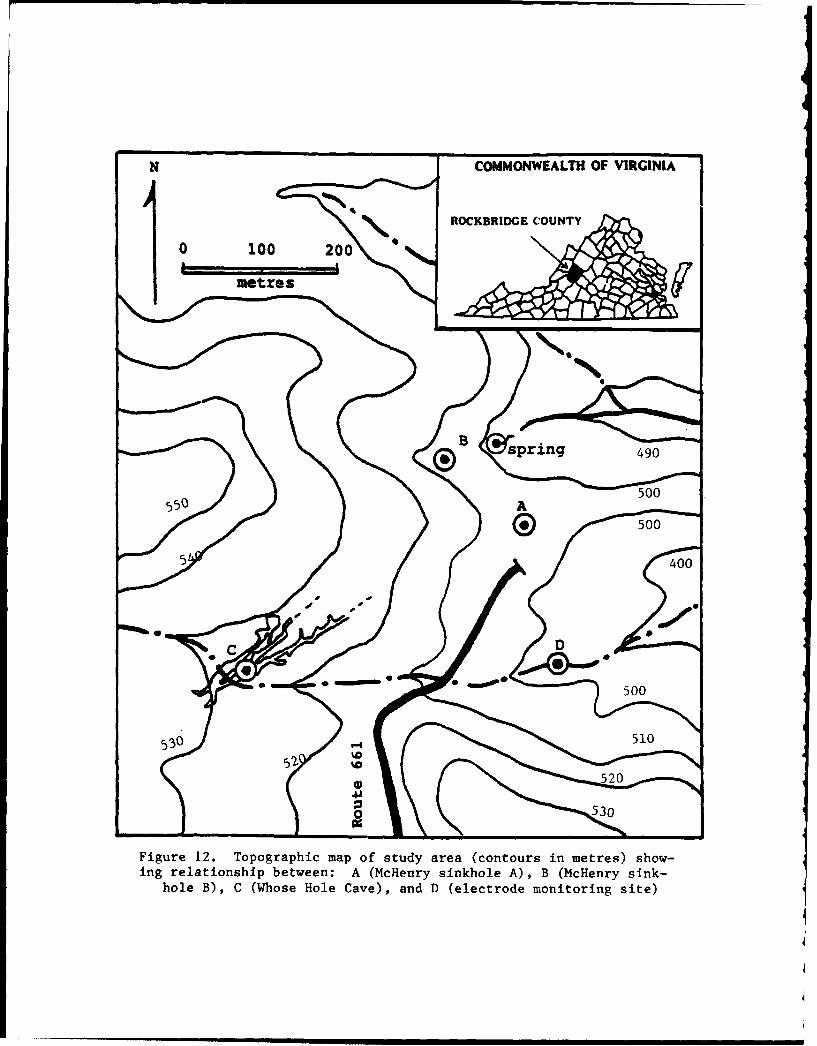
N COMMONWEALTH OF VIRGINIA
~ROCKBRIDG E C:OUNTY
F 1oo 200 cn r n e)
500
530 510
O 530
Figure 12. Topographic map of study area (contours in metres) show-
ing relationship between: A (McHenry sinkhole A), B (McHenry sink-hole B), C (Whose Hole Cave), and D (electrode monitoring site)

N
0 166I
_ I -metres 1
-50 0
00
5/ *No \3o0 -100"
SS
ell) 00
I !7 I 'I
Figure 13. Electrode array and SP contours in millivolts.Strike and dip symbols indicate fault zone correspondingto anomalous SP area in southeast quadrant, McHenry
sinkhole A
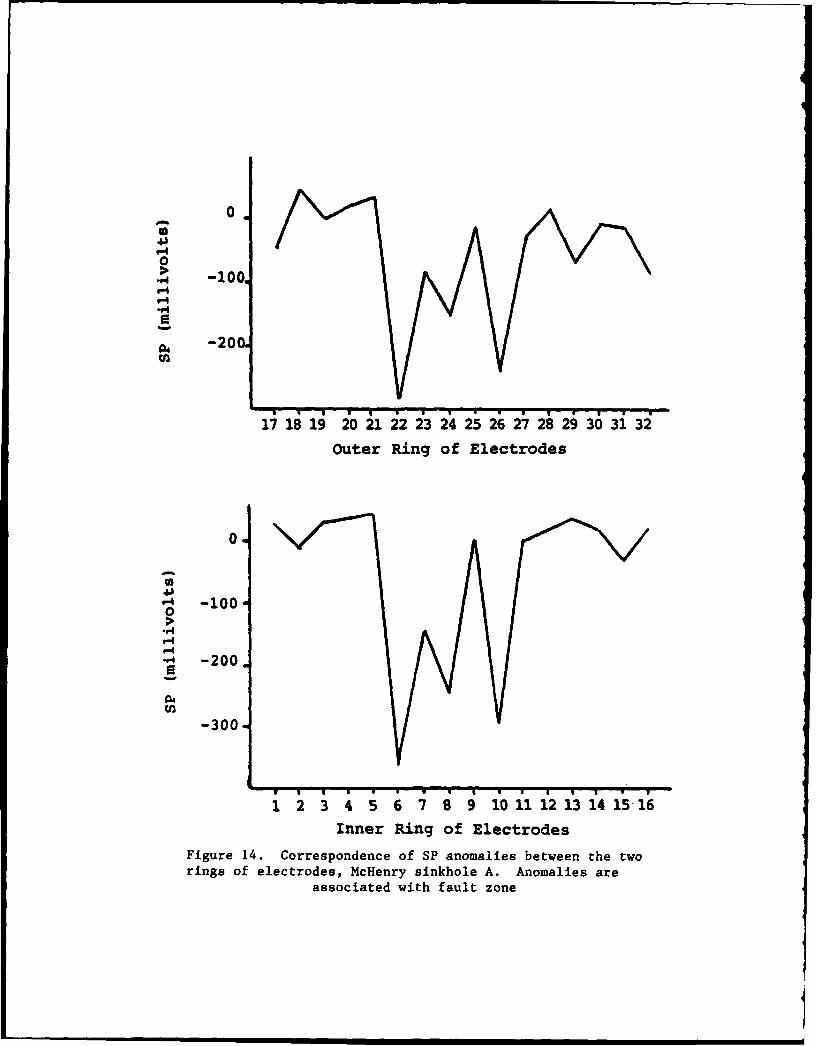
0
o40
-r -00."4
-200
17 18 19 20 21 22 i3 24 25 2i 27 28 29 30 31 32
Outer Ring of Electrodes
0
S
v4
"4 -200.0
-300
1 2 3 4 5 6 7 8 9 101111314116Inner Ring of Electrodes
Figure 14. Correspondence of SP anomalies between the tworings of electrodes, McHenry sinkhole A. Anomalies are
associated with fault zone

N
0 15 imetres g
0
00
0 9
020
100
00
-500-100
"IS
o 000
Figure 15. Electrode array and SP contours in millivolts(McHenry sinkhole B)

100
0
-100V-40
*p 200
-300
-400 N.2
-500 N.2
Time 7/29 8/19 9/17 9/23 10 /9 10/24
Figure 16. Short-term ephemeral anomalies for two electrodes,McHenry sinkhole A
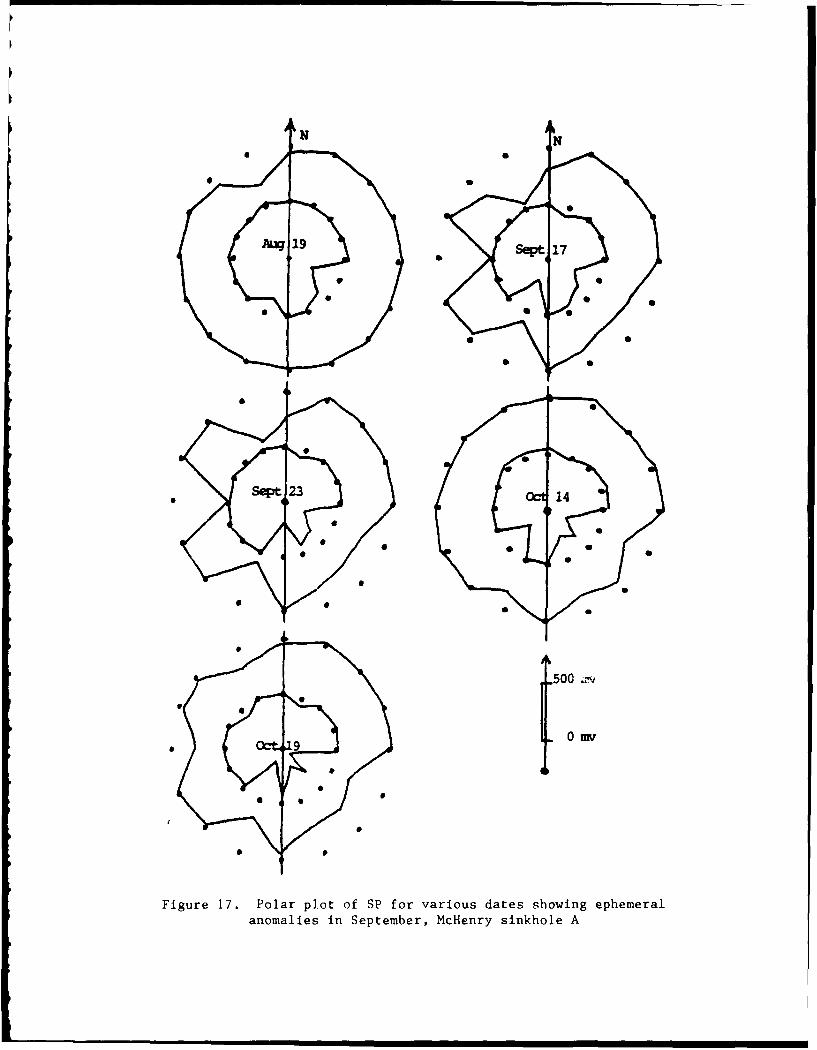
SN
-500 "N
S S t
, ct419 0 MV
Figure 17. Polar plot of SP for various dates showing ephemeralanomalies in September, McHenry sinkhole A
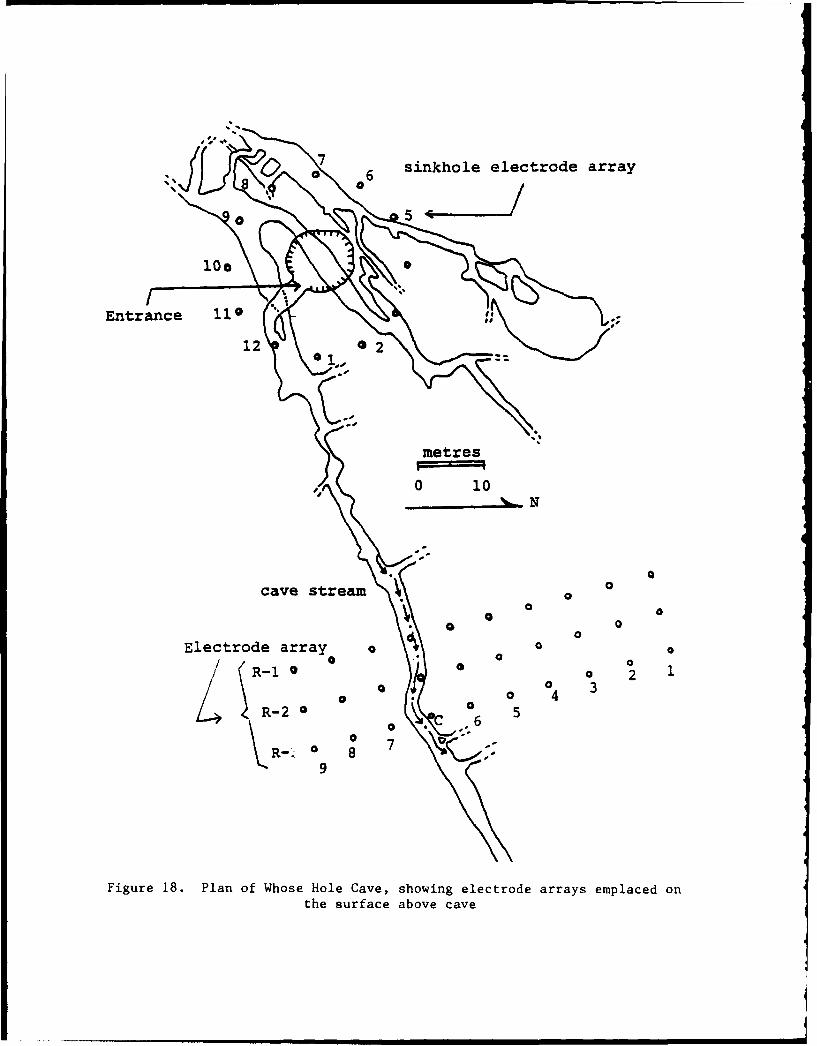
7 sinkhole electrode array
Entrance i11 L, '_.,
cav streares
% 6
Eere ry
0
100 0 0
Entanc stram12 20 10
Electrode array o
0 7
9
Figure 18. Plan of Whose Hole Cave, showing electrode arrays emplaced onthe surface above cave
mmmul mu m mI W"

-10- R- -3
o I /\ . I
C ~\IIle
-300 R-
1 I ' ' ' I I I I' I
1 2 3 4 5 6 C 8 9
Electrode number in each row
17Grud Surface
4 \ 25 metres
Section through
cave stream
Figure 19. SP for the array of three rows (R-1, R-2, R-3) ofelectrodes above cave stream passage, showing dip of bedrock
and influence of joint or fault plane

0 10 fil lmetres
N
4 A
0 Ai n t g t entrance
8/
09 0
10
Figure 20. Array of 12 electrodes at entrance sinkhole over Whose
Hole Cave (Arrows indicate direction of intermittent seepage flow
into and through the cave)
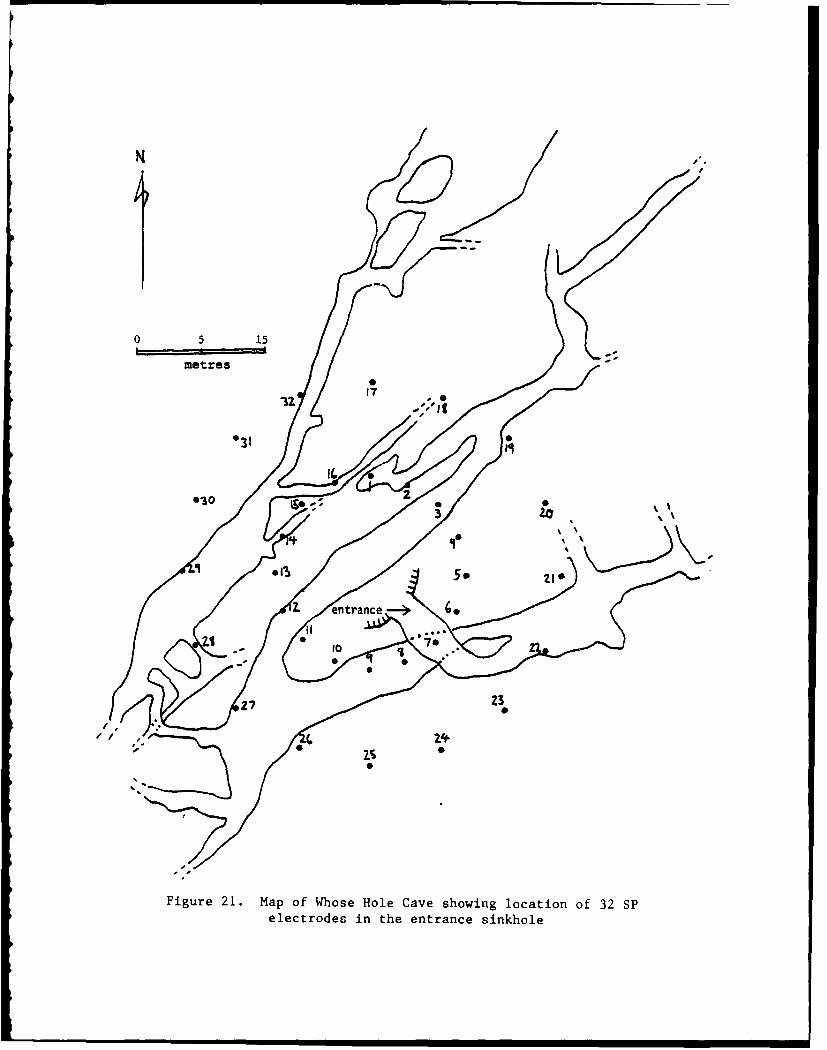
0 5 15
metres
12 (7
3t 0
3 a1b 0 %-, %
oil So ZI O"
entrance. o,7e30
27 2
Figure 21. Map of Whose Hole Cave showing location of 32 SPelectrodes in the entrance sinkhole

N
metres
100 0
-100zoo
3 0
00
00
3too
00
Figure 22. SP contours (in millivolts) at entrance sink, WhoseHole Cave, average of values for December 1986 and January 1987'
(Dots are electrode locations for 32 electrode array)

N0 15
metres
0
.,0
~-200
Ioo
.2100 / '0 too--"- 0
Figure 23. SP values contour map (in millivolts), Whose Hole
Cave sinkhole electrode array, 5 February 1987
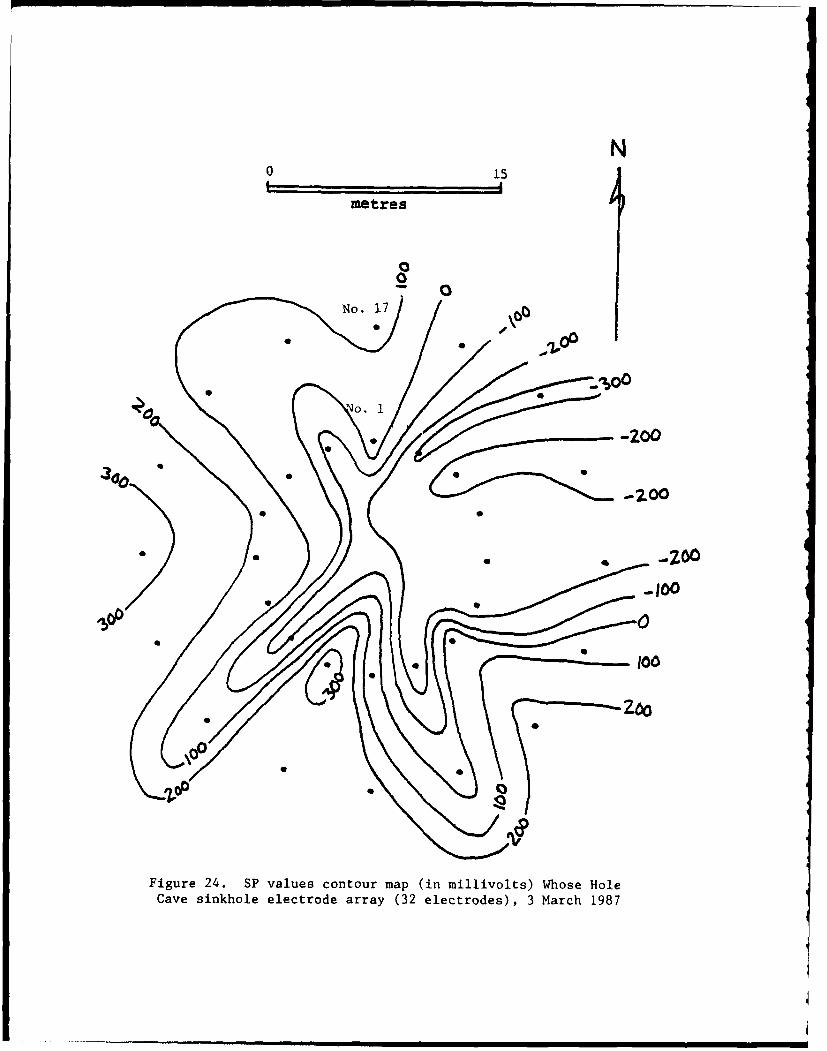
N0 15p p
metres
00
, .Zoo
Figure 24. SP values contour map (in millivolts) Whose HoleCave sinkhole electrode array (32 electrodes), 3 March 1987
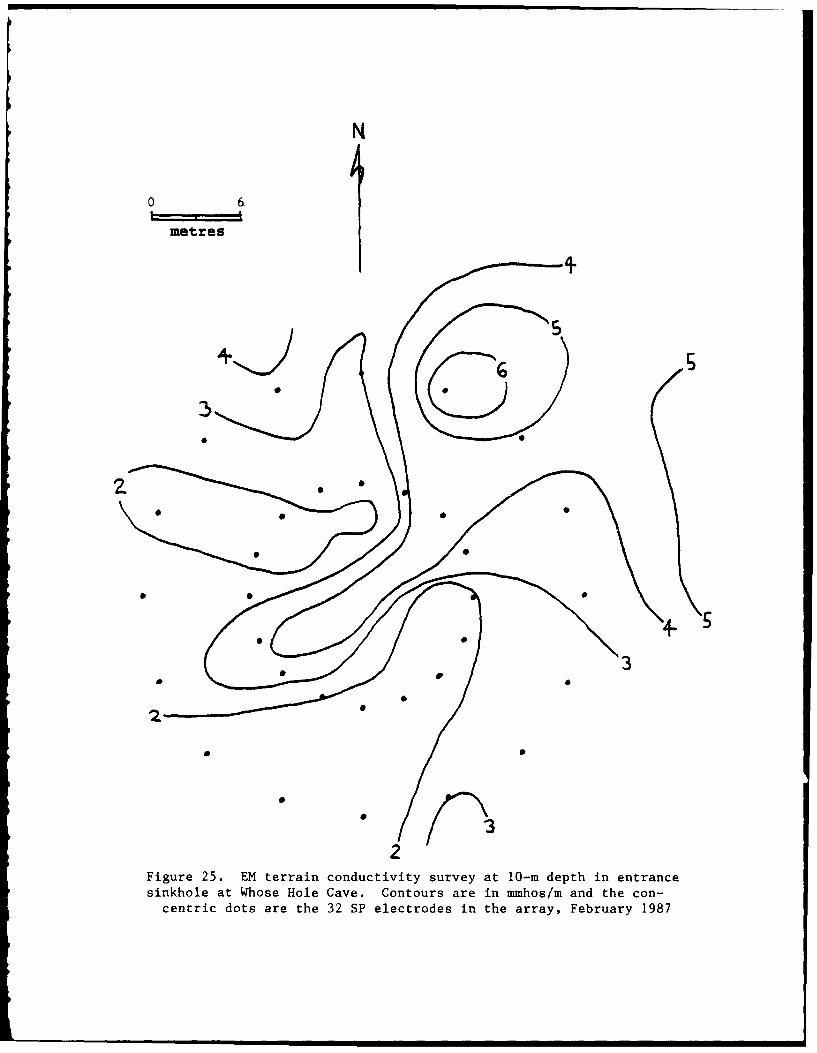
0 6
IN- N
metres
3-3
Figure 25. EM terrain conductivity survey at 10-m depth in entrancesinkhole at Whose Hole Cave. Contours are in mmhos/m and the con-centric dots are the 32 SP electrodes in the array, February 1987

Date
0 9/12
0 9/18
0 9/27
400200,
200. 10/3
-0 0-200
-400 010/9
0 10/14ra
0 0 10/24".4
"-4
0 .10/26
4J ..... 11/2'I
S11/4
0
11/4
1 2 3 4 5 6 7 8 9 10 11 12
Figure 26. SP changes at sinkhole entrance, Whose Hole Cave,
September to November 1986 (Loss and return of anomalies cor-respond to drought effects)

-200
-300.
-400- - 2
3.4 cmrain
0
-4 1 Nov 86-4 - P4 1.3 cm
I, r
15 Oct 86 .. [ri
Figue 27 Varingresponse of four electrodes to precipitation atcave array, "ztober 1986

0
-r
0
00a
0
0 ~4
bo
0~ :1
0
>1 0 4,-4 r4
ul U)
4.) U) W (-44
o 0
0 0V2
a, 4-4-
4.)400
00
r-I (lo) U VH b(00) ean-STOWTT0
TTOS Aul) s C1

04 6
V) to
Wh 4CL
2
5-
250 -Ri Po lcrd o
150-Beg
50
0
.- -50
-150
Rain stops Streamfiow stops
22 *23 '24 25 '26 27 28 29 30
December, 1986
Figure 29. ACD data from electrode monitoring site showing soiltemperature, soil moisture, and SP response of electrode No. 3
(in streambed) to rainfall of 2.5 in. in 24 hr

002
*, V1 IJN
4
co LL0 0 0
4-4
0) u
w -W
4- W CuLZ 0
P $4oI
0 0
1.4 4 J
4-i Cu
4J 4- W -L -J 0 ~-~r-4
IND"~C AR 93U M

100
(my)
50 Test 2
0371 18 19 20 2 2 2 23 24 25 26 27 28 29 30 31 32
Electrodes in the Outer Ring
200
150
+--Test 1 (Oct. 4)
100A
4--Test 2 (Oct. 19)
so do -
1 2 3 4 5 6 7 3 9 10 11 12 13 14 15 16Electrodes in the Inner Ring
Figure 31. Change in SP induced by water discharge tests atMoore sinkhole

0
41
44 C0 0 0
* a,0
-4q
ID -4.0 0
c 416
AA
to
00l

Tim.e lioursl
15 21 27 33 39 4S
Water Daicharqe Time Second )
20 1' q 29o loo 4po sqo sqo 7Qo so
30
00
20
1200
Ims-400
-'S0
-6o
-100
-120
Figure 33. SP response of electrode No. 3 to water discharge test atMoore sinkhole, 4 October

SEl ctodrature o
1Z,
10.
41
IMvi &SP 94 Electrode No. 3
-200-
-3 0 0 - . . . ., 5 7 -
1200 1600 2000 2400 0400 0800 1200
Time (Hours)
Figure 34. SP at Moore sinkhole showing change in SP induced by waterdischarge test and the influence of temperature, 18 and 19 October 1986

444
9.4 4
04)
'4IA 44 b
P44
48 0
*4 1
SI 0941
-' 04-
ha 0.
-4 00002
C;C(AW) S IN) TT;UT0

N
0 15
metres
I.z
S40-metre surve
10-metre survey
Figure 36. EM conductivity surveys at Moore sinkhole A, December 1986,contours in mmhos/m (Circles are SP electrode arrays)

420-metre survey
Figure 37. EM conductivity surveys at Moore sinkhole B, December 1986,contours in mmhos/m (Circles represent SP electrode arrays)

2N
0 15
3 4
33
40-metre survey
20-metre survey
10-metre survey
Figure 38. EM conductivity surveys of Moore sinkhole C, December 1986,contours in mmhos/m (Circles represent SP electrode arrays)
d4

I II Ih b
- p 3 s /
, /
//
Pond '
/-- / /
H0 etres
Figure 39. Moore site sinkholes A, B, and C. Dashed lines aretopographic contours; solid lines are conductivity contours inmmhos/m from 10 m survey in December 1986 (Circles represent thediameter of outer ring of SP electrodes installed in each
sinkhole)

0 30 60
M etres /
Figure 40. Topographic map of the Moores sinkholes site
showing sinkholes A, B, and C, contour intervals 20 ft(Modified from the Lexington, VA, Quadrangle)

N
Metres
Ig11 0 gI So
0~
Zto
15*0
Figure 41. SP contours in millivolts at Moore sinkhole A, averagedfor January 1987 (Circles represent electrode arrays)

N
-I S OI"~
e
0 15
Figure 42. SP contours in millivolts at Moore sinkhole B,
January 1987 (Circles represent electrode arrays)
.............. . 0 a i l i li E
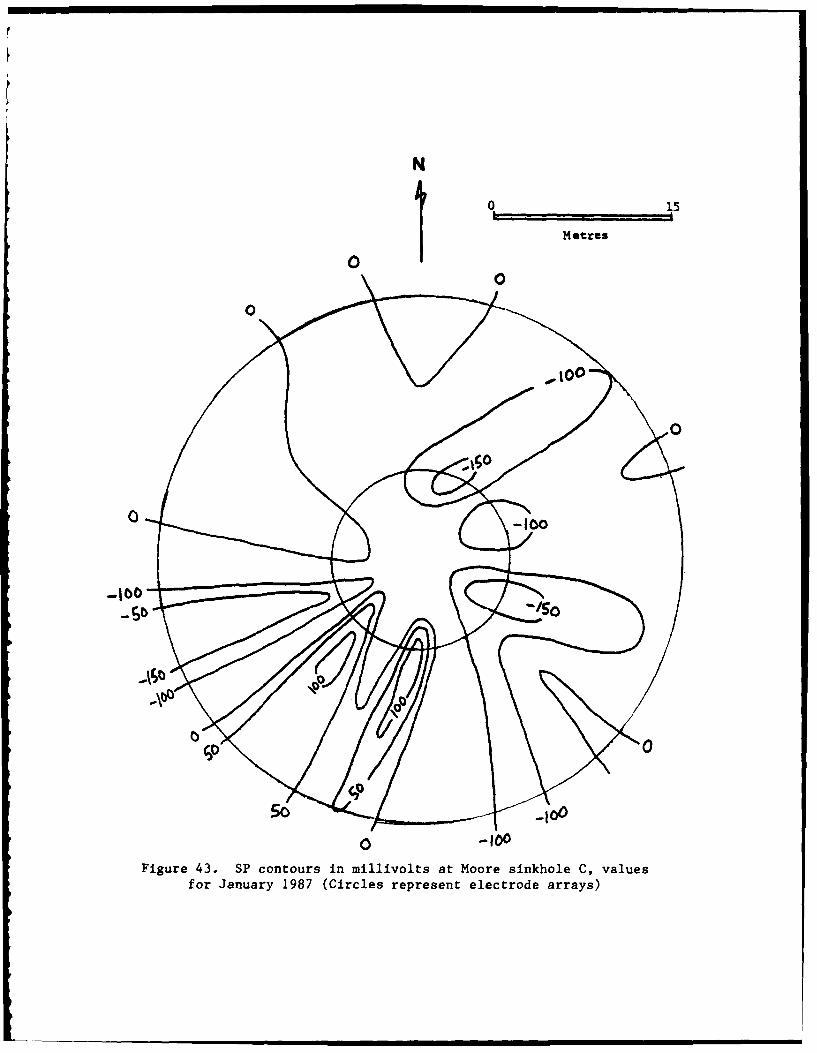
Metres
0
0
C1
0 -100
Figure 43. SP contours in millivolts at Moore sinkhole C, valuesfor January 1987 (Circles represent electrode arrays)
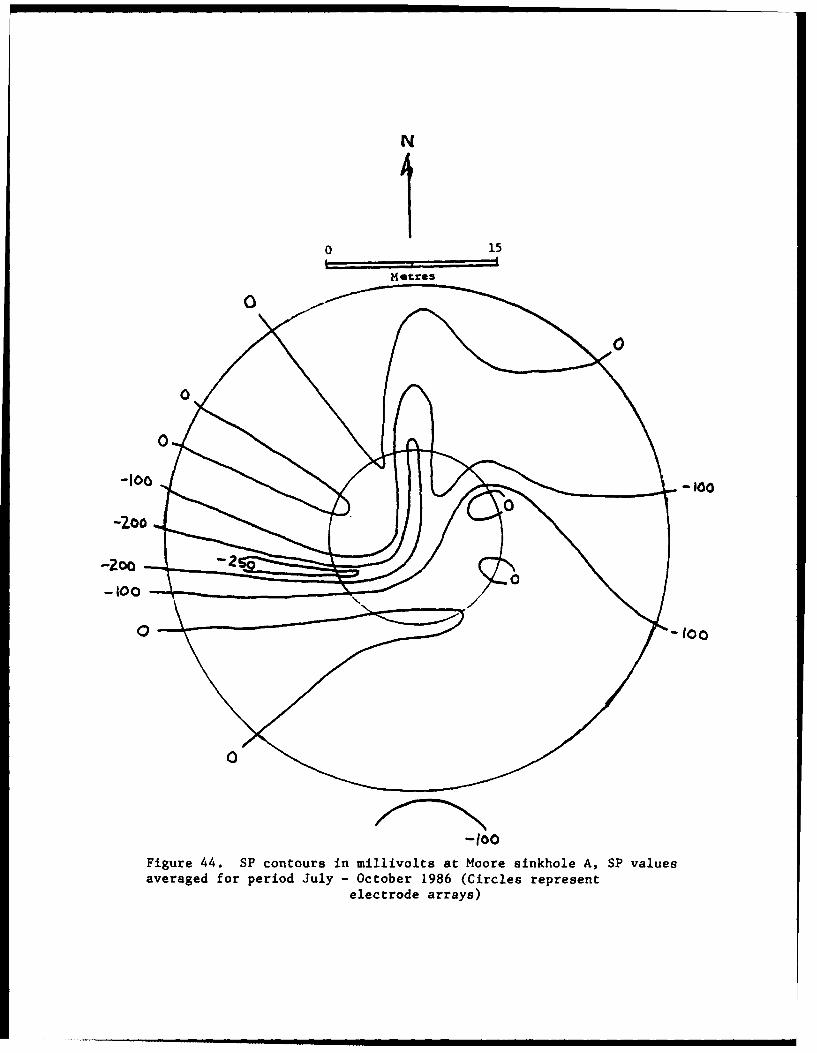
N
o 15
metres
0
o o-I0-
-1K->
-2.00 %W
-2oo - 2 ",
0 -100
-too
Figure 44. SP contours in millivolts at Moore sinkhole A, SP valuesaveraged for period July - October 1986 (Circles represent
electrode arrays)

514
W
-Goai
m 00CR 0
10
'40
-4
44i
(SlI~kAIIIJUA) 0#0PJZ03d

*-4
41
sk4-0
-4
0A1
p00
:1 0
r4~
QE
RAI Q>00
(r.IIOIIIW)Z# PO-0Q50d

41
0
14
41
41
.4-4
41
4-JdS -
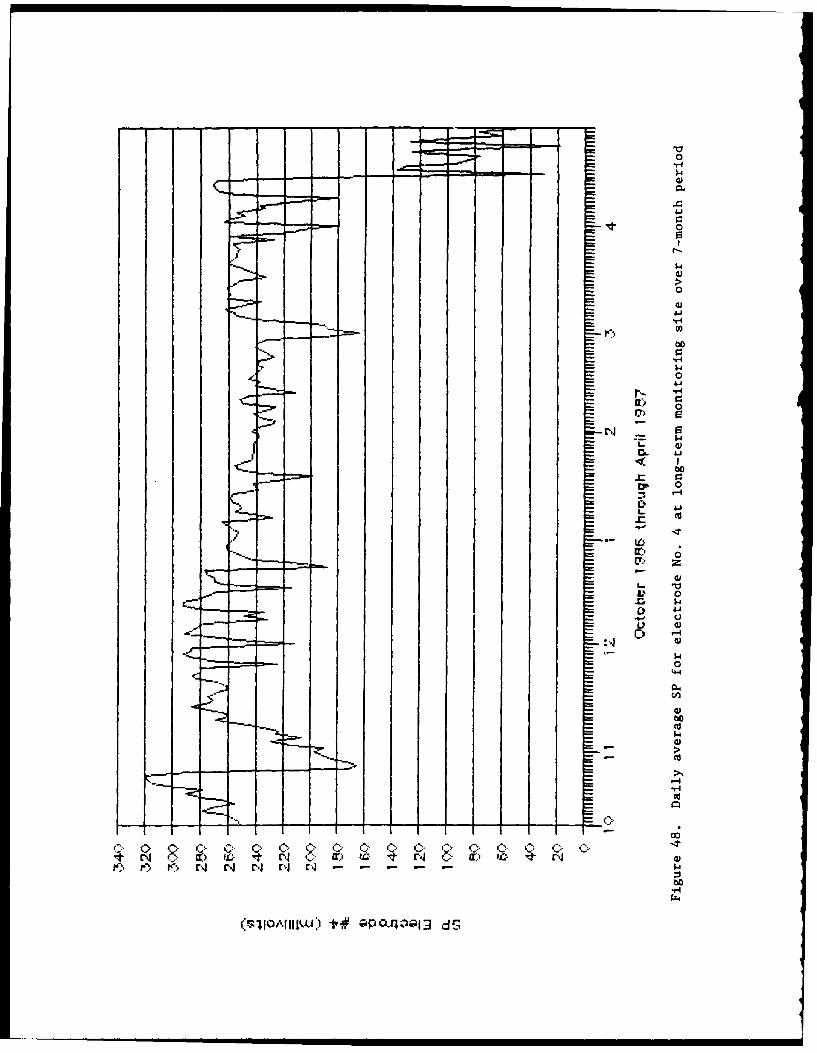
V
0
0
0
b0
0
0
"-4
bo-. V
C.
0- 00
.1
4

41
c) 0
r4.
1- 00
03
4
I
r4J
NC 00
- H
Ld w

00
-4
41
4.
0 -
M 41
"0
00 .
o 3 0
C 0)
k 0
1(1
0 0
V)4
s$4~~r, Lr) toE C c~ r-- 0~I) ' ~

Vw4
'410
4
UU
41
bo
-.4(G~j0,r Q~rl~jQU) -mr-lov4 la,0
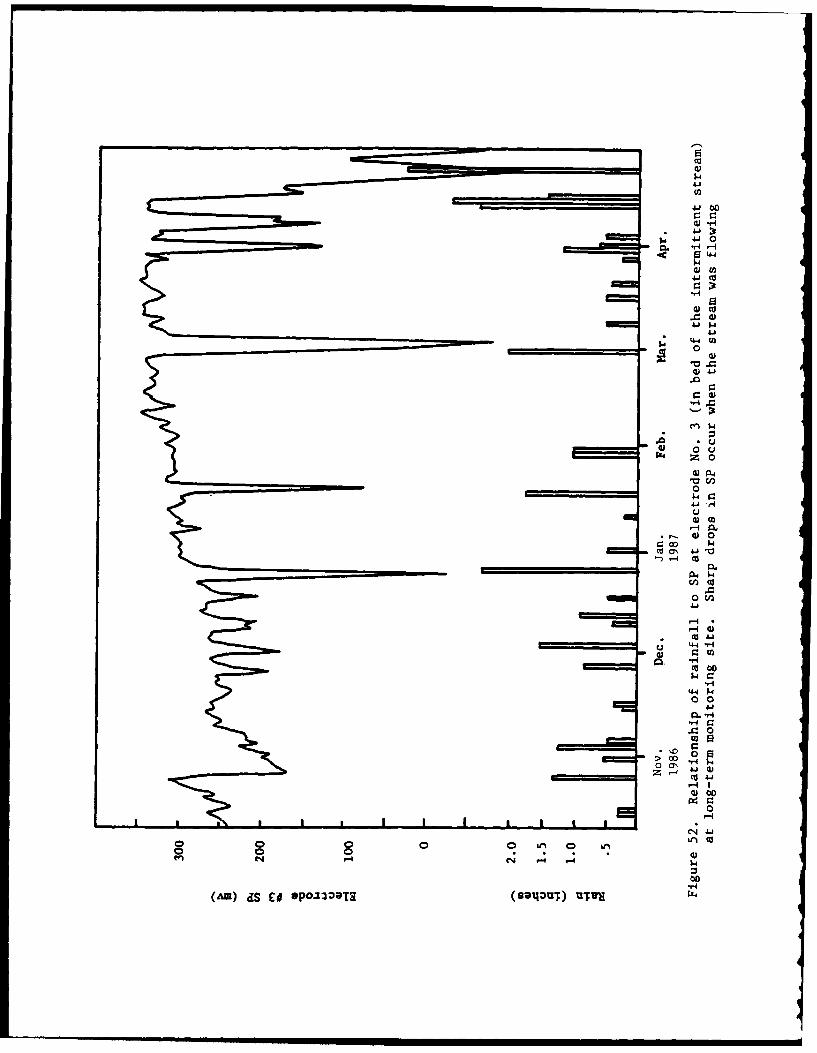
410
0
4-i S 4
$4
GCU
41J$4-4
.0
$4
____ ___ ___ ___ 0
11 .- -o.
In..
S4- ka) 0
0 u
0-l 0
4) 00
00-H
(AM)cIS # OP-230T3 (~qzu) UTH r0
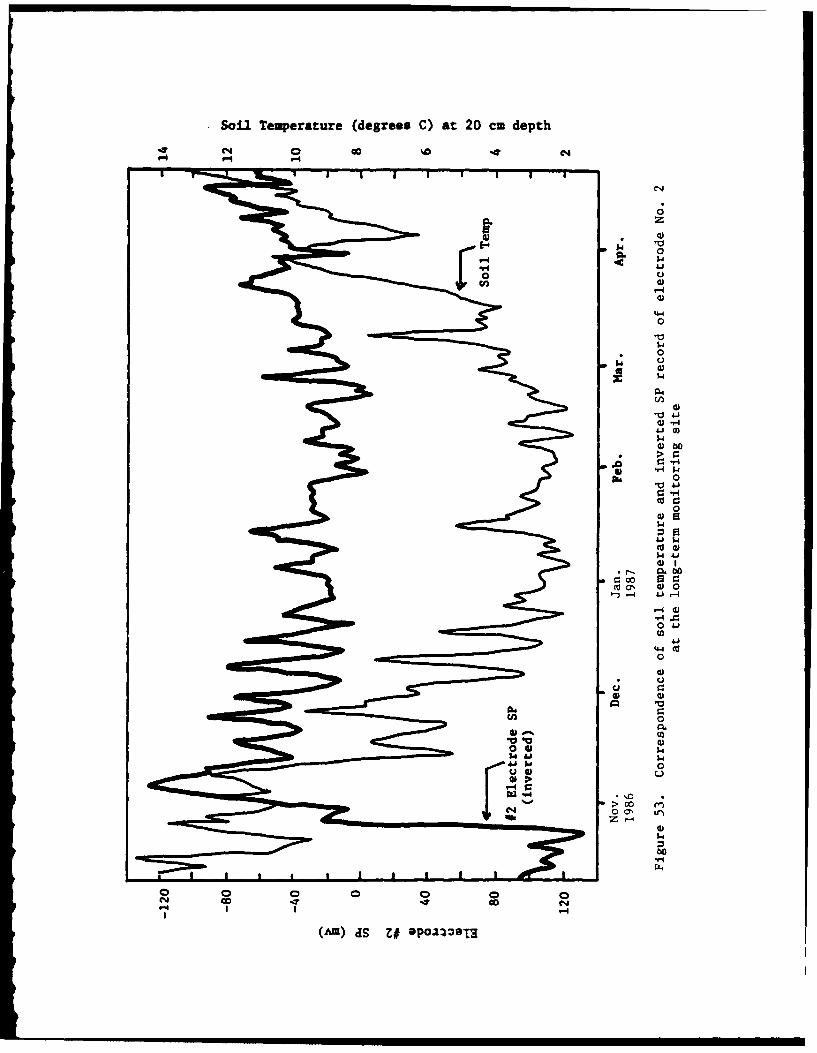
Soil Temerature (degrees C) at 20 cm depth
C40 Go0C
-z
0
04
00
44
0
4
0
0 b
0
0a 4 400
-4
-A X
0
00
0
.$4.
0
> 00 00
Z4 0
04.bo
1.
(Am)~~I- dSZ CU20T

4-
00
0
.2u
0
> '4- 0 w
V 0
r4 -- P4
Cd-
$4
4
C.u- - - 1.4U
# PRUI~d noauquod

4-I
0w
41 -
44
941
;41
£# ~~-~1G ~JL A~O pjpUDI
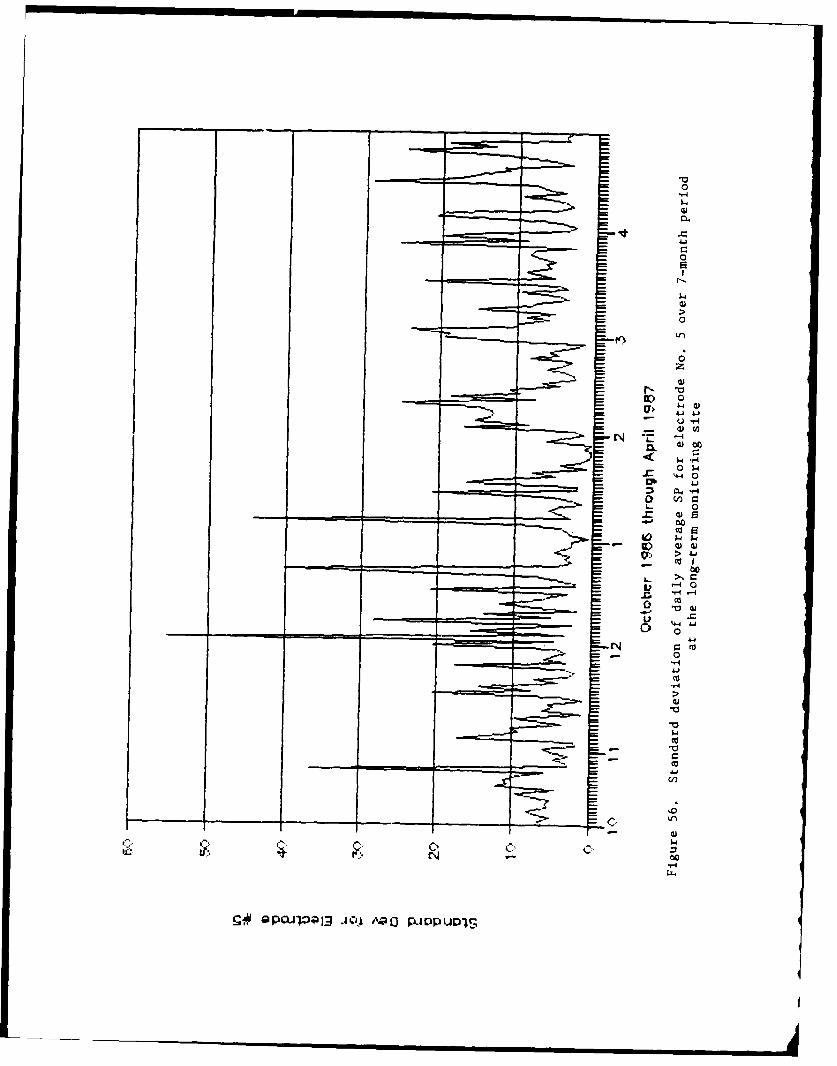
0
1440
p~b
0
5, 0
-
-400