Embed Size (px)
Citation preview

USDA Forest Service Gen. Tech. Rep. PSW-GTR-187. 2003.
Section I
16
INTRODUCTION
USDA Forest Service Gen. Tech. Rep. PSW-GTR-187. 2003. 17
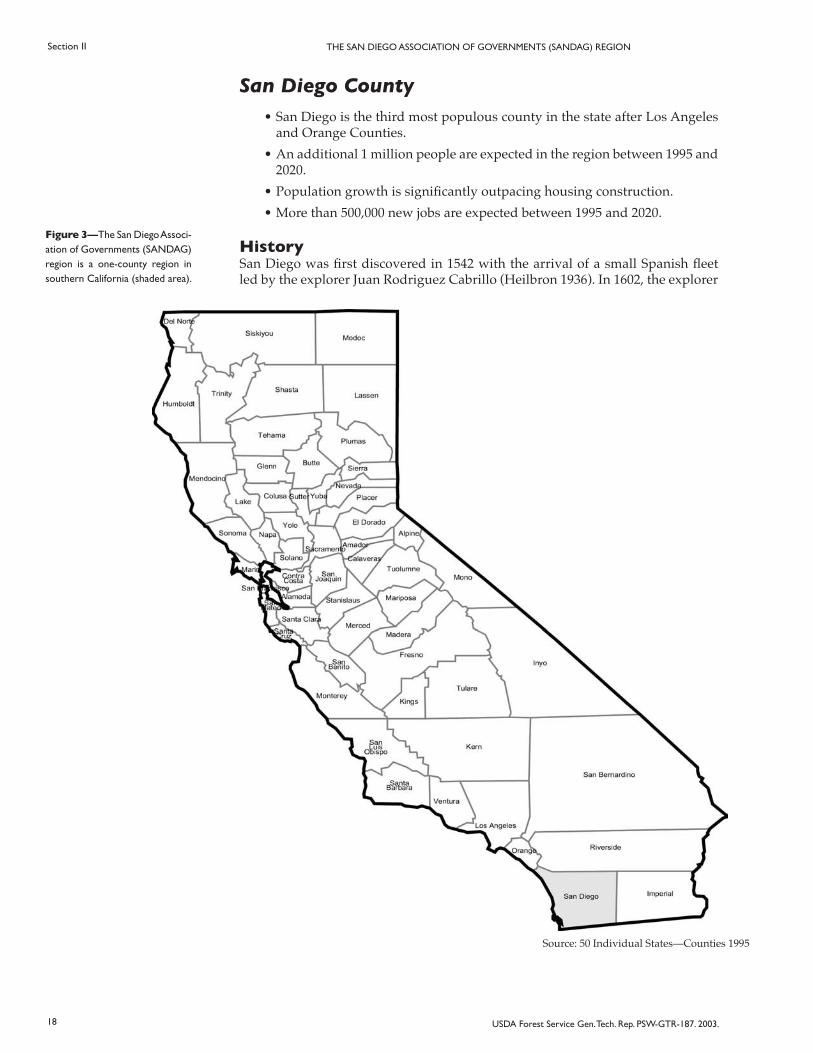
II. The San Diego Association of Governments (SANDAG) RegionThe SANDAG region is a one-county region in southern California naturally circumscribed by the Pacific Ocean to the west, Camp Pendleton to the north, the international border to the south, and mountains and critical habitat to the east (fig. 3). San Diego County is faced with numerous urban growth challeng-es. Rapid population growth, sprawl, traffic congestion, rising home prices, and the disappearance of open space are not unique to San Diego, but are also occurring in other regions of the state. However, because natural barriers in all directions surround San Diego County, there is a limit to the growth that can occur in this county.
SANDAG is the regional agency that addresses such region-wide issues as transportation, environmental management, housing, open space, air quality, en-ergy, fiscal management, criminal justice, and economic development. SANDAG is a “joint powers agency” created under state law by a formal agreement signed by each local government member (www.sandag.cog.ca.us/whats_new/about_sandag.html). It is composed of 18 cities and the county government and serves as the forum for regional decision-making. SANDAG is governed by a board of directors composed of mayors, council members, and a county supervisor from each of the region’s 19 local governments. Supplementing these voting members are advisory representatives from the U.S. Department of Defense, Caltrans, the San Diego Unified Port District, the San Diego County Water Authority, the Metropolitan and North San Diego County Transit Development Boards and Tijuana/Baja California/Mexico.
The 4,200-square-mile San Diego region is a “hotspot” for biodiversity and threatened and endangered species management. The region has more rare, threatened, and endangered species than any comparable land area in the con-tinental United States (Conservation Biology Institute and Ogden Environmental and Energy Services Company 2001, San Diego Association of Governments 2001). The population, housing, and employment growth of the 1980s resulted in a rapid loss of natural habitats. As a result of this habitat loss, San Diego County, its 18 cities, and SANDAG have initiated three multiple habitat/multiple species planning efforts (San Diego Association of Governments 2001). The hope is that an ecosystem approach rather than a jurisdictional approach will serve to protect habitat and wildlife corridors while allowing development to occur in surround-ing areas. The Multiple Species Conservation Program, which was completed in 1997, targets more than 170,000 acres for conservation where 85 sensitive plants and animals will be protected. Similar programs in the northern and eastern portions of the county also establish preserve systems targeting 19,000 acres and 1 million acres, respectively. Ultimately, the goal is to merge the three programs so that a wildlife corridor system can be established and vegetation can also be protected. These efforts will be completed in 2003 (San Diego Association of Governments 2001).
USDA Forest Service Gen. Tech. Rep. PSW-GTR-187. 2003.
Section II
18
THE SAN DIEGO ASSOCIATION OF GOVERNMENTS (SANDAG) REGION
USDA Forest Service Gen. Tech. Rep. PSW-GTR-187. 2003.
Section I1
19
THE SAN DIEGO ASSOCIATION OF GOVERNMENTS (SANDAG) REGION
San Diego County• San Diego is the third most populous county in the state after Los Angeles
and Orange Counties.• An additional 1 million people are expected in the region between 1995 and
2020.• Population growth is significantly outpacing housing construction.• More than 500,000 new jobs are expected between 1995 and 2020.
HistorySan Diego was first discovered in 1542 with the arrival of a small Spanish fleet led by the explorer Juan Rodriguez Cabrillo (Heilbron 1936). In 1602, the explorer
Source: 50 Individual States—Counties 1995
Figure 3—The San Diego Associ-ation of Governments (SANDAG) region is a one-county region in southern California (shaded area).
USDA Forest Service Gen. Tech. Rep. PSW-GTR-187. 2003.
Section II
18
THE SAN DIEGO ASSOCIATION OF GOVERNMENTS (SANDAG) REGION
USDA Forest Service Gen. Tech. Rep. PSW-GTR-187. 2003.
Section I1
19
THE SAN DIEGO ASSOCIATION OF GOVERNMENTS (SANDAG) REGION
Vizcaino entered the bay and named it “San Diego” after his favorite saint. Spain’s primary interest in sending explorers west was to discover a shorter route to the Far East. San Diego’s location, coupled with a wild and mountainous terrain, acted to separate it from the rest of the world (Ebner 1987). For 150 years San Diego ex-isted in isolation. In 1769 Spain sent out two expeditions to San Diego: one by land from Mexico and the other by sea. The land expedition included Father Junipero Serra and Gaspar de Portolá, who continued on to Monterey after the land and sea expeditions united in San Diego.
All the early Spanish governors of California from 1769 to 1800 either lived in or visited San Diego. In fact, it held such importance economically and as an entry point to the region that by 1850 it was known all over the world. Hides and whale oil were the early commercial exports from the region, remaining the state’s major exports from 1770 to 1870 (Carroll 1993).
El Camino Real, “the King’s Highway,” begins at the Mission San Diego de Alcalá and links all the California missions. The Mission San Diego de Alcalá is considered the “mother” mission. The missions were secularized in 1835. Before secularization, there were no privately owned ranches in the region. Grazing cattle was the predominant land use.
In 1850, the city of San Diego was founded. Also in 1850, California was ad-mitted to the Union, and San Diego County became the first of the state’s original 27 counties. Settlers from all over the country had migrated to the city, and the period from 1850 to 1874 was spent incorporating the city, fixing boundaries, controlling the San Diego River, and establishing infrastructure. One of the early city developers was Alonzo Horton, who purchased 960 acres near the harbor for $265 (Ebner 1987) and laid the land out in city blocks and lots. By 1870, Horton’s land was called “New San Diego” and was considered a choice location for busi-ness. As the success of “New Town” grew, water acquisition for the city became more important. In 1873, the San Diego Water Company formed and a sunken well downtown provided water to the immediate area. Another group formed the San Diego Flume Company in order to develop a water supply in the mountains, resulting in the Cuyamaca Dam and a 31-mile flume down the mountain (Ebner 1987). A separate project in the 1900s involved a canal system constructed from the Colorado River. By 1902, 400 miles of canals were in service and almost 100,000 acres of the Imperial Valley were cultivated. In 1907, Imperial Valley voted to form a separate county and seceded from San Diego.
With the onset of World War II, it became increasingly apparent that new sources of water for the city would have to be developed. Navy installations were putting an added strain on a limited water supply (Ebner 1987). To alleviate the shortage, the Navy appealed to Washington for funds to obtain Colorado River water. Because the development of an additional water supply was a wartime emergency, funds were made available from the Federal government. In 1944, the San Diego Water authority was formed. President Franklin D. Roosevelt directed immediate construction of an aqueduct connecting the Colorado River Aqueduct of the Metropolitan Water District with the San Diego water system at its San Vi-cente reservoir. The aqueduct is 71.1 miles long: 30.4 miles are in Riverside County and 40.7 miles are in San Diego County.
The Korean War brought new jobs and activity to the area. Population grew once more, and by the early 1950s, the San Diego Water Authority was serving more than a half million people. Congress authorized the Navy to add a “second barrel” to the original pipeline, completed in 1954 (Ebner 1987). In 1960, construc-tion was underway on a second San Diego Aqueduct. Voters also ratified a state proposition to secure northern California water. In 1966 and 1983, voters again approved funds to expand water pipelines of the San Diego Aqueduct.
Through the years, the industrial base diversified, including firms specializing in computers, oceanography, and research and development in addition to the existing military presence and aerospace industry.
´

USDA Forest Service Gen. Tech. Rep. PSW-GTR-187. 2003.
Section II
20
THE SAN DIEGO ASSOCIATION OF GOVERNMENTS (SANDAG) REGION
USDA Forest Service Gen. Tech. Rep. PSW-GTR-187. 2003.
Section I1
21
THE SAN DIEGO ASSOCIATION OF GOVERNMENTS (SANDAG) REGION
San Diego County TodaySociodemographic CharacteristicsProjected Population—The population of San Diego County has more than dou-bled in the past 25 years (San Diego Association of Governments 1998a), making San Diego third to Los Angeles and Orange Counties in population (United States Census Bureau 2000). The highest growth rate occurred in the 1970s when the population grew by 37 percent. In the 1980s and 1990s, the population grew more slowly, with the recession tempering the county’s growth. Growth will continue according to DOF and SANDAG, the two agencies that have published projections for the San Diego region. SANDAG predicts 1 million more people in the region be-tween 1998 and 2020; DOF’s forecasts are even higher. However, DOF’s projections do not take into account economic considerations, while SANDAG’s projections factor in job availability. This explains SANDAG’s lower estimates (table 4).
Table 4—Population projections, San Diego County, 1990-2040.
Source 1990 1995 2000 2005 2010 2020 2030 2040
U.S. Census 2,498,0161 - 2,813,833 - - - - -DOF 2,511,3692 - 2,943,001 - 3,441,436 3,917,001 4,484,673 5,116,228
SANDAG - 2,669,300 - 3,223,400 3,437,600 3,853,300 - -
Source: United States Census Bureau 1990a and 2000, State of California Department of Finance 1998, San Diego Association of Governments 1999e1 Data from April 1.2 Data from July 1.
Ethnic and Racial Diversity—The racial and ethnic diversity of the region is more pronounced than in the nation as a whole but mirrors that of California (San Diego Association of Governments 1998a). In 1990, Whites were the largest ethnic group in the county followed by Hispanics, Asians, Blacks, and American Indians (table 5). In 2000, Whites remained the largest ethnic group, but their proportion of the population decreased and the proportion of Hispanics and Asians increased. The proportion of Blacks and American Indians also decreased.
Table 5—1990 and 2000 population, San Diego County.
1990 2000
-----------------------------Percent------------------------
Non-Hispanic White 65.4 55.0Hispanic all races 20.4 26.7Non-Hispanic Black 6.0 5.5Non-Hispanic Asian 7.4 9.1Non-Hispanic American Indian 0.6 0.5Non-Hispanic other 0.2 0.2Non-Hispanic two or more races N/A 2.9
Source: United States Census Bureau 1990a, 2000
Hispanics are the largest ethnic group in the region, followed by Asians. Blacks have a presence in the county at 6 percent (compared to the much larger county of Los Angeles where Blacks comprise 10 percent of the population). The higher number of Blacks in San Diego County compared to surrounding counties (Riv-erside, 5 percent; Imperial County, 2 percent; Orange County, less than 2 percent) may be due to employment at one of San Diego’s many military installations. In 1990, 17.2 percent of San Diego County’s population was foreign-born.
In 1990, more than 25 percent of residents 5 years of age and older spoke a language other than English at home. Of those, 64.1 percent spoke Spanish, and 35.9 percent spoke a language other than English or Spanish (United States Census Bureau 1990b).

USDA Forest Service Gen. Tech. Rep. PSW-GTR-187. 2003.
Section II
20
THE SAN DIEGO ASSOCIATION OF GOVERNMENTS (SANDAG) REGION
USDA Forest Service Gen. Tech. Rep. PSW-GTR-187. 2003.
Section I1
21
THE SAN DIEGO ASSOCIATION OF GOVERNMENTS (SANDAG) REGION
Linguistic diversity is also reflected within the schools in the region. The majority of LEP students in San Diego County public schools speak Spanish—mir-roring the languages spoken at home—or a selection of other languages, such as Pilipino (Tagalog), Vietnamese, Lao, and Khmer (fig. 4). In 1997-98, 22.1 percent of San Diego’s public school students were LEP.Projected Ethnic and Racial Diversity—Beyond increases in overall population, there are two overall trends in San Diego that are projected through 2040: a sub-stantial decrease in the White population as a proportion of the total population and an increase in the Hispanic population as a proportion of the total population (fig. 5). These trends reflect an increasingly diverse population in the region.
The Hispanic population is not expected to surpass the White population as a proportion of the total population until 2040. Asians are expected to increase their proportion of the population by almost 6 percent through the forecast period, while Blacks and American Indians are expected to decrease as a proportion of the total population (table 6).
Figure 5—Racial and ethnic diver-sity trends for San Diego County.
Figure 4—Limited-English-Profi-cient (LEP) students in San Diego County public school districts, by language, 1997-1998.
Source: California Department of Education 1998b
Source: State of California Department of Finance 1998

USDA Forest Service Gen. Tech. Rep. PSW-GTR-187. 2003.
Section II
22
THE SAN DIEGO ASSOCIATION OF GOVERNMENTS (SANDAG) REGION
USDA Forest Service Gen. Tech. Rep. PSW-GTR-187. 2003.
Section I1
23
THE SAN DIEGO ASSOCIATION OF GOVERNMENTS (SANDAG) REGION
Table 6—Percent race/ethnicity and percent change in San Diego County, 1990-2040.
Racial/ethnic group 1990 2000 2010 2020 2030 2040 Cumulative percent change------------------------------------------------ Year ------------------------------------------------
White 65.37 59.31 53.80 48.36 43.22 38.58 - (-6.06) (-5.51) (-5.44) (-5.15) (-4.63) -26.78
Hispanic 20.57 25.02 29.14 33.57 38.07 42.40 - (4.44) (4.13) (4.42) (4.51) (4.33) 21.83
Asian/Pacific Islander 7.45 9.07 10.65 11.78 12.73 13.34 - (1.62) (1.58) (1.13) (0.95) (0.61) 5.89
Black 6.01 6.05 5.90 5.82 5.55 5.30
- (0.04) (-0.15) (-0.08) (-0.27) (-0.26) -0.71
American Indian 0.60 0.55 0.51 0.47 0.43 0.38 - (-0.05) (-0.04) (-0.03) (-0.05) (-0.05) -0.23
Source: State of California Department of Finance 1998
In addition to the projected changes in race and ethnicity, changes in the population’s median age are projected. Projected median age for San Diegans varies by race/ethnicity and gender. Overall, females have higher median ages across the forecast period. American Indians have the highest median age in San Diego through the forecast period, increasing from an average of 28 to 42, followed by Asians (increasing from 28 to 35.5) and Whites (from 33.5 to 35.5) (fig. 6). The youngest median ages through the forecast period are for Blacks (increasing from 24.5 to 27) and Hispanics (from 23.5 to 25). Although the median age in the region is increasing, Hispanics are projected to have the youngest age structure and the largest share of children of any ethnic group (San Diego Association of Govern-ments 1999a). These increases in median age are smaller increases than what is projected for the whole assessment area, and median ages are lower in the county across all ethnic/racial groups.
Figure 6—Median age by gender and race/ethnicity, San Diego County, 1990-2040.
Source: State of California Department of Finance 1998

USDA Forest Service Gen. Tech. Rep. PSW-GTR-187. 2003.
Section II
22
THE SAN DIEGO ASSOCIATION OF GOVERNMENTS (SANDAG) REGION
USDA Forest Service Gen. Tech. Rep. PSW-GTR-187. 2003.
Section I1
23
THE SAN DIEGO ASSOCIATION OF GOVERNMENTS (SANDAG) REGION
Development and Real EstateThe majority of construction in the region has occurred in incorporated areas (fig. 7). The late 1980s showed a dramatic decline in construction, followed by a slow upward trend beginning in 1994. Non-residential construction in unincorporated areas remained at a low level throughout 1987 to 1998. As build-out is reached, there may be pressure to develop in unincorporated areas.
Even though population growth slowed relative to growth in the region during the 1970s and 1980s, current growth has significantly outpaced housing development. During the 1970s, the region built, on average, one new housing unit per every 1.9 residents. The ratio dropped to one new unit for every 2.8 new residents in the 1980s and slowed even more in the 1990s, to one unit for every 4.5 new residents. The 1998 ratio was one unit per 5.2 new residents. As a result, the region’s average household size continues to climb (San Diego Association of Governments 1999c). This discrepancy between population growth and home construction could result in a housing crisis for the region (San Diego Association of Governments 1999c).
In 1990, San Diego County had 887,403 households and 946,240 housing units. The vast majority (93.8 percent) of housing units were occupied, and only 6.2 percent were vacant (United States Census Bureau 1990a). Of the occupied hous-ing units, a slight majority (53.8 percent) were owner-occupied, and 46.2 percent were renter-occupied (United States Census Bureau 1990a). The median value of the owner-occupied housing units in 1990 was $186,700, and the median rent was $611 per month.
Quality of Life IndicatorsTransportation, Commuting, and Employment—In 1990, there were 1,230,446 workers age 16 and older in San Diego County, and an average of 1.8 vehicles per household. Few residents (3.4 percent) worked outside the county. The majority (71 percent) drove to work alone, although some carpooled to work (14 percent) (fig. 8). Very few used public transportation. The average travel time to work was 22.2 minutes, which was slightly less than the average commute of 24.8 minutes for workers in the neighboring SCAG region.
Figure 7—Building trends, San Diego County, in 1998 dollars, 1987-1998.
Source: Construction Industry Research Board 1988-1999

USDA Forest Service Gen. Tech. Rep. PSW-GTR-187. 2003.
Section II
24
THE SAN DIEGO ASSOCIATION OF GOVERNMENTS (SANDAG) REGION
USDA Forest Service Gen. Tech. Rep. PSW-GTR-187. 2003.
Section I1
25
THE SAN DIEGO ASSOCIATION OF GOVERNMENTS (SANDAG) REGION
San Diego has an export-driven economy. Export-driven businesses have replaced manufacturing as a major component of industrial output. The manu-facturing sector once comprised about 30 percent of the region’s employment, but today it has dropped to less than 15 percent of total employment (San Diego Association of Governments 1998b). The former reliance on aerospace and defense is being replaced with emerging jobs in industries such as software, communica-tions, and biotechnology (San Diego Association of Governments 1998b).
The San Diego region has 16 industry clusters that serve as engines of growth. According to the San Diego Association of Governments (1998b), these clusters are software and computer services, biotechnology and pharmaceuticals, computer and electronics manufacturing, communications, financial services, defense and transportation management, biomedical products, environmental technology, rec-reation goods manufacturing, medical services, business services, entertainment and amusement, horticulture, visitor industry services, fruits and vegetables, and uniformed military. During 1996, the 16 clusters accounted for 32 percent of the region’s total employment. The visitor industry services and business services clusters employ the most workers.
Agriculture in San Diego is big business even though the region is urbanizing. The top five commodities are nursery and greenhouse crops, fruits, vegetables, poultry, and dairy products. The market value of agricultural products sold in-creased 27 percent to $632,731,000 from 1992 to 1997 (United States Department of Agriculture 1997). However, the number of full-time farms in the county decreased 8 percent from 1992 to 1997 (United States Department of Agriculture 1997).
Most of the growth in the county through 2020 will occur in the north inland, north coastal and south bay portions of the county and will be captured by such cities as Carlsbad, San Marcos, and Chula Vista (San Diego Association of Gov-ernments 1999d). The growth in the northern portion of the county is due to the concentration of cluster employment. For instance, Carlsbad has three times the regional average in employment in the recreational goods manufacturing cluster. San Marcos has three times the regional average in employment in the environmen-tal technology cluster. The city of San Diego, however, contains the majority of the region’s employment opportunities and will remain a strong economic force.
Figure 8—Commuting patterns, workers 16 and older, San Diego County, 1990.
Source: United States Census Bureau 1990b

USDA Forest Service Gen. Tech. Rep. PSW-GTR-187. 2003.
Section II
24
THE SAN DIEGO ASSOCIATION OF GOVERNMENTS (SANDAG) REGION
USDA Forest Service Gen. Tech. Rep. PSW-GTR-187. 2003.
Section I1
25
THE SAN DIEGO ASSOCIATION OF GOVERNMENTS (SANDAG) REGION
Cost of Living/Expenditures—Overall, percent of annual income that residents expended for various items did not change much for the 1986 to 1998 period (fig. 9). The years 1987 and 1988 were an aberration for the state as well as the county. San Diego residents spent 10 percent more than their income in 1987 and 1988. During this time, savings disappeared as residents spent more on other items.Education—San Diego County serves the largest number of students in its el-ementary schools (table 7). The county also has more elementary schools (386) than middle and high schools (80 and 63, respectively). Average enrollment per school is greatest at the high school level, which is the pattern across the assessment area and all counties. San Diego serves about 9 percent of the assessment area’s school enrollments. County schools have the second highest enrollment overall (exceeded only by Los Angeles), yet they are fifth in highest average enrollment per school. Students in 2nd through 11th grade were tested using the Stanford 9 at 504 of the county schools. San Diego’s ranking in academic performance for 1999 was a mean of 7.28 out of 10 (based on the similarity index, www.cde.ca.gov), indicating high-er-than-average performance than similar schools. Although 6.2 percent and 11 percent of schools in the county performed well below or below average compared to similar schools, an impressive 42.8 percent were well above average and 25.2 percent were above average. This county has the highest academic performance based on the average similarity index of all 26 counties in the assessment.
Figure 9—Average annual expen-ditures as a percentage of income before taxes, San Diego Metropoli-tan Statistical Area, 1986-1998 (no data for 1995-1996).
Source: Bureau of Labor Statistics 2000

USDA Forest Service Gen. Tech. Rep. PSW-GTR-187. 2003.
Section II
26
THE SAN DIEGO ASSOCIATION OF GOVERNMENTS (SANDAG) REGION
USDA Forest Service Gen. Tech. Rep. PSW-GTR-187. 2003.
Section I1
27
THE SAN DIEGO ASSOCIATION OF GOVERNMENTS (SANDAG) REGION
Table 7—Enrollment and number of schools, San Diego County, 1998-1999.
Type of school Total enrollment
Percent of total enrollment
Number of schools
Average enrollment/school
Elementary 249,345 54.6 386 646
Middle/Junior High 85,367 18.7 80 1,067
High School 121,758 26.7 63 1,933
Total 456,470 100.0 529 _
Source: California Department of Education 1998a
Health Care—The largest number of health care establishments in the county deliver ambulatory health care services, followed by social assistance, nursing and residential care, and hospital care (fig. 10). The county has 33 hospitals, representing 8.3 percent of the assessment area’s total hospitals (ahd.tool.net/list.php3/mstate=ca). Slightly more than half (51.5 percent) of the hospitals are nonprofit, with the balance classified as county (18.2 percent), Federal (9.1 per-cent), or for-profit (21.2 percent) facilities. For those hospitals with reported data (27 hospitals), a total of 6,410 beds and 1,407,045 total patient days were recorded in 1999. The county ranked third in number of hospitals, comparable to its third-place ranking in population. U.S. News & World Report ranked UCSD Medical Center 8th in the treatment of respiratory disorders and 34th in rheumatology na-tionwide (www.usnews.com/usnews/nycu/health/hosptl/metro.htm#).Recreation and Tourism—Among the assessment area’s 26 counties, San Diego ranked second in the 1997 economic census in accommodations and food services, and third in arts, entertainment, and recreation (United States Census Bureau, 1999b, 1999c). A total of 5,426 accommodation and food-services establishments, with $4,237,852,000 in receipts, was reported. Arts, entertainment, and recreation services involved 574 establishments, with receipts totaling $946,890,000.
San Diego County offers a number of special sites for recreation and tourism. Within the county, opportunities include the Cleveland National Forest, three state parks, seven beaches, two state historic monuments and one state reserve (www.wildernet.com). The Anza-Borrego Desert State Park is known for its spring
Figure 10—Health care and social assistance establishments, San Diego County, 1997.
Source: United States Census Bureau 1999a

USDA Forest Service Gen. Tech. Rep. PSW-GTR-187. 2003.
Section II
26
THE SAN DIEGO ASSOCIATION OF GOVERNMENTS (SANDAG) REGION
USDA Forest Service Gen. Tech. Rep. PSW-GTR-187. 2003.
Section I1
27
THE SAN DIEGO ASSOCIATION OF GOVERNMENTS (SANDAG) REGION
wildflowers, as well as camping and hiking opportunities. Corral Canyon and the Ocotillo Wells State Vehicular Recreation Area offer off-roading opportunities. Hikers seeking views of waterfalls can visit the Holy Jim, Ortega, and Tenaja Falls on the Cleveland. The Pacific Crest Trail crosses the Cleveland National Forest as it traverses the U.S. from Mexico to Canada. The world-renowned Palomar Observa-tory is also located in the county (www.wildernet.com). Finally, the San Diego Zoo, the San Diego Wild Animal Park, Sea World, and Legoland are significant tourist draws (www.sandiegoadventures.com/site/themeparks.cfm). With a relatively mild climate, tourism is popular year-round.
Environmental IndicatorsWater Quality—San Diego County crosses five watersheds: Aliso-San Onofre, which spans south Orange County and north San Diego County; Santa Margarita, which includes Camp Pendleton east to Temecula; San Diego, which includes the city of San Diego; Cottonwood-Tijuana, which includes Imperial Beach; and Salton Sea, which includes the city of Banning south to Calexico (www.epa.gov/surf3/surf98/county.html). (Watersheds frequently cross county boundaries. Therefore, some counties may include watersheds that are also located in other counties.)
The Salton Sea watershed was assigned a “5” by the Environmental Protec-tion Agency (EPA), indicating “more serious water quality problems but low vulnerability to pollution stressors.” (According to the EPA’s Index of Watershed Indicators procedures, a pollution stressor includes aquatic/wetland species at risk, toxic loads above limits, urban runoff potential, agricultural runoff potential, population change, hydrologic modification, estuarine pollution susceptibil-ity, and atmospheric deposition.) The San Diego watershed was assigned a “2,” indicating a “better water quality but high vulnerability to pollution stressors.” Aliso-San Onofre and Cottonwood-Tijuana were both assigned a “1,” representing “better water quality and low vulnerability to pollution stressors.” Data are not available for the Santa Margarita watershed.Air Quality—San Diego County has the second largest population of the 26 coun-ties, paired with the second highest emissions from all categories (table 8). The majority of emissions are projected for significant or marginal decreases depen-dent upon emission type. Particulates are expected to increase, primarily from area-wide sources, according to the California Air Resources Board (1999).
Table 8—1996 estimated and 2010 forecasted annual average emissions, San Diego County (cells do not add to column totals due to rounding error).
Year Emission category
Emission type1
TOG ROG CO NOx SOx PM PM10
1996 Stationary 270 45 21 16 3 15 7Area-Wide 71 45 120 4 0 180 92Mobile 160 150 1,300 200 8 10 9Natural 6 4 67 1 - 11 10Total 510 240 1,500 220 11 210 120
2010 Stationary 340 60 25 13 4 19 10
Area-Wide 75 48 100 6 0 230 120Mobile 69 64 680 130 8 10 8Natural 7 4 67 1 - 11 11Total 490 180 870 150 12 270 150
Source: California Air Resources Board 19991TOG: total organic gases; ROG: reactive organic gases; CO: carbon monoxide; NOx: nitrogen oxides; SOx: sulfur oxides; PM: particulate matter; PM10: particulate matter less than or equal to 10 microns (appendix D).

USDA Forest Service Gen. Tech. Rep. PSW-GTR-187. 2003.
Section II
28
THE SAN DIEGO ASSOCIATION OF GOVERNMENTS (SANDAG) REGION
USDA Forest Service Gen. Tech. Rep. PSW-GTR-187. 2003.
Section I1
29
THE SAN DIEGO ASSOCIATION OF GOVERNMENTS (SANDAG) REGION
Summary and Implications for the SANDAG RegionThe pace and shape of growth in the region will depend on the development of transportation routes, the availability of water, and economic growth. SANDAG predicts that the pace of road construction will accelerate between 1999 and 2005 as the region builds linkages between the central San Diego and east-county com-munities. With Interstates 5 and 15 as the major north-south routes, the county has been focusing on strengthening east-west linkages between these two routes and further east into inland portions of the county. There is also growing recogni-tion that Route 905 along the international border is an important freight route between Mexico and the U.S. and that its extension will be an important economic consideration for the county. According to the San Diego Association of Govern-ments (1999b), “...the daily number of cars and trucks crossing the border (in both directions) between San Diego and Tijuana is about 110,000 vehicles and growing.” The agency also predicts that between 1999 and 2005, the county will spend $4.5 billion on the regional transportation system, not counting the money spent on local streets and roads. These transportation investments are considered invest-ments in the economy.
In addition to transportation, the availability of water is a factor influencing the future growth in the region. More than 90 percent of San Diego’s water is imported from the Colorado River and northern California (Intertec Publishing Corporation 1997). San Diego County Water Authority successfully negotiated a water deal with the Imperial Valley Irrigation District in which the Imperial Valley Irrigation District agreed to sell 200,000 acre-feet of surplus water from the Colorado River each year to San Diego County. According to an article in Economist (1998), Imperial Valley Irrigation District buys the water for agricultural use at $12.50 an acre-foot, but will sell each acre-foot to San Diego for $245. The impetus for this agreement came from the Metropolitan Water District’s (MWD) plan to cut San Diego’s water supply in half in 1992 after a 2-year drought. In order to avert such events in the future, San Diego County water officials decided to find an alternative water supply. The water will travel through aqueducts owned by MWD. MWD asked $230 for every acre-foot piped through their aqueducts, a price that made the deal uneconomic. In the summer of 1998, the state legislature earmarked $235 million from the state budget to line the aqueducts with concrete—just enough to cover the amount requested by MWD to transfer water to San Diego. This water plan is being challenged by the Coachella Valley in Riverside County, which wants an additional 170,000 acre-feet of water from the Colorado River. Because of San Diego’s reliance on imported water, water-related developments may heavily influence the future growth that San Diego County will be able to support.
Although economic growth in the 16 industry clusters will invariably affect the pace of growth and the construction of housing as workers migrate to San Diego and search for places to live, there are other economic factors with effects that can-not yet be anticipated. For example, under the Indian Gaming Regulatory Act of 1988, Native American tribes recognized by the U.S. government have the right to build casinos without regard to local land-use controls. The language of the statute explicitly states that local government regulations do not apply (Newman 1999). Both the Rincon San Luiseño and Pala Band of Mission Indians are federally rec-ognized tribes (www-libraries.colorado.edu/ps/gov/us/fedrec.htm#List). The Las Vegas-based Harrah’s has announced a joint casino venture with the Rincon San Luiseño Band of Mission Indians 35 miles northeast of San Diego. The $100 million casino and hotel development awaits passage of Proposition 1A allowing Indians to operate slot machines, card games, and possibly satellite wagering on horse races (Perry 2000). This proposed development comes just a few months after a $90-million deal with the nearby Pala Band of Mission Indians.
Housing construction may become a severe constraint on growth in the region. To keep pace with population growth, 17,000 new housing units will need to be

USDA Forest Service Gen. Tech. Rep. PSW-GTR-187. 2003.
Section II
28
THE SAN DIEGO ASSOCIATION OF GOVERNMENTS (SANDAG) REGION
USDA Forest Service Gen. Tech. Rep. PSW-GTR-187. 2003.
Section I1
29
THE SAN DIEGO ASSOCIATION OF GOVERNMENTS (SANDAG) REGION
built each year. “The 11,200 units added in 1998 fell well short of that require-ment, and it is not likely that things will change soon” (San Diego Association of Governments 1999c).
Commute times, cost of living, educational opportunities, appropriate health care, and environmental quality will continue to be important for the quality of life in the county. As housing costs in the San Francisco Bay Area, Los Angeles, and Orange County have risen, many people have flocked to San Diego County as the last reasonably priced coastal area. However, the growth that San Diego County is experiencing is in direct conflict with efforts to protect natural resources. SANDAG’s approach is “smart growth,” which is an effort to funnel growth to-ward urban areas where jobs and infrastructure already exist. Despite this effort, one of the greatest challenges in the county’s future will be the protection of open space and the reduction of sprawl as San Diego grows by an estimated 1 million people by 2020.
References50 individual states—Counties. 1995. Lambertville, NJ: MapArt, Cartesia Software; (Disk 1 — CA).ahd.tool.net/list.php3/mstate=ca. 2000. American hospital directory.Anonymous. Flowing gold: water in California. Economist 10 October 1998; 28.Bureau of Labor Statistics. 2000. Consumer expenditure surveys Metropolitan Statistical Area (MSA)
tables. Washington, DC: Bureau of Labor Statistics.California Air Resources Board. 1999. Emissions by category. 1996 estimated and 2010 forecasted
annual average emissions. Sacramento, CA: California Air Resources Board. Available at www.arb.ca.gov.
California Department of Education. 1998a. Enrollment and number of districts and schools, by type of school, by county, 1998-99. Sacramento: California Department of Education. Available at www.cde.ca.gov/demographics/reports.
California Department of Education. 1998b. Number of Limited-English-Proficient (LEP) students in California public school districts, by top fifteen languages, 1997-98. Sacramento: California Department of Education. Available at www.cde.ca.gov/demographics.
Carroll, William. 1993. Historic rambles in San Diego County. San Marcos, CA: Coda Publications; 132 p.
Conservation Biology Institute and Ogden Environmental and Energy Services Company. 2001. Public review draft Multiple Habitat Conservation Program executive summary. Prepared for the San Diego Association of Governments and MHCP Advisory Committee; 26 p.
Construction Industry Research Board. 1988. Building permit summary: California cities and counties calendar year 1987. Burbank, CA: Construction Industry Research Board; 27 p.
Construction Industry Research Board. 1989. Building permit summary: California cities and counties calendar year 1988. Burbank, CA: Construction Industry Research Board; 27 p.
Construction Industry Research Board. 1990. Building permit summary: California cities and counties calendar year 1989. Burbank, CA: Construction Industry Research Board; 27 p.
Construction Industry Research Board. 1991. Building permit summary: California cities and counties calendar year 1990. Burbank, CA: Construction Industry Research Board; 29 p.
Construction Industry Research Board. 1992. Building permit summary: California cities and counties calendar year 1991. Burbank, CA: Construction Industry Research Board; 33 p.
Construction Industry Research Board. 1993. Building permit summary: California cities and counties calendar year 1992. Burbank, CA: Construction Industry Research Board.
Construction Industry Research Board. 1994. Building permit summary: California cities and counties calendar year 1993. Burbank, CA: Construction Industry Research Board.
Construction Industry Research Board. 1995. Building permit summary: California cities and counties calendar year 1994. Burbank, CA: Construction Industry Research Board.
Construction Industry Research Board. 1996. Building permit summary: California cities and counties calendar year 1995. Burbank, CA: Construction Industry Research Board.
Construction Industry Research Board. 1997. Building permit summary: California cities and counties calendar year 1996. Burbank, CA: Construction Industry Research Board.
Construction Industry Research Board. 1998. Building permit summary: California cities and counties calendar year 1997. Burbank, CA: Construction Industry Research Board.
Construction Industry Research Board. 1999. Building permit summary: California cities and counties calendar year 1998. Burbank, CA: Construction Industry Research Board.

USDA Forest Service Gen. Tech. Rep. PSW-GTR-187. 2003.
Section II
30
THE SAN DIEGO ASSOCIATION OF GOVERNMENTS (SANDAG) REGION
Ebner, Rose Boehm. 1987. The San Diego companion: a history of San Diego County. San Diego, CA: R.B. Ebner; 153 p.
Heilbron, Carl H. 1936. History of San Diego County. San Diego, CA: San Diego Press Club; 473 p.Intertec Publishing Corporation. 1997. Water reclamation plant supplies desert city with alternative.
American City & Country 112(13): 40-41.Newman, Morris. 1999. Native Americans agree to follow county rules. California Planning & De-
velopment Report 14(12): 12.Perry, Tony. 2000. Casino planned for San Diego County. Los Angeles Times. January 19; A3.San Diego Association of Governments. 1998a. SANDAG INFO: profiling the region’s jurisdictions.
San Diego: San Diego Association of Governments; 32 p.San Diego Association of Governments. 1998b. SANDAG INFO: San Diego regional employment
clusters. San Diego: San Diego Association of Governments; 32 p.San Diego Association of Governments. 1999a. SANDAG INFO: a million more people in the region
by 2020. San Diego: San Diego Association of Governments; 20 p.San Diego Association of Governments. 1999b. Opening the road to opportunity: future directions for
our transportation system. San Diego: San Diego Association of Governments; 28 p.San Diego Association of Governments. 1999c. SANDAG INFO: January 1, 1999 population and
housing estimates. San Diego: San Diego Association of Governments; 20 p.San Diego Association of Governments. 1999d. SANDAG INFO: San Diego region demographic and
economic characteristics. San Diego: San Diego Association of Governments; 20 p.San Diego Association of Governments. 1999e. SANDAG INFO: 2020 cities/county forecast for the
San Diego region. San Diego: San Diego Association of Governments; 20 p.San Diego Association of Governments. 2001. Habitat conservation planning in the San Diego Region.
San Diego: San Diego Association of Governments; 2 p.State of California Department of Finance. 1998. County population projections with age, sex and
race/ethnic detail, 1990-2040. Sacramento: Department of Finance.United States Census Bureau. 1990a. 1990 census summary file tape 1 basic demographic variables.
Washington, DC: United States Census Bureau.United States Census Bureau. 1990b. 1990 census summary file tape 3 all socioeconomic and demo-
graphic variables. Washington, DC: United States Census Bureau.United States Census Bureau. 1999a. 1997 economic census. Core business statistics series. Washing-
ton, DC: United States Census Bureau; 16 p.United States Census Bureau. 1999b. California 1997 economic census: accommodation and food
services, geographic area series. U.S. Department of Commerce, Economics and Statistics Admin-istration; 132 p.
United States Census Bureau. 1999c. California 1997 economic census: arts, entertainment, and recreation, geographic area series. U.S. Department of Commerce, Economics and Statistics Ad-ministration; 106 p.
United States Census Bureau. 2000. Census 2000 redistricting (Public Law 94-171) summary file. Washington, DC: United States Census Bureau.
United States Department of Agriculture. 1997. Census of agriculture. Washington, DC: National Agricultural Statistics Service. Available at www.nass.usda.gov/census.
www.cde.ca.gov. 2000. California Department of Education. Academic Performance Index.www.epa.gov/surf3/surf98/county.html. 2000. Environmental Protection Agency’s Index of Water-
shed Indicators.www-libraries.colorado.edu/ps/gov/us/fedrec.htm#List. 1996. Department of the Interior. Indian
entities recognized and eligible to receive services from the United States Bureau of Indian Affairs.
www.sandag.cog.ca.us/whats_new/about_sandag.html. 2000. San Diego Association of Govern-ments website.
www.sandiegoadventures.com/site/themeparks.cfm. 2001. CO-OPPORTUNITIES, San Diego ad-ventures. San Diego, CA: San Diego Convention and Visitors Bureau.
www.usnews.com/usnews/nycu/health/hosptl/metro.htm#. 2000. Best hospitals by metro area.www.wildernet.com. 2001. Detailed descriptions for 162 outdoor activities in the area.