Embed Size (px)
Citation preview

IIP
art T
wo
Cost Measurement SystemsThe previous part discussed how
cost management information
supports decisions about setting
strategy and using scarce, con-
strained resources. Cost manage-
ment helps define strategy by
predicting and estimating the
costs and benefits of alternatives.
The key to using scarce capacity
wisely is to measure the profit or
value contributed by alternative
products and services, and of
course, part of profit is the costs
used to generate revenues.
Part Two builds cost management
tools to promote understanding of
productive processes. Chapters 4
through 7 develop three key di-
mensions of costing systems, that
cost managers evaluate when de-
signing cost systems. Chapter 4
identifies resources by value chain
operation or function (functional
costing) and distinguishes be-
tween unit-level and higher-level
costs and among three product
costing methods. Chapter 5 de-
scribes five major types or levels
of activities that drive costs.
Chapter 6 uses cost categories
and job costing to trace costs to
products, jobs, and projects using
unit-level and full ABC costing
methods. Chapter 7 applies costs
to continuously produced output
by the methods of process cost-
ing. Chapter 8 describes decision
making and allocation of costs to
jointly produced products. Chap-
ter 9 explains decision making us-
ing several common methods of
allocating service department
costs.
Part Three uses understanding of
costs and activities to help im-
prove the effectiveness and effi-
ciency of productive processes.
Look ahead➤
Look back Look at this part
➤➤

44Measuring Costs ofOperationsAfter completing this chapter, you should be able to:
1. Measure product costs, contributions to profit, and operating expenses usingthroughput, variable, and absorption costing.
2. Compare alternative product costs and their effects on profits.
3. Understand how different methods for measuring product costs create differentincentives for managing scarce productive resources.

Cost Management
Challenges1. How can cost managers
measure the financialresults of operations in away that reinforces properuse of resources?
2. How can alternativemethods of calculatingproduct costs createdifferent incentives?
3. How should costmanagers measure costsfor internal decisionmaking?
Memorandum
To: Glenn PenskiDirector of Cost Management Systems
From: Robert TraversVice President of Marketing and Sales
CC: Anne HechmanVice President of Manufacturing
Subject: Congratulations on a job well done
Glenn: I think your analyses and recomendations were exactly on target. We
have all but eliminated our backlog of late customer orders. And our customers
could not be happier. I also will be announcing at our next Executive Committee
meeting that we have added two major customers in Europe because we are
able to meet their on-time delivery requirements. Without our recent changes,
we would not have been able to meet their needs without upsetting our current
customers. Good work, Glenn.
Memorandum
To: Glenn PenskiDirector of Cost Management Systems
From: Anne HechmanVice President of Manufacturing
CC: Robert TraversVice President of Marketing and Sales
Subject: Re: Congratulations on a job well done, but...
Glenn (and Robert): I agree that we understand how to schedule our productive
resources much better and that we are much more responsive to customer
orders. Manufacturing operations are much smoother and there is much less
tension in the department now that we rarely have to expedite orders.
However, I do not think that we have completely solved our problems. We
are having limited success in reducing inventories and keeping non-bottleneck
processes idle when their output is not needed. We are still getting reports from
your office, Glenn, that idle capacity is hurting us by creating higher unit costs
and by not converting idle capacity into value-added products. I interpret these
reports to mean that we should keep all of our processes busy all the time. I am
concerned that either the concept of keeping some capacity idle is flawed or you
are measuring costs incorrectly.
I hope you realize that I am grateful for the improvements you have helped
make, but I also think that we can take another step to create cost reports that
reinforce what we should do to use our manufacturing capacity wisely. I hope
that you can sort out what is going on and make some improvements on the
reporting side.

IntroductionOrganizations like Contaminant Measuring Devices (CMD) are formed to manage pro-ductive processes efficiently and to generate customer value and profit.1 As discussedin Chapter 3, any organization’s capacity to do these things is constrained. If an orga-nization provided only one product or service, managing processes would be relativelyeasy, though not trivial. Management of resources would entail forecasting total sales,estimating total costs, and subtracting costs from revenue to get expected profits. If ex-pected profits are too low, managers could either change businesses or find ways to in-crease sales and/or reduce costs.2 This principle is deceptively simple, however,because most organizations provide many different products and services, and eachmay place different but competing demands on the organization’s resources. In this sit-uation, it can be difficult to know how to use scarce or constrained resources to gener-ate the most value or profit. In order to choose among competing products andservices, managers need to know what resources are needed and how much of the con-strained resources each product or service consumes and the profit each can generate.The purpose of this chapter is to analyze how to measure the costs of resources andprofitability of products and services in ways that reinforce good decision-making.
What Are The Resources Of An Organization?If you could view CMD from an aerial vantage point, you could observe resourcesflowing into the company and finished products flowing out. If the roof were transpar-ent or detachable, you also could see that CMD’s business and production processesneed many resources. These resources include physical resources such as money, parts,materials, buildings, machinery, and computers. In addition to physical resources,CMD needs human resources such as the talent, effort, and knowledge of its employ-ees. These resources are not free, and because the resources are not free, they must bemanaged wisely.
It is common for organizations to identify resources by at least three dimensions:3
1. The type of resource acquired.2. How the resource is used.3. How traceable a resource is to a particular decision.
Distinctions by type, use, and traceability have been used by accountants and financialanalysts for many years because they provide information that is useful for decision-making and that communicates how the organization has converted money and humancapital into products and services.
Types of Resources
We will use three general resource types that organizations obtain: materials, conver-sion, and operating resources. Note that organizations that outsource portions of theirvalue chains also treat those purchased products or services as material, conversion, oroperating resources, depending on their nature.
Material resources. Material resources are physical objects that may be incorpo-rated into products or used to maintain or enhance the organization’s productive and
108 Part II Cost Measurement Systems
Introduction
1See the introduction to Chapter 3 for a description of CMD and its products.2Note that accountants refer to the costs of items sold and the costs of using other resources to make
sales possible as expenses. Therefore, accountants and financial managers define profits as sales lessexpenses.
3Chapter 5 introduces a fourth dimension, the level or type of cost driver, in order to measure resourceuse more accurately.
What Are the Resources of an Organization?
Material resources arephysical objects thatmay be incorporatedinto products or usedto maintain or enhancethe organization’sproductive andsupport facilities

Chapter 4 Measuring Costs of Operations 109
support facilities. Materials include raw materials and purchased parts, components,and assemblies, such as the laser instruments that CMD manufactures and assemblesinto the devices it sells. Materials also include the maintenance and office supplies thatCMD uses to support production and the general organization.
Conversion resources. Providing products and services usually requires labor,equipment, and productive facilities; together, these are called conversion resourcesbecause they have the capability to convert other resources into products and services.CMD’s conversion resources include its manufacturing, technical, and supervisory la-bor and its manufacturing equipment and buildings.
Operating resources. Other types of physical and human resources are necessary tocreate and sustain the organization itself and to enable transactions with parties exter-nal to the organization. At CMD, these other operating resources include the corporateoffice and the marketing, sales, and customer service departments. Without these ele-ments of the value chain, CMD would not be able to function efficiently or effectively.
How Resources Are Used
Historically, manufacturing organizations developed accounting systems to supporttheir primary objective of efficient manufacturing. In many cases, most of these com-panies’ resources were dedicated to and used in manufacturing processes. Other oper-ating resources were much less important. Since manufacturing efficiency has beena key element in competing successfully, accountants have distinguished betweenproduction resources used to manufacture products and nonproduction resourcesused to support manufacturing processes. Supply, administration, marketing, and dis-tribution resources always have been necessary, but as support for the primary objec-tive of manufacturing. Thus, these other elements of the value chain have not receivedas much attention from accountants or accounting systems.
The world of business has changed in many ways since the days when manufac-turing was the primary industrial activity. The private and public service sectors aremuch larger than the manufacturing sector in many advanced economies includingCanada. Even in most manufacturing companies, support and service resources aremuch more extensive and important than they were. However, most accounting sys-tems still separate production resources from nonproduction resources, especially forfinancial and tax reporting. Though cost managers now correctly focus on all elementsof the value chain, it is important that they also understand the origins and limitationsof most formal accounting systems that support financial and tax reporting. Analyzingnonproduction resources, which can be the majority of resources, may require use ofinformation not normally supplied by the formal accounting system.
CMD’s value chain is shown again in Exhibit 4–1. Recall that physical and humanresources are supplied to and used in all elements of the value chain to deliver the mostcustomer value at lowest cost.At CMD, production pro-cesses (the middle, shaded ele-ment in Exhibit 4–1) usematerials and conversion re-sources to make its measure-ment devices. CMD’s othervalue chain processes use non-production resources to pro-vide support services, researchand development, design, sup-ply, marketing, distribution,and customer service.
Conversion resourcesinclude labor,equipment, andproductive facilities
Production resourcesare used to manufactureproducts
Nonproductionresources are used tosupport manufacturingprocesses
In some processes, there isno substitute for highlyskilled human resources.

A cross-classification by resource type and productive use is displayed with typi-cal examples in Exhibit 4–2. This exhibit shows that classifying operating resources, inparticular, into production or nonproduction uses can be difficult.
Traceability of Resources
A third useful dimension of resources is how easy it is to trace the cost of a resource toa decision or set of decisions. Cost managers ask, “If we make this particular decision,what resources must we obtain or use, and what will they cost?” Acquisition and use ofall resources is caused by management decisions, but ease of tracing resource costs tospecific decisions is important to cost managers who are analyzing or planning the costeffects to the organization of those decisions.
Direct resources. Sometimes, it is easy to see how specific decisions have causedthe acquisition of specific resources. These decisions are directly responsible for thoseresources, and the resources are called direct resources of those decisions. For exam-ple, a decision to produce laser instruments would cause the acquisition of the materi-als necessary to make the instruments. Making more instruments obviously causes theacquisition of more materials. Likewise, the decision to open a sales office in BuenosAires obviously causes the acquisition of specific physical and human resourcesnecessary for the office, and the decision to open and operate that office is directly
110 Part II Cost Measurement Systems
Exhibit 4–1
CMD’s Value Chain—Production andNonproduction Resources
Physicalresources
Humanresources
Support services• Accounting• Human resources• Legal services• Information systems• Telecommunications
DistributionProductionDesign
Research and
develop-ment
Supply MarketingCustomer
service
Measuringdevices
and services
Exhibit 4–2
Categories and Examplesof Resources
Used inUses Used to Produce Nonproduction Value
Resources Products and Services Chain Elements
Material resources Parts, assemblies, protective Cleaning supplies, officecoverings, connectors, supplies, repair itemssupplies
Conversion resources (convert Labor, supervision, maintenance, Labor, equipment, andmaterials into products, utilities, buildings, equipment facilities in administration,services, and sales) marketing, sales, distribution,
customer service
Operating resources (provide Internal business processes Internal business processesoperating support) (management, accounting, (management, accounting,
information systems, human information systems, humanresources, etc.), engineering resources, etc.), research and
development
Direct resources areobtained as the directresult of certaindecisions; decisions aredirectly responsible forthose resources

Chapter 4 Measuring Costs of Operations 111
responsible for acquiring and paying for those resources. Often, however, it is not easyto trace all resources to all decisions.
Indirect resources. Resources that are difficult to trace to specific management de-cisions are called indirect resources of those decisions. Other common names for in-direct resources are overhead, common costs, and burden, though these sometimesconvey a derogatory image (e.g., unproductive or unnecessary). For example, CMDhired and retained Robert Travers as vice president of marketing and sales; that hiringdecision is directly responsible for recruiting and paying for this human resource.Though Mr. Travers manages all of CMD’s sales operations, it is not easy to trace anyof his cost to the decision to open the Buenos Aires sales office. Thus, Mr. Traverscould be classified as an indirect resource of the Buenos Aires office. As another ex-ample, Anne Hechman, vice president of manufacturing is paid by CMD to manage itsmanufacturing processes, but she does not actually manufacture a single instrumentherself. Thus, though she is necessary to support production, CMD acquired and paysfor this human resource to indirectly support manufacturing of specific instruments.Thus, Anne Hechman is an indirect manufacturing resource.
The distinction between direct and indirect resources is not restricted to human re-sources. For example, at its primary location CMD manages the company and manu-factures its products in the same large building, using the same computer network.How much of the building and computer network resources were obtained for admin-istration? How much for manufacturing each instrument? It may not be easy to tracethese resources directly to decisions about either administration or manufacturing, letalone to manufacturing specific instruments. Thus, the building and computer networkresource would be considered to be an indirect resource for both administration andmanufacturing.
Supply versus use of resources. Organizations may acquire some resources to pro-vide the capacity to produce a certain level of products or services. The capacity the or-ganization makes available for use is the resources supplied. For example, CMD hasacquired the human and physical capacity to make more products than they currentlycan sell. The supply of skilled technicians who build the instruments, for example, is adirect cost of the capacity decision, not of specific decisions to use the capacity tomake products, services, or sales. However, the amount of their labor that is used is po-tentially traceable to products, for example, by maintaining records of who worked onwhich products. If we asked, “What resources are used for the Buenos Aires office?”we would identify the human and physical resources in place in Buenos Aires as wellas a portion, perhaps, of the management resource provided by Mr. Travers. Spendingfor Mr. Travers himself, ignoring travel costs, does not depend on how much theBuenos Aires office uses him. However, knowing how much of his capability is usedby the Buenos Aires office is informative when analyzing how much other work Mr.Travers is capable of performing. Thus, the capacity used for productive purposes isthe resources used. Confusing the distinction between supply and use of a resource ispotentially misleading because of the different impacts of decisions on spending anduse of resources. As we shall see, organizations use different costing systems depend-ing on their distinctions between supply and use of resources.
Three Dimensions of Resources
In summary, every resource fits into the qualitative dimensions of type of resource, usein the value chain, and traceability to decisions to supply or use resources. These qual-itative dimensions and two example resources are shown in Exhibit 4–3.
Resource A in Exhibit 4–3 is a nonproduction, operating resource that is not easilytraced to some particular decision, say the decision to produce one more laser instru-ment at CMD. This resource might be a computer in the finance department or a hu-man resources specialist in the personnel department. Note that though the computer inthe finance department may not be traceable to a decision to make a laser instrument,
Indirect resources areresources that areacquired but aredifficult to trace tosome managementdecisions
Resources suppliedcomprise the capacitythe organization makesavailable for use
Resources usedcomprise the capacityused for productivepurposes
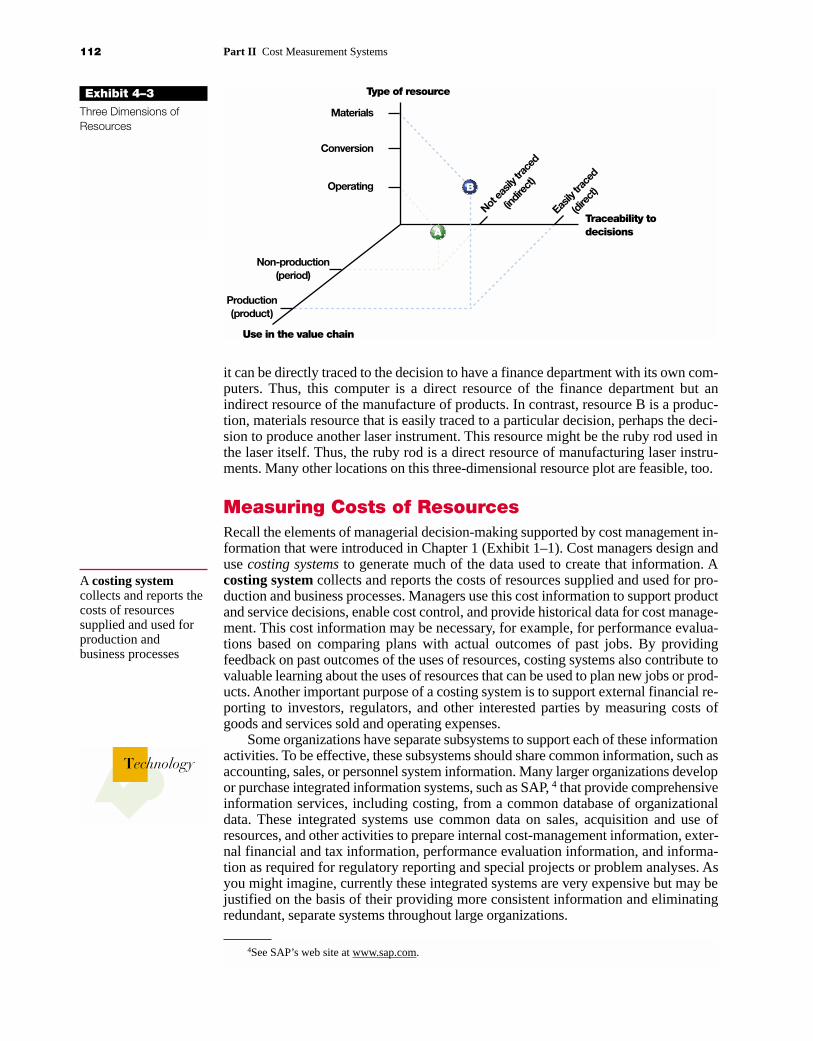
it can be directly traced to the decision to have a finance department with its own com-puters. Thus, this computer is a direct resource of the finance department but anindirect resource of the manufacture of products. In contrast, resource B is a produc-tion, materials resource that is easily traced to a particular decision, perhaps the deci-sion to produce another laser instrument. This resource might be the ruby rod used inthe laser itself. Thus, the ruby rod is a direct resource of manufacturing laser instru-ments. Many other locations on this three-dimensional resource plot are feasible, too.
How Do Organizations of Resources?Recall the elements of managerial decision-making supported by cost management in-formation that were introduced in Chapter 1 (Exhibit 1–1). Cost managers design anduse costing systems to generate much of the data used to create that information. Acosting system collects and reports the costs of resources supplied and used for pro-duction and business processes. Managers use this cost information to support productand service decisions, enable cost control, and provide historical data for cost manage-ment. This cost information may be necessary, for example, for performance evalua-tions based on comparing plans with actual outcomes of past jobs. By providingfeedback on past outcomes of the uses of resources, costing systems also contribute tovaluable learning about the uses of resources that can be used to plan new jobs or prod-ucts. Another important purpose of a costing system is to support external financial re-porting to investors, regulators, and other interested parties by measuring costs ofgoods and services sold and operating expenses.
Some organizations have separate subsystems to support each of these informationactivities. To be effective, these subsystems should share common information, such asaccounting, sales, or personnel system information. Many larger organizations developor purchase integrated information systems, such as SAP, 4 that provide comprehensiveinformation services, including costing, from a common database of organizationaldata. These integrated systems use common data on sales, acquisition and use ofresources, and other activities to prepare internal cost-management information, exter-nal financial and tax information, performance evaluation information, and informa-tion as required for regulatory reporting and special projects or problem analyses. Asyou might imagine, currently these integrated systems are very expensive but may bejustified on the basis of their providing more consistent information and eliminatingredundant, separate systems throughout large organizations.
112 Part II Cost Measurement Systems
Exhibit 4–3
Three Dimensions ofResources
Type of resource
Materials
Conversion
Operating
Non-production(period)
Production(product)
Not ea
sily t
race
d
(indir
ect)
Easily
trac
ed
(dire
ct)
Traceability todecisions
Use in the value chain
B
A
Measuring Costs of Resources
A costing systemcollects and reports thecosts of resourcessupplied and used forproduction andbusiness processes
4See SAP’s web site at www.sap.com.
Technology

Chapter 4 Measuring Costs of Operations 113
Design Issues
In designing costing systems, cost managers seek answers to many questions related tothe information they need to present about the acquisition and use of resources for theirorganizations’ most important management decisions. They may ask decision-makersand other members of the cost management team variations of the following questionsabout the decision-making of their organization. We consider these types of questionsin this and subsequent chapters.
Importance of resource supply versus resource use (Chapter 4):� Do we need to make a distinction between costs of supplying versus using
resources?� Do we need to isolate and report the costs of supplying and using different
resources, or will average costs across types of resources be adequate?� Do we need expected supply or use, historical supply or use, opportunity costs,
or all of the above?� Do we need resource costs classified by where the work is performed?
Importance of nature of work versus location of work (Chapter 5):� Is it important to know how the work of the organization is done?� Do we need costs to provide incentives for improvements, or are other incentives
more appropriate?
Uniqueness of outputs (Chapters 6 and 7):� Do we need specific costs of each product and service, or will average costs across
products and services be adequate?� Do we need periodic costs and/or costs for the entire life of projects, products and
services?
Common to all considerations:� Do we need rapid reporting of costs, or can we tolerate delays in reporting? How
long can the delays be?� Do we need complex reporting of costs, or is simple, uncomplicated reporting
more useful?� Do we need flexible data that can be reorganized into unique information by each
decision-maker, or is it better to provide information in a format common to alldecision-makers?
� Do decision-making and financial reporting needs conflict, or can the same infor-mation meet both needs?
� Do we have an unlimited budget to develop and maintain the costing system, ormore realistically, do we have a budget limit? Given the budget limit, what trade-offs of information for the cost of information must we make?
As Exhibit 4–4 shows, the three discriminating categories of questions (concernwith resource supply or use, nature of work, and uniqueness of output) are associatedin practice with different cost-system designs. Chapter 4 investigates the implicationsof resource supply or use for cost-system design and introduces functional costing.Chapter 5 describes activity-based costing as a system solution to concerns about ac-tivities and the nature of work. Chapters 6 and 7 describe cost systems for outputs thatare either unique or undifferentiated, respectively.
Beyond asking and answering these types of questions, there are almost no formu-las or recipes that prescribe what a costing system should be. Actually, this is goodnews for cost managers. Thoroughly understanding how to match costing informationto decision-making needs is a major way that cost managers use their judgment to addvalue to their organizations. This section of the text is devoted to investigating alterna-tive costing systems and how they may be configured to best serve organizations and

decision-makers. Before diving into this topic, we need to develop a common, funda-mental understanding of the concept and measurement of “cost.”
What Do We Really Mean by “Cost”?The measurement of cost is fundamental to managing organizations’ resources becausecosts are important measures of resource availability and use. Cost is a measure of thesupply or use of a scarce or constrained resource to achieve a specific outcome.5 Anorganization gives up (or “sacrifices”) scarce resources in order to obtain otherresources. The value given up is a measure of the purchase cost of resources. These
114 Part II Cost Measurement Systems
Exhibit 4–4
Three Dimensions ofCosting System Designsin Practice
Job costing
Operation costing
Process costing
Functionalcosting
(introducedin Chapter 4)
Activity-based
costing
Throughputcosting
Variablecosting Absorption
costing
Supplyor use ofresources
Nature orlocation of
work
Uniquenessof products
Cha
pte
rs 6
and
7
Chapte
r 5Chapter 4
Progressive cost managers at Borg-Warner Automotive Diversified Transmission Products Corpora-tion anticipated recent trends toward designing costing systems that serve decision-makers by pro-viding the information they need to improve their products’ competitiveness and value. Costmanagers first learned what decisions had to be made by their internal customers, corporate man-agers and plant managers, whose needs were very different. They learned, for example, that plantmanagers need specialized information about how processes use resources and how that use canbe improved, but not the great amount of detail on past departures from standards that had beenprovided. Corporate managers, who had received the same cost reports as plant managers, wereoverwhelmed by the accumulated detail of all the plant-level reports and could not find the informa-tion they needed to improve their strategic choices. By working closely with decision-makers at bothlevels, cost managers were able to design effective costing systems and reports.
Source: G. Hanks, M. Freid, and J. Huber, “Shifting Gears at Borg-Warner.” Also see, P. Drucker, “TheInformation Executives Truly Need.” Full citations are in the bibliography.Visit www.borg-warner.com.
Cost Management in
Practice 4.1
What Do We Really Mean by “Cost”?
5Usually, costs are expressed in monetary terms, though that is not always necessary or even desirable.As an alternative, some public and nonprofit organizations use nonmonetary measures of cost, as in measur-ing the “cost” of a public policy in terms of the incidence of poverty, crime, or disease. Likewise, benefitsmay be expressed in nonmonetary terms. Some would argue that the primary justification for politicalprocesses is to make tradeoffs of nonmonetary social costs and benefits that cannot be made easily in tradi-tional markets for products and services.
LO1 Measure productcosts, contributions toprofit, and operatingexpenses usingthroughput, variables, andabsorption costing.
Cost is a measure ofthe acquisition orconsumption of ascarce or constrainedresource to achieve aspecific outcome

Chapter 4 Measuring Costs of Operations 115
acquired resources are subsequently supplied to production and nonproductionprocesses and used to produce and sell products and services or to support productionand sales. The value of the resources made available is the cost of resources supplied.Cost of resources supplied may or may not be the same as cost of resources used be-cause an organization may choose to make available more resources than it uses at anytime, perhaps to take advantage of currently low prices or to accommodate unexpectedneeds or shortages. The value of the resources not actually used is the cost of reserve orexcess capacity, as discussed in Chapter 3. The value of resources consumed for pro-ductive purposes is the cost of resources used.
Ideally, the value given up to supply or use a resource is measured as an opportu-nity cost, which is the current value of the forgone, next-best alternative use of what-ever is supplied or used. Because opportunity costs can be difficult to measure reliably,most cost management systems measure actual or expected out-of-pocket costs,which are the payments (usually cash or obligations to pay cash) made for resources.Out-of-pocket costs can be the same as opportunity costs, but may not be the same be-cause of imperfect markets and changes in the decision-making environment betweenwhen a resource was acquired and when it is used.6
Actual costs usually are measured as the past payments for currently owned re-sources, whereas expected costs are the predicted or forecasted payments for futureresources. For example, the actual cost of CMD’s equipment is the money that waspaid to obtain it. As another example, the expected cost of one of CMD’s new productsis the monetary value of the resources that CMD expects to acquire and consume tocomplete it.
Traditionally, the costs of resources used to produce products are called productcosts, and these become cost of inventory and cost of goods sold expense when theproducts are sold. The costs of resources used in nonproduction value-chain elementsare called period costs and become other income-statement expenses of the period.Traditionally they have been considered support costs of doing business during the pe-riod. Since they are expensed when used, period costs do not become part of the valueof inventories for financial or tax reporting.
Total Cost
CMD’s total cost includes the costs of all resources supplied to the company during aspecified time period. Total cost would include the costs of all production and nonpro-duction resources, or all material, conversion, and operating resources, or all direct andindirect resources. It is possible, of course, to create many different subtotals of costs,such as total production costs, total conversion costs, total direct costs, or total directmaterial costs. Organizations would create these subtotals to reflect decision-makingand reporting needs. For example, CMD’s executives receive a report each week fromGlenn Penski that totals weekly costs by type of resource used for the seven types ofCMD’s instruments. Exhibit 4–5 shows an excerpt from a recent week’s report. AnneHechman uses this report to monitor how her department is using the company’s scarceresources. (Note that blank columns B–E will be filled with more detailed cost infor-mation about products in subsequent exhibits.)
Exhibit 4–5 shows that during the week CMD completed 380 measuring instru-ments of all models (cell G2) at a total cost of $5,104,500 (F12). Note that only theamount of labor traced to production of products is counted as a direct labor cost (F6).Unused labor is part of indirect production cost (F9). Subtotals of types of resourcecosts for all products manufactured also are in column F.
Cost of resourcessupplied is the valueof the resources madeavailable
Cost of resourcesused is the value ofresources consumed forproductive purposes
Out-of-pocket costsare the payments(usually cash orobligations to pay cash)made for resources
Actual costs usuallyare measured as thepast payments forcurrently ownedresources
Expected costs are thepredicted or forecastedpayments for futureresources
Product costs are costsof resources used toproduce products
Period costs are costsof resources used innonproduction value-chain elements
Total cost includes thecosts of all resourcesacquired or used duringa specified time period
6An imperfect market does not have reliable prices for all resources. Furthermore, alternative opportu-nities change because of technology, preferences, and information.

Average Cost
One could compute the average cost per unit of product by dividing total costs of a pe-riod (F12) by the number of units of product made that period (G2). Exhibit 4–5 com-putes this figure as $13,433 per unit (G12 � $5,104,500 � 380 units and also equalsG7 � G11, or the sum of average direct and indirect costs). Furthermore, the reportcalculates the average costs per type of resource. For example, during the week, manu-facturing each instrument cost an average of $2,197 in materials (G5) and $924 in con-version (G6). In addition to the easily traced direct costs, each instrument used anaverage of $5,790 of indirect production resources (G9) and $4,522 of indirect operat-ing resources (G10).
Appropriate uses of average costs. Average cost may be useful information; forexample, the vice president of manufacturing may compare average costs with histori-cal trends or expectations for the week. Also, the vice president of marketing may com-pare average costs (which include nonproduction costs) with competitors’ costs andaverage prices obtained for these instruments to assess overall profitability and effec-tiveness of pricing (i.e., average sales prices should exceed average costs).
Dangers of misusing average costs. The average cost usually does not representthe period’s spending for resources to make products because, as in CMD’s case, onlyacquiring material resources can be easily traced to decisions to make more products.
116 Part II Cost Measurement Systems
*Note: Columns B– E will be used in subsequent exhibits
Exhibit 4–5 Weekly Total Cost Information (excerpt)*
A B C D E F G
1 Model All Seven Models
2 Quantity 380
3 Average
Subtotal per Unit
4 Direct costs easily traced to production
5 Material cost (e.g., materials, parts, $ 834,800 $ 2,197assemblies supplied and used for �F5/G2products)
6 Conversion cost (e.g., labor used to make 351,200 924
products) �F6/G2
7 Total direct costs (� F5 � F6) 1,186,000 3,121
8 Indirect costs not easily traced
9 Indirect production cost (e.g., unused 2,200,000 5,790labor, supervision, equipment, � F9/G2maintenance, facilities used to makeproducts)
10 Indirect operating cost (e.g. 1,718,500 4,522management, support services � F10/G2facilities used to operate the business)
11 Total Indirect costs $3,918,500 $10,312
12 Total costs $5,104,500 $13,433
Average cost per unitof product is total costsof a period divided bythe number of units ofproduct made thatperiod

Chapter 4 Measuring Costs of Operations 117
Other resource spending does not change with decisions to make more or fewer unitsof product. Thus, a decision to make more “average” products would not cause CMDto spend $13,433 more for each unit made. If some resources, for example, labor, haveexcess capacity, CMD probably would not spend more on labor unless the excess ca-pacity were to be exhausted.
The average product may not exist except as a mathematical computation of aver-age cost. Therefore, if different products use varying amounts of constrained resources,then some products use more resources than the average, and some use less. In organi-zations with different products and services, average cost usually is not a meaningfulnumber for making decisions about the uses of capacity. If CMD only relied on the av-erage cost for all models, the company could fail to improve its use of scarce resources.For example, though the average price may exceed average cost, which is necessary foroverall profit, some products may be very unprofitable (e.g., cost of resources used ex-ceeds sales revenues) and others may be highly profitable. CMD should stop using itsresources to make the unprofitable products and use the resources to make profitableones, but average cost information alone does not identify which products to drop orexpand.7
Tracing versus Allocating Costs
As discussed in detail in Chapters 5 and 6, organizations usually trace direct costs toproducts and services. Tracing costs means assigning resource costs to products andservices (or organization subunits) through reliable observations and documentation ofresource use. Therefore, organizations rarely use the overall average cost for decision-making because it is cost-effective to trace some costs. That is, the costs of tracing areless than the costs of production errors based on average costs (e.g., producing thewrong products). More details of the week’s output and costs of resources used are inExhibit 4–6. [Put a place marker or paper clip on this exhibit because we will refer toit often. Note that some of the numbers are rounded to the nearest dollar. Note also thatfor simplicity this exhibit gives details for only two of CMD’s seven product models,#700A and #900B.]
When managers use the average cost per unit, they act as if each product modelconsumes $3,121 in traceable, direct cost (G7 � F6 � G2 � G5 � G6). It is apparentfrom rows 5, 6, and 7 of Exhibit 4–6, however, that the different product models usedifferent amounts of direct resources. CMD has traced materials and conversion re-sources to each product model type. At the low end of resource use, Model #700A uses$2,200 (C7) of direct material and conversion cost per unit (C7 � C5 � C6 or B7 �C2). Model #900B, at the high end, uses $4,200 (E7) of direct material and conversioncost per unit, almost twice as much as Model #700A. Most of the difference betweenthese products is the costs of materials (row 5). Although CMD does not do so, otherorganizations may trace use of some marketing and distribution resources directly toproducts and services.
These per-unit measures of direct material and conversion costs themselves appearto be averages. Because CMD has traced these resources to each product line, theseproduct-line averages (cells C5 to C7 and E5 to E7) should be closer to real (but stillunmeasured) per-unit costs than the overall average cost (cells G5 to G7). Some orga-nizations are able to easily trace direct costs to individual units of product or servicewithout averaging. This situation is discussed in Chapter 6.
7Recall that most introductory microeconomic models assume that the firm produces a single product ina perfectly competitive market. In this simplified setting, the most efficient use of productive resources is toproduce the number of units that minimizes that average cost per unit. The production of multiple productsand the real possibility of imperfect markets complicate this simple situation.
Tracing costs isassigning direct costs toproducts and services(or organization sub-units) through reliableobservations anddocumentation ofresource use

Allocating indirect costs. Exhibit 4–6 shows that CMD allocates costs of indirectresources to all products by a rough averaging process because it is too costly to tracethose resources more precisely. Cost allocation means attaching or assigning indirectcosts to products, services, or organizational units by some reasonable but imprecisemethod of averaging. Note that C9 � E9 � G9 and C10 � E10 � G10. These equal,indirect costs per unit for production and operating costs show that CMD did not at-tempt to trace these indirect costs to the product-model level. CMD simply averagedthese costs across all units of product. This can be the least accurate way to allocatecosts, but allocating costs in general is less accurate than tracing costs because allocat-ing costs cannot rely on ready observation or documentation of resource use or spend-ing. In fact, at CMD it appears that allocated indirect costs may be unrelated toresource use.
Cost allocation unrelated to resource use is undesirable if more accurate methodsare cost-effective. There are methods of allocating indirect costs to products and ser-vices that can reflect resource use more accurately, and these are discussed in laterchapters. Chapter 5 presents a method (activity-based costing), for example, that maybe able to trace a large proportion of these indirect resources to products and servicesin a cost-effective manner. In effect, more accurate cost allocation methods seek totransform indirect costs into direct costs. If successful, these methods should providemore accurate measures of resource use.
Unit-Level Costs and Variable Costs
As we have seen, it is relatively easy to observe the costs of direct resources such asparts and materials to make CMD’s devices. Costs of direct resources that are suppliedand used on individual products and services also are called unit-level costs. Unit-level costs to produce and sell products and services usually include costs of parts andmaterials and may include costs of production resources such as labor and energy, and
118 Part II Cost Measurement Systems
Exhibit 4–6 Weekly Cost and Production Information
A B C D E F G
1 Model #700 A #900 B All Seven Models
2 Quantity 48 40 380
3 Average Average Average
Subtotal per Unit Subtotal per Unit Subtotal per Unit
4 Direct costs
5 Material cost $ 67,200 $ 1,400 $124,000 $ 3,100 $ 834,800 $ 2,197
6 Conversion cost 38,400 800 44,000 1,100 351,200 924
7 Total direct costs $105,600 2,200 $168,000 4,200 $1,186,000 3,121
8 Indirect costs
9 Indirect production cost 277,894 5,790 231,579 5,790 $2,200,000 5,790
10 Indirect operating cost 217,074 4,522 180,895 4,522 1,718,500 4,522
11 Total Indirect costs $494,968 10,312 $412,474 10,312 $3,918,500 10,312
12 Total costs $600,568 $12,512 $580,474 $14,512 $5,104,500 $13,433
Unit-level costs arecosts of directresources that areacquired and used onindividual products andservices
Cost allocation isattaching or assigningindirect costs toproducts, services, ororganizational units bysome reasonable butimprecise method ofaveraging

Chapter 4 Measuring Costs of Operations 119
nonproduction resources such as marketing and distribution—if they are acquired tosupport specific products or services. In many cases, however, organizations acquirethese latter resources as indirect resources of production. If costs of using these indirectresources vary with the volume of units of products and services provided, they oftenare called variable costs. This term can be misinterpreted unless it is used very care-fully. Making or selling more or fewer products and services will cause the costs of us-ing these resources to vary up or down. These are variable costs of the use of indirectproduction resources. For example, making more laser instruments will use moreskilled labor at CMD; we know this because the use of skilled labor easily can betraced to the additional laser instruments manufactured.
However, making or selling more or fewer products and services may not causecosts of supplying these resources to vary up or down. To repeat, CMD hires skilledtechnicians to manufacture its laser instrument assemblies, but the company pays themfor at least 40 hours per week, even if they do not have enough demand for laser in-struments to keep them busy for 40 hours per week. Therefore, the costs of usingskilled technicians to make laser instruments may vary with quantities of productsmade, but the costs of supplying (paying the wages and benefits for) skilled technicianswill not vary unless CMD decides to hire or lay off technicians.
Failing to make the distinction between the costs of supplying (e.g., spending for)resources and using resources has caused much confusion and controversy among costmanagers, accountants, financial analysts, and engineers. We need to be clear aboutthis, and we will identify unit-level costs as those incurred for resources that are bothsupplied and used to provide units of products and services. Variable cost refers to thecosts of resource use that vary with the volume of units of product and service pro-vided. As Exhibit 4–7 shows, all unit-level costs are variable costs, but not all variablecosts are unit-level costs.
Fixed Costs, Committed Costs, and Sunk Costs
For many years, accountants have used the term, fixed costs, for production or non-production costs that do not vary with production or sales volumes. These have in-cluded such costs as salaries, rent, depreciation, and property taxes. As we have arguedthroughout this book, however, decisions cause costs—costs do not just happen—andthere are many more decisions made than just production volume. No resource
Exhibit 4–7
Unit-Level andVariable Costs
Costs ofdirect
resourcessupplied and
used toprovide unitsof product or
service
Costs ofindirect
resourcesused to
provide unitsof product or
service
Costs ofdirect and
indirectresources
used toprovide unitsof product or
service
+ = Variablecosts
Unit-levelcosts
Fixed costs are coststhat do not vary withproduction or salesvolumes
Variable costs arecosts of resourceswhose use varies withthe volume of units ofproducts and servicesprovided

decisions are irreversible. All future costs, therefore, are variable with respect to somedecision, so no future cost can be really fixed. It may be costly to change a resourcecost in the future (e.g., renegotiate or nullify a resource contract), but the resource costcan be changed. A better term to use for costs that are not intended to vary with pro-duction or sales volume may be committed cost. This term reflects that the organiza-tion has committed to a certain level and type of resource spending, but theorganization also (at some further cost perhaps) can change the commitment.
In most organizations, labor cost is a committed cost and cannot be changed easilybecause of contractual obligations, policy, or its critical importance. Other committedcosts may include lease obligations, licenses, and various taxes. In contrast, dis-cretionary costs, such as some advertising costs, remodeling, or charitable giving,may be changed quickly and easily. This is a difference of degree; that is, both com-mitted and discretionary costs can be changed, but committed costs are more difficultto change.
When labor is a committed cost, as in many unionized companies or organizationsand countries with strong employment policies, making more or fewer units of productmay not affect the cost to supply labor, positively or negatively. If so, spending for la-bor resources is not different from spending for other physical capacity resources. Inorganizations where this is true of other resources as well, the only unit-level cost ofproducts and services that varies proportionately with the number of units producedmay be the cost of parts and materials. Under these conditions, spending or costs tosupply all other resources would not vary with the number of units.
Furthermore, the organization may or may not use all of the resources to which ithas committed. For example, as discussed in Chapter 3, an organization may committo provide a certain level of production capacity, but may choose to reserve some ofthat capacity for unforeseen needs and may have idle capacity that it cannot use.
Sunk costs. Many organizations have made payments in the past to acquire re-sources that they now control. The amounts of these payments usually are recognizedas the costs of resources that are expected to be used in the future (these resources withfuture benefits are, of course, assets). These resources often include equipment, build-ings, and purchased technology or knowledge. Should you consider the costs of theseresources when making production decisions? That is, should the past payments forthese resources be part of the costs of future products and services? The correct answeris no; past payments for resources are sunk costs—they cannot be undone. Just as withany other resource, only the opportunity costs of these already acquired resourcesshould be counted as part of the cost of future products and services. If these resourceshave no alternative use or value (that is, they cannot even be sold to others), it does notmatter how much you paid for them, their opportunity cost is zero.
As a practical matter, however, many companies count the past payments forresources as part of the cost of current and future products and services. Why? One rea-son is that measuring opportunity costs of all resources is too difficult, so organizationsassume that past purchase prices approximate current opportunity costs. Also, financialand tax reporting rules in most countries, including Canada, require that assets be val-ued at book values, which are their purchase prices, net of accumulated depreciation oramortization. More precisely: at the lower of book or market value. As those resourcesare used, accounting for that use reduces these asset values by the amount of past costsused. Thus, many organizations count the use, depreciation, depletion, and amortiza-tion of existing assets as costs of current and future products and services even thoughthese costs may be sunk costs or allocations of sunk costs. Another, less justifiable rea-son may be that managers are unwilling to admit that payments for resources have beenwasted, so they continue to value resources at their book value unless they are requiredto write down the assets to a lower value.
120 Part II Cost Measurement Systems
Sunk costs are pastpayments for resourcesthat cannot be undone
A committed cost is acost that is not intendedto vary with productionor sales volume
Discretionary costsmay be changedquickly and easily

Chapter 4 Measuring Costs of Operations 121
Alternative Costing MethodsIf supplying and using resources result in different measures of costs, which costsshould managers use to solve the problem of how to generate the most profit from con-strained capacity? This cost management issue is: Should managers base productiondecisions on the profitability of products and services using costs of using resources orcosts of supplying resources?
There is considerable, unresolved controversy among managers, consultants, andprofessors about this. Some argue that the answer is always to base production deci-sions on expected supply of unit-level resources since that mirrors the immediate cashflow impacts of decisions. Others argue that costs of resource use, which often requireaveraging of some past, committed, or indirect costs over units produced, are more ef-fective, long-term measures of the profitability of production decisions because, afterthese resources are used, they must be replaced. We will consider implications of botharguments.
Consider Exhibit 4–8, which Glenn Penski prepared to analyze the costs of differ-ent models of CMD’s devices produced during the week. This exhibit uses the basiccost information from Exhibit 4–6 (rows 1 through 12) but combines it in several dif-ferent ways to create different measures of product cost—throughput cost, variablecost, and absorption cost—newly added rows 13 through 15. For simplicity, the exhibitshows details for only two of CMD’s seven models, #700A and #900B, because theyare most different in their use of resources.
Throughput Costing
Those who argue that managers should base production decisions on resource supplyand use also argue that costs of products and services should be based on throughputcosting. Throughput costing measures only unit-level costs as the costs of products orservices. Advocates of throughput costing argue that adding any other indirect, past orcommitted costs to product cost creates improper incentives to drive down the averagecost per unit by making more parts and assemblies on nonbottleneck processes. Sincethese other costs are committed, making more units with the same level of resourcespending arithmetically reduces the average cost per unit and makes the production
Cost Classifications and Decision Making
Refer to Exhibit 4–6 and the preceding discussion. Put yourself in Glenn Penski’s position and re-spond to these comments from co-workers
(Solutions begin on page 135.)
a. “I don’t see the need to develop complex measures of costs of our devices; average cost is fine.We know our products are the best in the industry and we have long backlogs of orders. All weneed to do is make as many devices as we can and charge as much as we can for them.”
b. “You say that you have measured direct costs more accurately by tracing them to differentmodels, but it looks like they are just another average cost at the model level. How is that animprovement over using overall average cost?”
c. Assume that CMD made 25 more of model 900B, increasing total production to 405 units forthe week. Direct material costs per unit remained as before for all models (e.g., C5, E5), as didthe sum of total conversion cost (F6) and indirect cost (F11). In other words, the only total costthat increased was direct materials cost. What do these changes and lack of changes in thevarious costs indicate about Glenn’s classifications of costs? Would allocated costs change?Explain.
d. Are there any possible adverse effects of a decision to make 25 more of model #900B?
You’re the
DecisionMaker 4.1
LO2 Comparealternative product costsand their effects onprofits.
Throughput costingmeasures only the unit-level spending fordirect costs as the costsof products or services

process appear to be more efficient. Throughput costing avoids that incentive becausethe cost per unit depends only on unit-level spending (e.g., costs of materials), not howmany units are made.8
Using throughput costing means that cost managers must distinguish between(1) spending for resources that is caused by the decision to produce different levels of
products and services and (2)use of resources that the orga-nization has committed to sup-ply, regardless of the level ofproducts and services pro-vided. At CMD, Glenn Penskidetermined that only the costsof materials (row 5 of Exhibit4–8) qualify as throughputcosts (row 13) because CMDhas committed, at least for thetime being, to supply all otherresources (manufacturing la-bor, equipment, management,
122 Part II Cost Measurement Systems
8This statement ignores possible effects of gaining or losing quantity discounts on purchases by chang-ing production levels. These effects usually are small, but they would be considered as a benefit or cost ofchanging purchasing levels.
Exhibit 4–8 Weekly Alternative Product Costs
A B C D E
1 Model #700 A #900 B
2 Quantity 48 40
3 Average AverageSubtotal per Unit Subtotal per Unit
4 Direct (variable) costs
5 Unit-level material cost $ 67,200 $ 1,400 $124,000 $ 3,100
6 Variable conversion cost 38,400 800 44,000 1,100
7 Total direct costs 105,600 2,200 168,000 4,200
8 Indirect costs
9 Indirect production cost 277,894 5,790 231,579 5,790
10 Indirect operating cost 217,074 4,522 180,895 4,522
11 Total indirect costs 494,968 10,312 412,474 10,312
12 Total costs $600,568 $12,512 $580,474 $14,512
13 Throughput cost per unit (C5; E5) $ 1,400 $ 3,100
14 Variable cost per unit (C7; E7) $ 2,200 $ 4,200
15 Absorption cost per unit (C7 � E9; E7 � E9) $ 7,990 $ 9,990
Balancing productionprevents built-up of excessinventories of cabinets inprocess at all work stations.

Chapter 4 Measuring Costs of Operations 123
facilities, and so on) regardless of how many measuring devices it makes. Throughputcosting considers all other indirect, discretionary, committed, or past spending for re-sources to be operating costs of the period. Note that some organizations may pay forits labor force or other resources such as energy consumption on an hourly or piece-rate basis depending on how many units of product are made. Because these resourcesare supplied and used on an hourly or piece-rate basis, these would be unit-level costsand product costs for throughput costing.
Variable Costing
Variable costing measures the cost of a product or service according to the resourcesused to provide it. At CMD, Penski measured the variable costs of the company’s prod-ucts in row 14 of Exhibit 4–8. Variable costs at CMD include the unit-level materialcosts (row 5) and the variable conversion costs (row 6) that have been traced to the pro-duction of each product-model line. Thus, CMD’s variable costs are unit-level mater-ial costs plus variable costs of conversion resources used. At other organizations,variable costs may include variable costs of production and sales, distribution, andother used operating resources, the uses of which are traced to products and services.
Note the similarity between variable costing and throughput costing. The only dif-ference is that variable product costs include traced costs of resources used even if ad-ditional spending is not required to supply the resource. As shown, CMD’s variablecosts include the (conversion) costs of its skilled laser-manufacturing technicians usedto make instruments even though CMD pays these technicians a salary.
Absorption Costing
Absorption costing (full costing or full absorption costing9) allocates indirect pro-duction costs to products in addition to unit-level and variable production costs. Notethat because absorption costs conform to financial reporting rules, absorption costs donot include nonproduction costs that may be unit-level or variable costs. Thus, absorp-tion costs are variable production costs plus allocated indirect production costs. Ob-serve that in some organizations absorption costs may not be a simple addition ofvariable costs and allocated indirect costs because absorption costing distinguishes be-tween production and nonproduction resources. Absorption costing counts any variablecosts that are from nonproduction resources as operating expenses. CMD’s situation issimpler because all indirect, nonproduction costs are committed costs.
Bertch Cabinet Manufacturing, Inc., recently adopted synchronous manufacturing, which is a directapplication of the theory of constraints. The company credits this change with reducing cycle times,reducing batch sizes, improving material flow, reducing and better-managing inventory, increasingmorale, and improving customer satisfaction. Bertch’s cost managers had developed a very com-plex costing system but decided to greatly simplify it by converting to throughput costing to be con-sistent with internal decision-making based on TOC. They defined throughput costs as payments toexternal parties for raw materials, components, subcontracted work, sales commissions, trans-portation, and custom duties on international sales. This allows managers to accurately measure theprofit (or throughput) per unit of bottleneck resource for each product in the Bath Cabinet, CulturedMarble Top, Kitchen Cabinet, and Semi-Custom divisions.
Source: J. MacArthur, “From Activity-Based Costing to Throughput Accounting.”
Cost Management in
Practice 4.2
Variable costingmeasures the cost of aproduct or serviceaccording to the unit-level resources used toprovide it
9One cannot observe products consuming indirect resources, but accountants say the products absorbthe costs of indirect resources. Full absorption costing indicates that the full range of production costs is usedto measure the costs of products.
Absorption costing(full costing or fullabsorption costing)allocates indirectproduction costs toproducts in addition tounit-level or variableproduction costs
Operating costs of theperiod are the totalcosts of non-unit-level,past, or committedresources for allproducts

Absorption costing requires judgments or simplifying assumptions about howproducts consume indirect production resources. There are many ways to implementabsorption costing. The simplest way would be to divide total indirect production costsequally across all units of product produced, as CMD did in Exhibit 4–6 and as shownin C9 and E9 of Exhibit 4–8.
Absorption costs (C15 and E15 of Exhibit 4–8) may be more accurate measures ofthe consumption of production resources than either throughput or variable costs (rows13 and 14) because absorption costs do recognize and contain indirect productioncosts. However, just as the overall average cost may misstate product costs, by allocat-ing indirect production costs, absorption costs may misstate consumption of indirectproduction resources. It is possible that CMD’s product models use indirect productionresources to a different degree. Absorption costing also ignores products’ use of non-production resources. Thus, absorption costing actually may distort the costs to provideproducts and services if they have greatly different levels of support from indirect re-sources. For example, one product may need much more engineering design supportthan another, but allocations unrelated to resource use or treating the cost as an operat-ing cost obscure this difference. Exhibit 4–9 shows that absorption costs are variableproduction costs plus allocated indirect production costs.
124 Part II Cost Measurement Systems
Exhibit 4–9
Absorption CostsCosts of
direct andindirect
productionresources
used toprovide unitsof product or
service
Allocations ofcosts ofindirect
productionresources not
traced toproducts or
services
Absorptioncosts+ =
VariableProduction
Costs
Approximately 48 percent of Canadian companies use variable costing in their internal accountingsystems. For financial reporting purposes in Canada, the Canadian Institute of Chartered Accoun-tants (CICA) Handbook advocates, but does not require, absorption costing. The Canada Customsand Revenue Agency (CCRA) does not explicitly require absorption costing either. However, it doesrequire that firms be consistent for both financial statements and tax purposes. This results in mostfirms using absorption costing for external reporting purposes.
For example, see S. Inoue, “A Comparative Study of Recent Development of Cost ManagementProblems in U.S.A., U.K., Canada, and Japan,” C. Drury and M. Tayles, “Product Costing in UKManufacturing Organisations,” and E. Shim and E. Sudit, “How Manufacturers Price Products.”
Sources: CICA Handbook, Section 3030 CCRA Interpretation Bulletin No. 473
Research
Insight 4.1
Global

Chapter 4 Measuring Costs of Operations 125
Financial Management of ProcessesWhether one is an advocate of throughput, variable, or absorption costing, there is gen-eral agreement that organizations should manage four financial measures of processes:contribution to profit (per unit, product, and overall), operating expense, inventory, andoperating income.10 If these measures are designed properly (and this is a source of de-bate because of alternative ways of measuring costs), they will reinforce the propermanagement of constrained resources to generate the most profit.
Exhibit 4–10 outlines the three different approaches to product costing and the cor-responding financial measures of process performance. We discuss contribution toprofit, operating expense, and inventory calculations for each costing method sepa-rately. Then, we discuss operating income for the methods together because the con-trasts are most interesting and demonstrate potential conflicts among the methods.
Exhibits 4–11, 4–12, and 4–13 present the financial measures of performance foreach costing method. To show the effects of different costing methods, these exhibitsassume that:
� CMD produced 65 units of Model #900B but sold 40. � Consequently, twenty-five units of Model #900B were added to inventory. � The only spending increase was for direct cost because this increased production.
All other spending as shown in Exhibit 4–6 was unchanged. � All units of other models produced were sold.
Costs of the other models may be found by subtracting costs for #700A and #900Bfrom total costs. (Hint: If you have not worked through You’re the Decision Maker4.1, it would be a good idea to do so now.)
10CMD, like many other companies, uses nonfinancial measures of performance as well as these finan-cial measures. Other chapters discuss this important aspect of measuring performance.
Exhibit 4–10 Measures of Process Performance per Time Period
Costing Approach
Financial Measure Throughput Costing Variable Costing Absorption Costing
Contribution to profit Throughput � Sales � Contribution margin � Gross margin � Sales �Unit-level cost (spent) Sales � Variable Absorption cost ofof goods sold costs (used) of goods sold goods sold
Operating expense Other costs incurred to Other costs incurred to Nonproduction coststransform inventory transform inputs into incurred to transforminto throughput completed products inputs into completed
and goods sold products and goods sold
Inventory All costs used to acquire Variable costs of Full costs of products inobjects for sale products in process or process or completed
completed but not sold but not sold
Inventory (asset) turnover Inventory turnover Inventory turnover
Operating income Throughput � Operating Contribution margin � Gross margin � operatingexpense Operating expense expense

Throughput Costing
Contribution to profit. Throughput costing uses throughput, which is sales revenueless the unit-level cost of goods sold, as the measure of contribution to profit. Rows 2–8 of Exhibit 4–11 show the calculation of throughput for the week. Sales revenue inrow 3 had not been given before in this chapter, but this amount is the total revenueearned from the sale of all products in the week. Information about the costs of prod-ucts other than models #700A and 900B is given in this exhibit as well. Note that onlythe direct material costs of the units that were sold are recognized as throughput cost ofgoods sold. Row 5 counts the unit-level material cost of all 48 units of Model #700Athat were made and sold during the week. However, even though CMD made 65 unitsof Model #900B, only the cost of the 40 units sold is recognized as cost of goods sold(row 6). The cost of the other 25 units that were produced but not sold is added to in-ventory, as shown in subsequent rows of Exhibit 4–11. The unit-level material cost ofthe 292 other model units made and sold also count as throughput cost of goods sold.Subtracting the total cost of goods sold (C7) from sales revenue (C3) yields the week’sthroughput, C8.
126 Part II Cost Measurement Systems
Throughput is salesrevenue less thethroughput cost ofgoods sold, as thecontribution to profit
Exhibit 4–11 Throughput Measures of Process Performance
A B C
1 (405 units produced, 380 units sold)
2 Contribution to profit
3 Sales revenue (given as additional information) $7,600,000
4 Throughput (unit-level) cost of goods sold
5 Model 700A: 48 units � $1,400 per unit (C2 � C5, Exhibit 4–6) $ 67,200
6 Model 900B: 40 units � $3,100 per unit (E2 � E5, Exhibit 4–6) 124,000
7 All other models (F5 � D5 � B5, Exhibit 4–6) 643,600 834,800
8 Throughput (C3 � C7) 6,765,200
9 Operating expense
10 Conversion costs (F6, Exhibit 4–6) 351,200
11 Indirect production costs (F9, Exhibit 4–6) 2,200,000
12 Indirect operating costs (F10, Exhibit 4–6) 1,718,500 4,269,700
13
14 Operating income � Throughput � Operating expense(C8 � C12 � $6,765,200 � $4,269,700) $2,495,500
15 Ending assets (Throughput inventory)� Beginning assets, $2,700,000 (given as additional information)� Cost of goods completed, (48 � $1,400 � 65 � $3,100 � $643,600)� Cost of goods sold, $834,800� $2,777,500 $2,777,500
Note: The increase of $77,500 in inventory is the unit-level costof the 25 units of Model #900B that were made but not sold� 25�$3,100.
16 Asset (Throughput inventory) turnover ratio � Sales/Averagetotal assets � $7,600,000 � [ ($2,700,000 � $2,777,500) � 2 ] 2.77

Chapter 4 Measuring Costs of Operations 127
Managers would make decisions about best uses of capacity by comparingthroughputs of each alternative product mix, which is the relative proportions or num-bers of products, for example, the number of Model #700A, Model #900B, and othermodels produced. If a different product mix promised a higher total throughput, itwould be preferred to the mix shown in rows 5–7 of Exhibit 4–11. Proponentsof throughput costing say that only this approach is designed to identify the profit-maximizing product mix.
Operating expense. In general, operating expense is all operating costs of theperiod that are not counted in cost of goods sold or inventory. In throughput costing atCMD, operating expense (C12) is all operating costs of the period other than materialscost. Because costs of supplying these resources does not vary with levels of produc-tion, operating costs include conversion costs (B10), indirect production costs (B11),and indirect operating costs (B12). If these are past or committed costs, some argue thatthey can be ignored for the decision of choosing the best use of capacity. The productmix that fully utilizes the bottleneck process and generates the highest expectedthroughput is the best use of capacity.11 In concept, this approach to management ap-pears to be mechanical and almost error-free. However, this approach also can haveshortcomings if it is applied naïvely or to large organizations as a whole.
Even if costs are correctly identified as throughput or operating expense, failing toanalyze operating costs could lead to treating them as fixed costs that cannot change.In fact, the organization can and should analyze whether it can manage throughput andoperating costs more efficiently. In addition, choosing the overall product mix impliescentralized management, where a few managers direct the operations of an entireorganization. This may be feasible at a small company like CMD, but it has proved tobe unwieldy and ineffective in most large organizations. Centralized management usu-ally is too slow and inflexible to meet new challenges. In order to compete more effec-tively, most large organizations have decentralized decision-making authority tosmaller business units or even to individual employees.
Inventory. Inventory, in general, is the cost of materials and products either inprocess or completed but not sold. In throughput costing, all costs (other than operat-ing expense) of unsold resources that an organization had acquired are considered in-ventory (B15). This unusual definition of inventory indicates that all the resources ofthe organization (normally termed assets—including land, buildings, and equipment)are intended to generate goods for sale and are themselves potentially for sale. Notethat throughput costing still only counts unit-level costs as cost of goods sold, however.
The ending assets (throughput inventory in C15) for the week are computed asshown in row 15 by adding changes in assets to the beginning assets. For simplicity, weassume CMD made no net purchases or sales of other assets, so the only change in as-sets is the change in product inventory. That change is the cost of goods completed lessthe cost of goods sold. CMD made 25 more units of Model #900B than it sold, so thethroughput cost of those units is the net increase to inventory.
A throughput measure of the use of inventories is the asset turnover ratio (C16),which is sales revenue divided by average asset level. Since high levels of inventoriestie up scarce monetary and physical resources, low inventory levels are desirable.However, there should be enough inventories on hand to allow for unforeseen varia-tions in needs. Otherwise, bottleneck processes may not have parts and assemblies towork with, and irreplaceable bottleneck time would be lost. These ratios are most use-ful as performance benchmarks. Increasing inventory turnover ratios over time indi-cates improved use of inventories, and vice versa. Comparing inventory turnover ratiosacross organizations that use the same costing method indicates relative efficiencies of
The product mix is therelative proportions ornumbers of productsproduced
11Linear programming is a mathematical technique consistent with throughput costing that can be usedto select the mix of products that maximizes the contribution to profit subject to constrained resources.
Operating expense isall operating costs ofthe period deductedfrom revenues that arenot counted in cost ofgoods sold or inventory
Centralizedmanagement is thedirection of theoperations of an entireorganization by a fewmanagers
Decentralizeddecision-making is thefreedom of managers at various levels of theorganization to makedecisions withoutintervention fromcorporate head office
Inventory is the cost ofmaterials and productseither in process orcompleted but not sold
The asset turnoverratio is sales revenuedivided by averageasset level
the use of inventories. Inven-tory turnover ratios are notcomparable across differentcosting methods since themethods value inventoriesdifferently.
Variable Costing
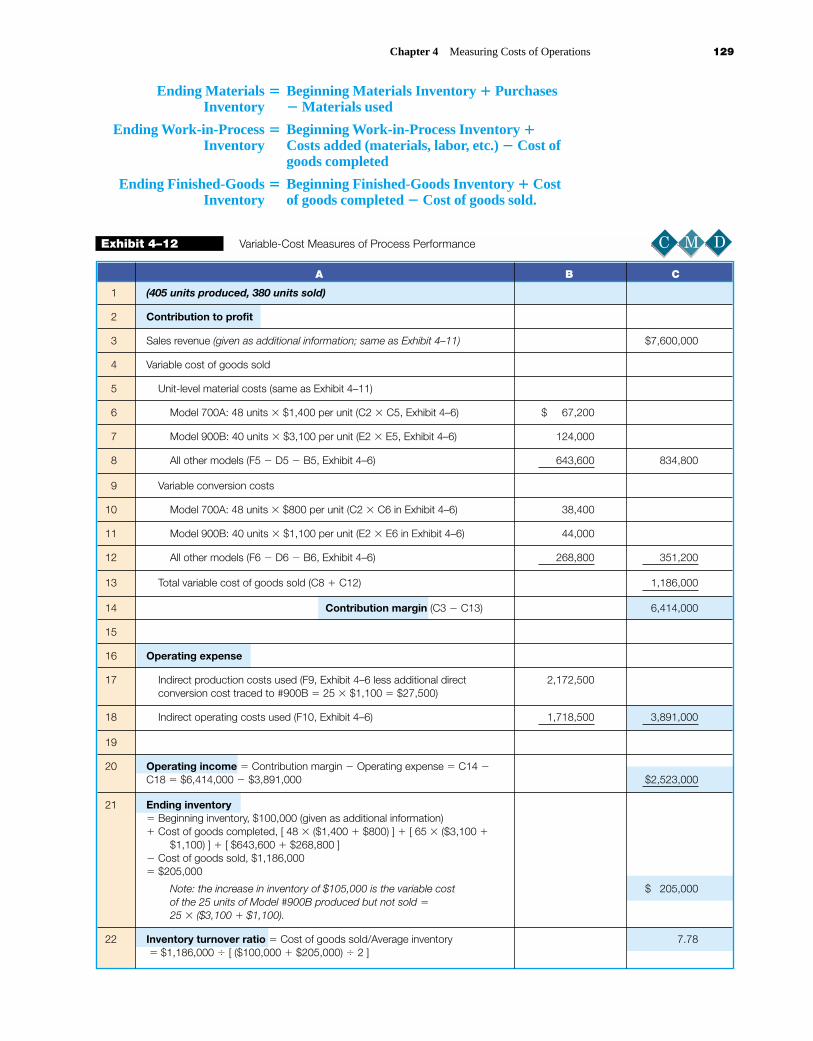
Exhibit 4–12 presents the vari-able-cost financial measuresof performance, also assumingthat CMD produced 65 unitsof Model #900B but sold 40.As before, only material-cost
spending increased with this increased production. All other spending as shown previ-ously in Exhibit 4–6 was unchanged, and all other model units produced were sold.
Variable costing uses the contribution margin (C14), which is sales revenue (C3)less variable costs of goods sold (C13), as the measure of contribution to profit. Vari-able cost of goods sold is calculated in rows 4 to 13 and includes unit-level materialsand variable conversion costs (and in other organizations any variable support andmarketing/distribution costs). The variable cost of goods sold (C13) is computed byadding the unit-level material costs (C8), which are the same as in Exhibit 4–11, to thevariable conversion costs of Models #700A and #900B from Exhibit 4–6. These calcu-lations appear in rows 10 and 11. To these we also add the variable conversion costs ofthe other 292 units made and sold (B12) to obtain the total variable conversion cost(C12). Note that the variable costs of the additional 25 units of Model #900B made butnot sold are added to inventory, as discussed later.
Using variable costs and the financial criterion of maximizing the contribution toprofit, managers would select the product mix that they expect to generate the highestcontribution margin (C14).
Operating expense. In variable costing, operating expense (C18) is all indirect costsof the period, including both indirect production (B17) and indirect operatingcosts (B18).
Note that the total amount of indirect production cost (B17) is $27,500 less than inExhibit 4–11. All costs must be accounted for. What happened to this amount of cost?It is now part of cost of goods completed but not sold—added to inventory. The addi-tional 25 units used an additional $27,500 of conversion resources (� 25 � $1,100)used and traced to the production of Model #900B. Previously for throughput costingin Exhibit 4–11, the total amount of conversion cost is part of operating expense; noneof it was counted as a product cost. In contrast, for variable costing any variable costused is traced to units produced and counted as product cost, and only the unused por-tion of conversion cost is part of operating expense.
Inventory. In manufacturing organizations like CMD, variable (and absorption) cost-ing methods measure three types of inventory resources or assets: materials, work-in-process, and finished-goods inventories. Materials Inventory is measured at theacquisition price of the materials (including purchase cost, transportation, etc.) avail-able for use. Work-in-Process Inventory is measured as the cost of materials, labor,and other production resources added thus far to products that are not yet completed.Finished-Goods Inventory is measured as the production costs used to make productsthat have been fully completed but not yet sold. All production costs first are accumu-lated in Work-in-Process Inventory. As items are completed, they are then transferredto Finished-Goods Inventory. All beginning and ending inventories are related simi-larly as shown in the following equations:
128 Part II Cost Measurement Systems
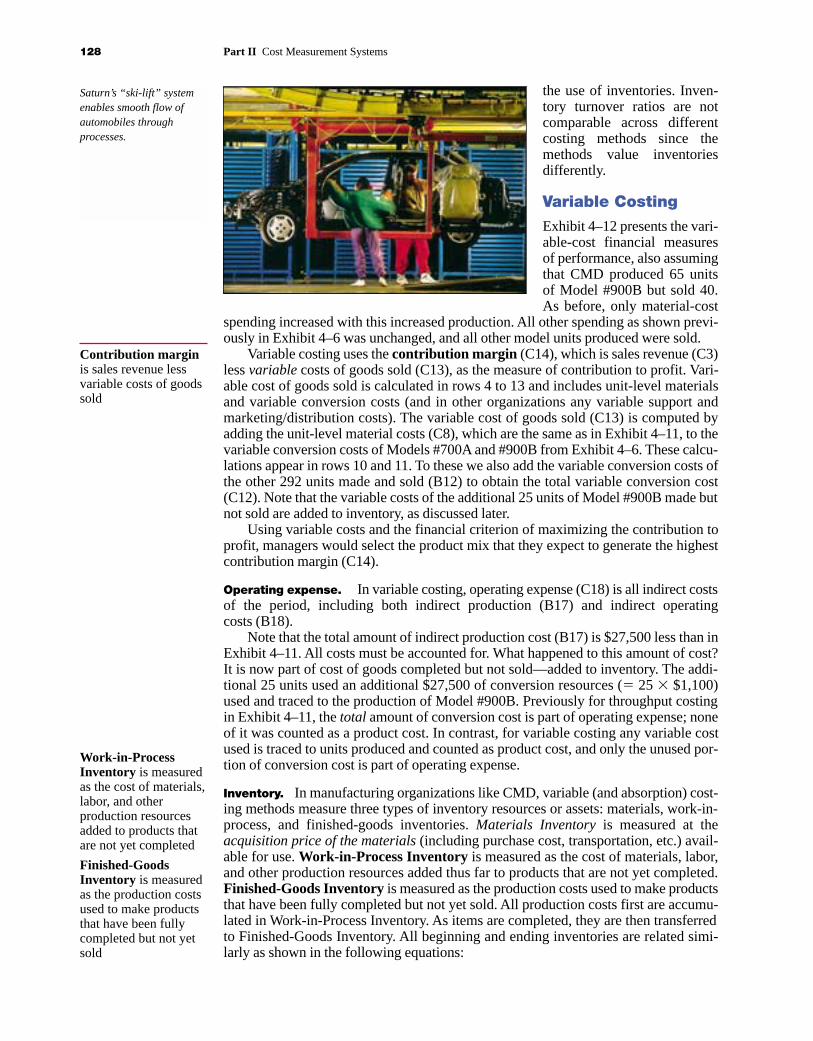
Saturn’s “ski-lift” systemenables smooth flow ofautomobiles throughprocesses.
Contribution marginis sales revenue lessvariable costs of goodssold
Work-in-ProcessInventory is measuredas the cost of materials,labor, and otherproduction resourcesadded to products thatare not yet completed
Finished-GoodsInventory is measuredas the production costsused to make productsthat have been fullycompleted but not yetsold
Chapter 4 Measuring Costs of Operations 129
Ending Materials � Beginning Materials Inventory � PurchasesInventory � Materials used
Ending Work-in-Process � Beginning Work-in-Process Inventory �Inventory Costs added (materials, labor, etc.) � Cost of
goods completed
Ending Finished-Goods � Beginning Finished-Goods Inventory � CostInventory of goods completed � Cost of goods sold.
Exhibit 4–12 Variable-Cost Measures of Process Performance
A B C
1 (405 units produced, 380 units sold)
2 Contribution to profit
3 Sales revenue (given as additional information; same as Exhibit 4–11) $7,600,000
4 Variable cost of goods sold
5 Unit-level material costs (same as Exhibit 4–11)
6 Model 700A: 48 units � $1,400 per unit (C2 � C5, Exhibit 4–6) $ 67,200
7 Model 900B: 40 units � $3,100 per unit (E2 � E5, Exhibit 4–6) 124,000
8 All other models (F5 � D5 � B5, Exhibit 4–6) 643,600 834,800
9 Variable conversion costs
10 Model 700A: 48 units � $800 per unit (C2 � C6 in Exhibit 4–6) 38,400
11 Model 900B: 40 units � $1,100 per unit (E2 � E6 in Exhibit 4–6) 44,000
12 All other models (F6 � D6 � B6, Exhibit 4–6) 268,800 351,200
13 Total variable cost of goods sold (C8 � C12) 1,186,000
14 Contribution margin (C3 � C13) 6,414,000
15
16 Operating expense
17 Indirect production costs used (F9, Exhibit 4–6 less additional direct 2,172,500conversion cost traced to #900B � 25 � $1,100 � $27,500)
18 Indirect operating costs used (F10, Exhibit 4–6) 1,718,500 3,891,000
19
20 Operating income � Contribution margin � Operating expense � C14 �C18 � $6,414,000 � $3,891,000 $2,523,000
21 Ending inventory� Beginning inventory, $100,000 (given as additional information)� Cost of goods completed, [ 48 � ($1,400 � $800) ] � [ 65 � ($3,100 �
$1,100) ] � [ $643,600 � $268,800 ]� Cost of goods sold, $1,186,000� $205,000
Note: the increase in inventory of $105,000 is the variable cost $ 205,000of the 25 units of Model #900B produced but not sold �25 � ($3,100 � $1,100).
22 Inventory turnover ratio � Cost of goods sold/Average inventory 7.78� $1,186,000 � [ ($100,000 � $205,000) � 2 ]

In our example using CMD, we are assuming that all units begun during the weekare completed that week, so we can focus on Finished-Goods Inventory. Otherwise, wewould also compute ending Work-in-Process Inventory in a similar manner (this topicis covered in a later chapter). The ending Finished-Goods Inventory is computed inrow 21 of Exhibit 4–12. To compute the inventory value, we add the variable conver-sion costs of the units made as well as the unit-level material cost. The increase in in-ventory value is the variable cost of the 25 units of Model #900B made but not sold($105,000 � 25 � $4,200).
In variable (and absorption) costing, the measure of efficient use of inventories isthe inventory turnover ratio, which is the cost of goods sold of the period divided byaverage total inventory cost (C22). The inventory turnover ratio is most useful whenused as a benchmark over time, and against other organizations that use the same cost-ing method. A higher or increasing level of this ratio indicates improved use of inven-tory resources.
Absorption Costing
Exhibit 4–13 presents the financial measures of performance for CMD during the weekusing absorption costing. As before, CMD made 25 more units of Model #900B than itsold that week. Only material cost spending increased, and all other units producedwere sold.
Contribution to profit. Absorption costing uses gross margin (C15), which is salesrevenue (C3) less absorption cost of goods sold (C14), as the contribution to profit. Asshown in Exhibit 4–13 (rows 4–14), absorption cost of goods sold is composed of vari-able and indirect production costs of units sold. In this example, the variable costs ofgoods sold (C8 � C13) are identical to the costs recognized in variable costing (Ex-hibit 4–12). To these variable costs CMD adds the indirect production costs allocatedto the units that were sold (C13). For simplicity, CMD allocates an equal amount of in-direct production cost to each unit made. Row 13 of Exhibit 4–13 computes the aver-age indirect cost per unit made ($2,172,500 � 405) and multiplies this amount by theunits sold to obtain indirect costs of units sold (C13). The total absorption cost of unitssold is in row 14. Subtracting the absorption cost of goods sold (C14) from sales rev-enue (C3) yields the gross margin (C15). Using this financial criterion, the product mixwith the highest expected gross margin is the best use of scarce resources.
Similar to the other costing methods, the product costs of the additional 25 units ofModel #900B that were made but not sold are added to inventory costs.
Operating expense. In absorption costing, operating expense (C16) is all indirect,nonproduction costs of the period. These typically include all costs of sales, marketing,and administration.
Inventory. Absorption-costing inventories include all production costs (direct and in-direct) that have been added to products that have not been sold. Row 18 of Exhibit4–13 computes ending Finished-Goods Inventory by adding beginning inventory andthe cost of goods completed, then subtracting cost of goods sold. Cost of goods com-pleted includes the variable material and conversion costs and indirect production costof all units produced. Cost of goods sold, however, is the absorption cost of only theunits sold. The increase in inventory is the absorption cost of the 25 units of Model#900B that were produced but not sold. The inventory turnover ratio is computed inrow 19 by dividing sales revenue by the average, absorption cost inventory level.
Comparing Operating Incomes
Operating income is the contribution to profit less operating expense, each definedappropriately for the costing method used. It is instructive to see that differences in op-erating incomes across the methods are caused by whether conversion and indirectproduction costs are counted as part of operating expense or as costs of the products.
130 Part II Cost Measurement Systems
The inventoryturnover ratio is thecost of goods sold ofthe period divided byaverage total inventorycost
The gross margin issales revenue lessabsorption cost ofgoods sold
Operating income isthe contribution toprofit less operatingexpense, each definedappropriately for thecosting method used

Chapter 4 Measuring Costs of Operations 131
These differences are at the heart of arguments in favor of using throughput costing be-cause, with either variable or absorption costing, managers can increase operating in-come just by increasing production, without increasing sales, and by costing productsat more than spending for direct cost. Sounds strange? Read on.
Advocates of throughput costing argue that including costs of resources used thatalready have been acquired or committed as costs of products distorts the cash flow ofproduction decisions. This can create an incentive to make more parts, assemblies, andfinished units than can be sold in order to spread these past, or committed, costs overmore output. This reduces the average cost per unit and, as will be shown, allowsmanagers to “hide” costs in inventory that otherwise would be charged as operating ex-pense. Study how this works in Exhibit 4–14.
Exhibit 4–13 Absorption-Cost Measures of Process Performance
A B C
1 (405 units produced, 380 units sold)
2 Contribution to profit
3 Sales revenue (given as additional information) $7,600,000
4 Absorption cost of goods sold
5 Unit-level material costs (same as Exhibit 4–11 and 4–12)
6 Model 700A: 48 units � $1,400 per unit (C2 � C5, Exhibit 4–6) $ 67,200
7 Model 900B: 40 units � $3,100 per unit (E2 � E5, Exhibit 4–6) 124,000
8 All other models (292 units, � F5 � D5 � B5, Exhibit 4–6) 643,600 834,800
9 Variable conversion costs (same as Exhibit 4–12)
10 Model 700A: 48 units � $800 per unit (C2 � C6 in Exhibit 4–6) 38,400
11 Model 900B: 40 units � $1,100 per unit (E2 � E6 in Exhibit 4–6) 44,000
12 All other models (292 units, F6 � D6 � B6, Exhibit 4–6) 268,800 351,200
13 Indirect production costs � Indirect production cost per unitproduced � units sold � ($2,172,500 � 405) � 380 2,038,395
14 Total absorption cost of goods sold 3,224,395
15 Gross margin (C3 � C14) 4,375,605
16 Operating expense � Indirect operating costs (F10, Exhibit 4–6) 1,718,500
17 Operating income �Gross margin � Operating expense � C15 �C16 � $4,375,605 � $1,718,500 $2,657,105
18 Ending inventory� Beginning inventory, $180,000 (given as additional information)� Cost of goods completed, [48 � ($1,400 � $800) ] � [ 65 � ($3,100 �
$1,100) ] �$643,600 � $268,800 � 2,172,500� Cost of goods sold, $3,224,395� $419,105 $419,105
Note: the increase in inventory of $239,105 is the variable materialand conversion cost plus allocated indirect production cost of the25 units of Model #900B produced but not sold� 25 � ($3,100 � $1,100) � ($2,172,500 � 405).
19 Inventory turnover ratio � Cost of goods sold/Average inventory 10.8� $3,224,395 � [ ($180,000 � $419,105) � 2]

Operating income using each costing method is shown in the nonshaded rows ofcolumn B of Exhibit 4–14. Observe that operating income for throughput costing is$27,500 (B3) less than operating income with variable costing (compare B2 and B4).Revenues are the same in each case, so to have higher operating income, variable cost-ing must recognize $27,500 less total expense (C3) than throughput costing, as shownin the comparison of C2 and C4. All costs must be accounted for, so what happened tothis $27,500 of cost in variable costing? Hint: It did not disappear; it’s only hiding.
Throughput costing treats only unit-level cost (e.g., material cost at CMD) as thecost of a product, and all indirect conversion and other production costs are operatingexpenses. With variable costing, however, the cost of each unit produced is measuredas material cost plus directly traced conversion cost. Therefore, the 25 unsold units ofModel #900B that are in inventory waiting to be sold add $27,500 of conversion costbeyond the material cost of those unsold units to inventory cost (see D4). The mysteryof the missing cost is solved! Using variable costing rather than throughput costing,CMD could “store” $27,500 of conversion cost in inventory. This reduces total ex-penses and increases operating income by that same amount. But wait. For a more dra-matic effect, consider what happens if CMD uses absorption costing.
Exhibit 4–14 demonstrates that variable-costing operating income (B4) is$134,105 less (B5) than absorption-costing operating income (B6). Comparing totalexpenses in column C shows that absorption costing (C6) recognizes $134,105 less(C5) total expense than variable costing (C4), as you would expect since revenues arethe same. Is it coincidental that these differences (B5 and C5) between the operating in-comes and expenses of variable and absorption costing are the exactly the same as theadditional inventory cost (D5) between the two methods? Not at all.
How absorption costing treats indirect conversion and other production costs alsoexplains the difference between the operating incomes of variable costing (B4) and ab-sorption costing (B6). In this case, absorption costing adds a total of $161,605 of con-version and indirect cost (D6) to inventory for the 25 unsold units, which is $134,105more indirect cost beyond the conversion cost added by variable costing (D4). Addingthe 25 unsold units to inventory stores an additional $134,105 (D5) of indirect produc-tion cost [ 25 � ($2,172,500/405) ] that variable costing recognized as an expense ofthe period [ and $161,605 more ($27,500 � $134,105) compared to throughput cost-ing]. Therefore, absorption-costing operating income is $134,105 higher (B5) thanvariable-costing operating income and $161,605 higher than throughput-costing oper-ating income (B5 � B3).
132 Part II Cost Measurement Systems
Exhibit 4–14 Reconciling Alternative Operating Income Measures
A B C D
Total Expense Recognized(Costs of goods sold + Conversion and Indirect
1 Costing Method Operating Income Operating expense) Cost Added to Inventory
2 Throughput $2,495,500 $5,104,500 0(Exhibit 4–11) (C14) (C7 � C12)
3 Difference between $27,500 $(27,500) $27,500Throughput and Variable
4 Variable $2,523,000 $5,077,000 $27,500 � 25 � ($1,100)(Exhibit 4–12) (C20) (C13 � C18)
5 Difference between $134,105 $(134,105) $134,105Variable and Absorption
6 Absorption Costing $2,657,105 $4,942,895 $161,605 � 25 � ($1,100 �(Exhibit 4–13) (C17) (� C14 � C16) $2,172,500/405)

What is more, that amount of conversion and indirect cost (D6) (plus the unit-levelmaterial cost, too) will stay in inventory until the units are sold or discarded as obso-lete, at which time the entire cost of the units will be an expense or loss. In the mean-time, valuable resources will be tied up in inventory and incentives to overuse capacitywill be reinforced. This is why proponents of throughput costing argue so stronglyagainst traditional accounting methods, which count more than the cost of unit-levelspending (e.g., materials) as product cost. If only unit-level cost is counted as productcost, managers cannot reduce average costs of committed or past resource spending byincreasing production, and they cannot “hide” these costs in inventory by making morethan they can sell.12
Chapter SummarySome organizations use only full, absorption costs per unit for decision-making for several reasons:
� Most organizations already prepare absorption cost information because it is used for financialand tax reporting in most countries. Canadian companies tend to follow this practice. It maybe difficult to justify the cost of yet another set of information based on unit-level costs, wheneveryone is pressured to reduce costs of all kinds.
� Managers may be evaluated on the financial performance that is reported publicly (using ab-sorption costing under generally accepted accounting principles), and they may prefer to makedecisions that will be compatible with reported performance.
Some managers, consultants, and professors also feel that absorption costs per unit are bettermeasures of the long-term use of all resources than throughput or variable costs because absorptioncosts explicitly recognize that indirect resources are needed to provide products and services. Par-ticularly in decentralized organizations, they fear that indirect resources will “fall through thecracks” if they are not allocated to products in a visible way. If nothing else, managers can com-plain that the organization must be spending too much on indirect resources if they perceive that al-locations make absorption costs per unit too high.
Proponents of throughput costing argue that, not only are other methods inaccurate and mis-leading, they encourage managers, who want to avoid idle capacity, to fully use all the capacity inevery process in order to drive down the average cost per unit. The result could be similar to whatGlenn Penski found early in his analysis of CMD’s production processes—stacks and shelves of
Chapter 4 Measuring Costs of Operations 133
Analyses of Alternative Production Decisions
Refer to Exhibits 4–11 through 4–14 and the preceding discussions.Exhibits 4–11 through 4–14 assume that 405 units were made in the week, but only 380 were
sold. The unsold products were 25 units of Model #900B. Respond to the following assuming that430 units were produced but still only 380 were sold. Also and as before, only material cost spend-ing increased. The unsold 50 units were again Model #900B.
(Solutions begin on page 136.)
a. Recalculate throughput (C8) in Exhibit 4–11.
b. Recalculate operating expense (C12) and operating income (C14) in Exhibit 4–11.
c. Recalculate inventory (C15) and the asset turnover ratio (C16) in Exhibit 4–11.
d. Recalculate contribution margin (C14) in Exhibit 4–12.
e. Recalculate operating expense (C18) and operating income (C20) in Exhibit 4–12.
f. Explain the difference between these two revised measures of operating income as inExhibit 4–14.
g. Without computing the elements of operating income in Exhibit 4–13, compute the differencebetween operating income using variable costing and absorption costing. (Hint: What is thedifference in how indirect costs are treated?)
You’re the
DecisionMaker 4.2
12Substantial additional coverage of the income-reporting effects of variable and absorption costing isprovided in Section 3 of Chapter 18 (pp. 788–797), which may be studied now. The appendix to Chapter 18(pp. 800–802), which covers the effect of the fixed-overhead volume variance on reported income under variable and absorption costing, should be read after completing Chapters 16, 17 and 18.

unneeded and probably obsolete parts and assemblies that filled every available space in the pro-duction area and warehouse.
Making more products with the same level of spending for capacity does reduce the averagecost of resources supplied per unit. However, if these additional products could not be sold, thisapparent cost reduction per unit is an illusion because scarce resources were wasted and tied up ininventory. Furthermore, if salespeople believe they can drop prices because absorption costs perunit are lower, the organization may lose doubly if overall profits decline. If using absorption costsper unit motivates employees to make more product than can be sold, and many argue that it does,absorption costing works directly against the objective to use nonbottleneck processes only asmuch as needed to keep the bottleneck fully employed. Critics of absorption costing argue that,even though it is required for external reporting, it should be avoided completely for decisionsabout the uses of constrained capacity.
Absorption costing produces per-unit production costs that look like (but are not) unit-levelcosts. These total production costs per unit will drop as more units are produced and indirect costsare spread more thinly across them. If managers or production supervisors are evaluated in part onreducing unit costs, absorption costing creates incentives to build as many parts, subassemblies, orproducts as possible every day by increasing capacity utilization, regardless of whether additionalfinal products can be sold. To reduce incentives that build up inventories or reduce unit costs,throughput costing advocates argue that products should be valued at only their unit-level costs. Allother costs are treated as inventories or operating costs.
Key Terms
134 Part II Cost Measurement Systems
absorption costing (full orfull absorption costing, 123actual costs, 115asset turnover ratio, 127average cost, 116centralizedmanagement, 127committed cost, 120contribution margin, 128conversion resources, 109cost, 114cost allocation, 118cost of resourcessupplied, 115
cost of resources used, 115costing system, 112decentralized decision-making, 127direct resources, 110discretionary cost, 120expected costs, 115finished-goodsinventory, 128fixed cost, 119gross margin, 130indirect resources, 111inventory, 127
inventory turnoverratio, 130materials resources, 108nonproductionresources, 109operating costs, 123operating expense, 127operating income, 130out-of-pocket costs, 115period costs, 115product costs, 115production resources, 109product mix, 127
resources supplied, 111resources used, 111sunk cost, 120throughput, 126throughput costs,throughput costing, 121total cost, 115tracing costs, 117unit-level cost, 118variable cost, 118variable costing, 123work-in-processinventory, 128
Key Terms
1. How can cost managers measure the financial resultsof operations in a way that reinforces proper use ofresources?
Organizations should strive to use their resources wisely toachieve their goals. For profit-seeking firms, that means man-aging scarce resources to produce a competitive level ofprofit. For manufacturing firms this also means not wastingresources by building up inventories that cannot be sold in areasonable amount of time. How financial results are mea-sured can affect the management of resources. For example, ifmanagers are rewarded for reducing average costs and in-creasing short-term profits, then they may have incentives tooveruse capacity and build up inventories, which could in-crease the current period’s profit. This also could affect futureperiods’ profit adversely, however, by requiring a write-downof obsolete inventory.
2. How can alternative methods of calculating productcosts create different incentives?
Again, if managers of manufacturing companies are rewardedon the basis of profits (this is very common), how productcosts are calculated can affect incentives to produce moreparts, assemblies, and products than can be sold. Specifically,variable costing and absorption costing add costs of resourcesused to products without considering whether spending tosupply resources is affected. Levels of spending for some re-sources may be unaffected by how those resources are used(e.g., salaries or rent). Making more units with the same ca-pacity reduces the average cost of products produced. Sincethe costs of products are held in inventory until the productsare sold, these costs also can be “hidden” in inventory. Usingthroughput costing, only spending for resources is counted ascosts of products, and all other costs are expensed. Averageproduct costs cannot be reduced and profits increased merely
Meeting the Cost Management Challenges

by making more products than can be sold. Therefore, propo-nents argue, throughput costing alone aligns financial incen-tives of managers with the objective of using resources wisely.
3. How should cost managers measure costs for internaldecision making?
Though the previous discussion indicates that the answer shouldbe straightforward (i.e., use throughput costing), this actually isa difficult question to answer outside the context of a specificorganization. Most organizations are required to use absorptioncosting for financial and tax reporting. Therefore, whether touse a different costing method internally depends on whetherthe benefits (i.e., making better productive decisions) outweighthe costs of an additional costing system. Though it may seem
intuitively obvious that managers should make better produc-tive decisions using throughput costing, there is remarkably lit-tle reliable research that indicates that better decisions reallyresult. The lack of research might be attributed to the newnessof throughput costing and the reluctance of organizations thathave successfully employed it to give away a source of compet-itive advantage. But it also may be that using absorption costingis beneficial in complex organizations because it makes surethat indirect costs are not forgotten in production and pricingdecisions. It also may be that the costs of using additional inter-nal information are greater than the benefits. Though improve-ments in costing practices are always possible and should beexplored, it is a bit arrogant to assert that all firms using absorp-tion costing for internal purposes are making a mistake.
Chapter 4 Measuring Costs of Operations 135
Solutions to You’re the Decision Maker
4.1 Cost Classification and DecisionMaking, p. 121
a. There are several problems with relying on average costs.First, if there is great variety among products, it is diffi-cult to determine how to use scarce capacity without reli-able measures of profitability. Second, if prices are basedon costs, CMD may be charging too much for deviceswhose costs are lower than average, and charging too lit-tle for devices with costs above average. Customers prob-ably would demand more of the high-cost devices, buttheir low prices mean that profits would be low (or nega-tive). Likewise, customers would not buy the low cost de-vices, perceiving that they are overpriced.
b. It is true that most cost systems measure model costs intotal and then divide by the number of units of eachmodel. This makes the calculation of unit cost an aver-age. However, the natural variation in cost within productmodels is probably much less than the production costacross all models. Therefore, the unit-level costs bymodel should be more accurate than an overall averagecost.
c. It is important to observe that total conversion and oper-ating costs did not vary when production levels changed.This indicates that they are not caused by changes in pro-duction, and they are likely to be indirect resources withexcess capacity.
The most likely change in the cost table would bethat some indirect production cost would be allocated toModel #900B to reflect the additional conversion capac-ity used, as shown in the spreadsheet at the bottom of thepage.
The changes caused by increasing production ofModel #900B ripple through the costs of all the otherproducts made. Let’s consider them in turn.1. Increasing production of #900B to 65 units for the
week causes $71,500 conversion cost to be tracedto the production of #900B (D5 � E2 � E5 � 65� $1,100). Compare this to the $44,000 traced tothis product when 40 units are made (Exhibit 4–6).The additional conversion cost of $27,500 ($71,500� $44,000) traced to the product reduces the indi-rect production cost, which includes the cost of
A B C D E F G
1 Model #700A #900B All Models
2 Quantity 48 65 405
3 Direct costs Total Per Unit Total Per Unit Total Per Unit
4 Direct material cost $67,200 $1,400 $201,500 $3,100 $912,300 $2,253
5 Direct conversion cost 38,400 800 71,500 1,100 378,700 935
6 Total direct costs 105,600 2,200 273,000 4,200 1,291,000 3,188
7 Indirect costs
8 Indirect production cost 257,481 5,364 348,673 5,364 2,172,500 5,364
9 Indirect operating cost 203,674 4,243 275,809 4,243 1,718,500 4,243
10 Total indirect costs 461,155 9,607 624,482 9,607 3,891,000 9,607
11 Total costs $566,755 $11,807 $897,482 $13,807 $5,182,000 $12,795

reserve and excess capacity, by the same amount:F8 � $2,172,500, which is $27,500 less than thecorresponding figure in Exhibit 4–6.
2. This change does not affect the direct costs per unitof any of the products, but, of course, the total di-rect cost increases to reflect the increased directcosts used to make more Model #900B. That is, F6is higher than the corresponding figure in Exhibit4–6 by the amount of direct cost to make 25 unitsmore of Model #900B [ 25 � $4,200(E6) �$105,000 � $1,291,000 (F6) � $1,186,000 (fromExhibit 4–6) ].
3. The reduced total indirect production cost (F8) isdivided by the increased total number of units pro-duced (G2 � 405) and results in a lower averageindirect cost per unit (G8 � F8/G2). The overall in-crease in units produced also reduces the averageindirect operating cost per unit (G9 � F9/G2) allo-cated to all units made.
4. The net effect of making 25 more units of Model#900B is to reduce the average cost of all unitsmade (G11 � $12,795) by $638 [ � $13,433 (fromExhibit 4–6) � $12,795 ].
d. There are several adverse effects to expect. First, becauseresources have been tied up by building products thatmay not be sold, fewer resources are available for other,more productive purposes. Second, if Model #900B issubject to rapid obsolescence, the 25 extra units maynever be sold, or must be sold at steep discounts. Third, ifthis is overuse of capacity, it sets bad precedent for therest of the company, and it will be difficult to preventother product teams from doing the same.
4.2 Analyses of Alternative ProductionDecisions, p. 133
a. This is a trick question; throughput does not change withproduction. It only changes with sales.
b. This is another trick question since operating expense inthroughput costing also does not change if material costis the only cost that changes.
c. Inventory does change because 25 more unsold units, atotal of 50, were produced and placed in inventory. In-ventory will increase by another 25 � $3,100 � $77,500to a total of $2,777,500 � $77,500 � $2,855,000. The in-ventory turnover ratio will be $7,600,000/[ ($2,700,000� $2,855,000)/2 ] � 2.73, a decline that reflects the in-crease in inventory without an increase in sales. Recallthat in throughput costing the numerator is sales revenue,but in the other costing methods the numerator is cost ofgoods sold.
d. This is yet another trick question, because contributionmargin depends on the cost of goods sold. As long asvariable costs per unit do not change, the contributionmargin will remain the same because the units sold re-main the same.
e. Finally, a change because some of the indirect productioncost has been traced to the additional units produced.
Operating expense � Indirect conversion($2,200,000 � 50 � 1,100) � Operating costs(unchanged) � $2,145,000 � $1,718,500 $3,863,500
Operating income � Contribution margin� operating expense � $6,414,000 � $3,863,500 $2,550,500
Costing Operating Conversion Costf. Method Income Added to Inventory
Throughput Costing $2,495,500 $0
Difference $55,000 $55,000
Variable Costing $2,550,500 $55,000 � 50 � ($1,100)
g. The difference is the amount of additional indirect costadded to inventory using full costing. The difference �50 � ($2,145,000/430) � $249,419, and absorption-costoperating income will be $249,419 higher because thatmuch additional cost is hidden in inventory using absorp-tion costing rather than expensed as in variable costing.
136 Part II Cost Measurement Systems
Review Questions4.1 Distinguish among material resources, conversion
resources, and operating resources.4.2 Distinguish between production and nonproduction
resources. Give examples of each.4.3 Explain the concept of traceability and how it is used to
classify resources as direct or indirect.4.4 Is a resource always either direct or indirect? Explain.4.5 Define and give an example of each of the following
costs:a. Opportunity costb. Out-of-pocket costc. Product costd. Period coste. Direct costf. Indirect cost
4.6 What is a unit-level cost? How does it differ fromaverage cost? How does it differ from variable cost?
4.7 How is tracing costs different from allocating costs?4.8 Are committed or discretionary costs the same as
fixed or sunk costs? Explain.4.9 How does throughput costing differ from variable or
absorption costing?4.10 What are the four measures commonly used for the
financial management of processes? Describe eachbriefly.
4.11 What are the differences among throughput,contribution margin, and gross margin?
4.12 Explain how absorption costing can create anincentive to make more products than can be sold.

Critical Analysis
Chapter 4 Measuring Costs of Operations 137
4.13 Evaluate this statement: “Issues of product costing areirrelevant for service organizations, since they cannotbuild up inventories of services, and all costs ofproviding services are expensed in the period they areused. Service firms effectively use throughputcosting.”
4.14 Evaluate this statement: “Issues of product costing areunimportant for virtual organizations that outsourceproduction operations.”
4.15 Prepare a diagram that illustrates how the followingresources—headquarters, facilities, division managers,information systems personnel—can be consideredboth direct and indirect in a company that has fouroperating divisions, which each provide multipleservices.
4.16 Respond to this comment from an economist friend:“You cost managers use an overabundance of costterms to cover up the fact that you really do notunderstand opportunity costs and to create jobs foryourselves based on unintelligible jargon. Not thatthat’s a bad thing.”
4.17 Respond to this observation: “So, there really is nofundamental difference between tracing costs andallocating costs. The only difference is the degree ofaccuracy with which you want to trace costs.”
4.18 Help a friend develop an answer to his questions:“Help me out. It seems that the difference betweenthroughput costing and variable costing depends on thedifference between when resources are paid for andwhen they are used. Isn’t throughput costing justanother tactic for replacing accrual accounting withcash-flow accounting? Accrual accounting has beenused for centuries; how can it suddenly be bad forbusiness?”
4.19 A colleague challenges you: “What do you mean thereis no such thing as a fixed cost? Pick up anymicroeconomics or cost accounting book, and you willsee the term used all the time. We have lots of fixedcosts in our organization, don’t we? What about your
salary and the depreciation of your computer? Why doyou want to replace fixed cost with committed cost?”
4.20 Individually or as a group, develop written argumentsfor and against the following proposition: “Thecompany needs to use absorption costing for financialand tax reporting. We make so many products in somany places that it would be too expensive to developa separate accounting system based on throughputcosting in addition to the system we are required tohave. The way to keep divisions from making morethan they can sell is to charge them interest on anyinventories they maintain. If divisions want to tie upthe company’s resources in inventory, then they shouldpay the company at least the interest it could beearning if the treasurer had the same amount of cash.”Be prepared to present your arguments.
4.21 Explain how making more products than can be sold ina period can increase the operating income of theorganization. Is this a sustainable tactic to increaseoperating income? Would this happen in a servicecompany, or is it only an issue in manufacturingcompanies? Explain.
[CMA Adapted]
4.22 Respond to this comment: “Your analysis of lastmonth’s financial performance demonstrates that itreally doesn’t matter whether we use throughput,variable, or full costing. All the costs are accountedfor; you have just put them in different places. I cannotsee what real difference this analysis makes. Isn’t thisjust a bean-counting exercise?”
4.23 Evaluate this criticism of financial management ofprocesses: “All this emphasis on operating income,regardless of how you measure it, contributes to ourcontinuing, short-term outlook. If we only focus onoperating income, managers will do whatever they canto increase that measure, regardless of long-termimpacts. This is what is wrong with modern business.We need to look beyond this period’s operating incomeand focus on the long-term.”
ExercisesCompute throughput product cost of goods sold, throughput, and operating income from the fol-lowing data for each month. Note the relationship between variable and indirect conversion costs.
Month 1 Month 2 Month 3
Beginning inventory units . . . . . . . . 0 0 100
Units produced . . . . . . . . . . . . . . . . 500 600 400
Units sold . . . . . . . . . . . . . . . . . . . . 500 500 500
Sales . . . . . . . . . . . . . . . . . . . . . . . $50,000 $50,000 $50,000
Material cost . . . . . . . . . . . . . . . . . . $10,000 $12,000 $ 8,000
Direct conversion cost used . . . . . . $12,000 $14,400 $ 9,600
Indirect conversion cost . . . . . . . . . $ 8,000 $ 5,600 $10,400
Indirect operating cost . . . . . . . . . . $16,000 $16,000 $16,000
Exercise 4.24Throughput Costing(LO 1)

Refer to the data in exercise 4.24. Compute variable cost of goods sold, contribution margin, andoperating income. Why is operating income different from one month to the next?
Refer to the data in exercise 4.24. Compute absorption cost of goods sold, gross margin, and oper-ating income. Why is operating income different from one month to the next?
Compute throughput cost of goods sold, throughput, and operating income from the following datafor each month. Note the relations between variable and indirect conversion and operating costs.
Month 1 Month 2 Month 3
Beginning inventory units . . . . . . . . . . . . . — — 150
Units produced . . . . . . . . . . . . . . . . . . . . . 1,750 1,900 1,600
Units sold . . . . . . . . . . . . . . . . . . . . . . . . . 1,750 1,750 1,750
Sales . . . . . . . . . . . . . . . . . . . . . . . . . . . . . $220,500 $220,500 $220,500
Material cost . . . . . . . . . . . . . . . . . . . . . . . 57,750 62,700 52,800
Direct conversion cost used . . . . . . . . . . . 49,000 53,200 44,800
Direct operating cost used . . . . . . . . . . . . 12,250 12,250 12,250
Indirect conversion costs . . . . . . . . . . . . . . 23,000 18,800 27,200
Indirect operating costs . . . . . . . . . . . . . . . 67,750 67,750 67,750
Refer to the data in exercise 4.27. Compute variable cost of goods sold, contribution margin, andoperating income. Why is operating income different from one month to the next?
Refer to the data in exercise 4.27. Compute absorption cost of goods sold, gross margin, and oper-ating income. Why is operating income different from one month to the next?
Compute throughput cost of goods sold, throughput, and operating income from the following datafor each month. Note the relation between variable and indirect conversion and operating costs.
Month 1 Month 2 Month 3
Beginning inventory units . . . . . . . . . . . . . — — 345
Units produced . . . . . . . . . . . . . . . . . . . . . 1,725 2,070 1,380
Units sold . . . . . . . . . . . . . . . . . . . . . . . . . 1,725 1,725 1,725
Sales . . . . . . . . . . . . . . . . . . . . . . . . . . . . . $232,875 $232,875 $232,875
Material cost . . . . . . . . . . . . . . . . . . . . . . . 82,800 99,360 66,240
Direct conversion cost used . . . . . . . . . . . 36,225 43,470 28,980
Direct operating cost used . . . . . . . . . . . . 18,975 18,975 18,975
Indirect conversion costs . . . . . . . . . . . . . . 32,775 25,530 40,020
Indirect operating costs . . . . . . . . . . . . . . . 36,225 36,225 36,225
Refer to the data in exercise 4.30. Compute variable cost of goods sold, contribution margin, andoperating income. Why is operating income different from one month to the next?
Refer to the data in exercise 4.30. Compute absorption cost of goods sold, gross margin, and oper-ating income. Why is operating income different from one month to the next?
ProblemsInteger Peripherals, Inc. is a manufacturer of computer data storage devices. Its Atlantic divisiondesigns and assembles the MicroDrive, designed for laptop computers. You have gathered the fol-lowing data for the MicroDrive for a recently completed month.
138 Part II Cost Measurement Systems
Exercise 4.25Variable Costing(LO 2)
Exercise 4.26Absorption Costing(LO 2)
Exercise 4.27Throughput Costing(LO 2)
Exercise 4.28Variable Costing(LO 3)
Exercise 4.29Absorption Costing(LO 4)
Exercise 4.30Throughput Costing(LO 1)
Exercise 4.31Variable CostingLO 2
Exercise 4.32Absorption CostingLO 3
Problem 4.33Production Costs(LO 1)
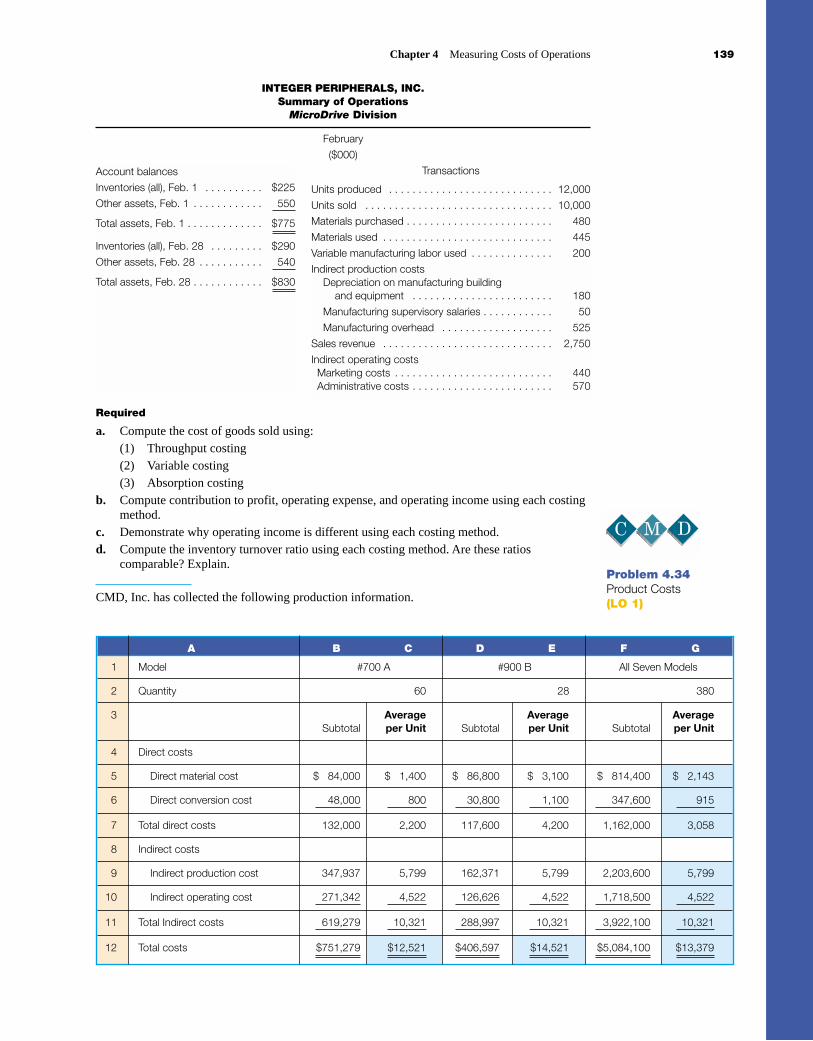
INTEGER PERIPHERALS, INC.Summary of Operations
MicroDrive Division
February
($000)
Transactions
Required
a. Compute the cost of goods sold using:(1) Throughput costing(2) Variable costing(3) Absorption costing
b. Compute contribution to profit, operating expense, and operating income using each costingmethod.
c. Demonstrate why operating income is different using each costing method.d. Compute the inventory turnover ratio using each costing method. Are these ratios
comparable? Explain.
CMD, Inc. has collected the following production information.
Chapter 4 Measuring Costs of Operations 139
Account balances
Inventories (all), Feb. 1 . . . . . . . . . . $225
Other assets, Feb. 1 . . . . . . . . . . . . 550
Total assets, Feb. 1 . . . . . . . . . . . . . $775
Inventories (all), Feb. 28 . . . . . . . . . $290
Other assets, Feb. 28 . . . . . . . . . . . 540
Total assets, Feb. 28 . . . . . . . . . . . . $830
Units produced . . . . . . . . . . . . . . . . . . . . . . . . . . . . 12,000
Units sold . . . . . . . . . . . . . . . . . . . . . . . . . . . . . . . . 10,000
Materials purchased . . . . . . . . . . . . . . . . . . . . . . . . . 480
Materials used . . . . . . . . . . . . . . . . . . . . . . . . . . . . . 445
Variable manufacturing labor used . . . . . . . . . . . . . . 200
Indirect production costsDepreciation on manufacturing building
and equipment . . . . . . . . . . . . . . . . . . . . . . . . 180
Manufacturing supervisory salaries . . . . . . . . . . . . 50
Manufacturing overhead . . . . . . . . . . . . . . . . . . . 525
Sales revenue . . . . . . . . . . . . . . . . . . . . . . . . . . . . . 2,750
Indirect operating costsMarketing costs . . . . . . . . . . . . . . . . . . . . . . . . . . . 440Administrative costs . . . . . . . . . . . . . . . . . . . . . . . . 570
Problem 4.34Product Costs(LO 1)
A B C D E F G
1 Model #700 A #900 B All Seven Models
2 Quantity 60 28 380
3 Average Average AverageSubtotal per Unit Subtotal per Unit Subtotal per Unit
4 Direct costs
5 Direct material cost $ 84,000 $ 1,400 $ 86,800 $ 3,100 $ 814,400 $ 2,143
6 Direct conversion cost 48,000 800 30,800 1,100 347,600 915
7 Total direct costs 132,000 2,200 117,600 4,200 1,162,000 3,058
8 Indirect costs
9 Indirect production cost 347,937 5,799 162,371 5,799 2,203,600 5,799
10 Indirect operating cost 271,342 4,522 126,626 4,522 1,718,500 4,522
11 Total Indirect costs 619,279 10,321 288,997 10,321 3,922,100 10,321
12 Total costs $751,279 $12,521 $406,597 $14,521 $5,084,100 $13,379

Required
a. Explain how changing the product mix (C2 and E2) from that in Exhibit 4–6 changes thehighlighted numbers in this spreadsheet from the corresponding numbers in Exhibit 4–6.
b. Calculate throughput cost, variable cost, and absorption cost for models #700A and #900B. c. Compare the costs in part “b” with those computed in Exhibit 4–6. Explain any differences.
Refer to the production information in the table for the previous problem and the additional salesinformation below.
Sales revenue . . . . . . . . . . . . . . . . . . . $6,400,000
Sales of Model 700A . . . . . . . . . . . . . 50 units
Sales of Model 900B . . . . . . . . . . . . . 20 units
Sales of five other models . . . . . . . . . . 270 units
Total . . . . . . . . . . . . . . . . . . . . . . . . 340 units
Required
a. Compute contribution to profit, operating expense, and operating income using(1) Throughput costing(2) Variable costing(3) Absorption costing
b. Explain the differences between each pair of operating income measures.
GPS, Inc., has collected the following information for production of its two products for a recentyear.
GPS, Inc., traces direct material to products produced. Though GPS pays its highly skilled workforceon a salary basis, the company traces direct conversion costs to products produced. GPS also tracesdirect operating costs, which is 40 percent packaging materials and 60 percent distribution labor toproducts sold. Conversion and operating costs in total (direct plus indirect) do not vary with units pro-duced. For financial reporting purposes, GPS allocates indirect conversion costs to products on anequal, per-unit basis. Untraced conversion and operating costs are expensed in the period.
140 Part II Cost Measurement Systems
Problem 4.35Operating Income(LO 2)
Problem 4.36Product Costs(LO 1)
A B C D E F G
1 Models 1500 XS 3000 XL Total
2 Quantities produced and sold 12,000 9,000 21,000
3 Direct costs Total Per Unit Total Per Unit Total Per Unit
4 Direct materials costs $185,444 $589,740 $36.91
5 Direct conversion costs 45,200 148,500 9.22
6 Direct operating costs 39,600 41,200 3.85
7 Total direct costs 270,244 779,440 $50.00*
8 Indirect costs
9 Indirect conversion costs $3,568,000
10 Indirect operating costs 2,789,000
11 Total indirect costs 6,357,000
12 Total cost $7,406,684
*rounded

Required
a. Fill in the highlighted, blank cells (Hint: Create a computer spreadsheet to solve thisproblem. Another hint: When you complete the spreadsheet, the highlighted cells shouldcontain formulas that reference appropriate numbers but should not contain any numberthemselves. For example, C4 � B4/B2).
b. Compute the following costs per unit for each product model:(1) Throughput cost(2) Variable cost(3) Absorption cost
c. Compute the effects on product costs in part “b” of changing the product mix to 12,000 unitsof each product produced and sold.
d. Is there anything wrong with the attitude, “The board of directors sets the incentive plan, andI am just playing by the rules. The rules don’t say anything about how many units I shouldproduce.” If managers are evaluated on annual, externally reported operating profit, ascomputed in part b(3) above, comment on the ethics of knowingly producing more units thancan be sold in a period.
Refer to the previous problem and the additional information below.
Model 1500XS Model 3000XL Total
Units produced . . . . . . . . . . . 12,000 9,000 21,000
Units sold . . . . . . . . . . . . . . . 11,000 8,000 19,000
Sales revenue . . . . . . . . . . . . $8,400,000
Required
a. Compute contribution to profit, operating expense, and operating income using:(1) Throughput costing(2) Variable costing(3) Absorption costing
b. Explain the differences between each pair of operating income measures.
Hathaway Company uses variable costing for internal management purposes and absorption cost-ing for external reporting purposes. Thus, at the end of each year, financial information must beconverted from variable costing to absorption costing for external reports. At the end of last year,management anticipated that sales would rise 20 percent this year. Therefore, production was in-creased from 20,000 units to 24,000 units. However, economic conditions kept sales volume at20,000 units for both years.
The following data pertain to the two years:
Last Year This Year
Selling price per unit . . . . . . . . . . . . . . . . . . . $ 60 $ 60Sales (units) . . . . . . . . . . . . . . . . . . . . . . . . . 20,000 20,000Beginning inventory (units) . . . . . . . . . . . . . . 2,000 2,000Production (units) . . . . . . . . . . . . . . . . . . . . . 20,000 24,000Ending inventory (units) . . . . . . . . . . . . . . . . 2,000 6,000Unapplied variable overhead . . . . . . . . . . . . $10,000 $8,000
Variable cost per unit for both years was composed of the following:
Conversion . . . . . . . . . . . . . . . . . $21
Materials . . . . . . . . . . . . . . . . . . . 9
Total . . . . . . . . . . . . . . . . . . . . $30
Indirect costs for each year follow:
Production . . . . . . . . . . . . . . . . . $600,000Selling and administrative . . . . . . 200,000
Total . . . . . . . . . . . . . . . . . . . . $800,000
Chapter 4 Measuring Costs of Operations 141
Problem 4.37Operating Income(LO 2)
Problem 4.38Conversion of Variableto Absorption Costing(LO 2)
Communication

Conversion costs are production costs that are traced directly to products as resources are used.Untraced indirect cost is expensed in the period. Absorption costing allocates indirect productioncosts per unit based on a denominator volume of 20,000 units for each year.
Required
Use the preceding data to complete the following:
a. Present the income statement for this year based on variable costing for this year.b. Present the income statement for this year based on absorption costing for this year.c. Write a short report to management that explains the difference, if any, in the operating
profit figures.
[CMA Adapted]
(This classic problem is based on an actual company’s experience.) Brassinni Company uses an ac-tual cost system to apply all production costs to units produced. The plant has a maximum produc-tion capacity of 40 million units, but only 10 million units were produced and sold during year 1.There were no beginning or ending inventories. Brassinni Company’s income statement for year 1follows:
BRASSINNI COMPANYIncome Statement
For the Year Ending December 31, Year 1
Sales (10,000,000 units at $6) . . . . . . . . . . . . . . . . . . . . . . . . . . . . . . $ 60,000,000Cost of goods soldDirect (10,000,000 at $2) . . . . . . . . . . . . . . . . $20,000,000Indirect . . . . . . . . . . . . . . . . . . . . . . . . . . . . . . 48,000,000 68,000,000
Gross margin . . . . . . . . . . . . . . . . . . . . . . . . . . . . . . . . . . . . . . . . . . . $ (8,000,000)Marketing and administrative costs . . . . . . . . . . . . . . . . . . . . . . . . . . 10,000,000
Operating profit (loss) . . . . . . . . . . . . . . . . . . . . . . . . . . . . . . . . . . . . . $(18,000,000)
The board of directors is concerned about the $18 million loss. A consultant approached theboard with the following offer: “I agree to become president for no fixed salary. But I insist on ayear-end bonus of 10 percent of operating profit (before considering the bonus).” The board of di-rectors agreed to these terms and hired the consultant.
The new president promptly stepped up production to an annual rate of 30 million units. Salesfor year 2 remained at 10 million units. The resulting Brassinni Company absorption costing in-come statement for year 2 follows:
BRASSINNI COMPANYIncome Statement
For the Year Ending December 31, Year 2
Sales (10,000,000 units at $6) . . . . . . . . . . . . . . . . . . . . . . . . . . . . . . $60,000,000Cost of goods soldCost of goods manufacturedDirect (30,000,000 at $2) . . . . . . . . . . . . . . . . . . . $60,000,000Indirect . . . . . . . . . . . . . . . . . . . . . . . . . . . . . . . . . 48,000,000
Total cost of goods manufactured . . . . . . . . . . . . 108,000,000Less ending inventory
Variable (20,000,000 at $2) . . . . . . . . . . . . . . . $40,000,000Indirect (20/30 � $48,000,000) . . . . . . . . . . . . 32,000,000
Total inventory . . . . . . . . . . . . . . . . . . . . . . . . . 72,000,000Cost of goods sold . . . . . . . . . . . . . . . . . . . . . . . . . . . . . . . . . . . . . . 36,000,000
Gross margin . . . . . . . . . . . . . . . . . . . . . . . . . . . . . . . . . . . . . . . . . . . 24,000,000Marketing and administrative costs . . . . . . . . . . . . . . . . . . . . . . . . . . 10,000,000
Operating profit before bonus . . . . . . . . . . . . . . . . . . . . . . . . . . . . . . 14,000,000Bonus . . . . . . . . . . . . . . . . . . . . . . . . . . . . . . . . . . . . . . . . . . . . . . . . 1,400,000
Operating profit after bonus . . . . . . . . . . . . . . . . . . . . . . . . . . . . . . . . $12,600,000
142 Part II Cost Measurement Systems
Problem 4.39Effect of Changes inProduction and CostingMethod on OperatingProfit(LO 3)
Communication

The day after the statement was verified, the president took his check for $1,400,000 and re-signed to take a job with another corporation. He remarked, “I enjoy challenges. Now thatBrassinni Company is in the black, I’d prefer tackling another challenging situation.” (His contractwith his new employer is similar to the one he had with Brassinni Company.)
Required
a. Write a report to Brassinni’s board of directors evaluating the year 2 performance.b. Using variable costing, what would operating profit be for year 1? For year 2? What are the
inventory values? (Assume that all marketing and administrative costs are committed andunchanged.) Compare those results with the preceding absorption statements.
Refer to the facts for problem 4.39. What would year 2’s operating profit (loss) be if Brassinni usedabsorption costing with an indirect manufacturing overhead rate of $4.80 � ($48,000,000 indirectmanufacturing costs � 10,000,000 estimated unit sales)?
Required
a. Prepare income statement using absorption costing and the $4.80 indirect cost per unit foryear 2
b. Prepare a chart to show how this income differs from that in the income statement ofproblem 4.39.
Tammari Enterprises released the following figures from its records for year 1 and year 2:
Year 1 Year 2
Sales units . . . . . . . . . . . . . . . . . . . . . . . . . . . . . . . . . . . . . . . . . . . . 250,000 250,000
Production units . . . . . . . . . . . . . . . . . . . . . . . . . . . . . . . . . . . . . . . . 250,000 344,000Selling price per unit . . . . . . . . . . . . . . . . . . . . . . . . . . . . . . . . . . . . . $40 $40Variable manufacturing cost per unit . . . . . . . . . . . . . . . . . . . . . . . . . $24 $24Annual committed manufacturing cost . . . . . . . . . . . . . . . . . . . . . . . $860,000 $860,000Variable marketing and administrative costs per unit sold . . . . . . . . . $2.40 $2.40Committed marketing and administrative costs . . . . . . . . . . . . . . . . $840,000 $840,000Beginning inventory . . . . . . . . . . . . . . . . . . . . . . . . . . . . . . . . . . . . . $0 ?
Required
a. Prepare income statements for both years using absorption costing.b. Prepare income statements for both years using variable costing.c. Comment on the different operating profit figures. Write a brief report explaining why the
operating profits are different, if they are.
Search the Internet for at least one example of an actual organization that uses throughput or vari-able costing (preferably not a university class or consultant’s homepage). (Hint: Begin by using asearch engine to find sites with the key words “variable cost,” “throughput,” “theory of con-straints,” or “goldratt,”) Prepare a memorandum to your instructor that describes:
a. The organization—its name, industry, size, profitability, strategy, etc.b. How the organization uses variable or throughput costingc. Any costs or benefits the organization discloses about using variable or throughput costing
The following questions are based on Larue Corporation, which produces a single product it sellsfor $12 per unit. Of the 100,000 units produced, 80,000 were sold during year 1; all ending inven-tory was in finished goods inventory. Larue had no inventory at the beginning of the year.
Direct materials (unit-level cost) . . . . . . . . . . . . . . . . . . . . . . . . $240,000
Direct labor (unit-level cost) . . . . . . . . . . . . . . . . . . . . . . . . . . . 160,000Factory overhead (unit-level cost) . . . . . . . . . . . . . . . . . . . . . . 80,000Factory overhead (capacity cost) . . . . . . . . . . . . . . . . . . . . . . . 240,000Marketing and administrative (unit-level cost) . . . . . . . . . . . . . 80,000Marketing and administrative (capacity cost) . . . . . . . . . . . . . . 128,000
Chapter 4 Measuring Costs of Operations 143
Problem 4.40Effect of Overhead Rate(LO 2)
Communication
Problem 4.41Comparison of Variableand Full-AbsorptionCosting: Analyzing ProfitPerformance(LO 3)
Problem 4.42Internet Search(LO 1)
Problem 4.43Comparison of Variableand Absorption Costing(LO 1)
Communication
Technology

Required
a. In presenting inventory on the balance sheet at December 31, what is the unit cost underabsorption costing?
b. In presenting inventory on a variable costing balance sheet, what is the unit cost?c. What is the operating profit using variable costing?d. What is the operating profit using absorption costing?e. What is the ending inventory using absorption costing?f. What is the ending inventory under variable costing?
[CPA Adapted]
CasesThe New & Used Bookstore* is located near campus. Martha Williams, a part-time student em-ployee, noticed that the managers at the bookstore seemed unconcerned about the costs of carryinglarge inventories. For example, several times a year the manager of the general merchandise de-partment (one of six departments) would buy large quantities of merchandise (clothing, gift items,etc.) with the university and sports team logos in order to get quantity discounts. The general mer-chandise manager also had argued successfully for more warehouse space for his merchandise, forwhich the bookstore pays rent. Inevitably several months later, the manager would mark down theunsold merchandise to purchase cost or less in order to make room for the next purchase. Thisseemed very inefficient to Martha, and she began to analyze the bookstore’s purchases and sales forthe past year. Martha gathered the following data.
Average Numberof Days Items
Percent of Were PurchasedCost of Goods Average Warehouse in Advance
Department Sold Inventory Space of Sale
New books . . . . . . . . . . . . $ 5,730,972 $ 840,475 25% 63
Used books . . . . . . . . . . . . 1,258,007 180,600 12 37
Reference books . . . . . . . . 563,686 370,500 10 86
Supplies . . . . . . . . . . . . . . 662,560 251,700 8 71
General merchandise . . . . . 883,251 640,600 25 94
Computers . . . . . . . . . . . . 2,246,600 402,000 20 28
Total store . . . . . . . . . . . . . $11,345,076 $2,585,275 100% 66.3
Required
a. Compute inventory turnover ratios for each department and the bookstore as a whole. Whatwould these ratios tell Williams about the management of inventories at the New & UsedBookstore? Is it reasonable to compare these ratios across departments? Why or why not?
b. Another store in the university area sells licensed (general) merchandise with the university’slogo and reported to Williams that its inventory turnover ratio for the past year was 5.30. Isthat a legitimate benchmark for the New & Used Bookstore? Why or why not?
c. What are the benefits and costs to the New & Used Bookstore of its current methods forpurchasing and inventory?
d. What information would Williams need to place a dollar figure on all of those costs?e. Williams has learned that the manager of the General Merchandise Department is a close
personal friend of the bookstore manager and receives incentive prizes from suppliers forordering large quantities of merchandise. What are Martha’s ethical responsibilities?
*This is a more complex version of Problem 3.29.
144 Part II Cost Measurement Systems
CasesCase 4.44Inventory Turnover(LO 1)
Ethics

Cotierre imports designer clothing that subcontractors in Mexico manufacture. Clothing is a sea-sonal product. The goods must be ready for sale prior to the start of the season. Any goods left overat the end of the season must usually be sold at steep discounts. The company prepares a dress de-sign and selects fabrics approximately six months before a given season. It receives these goodsand distributes them at the start of the season. Based on past experience, the company estimatesthat 60 percent of a particular lot of dresses will be unsold at the end of the season and are markeddown to one-half of the initial retail price. Even with the markdown, a substantial number ofdresses remain unsold. They are returned to Cotierre and destroyed. Even though a large number ofdresses must be discounted or destroyed, the company needs to place a minimum order of 1,000dresses to have a sufficient selection of styles and sizes to market the design.
Recently, the company placed an order for 1,000 dresses of a particular design for $25,000plus import duties of $5,000 and a $7 commission for each dress sold at retail, regardless of theprice. Return mailing and disposing of each unsold dress cost $3 after the end of the markdownperiod.
Required
a. Use absorption costing to compute the cost of each dress in this lot of dresses.b. Suppose that the company sells 30 percent of the dresses in this lot for $75 each during the
first accounting period. Using absorption costing, what is the value of the ending inventory?What is the operating profit or loss for the period, assuming no other transactions and thatthe season has not ended, so that the number of dresses subject to markdown or to bereturned is unknown?
c. During the second period, 10 percent of the 1,000 dresses were sold at full price and 30percent were sold at the half-price markdown. The remaining dresses were returned anddisposed of. Using absorption costing, what is the operating profit or loss for the period,assuming no other transactions?
d. Suggest a method of accounting for these dresses that would more closely relate revenuesand costs.
Chapter 4 Measuring Costs of Operations 145
Case 4.45Absorption and VariableCosting ImportingDecisions(LO 3)