Embed Size (px)
Citation preview
IGNITION DELAY TIMES OF NATURAL GAS/HYDROGEN BLENDS
AT ELEVATED PRESSURES
A Thesis
by
MARISSA LYNN BROWER
Submitted to the Office of Graduate Studies of Texas A&M University
in partial fulfillment of the requirements for the degree of
MASTER OF SCIENCE
August 2012
Major Subject: Mechanical Engineering

Ignition Delay Times of Natural Gas/Hydrogen Blends at Elevated Pressures
Copyright 2012 Marissa Lynn Brower
IGNITION DELAY TIMES OF NATURAL GAS/HYDROGEN BLENDS
AT ELEVATED PRESSURES
A Thesis
by
MARISSA LYNN BROWER
Submitted to the Office of Graduate Studies of Texas A&M University
in partial fulfillment of the requirements for the degree of
MASTER OF SCIENCE
Approved by:
Chair of Committee, Eric Petersen Committee Members, Rodney Bowersox Felix Güthe David Staack Head of Department, Jerald Caton
August 2012
Major Subject: Mechanical Engineering

iii
ABSTRACT
Ignition Delay Times of Natural Gas/Hydrogen Blends
at Elevated Pressures. (August 2012)
Marissa Lynn Brower, B.S., Rice University
Chair of Advisory Committee: Dr. Eric L. Petersen
Applications of natural gases that contain high levels of hydrogen have become a
primary interest in the gas turbine market. For reheat gas turbines, understanding of the
ignition delay times of high-hydrogen natural gases is important for two reasons. First,
if the ignition delay time is too short, autoignition can occur in the mixer before the
primary combustor. Second, the flame in the secondary burner is stabilized by the
ignition delay time of the fuel. While the ignition delay times of hydrogen and of the
individual hydrocarbons in natural gases can be considered well known, there have been
few previous experimental studies into the effects of different levels of hydrogen on the
ignition delay times of natural gases at gas turbine conditions.
In order to examine the effects of hydrogen content at gas turbine conditions, shock-
tube experiments were performed on nine combinations of an L9 matrix. The L9 matrix
was developed by varying four factors: natural gas higher-order hydrocarbon content of
0, 18.75, or 37.5%; hydrogen content of the total fuel mixture of 30, 60, or 80%;
equivalence ratios of 0.3, 0.5, or 1; and pressures of 1, 10, or 30 atm. Temperatures
ranged from 1092 K to 1722 K, and all mixtures were diluted in 90% Ar. Correlations

iv
for each combination were developed from the ignition delay times and, using these
correlations, a factor sensitivity analysis was performed. It was found that hydrogen
played the most significant role in ignition delay time. Pressure was almost as important
as hydrogen content, especially as temperature increased. Equivalence ratio was slightly
more important than hydrocarbon content of the natural gas, but both were less
important than pressure or hydrogen content.
Further analysis was performed using ignition delay time calculations for the full matrix
of combinations (27 combinations for each natural gas) using a detailed chemical
kinetics mechanism. Using these calculations, separate L9 matrices were developed for
each natural gas. Correlations from the full matrix and the L9 matrix for each natural
gas were found to be almost identical in each case, verifying that a thoughtfully
prepared L9 matrix can indeed capture the major effects of an extended matrix.

v
DEDICATION
I would like to dedicate this thesis to three people: my fiancé and my parents. My
fiancé, Matthew Davis, has been with me for the last five years and I will be forever
grateful for his constant support and for listening to my complaints. My parents, Mike
and Carolyn Brower, have encouraged me throughout both my degrees and I know that I
would not be the person I am today without their guidance and help.

vi
ACKNOWLEDGMENTS
I would first like to thank my advisor and Committee Chair, Dr. Eric Petersen, for his
guidance and understanding over the last two years. He has provided opportunities and
experiences that have helped me academically as well as personally. I would like to
thank Dr. Felix Güthe for his guidance during my internship at Alstom in Switzerland
and for serving as a committee member. I would also like to thank Dr. Bowersox and
Dr. Staack for serving as committee members.
Finally, I would like to thank all of my coworkers throughout the last two years.
Without their support, this work would not have been possible. Specifically, I would
like to thank Dr. Olivier Mathieu, Madeleine Kopp, and C. J. Aul for their help on the
shock tube.

vii
NOMENCLATURE
Variables
τign Ignition delay time
𝐴 Ignition delay time correlation constant
E Activation energy (kcal/mol-cm3)
R Ideal gas constant
v, w, x, y, z Ignition delay time correlation exponents
R2 Coefficient of multiple determination for correlations
[i] Concentration of species i (mol/cm3)
xi Mole fraction of species i (mol/cm3)
P Pressure (atm)
T Temperature (K)
φ Equivalence ratio
Abbreviations
C2+ Hydrocarbons with more than 2 carbon atoms
NG Natural Gas
HC Hydrocarbon
NG2 Synthetic natural gas 2, described in Table 1
NG3 Synthetic natural gas 3, described in Table 1
viii
TABLE OF CONTENTS
Page
ABSTRACT ..................................................................................................................... iii DEDICATION ................................................................................................................... v ACKNOWLEDGMENTS ................................................................................................. vi NOMENCLATURE .........................................................................................................vii TABLE OF CONTENTS ............................................................................................... viii LIST OF FIGURES ............................................................................................................ x LIST OF TABLES .......................................................................................................... xvi CHAPTER I INTRODUCTION ............................................................................................... 1 II BACKGROUND ................................................................................................. 4
2.1 Gas Turbines ........................................................................................ 4 2.2 Natural Gas Ignition Delay Time ......................................................... 6 2.3 Hydrogen Ignition Delay Time .......................................................... 12 2.4 Natural Gas/Hydrogen Mixture Ignition Delay Time ........................ 15
III EXPERIMENTAL SETUP ............................................................................... 21
3.1 Shock-Tube Facility ........................................................................... 21 3.2 Experimental Uncertainty .................................................................. 26 3.3 Chemical Kinetics Model ................................................................... 27 3.4 Experimental Matrix .......................................................................... 28
IV RESULTS .......................................................................................................... 31 V DISCUSSION ................................................................................................... 44
5.1 Experimental Correlations .................................................................. 44 5.2 L9 Matrix Factor Sensitivity .............................................................. 68 5.3 Full Matrix Calculations ..................................................................... 71

ix
VI CONCLUSION ................................................................................................. 96 REFERENCES ................................................................................................................. 99 APPENDIX .................................................................................................................... 103

x
LIST OF FIGURES
Page
Figure 1 Brayton cycle for conventional combustion and the Brayton reheat cycle for sequential combustion. From Güthe et al. (2009). ........................... 4
Figure 2 Ignition delay time of stoichiometric hydrogen at various pressures. Adapted from Brower et al. (2012). .............................................................. 13
Figure 3 Ignition delay times of methane and NG2 with 0 to 100% hydrogen addition at an inlet temperature of 1100 K and an equivalence ratio of 0.7. From Brower et al. (2012). .................................................................... 19
Figure 4 Ignition delay time of mixtures of methane and NG2, plotted as a function of hydrogen mole fraction. Values are normalized to the ignition delay time of pure NG2 at each pressure. From Brower et al. (2012). ........................................................................................................... 20
Figure 5 Schematic drawing of high-pressure shock-tube facility from Aul (2009). ........................................................................................................... 21
Figure 6 Ignition delay time measurement from endwall pressure signal. Experiment shown was performed mixture of NG3 and 30% H2 with an equivalence ratio of 1 at conditions of 9.6 atm and 1199 K. ................... 24
Figure 7 Ignition delay time measurement from OH* emission signal. Experiment shown was performed mixture of CH4 and 30% H2 with an equivalence ratio of 0.3 at conditions of 1.5 atm and 1645 K. ................ 25
Figure 8 Ignition delay time measurement from Galway OH* prediction. Prediction shown was performed with a mixture of CH4 and 30% H2 with an equivalence ratio of 0.3 at conditions of 1.5 atm and 1645 K. ........ 28
Figure 9 Ignition delay times of 30% H2 added to pure methane with an equivalence ratio of 0.3 at a pressure of 1 atm are shown. Galway model predictions are also plotted against the data as a line. ....................... 32
Figure 10 Ignition delay times of 60% hydrogen added to pure methane with an equivalence ratio of 0.5 at a pressure of 10 atm are shown. Galway model predictions are also plotted against the data as a line. ....................... 33
Figure 11 Ignition delay times of 80% hydrogen added to pure methane with an equivalence ratio of 1 at a pressure of 30 atm are shown. Galway model predictions are also plotted against the data as a line. ....................... 34
xi
Figure 12 Ignition delay times from the CH4-based combinations 1 through 3 are plotted as a function of the inverse of the temperature. Galway models for each combination are plotted as lines. ........................................ 35
Figure 13 Ignition delay times of 30% hydrogen added to NG2 with an equivalence ratio of 0.5 at a pressure of 30 atm are shown. Galway model predictions are also plotted against the data as a line. ....................... 36
Figure 14 Ignition delay times of 60% hydrogen added to NG2 with an equivalence ratio of 1 at a pressure of 1 atm are shown. Galway model predictions are also plotted against the data as a line. ....................... 37
Figure 15 Ignition delay times of 80% hydrogen added to NG2 with an equivalence ratio of 0.3 at a pressure of 10 atm are shown. Galway model predictions are also plotted against the data as a line. ....................... 38
Figure 16 Ignition delay times from NG2-based combinations 4 through 6 are plotted as a function of the inverse of temperature. Galway models for each combination are plotted as lines. .......................................................... 39
Figure 17 Ignition delay times for 30% hydrogen added to NG3 with an equivalence ratio of 1 at a pressure of 10 atm are shown. Galway model predictions are also plotted against the data as a line. ....................... 40
Figure 18 Ignition delay times of 60% hydrogen added to NG3 with an equivalence ratio of 0.3 at a pressure of 30 atm are shown. Galway model predictions are also plotted against the data as a line. ....................... 41
Figure 19 Ignition delay times of 80% hydrogen added to NG3 with an equivalence ratio of 0.5 at a pressure of 1 atm are shown. Galway model predictions are also plotted against the data as a line. ....................... 42
Figure 20 Ignition delay times from NG3-based combinations 7 through 9 are plotted as a function of the inverse of temperature. Galway models for each combination are plotted as lines. .......................................................... 43
Figure 21 Combination 1 data compared to the Galway model, the correlation for combination 1, and the correlation for combinations 1 through 3. ......... 49
Figure 22 Combination 2 data compared to the Galway model, the correlation for combination 2, and the correlation for combinations 1 through 3. ......... 50
Figure 23 Combination 3 data compared to the Galway model, the correlation for combination 3, and the correlation for combinations 1 through 3. ......... 51

xii
Figure 24 Combination 4 data compared to the Galway model, the correlation for combination 4, and the correlation for combinations 4 through 6. ......... 54
Figure 25 Combination 5 data compared to the Galway model, the correlation for combination 5, and the correlation for combinations 4 through 6. ......... 55
Figure 26 Combination 6 data compared to the Galway model, the correlation for combination 6, and the correlation for combinations 4 through 6. ......... 56
Figure 27 Combination 7 data compared to the Galway model, the correlation for combination 7, and the correlation for combinations 7 through 9. ......... 59
Figure 28 Combination 8 data compared to the Galway model, the correlation for combination 8, and the correlation for combinations 7 through 9. ......... 60
Figure 29 Combination 9 data compared to the Galway model, the correlation for combination 9, and the correlation for combinations 7 through 9. ......... 61
Figure 30 Comparison of the experimental data from all 9 experimental combinations to the predictions from the correlation developed using Eqn. 7. The predicted data are plotted as a function of the real data values with a 1 to 1 line. ............................................................................... 63
Figure 31 Comparison of the experimental data from all 9 experimental combinations to the predictions from the correlation developed using Eqn. 8. The predicted data are plotted as a function of the real data values with a 1 to 1 line. ............................................................................... 65
Figure 32 Comparison of the experimental data from all 9 experimental combinations to the predictions from the correlation developed using Eqn. 9. The predicted data are plotted as a function of the real data values with a 1 to 1 line. ............................................................................... 67
Figure 33 Factor sensitivity of the L9 matrix at four temperatures (1100 K, 1150 K, 1200 K, and 1250 K) for the four factors of the matrix (C2+ content of the natural gas, H2 content of the fuel, equivalence ratio, and pressure). ....................................................................................................... 71
Figure 34 Comparison of the data used in the methane L9 matrix to the full matrix correlation. The predicted data are plotted as a function of the real data values with a 1 to 1 line.................................................................. 77
Figure 35 Comparison of the data used in the methane L9 matrix to the methane L9 matrix correlation. The predicted data are plotted as a function of the real data values with a 1 to 1 line. ........................................................... 78
xiii
Figure 36 Comparison of the data used in the full matrix to the methane full matrix correlation. The predicted data are plotted as a function of the real data values with a 1 to 1 line.................................................................. 78
Figure 37 Comparison of the data used in the full matrix to the methane L9 matrix correlation. The predicted data are plotted as a function of the real data values with a 1 to 1 line.................................................................. 79
Figure 38 Factor sensitivity of the methane L9 matrix at four temperatures (1100 K, 1150 K, 1200 K, and 1250 K) for the three factors of the matrix (H2 content of the fuel, equivalence ratio, and pressure). ................. 81
Figure 39 Comparison of the data used in the NG2 L9 matrix to the full matrix correlation. The predicted data are plotted as a function of the real data values with a 1 to 1 line......................................................................... 85
Figure 40 Comparison of the data used in the NG2 L9 matrix to the NG2 L9 matrix correlation. The predicted data are plotted as a function of the real data values with a 1 to 1 line.................................................................. 85
Figure 41 Comparison of the data used in the full matrix to the NG2 full matrix correlation. The predicted data are plotted as a function of the real data values with a 1 to 1 line......................................................................... 86
Figure 42 Comparison of the data used in the full matrix to the NG2 L9 matrix correlation. The predicted data are plotted as a function of the real data values with a 1 to 1 line......................................................................... 86
Figure 43 Factor sensitivity of the NG2 L9 matrix at four temperatures (1100 K, 1150 K, 1200 K, and 1250 K) for the three factors of the matrix (H2 content of the fuel, equivalence ratio, and pressure). ................................... 88
Figure 44 Comparison of the data used in the NG3 L9 matrix to the full matrix correlation. The predicted data are plotted as a function of the real data values with a 1 to 1 line......................................................................... 92
Figure 45 Comparison of the data used in the NG3 L9 matrix to the NG3 L9 matrix correlation. The predicted data are plotted as a function of the real data values with a 1 to 1 line.................................................................. 92
Figure 46 Comparison of the data used in the full matrix to the NG3 full matrix correlation. The predicted data are plotted as a function of the real data values with a 1 to 1 line......................................................................... 93
xiv
Figure 47 Comparison of the data used in the full matrix to the NG3 L9 matrix correlation. The predicted data are plotted as a function of the real data values with a 1 to 1 line......................................................................... 93
Figure 48 Factor sensitivity of the NG3 L9 matrix at four temperatures (1100 K, 1150 K, 1200 K, and 1250 K) for the three factors of the matrix (H2 content of the fuel, equivalence ratio, and pressure). ................................... 95
Figure 49 Comparison of combination 1 data to the combination 1 correlation. The predicted data are plotted as a function of the real data values with a 1 to 1 line. ........................................................................................ 107
Figure 50 Comparison of combination 2 data to the combination 2 correlation. The predicted data are plotted as a function of the real data values with a 1 to 1 line. ........................................................................................ 108
Figure 51 Comparison of combination 3 data to the combination 3 correlation. The predicted data are plotted as a function of the real data values with a 1 to 1 line. ........................................................................................ 108
Figure 52 Comparison of the data from combinations 1, 2 and 3 to the correlation for combinations 1, 2 and 3. The predicted data are plotted as a function of the real data values with a 1 to 1 line. ............................... 109
Figure 53 Comparison of combination 4 data to the combination 4 correlation. The predicted data are plotted as a function of the real data values with a 1 to 1 line. ........................................................................................ 109
Figure 54 Comparison of combination 5 data to the combination 5 correlation. The predicted data are plotted as a function of the real data values with a 1 to 1 line. ........................................................................................ 110
Figure 55 Comparison of combination 6 data to the combination 6 correlation. The predicted data are plotted as a function of the real data values with a 1 to 1 line. ........................................................................................ 110
Figure 56 Comparison of the data from combinations 4, 5, and 6 to the correlation for combinations 4, 5, and 6. The predicted data are plotted as a function of the real data values with a 1 to 1 line. ................... 111
Figure 57 Comparison of combination 7 data to the combination 7 correlation. The predicted data are plotted as a function of the real data values with a 1 to 1 line. ........................................................................................ 111

xv
Figure 58 Comparison of combination 8 data to the combination 8 correlation. The predicted data are plotted as a function of the real data values with a 1 to 1 line. ........................................................................................ 112
Figure 59 Comparison of combination 9 data to the combination 9 correlation. The predicted data are plotted as a function of the real data values with a 1 to 1 line. ........................................................................................ 112
Figure 60 Comparison of the data from combinations 7, 8, and 9 to the correlation for combinations 7, 8, and 9. The predicted data are plotted as a function of the real data values with a 1 to 1 line. ................... 113

xvi
LIST OF TABLES
Page
Table 1 Composition of two synthetic natural gases, in volume percent. ................... 12
Table 2 L9 test matrix developed using the Taguchi method for balanced, orthogonal arrays. Three levels of each factor were used. ............................. 30
Table 3 Correlation constants and activation energies found for correlations of combinations 1 through 3 individually. .......................................................... 46
Table 4 Correlation for combinations 1 through 3. ..................................................... 46
Table 5 Correlation for combinations 1 through 3 utilizing Eqn. 6. ........................... 47
Table 6 Correlation constants and activation energies found for correlations of combinations 4 through 6 individually. .......................................................... 52
Table 7 Correlation for combinations 4 through 6 using Eqn. 5. ................................ 52
Table 8 Correlation constants and activation energies found for correlations of combinations 7 through 9 individually. .......................................................... 57
Table 9 Correlation for combinations 7 through 9 using Eqn. 5. ................................ 57
Table 10 First correlation attempt using Eqn. 7 for all 9 combinations in the experimental matrix. ....................................................................................... 62
Table 11 Second correlation attempt using Eqn. 8 for all 9 combinations in the experimental matrix. ....................................................................................... 64
Table 12 Third correlation attempt using Eqn. 9 for all 9 combinations in the experimental matrix. ....................................................................................... 66
Table 13 Full matrix calculations performed for each natural gas (NG), methane, NG2, and NG3. ............................................................................... 73
Table 14 Correlation coefficients for a correlation developed from the full matrix calculations for methane. .................................................................... 74
Table 15 L9 Matrix for methane. .................................................................................. 74
Table 16 Correlation coefficients for a correlation developed from the L9 matrix for methane. .................................................................................................... 75

xvii
Table 17 Correlations for individual combinations of the methane L9 matrix. ............ 80
Table 18 Correlation coefficients for a correlation developed from the full matrix calculations for NG2. .......................................................................... 82
Table 19 L9 Matrix for NG2. ........................................................................................ 82
Table 20 Correlation coefficients for a correlation developed from the L9 matrix for NG2. ......................................................................................................... 82
Table 21 Correlations for individual combinations of the NG2 L9 matrix. .................. 87
Table 22 Correlation coefficients for a correlation developed from the full matrix calculations for NG3. .......................................................................... 89
Table 23 L9 Matrix for NG3. ........................................................................................ 89
Table 24 Correlation coefficients for a correlation developed from the L9 matrix for NG3. ......................................................................................................... 89
Table 25 Correlations for individual combinations of the NG3 L9 matrix. .................. 94
Table 26 Experimental data and conditions for combination 1. .................................. 103
Table 27 Experimental data and conditions for combination 2. .................................. 103
Table 28 Experimental data and conditions for combination 3. .................................. 104
Table 29 Experimental data and conditions for combination 4. .................................. 104
Table 30 Experimental data and conditions for combination 5. .................................. 105
Table 31 Experimental data and conditions for combination 6. .................................. 105
Table 32 Experimental data and conditions for combination 7. .................................. 106
Table 33 Experimental data and conditions for combination 8. .................................. 106
Table 34 Experimental data and conditions for combination 9. .................................. 107
1
CHAPTER I
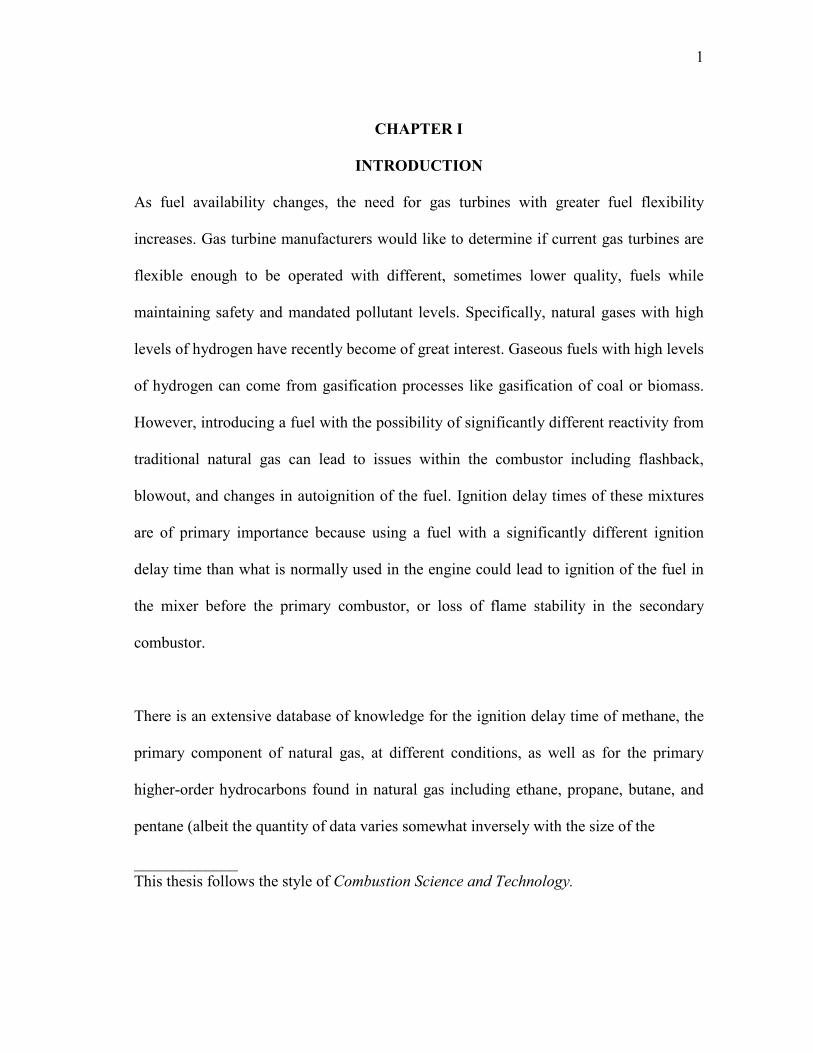
INTRODUCTION
As fuel availability changes, the need for gas turbines with greater fuel flexibility
increases. Gas turbine manufacturers would like to determine if current gas turbines are
flexible enough to be operated with different, sometimes lower quality, fuels while
maintaining safety and mandated pollutant levels. Specifically, natural gases with high
levels of hydrogen have recently become of great interest. Gaseous fuels with high levels
of hydrogen can come from gasification processes like gasification of coal or biomass.
However, introducing a fuel with the possibility of significantly different reactivity from
traditional natural gas can lead to issues within the combustor including flashback,
blowout, and changes in autoignition of the fuel. Ignition delay times of these mixtures
are of primary importance because using a fuel with a significantly different ignition
delay time than what is normally used in the engine could lead to ignition of the fuel in
the mixer before the primary combustor, or loss of flame stability in the secondary
combustor.
There is an extensive database of knowledge for the ignition delay time of methane, the
primary component of natural gas, at different conditions, as well as for the primary
higher-order hydrocarbons found in natural gas including ethane, propane, butane, and
pentane (albeit the quantity of data varies somewhat inversely with the size of the
_____________ This thesis follows the style of Combustion Science and Technology.
2
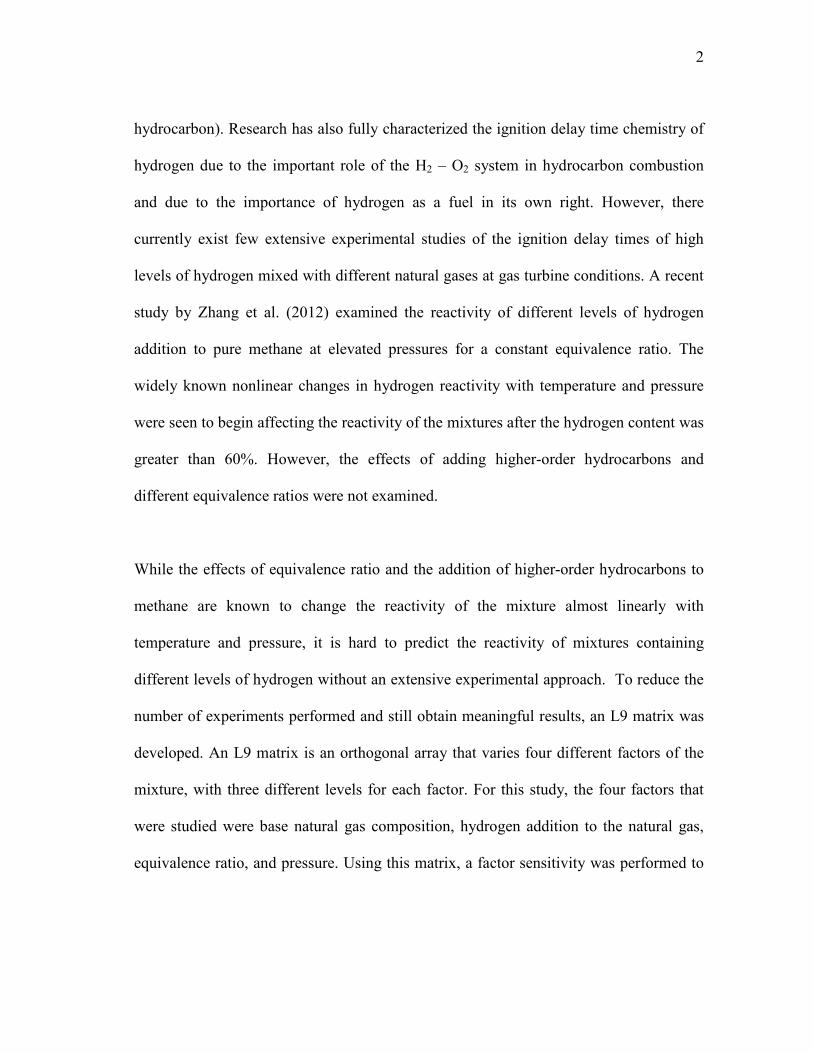
hydrocarbon). Research has also fully characterized the ignition delay time chemistry of
hydrogen due to the important role of the H2 – O2 system in hydrocarbon combustion
and due to the importance of hydrogen as a fuel in its own right. However, there
currently exist few extensive experimental studies of the ignition delay times of high
levels of hydrogen mixed with different natural gases at gas turbine conditions. A recent
study by Zhang et al. (2012) examined the reactivity of different levels of hydrogen
addition to pure methane at elevated pressures for a constant equivalence ratio. The
widely known nonlinear changes in hydrogen reactivity with temperature and pressure
were seen to begin affecting the reactivity of the mixtures after the hydrogen content was
greater than 60%. However, the effects of adding higher-order hydrocarbons and
different equivalence ratios were not examined.
While the effects of equivalence ratio and the addition of higher-order hydrocarbons to
methane are known to change the reactivity of the mixture almost linearly with
temperature and pressure, it is hard to predict the reactivity of mixtures containing
different levels of hydrogen without an extensive experimental approach. To reduce the
number of experiments performed and still obtain meaningful results, an L9 matrix was
developed. An L9 matrix is an orthogonal array that varies four different factors of the
mixture, with three different levels for each factor. For this study, the four factors that
were studied were base natural gas composition, hydrogen addition to the natural gas,
equivalence ratio, and pressure. Using this matrix, a factor sensitivity was performed to

3
show the relative effects of each of the four factors. The details of this approach and the
results of the study form the basis of the present thesis.
This thesis is organized into separate chapters. Chapter II provides further background
on relevant gas turbine technology as well as the current knowledge of ignition delay
times for the mixture components and conditions of this study. Chapter III details the L9
matrix and the experimental apparatus used for all experiments. The experimental results
are shown in Chapter IV and compared to a highly validated chemical kinetics
mechanism. Further discussion of the results is provided in Chapter V, including
correlations developed from the experimental data and a factor sensitivity analysis.
Additionally, calculations for all possible combinations for the conditions of the study
were performed, and correlations are presented to show the effect of using a reduced L9
matrix for each natural gas. Finally, in Chapter VI, a brief conclusion and
recommendations for further experiments are provided.

4
CHAPTER II
BACKGROUND
2.1 Gas Turbines
One of the largest markets for natural gas is the power generation gas turbine industry.
In recent years, improvements in technology have led to the development of sequential
combustion gas turbines based on the Brayton reheat cycle (Güthe et al., 2009). In
Figure 1, the Brayton cycle for conventional combustion is shown next to the Brayton
reheat cycle for sequential combustion. Gas turbines that employ sequential combustion
first heat compressed air in the primary combustor and then send the air through a high-
pressure turbine. Work is extracted from this first turbine process and then additional
fuel is mixed with the air in the second combustion chamber. Combustion is again
employed to raise the temperature of the gases. The gases are then sent through a low-
pressure turbine and expanded a second time to extract additional work.
Figure 1 Brayton cycle for conventional combustion and the Brayton reheat cycle for sequential combustion. From Güthe et al. (2009).

5
Alstom has developed two similar sequential combustion gas turbines, the GT24 and
GT26, in order to utilize the reheat concept to provide greater fuel flexibility, higher
efficiency, and lower emissions (Güthe et al., 2009). Both of these turbines incorporate a
primary annular combustor for the first combustion stage and a secondary, sequential
burner for the second combustion stage.
Reactivity of the fuel used in a combustor of a gas turbine can play a large role in the
performance, durability, and emissions of the turbine (Lieuwen et al., 2008). For a reheat
gas turbine, the effects of reactivity changes have to be considered for both the primary
burner and the secondary burner. In the primary burner, the main concerns are flash back
and blowout. Both of these problems occur due to the changes in the laminar flame
speed, causing the flame to move either too far upstream or to extinguish itself.
Additionally, the ignition delay time of the fuel has to be longer than the residence time
of the fuel in the mixer before the primary combustor to avoid autoignition of the fuel in
the mixer.
For the secondary burner, flame stabilization is based on the ignition delay time of the
fuel because higher inlet temperatures decrease the ignition delay time of the fuel (Güthe
et al. 2009). The inlet temperature of the secondary burner is determined by the exit
conditions of the high-pressure turbine, which is in effect controlled by the flame
temperature in the primary burner. This dependence on flame temperature causes the
6
secondary burner inlet temperature to be almost a factor of two higher than the inlet
temperature of the primary burner.
In industrial gas turbines, the combustion process often occurs at very high pressures and
temperatures. Conditions in the combustors vary depending on the gas turbine, its
purpose, and, in a reheat gas turbine, whether the combustor is the primary or secondary
combustor. Specifically, for reheat engines like the Alstom GT24/GT26, relevant
pressures can range from 1 to 30 atm, primary burner inlet temperatures from 700 to 800
K, and secondary inlet temperatures from 1100 K to 1300 K. Flame temperatures
typically vary from 1600 to 2200 K and depend mostly on the desired equivalence ratio
of the fuel-air mixture (Brower et al., 2012). This large array of relevant conditions
drives the need for wide-ranging reactivity studies.
2.2 Natural Gas Ignition Delay Time
Natural gas is mainly composed of methane with varying levels of higher-order
hydrocarbons, typically ethane, propane, butane, and pentane. The exact composition of
a certain natural gas depends on both the geographic location from where it is extracted
and the season during which it is extracted (de Vries and Petersen, 2007). Therefore, it is
important to understand the ignition delay time behavior of each constituent and the
effect of different levels of a constituent in a natural gas mixture.

7
For most natural gases, ethane and propane are more than 1% by volume, and butane and
pentane are less than 1% by volume (Spadaccini and Colket, 1994). Although methane
usually comprises at least 80% of the total volume of the fuel mixture, small levels of
higher-order hydrocarbons can dramatically change the ignition delay time of the fuel.
This dramatic effect on reactivity is due to the chemical bonding in hydrocarbons.
Methane consists of primary carbon-hydrogen bonds which are stronger than the
secondary and tertiary bonds in higher-order hydrocarbons. This difference in bond
energies allows the decomposition of higher-order hydrocarbons to occur more rapidly
than methane. Additionally, decomposition of methane forms methyl, which is a more-
stable radical than the radicals formed from the decomposition of higher-order
hydrocarbons (Spadaccini and Colket, 1994). Therefore, even after radicals are formed
from methane, the time required to break subsequent bonds is longer. Ignition delay time
is dependent on the time it takes to produce intermediate species, which then rapidly
react to form products (Turns, 2000) Therefore, because the bonds of the higher-order
hydrocarbons are easier to break, intermediate species are easier to form, and ignition of
the fuel occurs with a shorter delay time.
The ignition delay times of each individual hydrocarbon (C1-C5) have been extensively
studied. However, the primary focus of this section is the affect that addition of higher-
order hydrocarbons has on methane combustion. Mixtures of methane with higher-order
hydrocarbons have been studied at a wide range of equivalence ratio, pressure, and

8
temperature. Most studies have primarily focused on developing correlations for ignition
delay time of the form of Eqn. 1.
𝜏𝑖𝑔𝑛 = 𝐴[𝐻𝐶]𝑥[𝑂2]𝑦𝑒𝑥𝑝 � 𝐸𝑅𝑇� (1)
Here, A is an empirically determined correlation constant, x and y are empirically
determined correlation exponents, E is the activation energy, R is the universal gas
constant in kcal/K-mol, and T is the temperature in K. The molar concentration
(mol/cm3) of each species is represented as [i], where i is the species. For this example
case, the hydrocarbon used in the correlation is represented as HC, and this can be any
hydrocarbon of interest (i.e. methane, ethane, propane, etc.). The concentration for each
species is found using Eqn. 2. The exponents x and y represent the dependence of
ignition delay time on each species’ concentration and are found using a linear
regression of the data. When additional species are added to a mixture, like a diluent or
another hydrocarbon, the equation is multiplied by the species’ molar concentration
which is raised to a different exponent.
[𝑖] = 𝑥𝑖𝑃𝑅𝑇� (2)
In this equation, i is the species of interest, xi is the mole fraction of the species in the
mixture, P is the pressure in kPa, R is the universal gas constant in cm3-kPa/K-mol, and
T is temperature in K.
Spadaccini and Colket (1994) used an extensive list of previous ignition delay time
experiments to develop correlations for methane-air, methane-oxygen, and methane-

9
hydrocarbon mixtures. They found that the activation energy for methane-hydrocarbon
mixtures was slightly less than that for pure methane mixtures. Therefore, mixtures that
contained higher-order hydrocarbons required less energy for ignition to occur.
Additionally, the exponent for the concentration of higher-order hydrocarbons in the
mixture was found to be negative, indicating that as the concentration of higher-order
hydrocarbons in the mixture increases, the ignition delay time of the mixture decreases.
Huang et al. (2003) examined methane ignition delay time at higher, engine-relevant
pressures. As expected, it was found that methane ignition delay times decreased as
pressure was increased from 16 to 40 atm. This effect was more noticeable at lower
temperatures than higher temperatures due to a reduction in activation energy.
Ethane and propane are most commonly the second and third largest components of
natural gas. Due to this level of importance, the ignition delay times of methane/ethane
and methane/propane mixtures have been studied extensively. Petersen et al. (2007-a)
studied lean mixtures of methane with up to 30% ethane at elevated pressures. It was
also found that the addition of ethane to the mixture had an exponential effect: the
addition of 10% ethane was found to increase the ignition delay time by a factor of 3,
while the addition of 30% ethane was found to increase the ignition delay time by a
factor of 10. The effect of propane addition to methane mixtures was explored at
elevated pressures for a range of equivalence ratios (Petersen et al. (2007-b). Mixtures
that contained up to 40% propane showed that for different temperatures, pressures and
equivalence ratios, ignition delay time consistently decreased with increased propane in

10
the mixture. These results were confirmed when atmospheric tests of methane/ethane
and methane/propane were performed by Holton et al. (2010). With less than 10%
addition of ethane or propane to methane, ignition delay times noticeably decreased.
Ethane was seen to decrease the ignition delay time of the methane-based mixture more
than the same amount of propane. Moreover, a significant increase in ignition delay time
was found when small amounts of methane were added to ethane or propane. When all
three fuels were mixed together, mixtures with the least methane had the shortest
ignition delay times.
Butane and pentane are the next most-common constituents found in natural gas. An
early study by Higgins and Williams (1969) looked at the addition of small amounts of
n-butane (hereafter referred to as butane) to methane at an equivalence ratio of 0.5 and
sub-atmospheric pressures. They found that the addition of even small amounts of
butane to the mixture decreased the ignition delay time significantly. For mixtures with 1
to 3.7% of butane addition, the ignition delay time decreased by a factor of 6, and for
mixtures with 12.5% butane addition, the ignition delay time decreased by a factor of 10.
This result shows that even small levels of butane can have an important effect on the
ignition delay time of a mixture at these conditions. To study the effects at gas turbine-
relevant conditions, Healy et al. (2010-a) recently extended the methane/butane ignition
delay time database to include higher pressures (10 and 20 atm) and mixtures with
higher levels of butane (10 and 30% butane). Addition of 10% butane was seen to
increase the mixture reactivity by a factor of 5 over pure methane at both pressures.

11
Furthermore, the addition of 30% butane was shown to increase the mixture reactivity by
an additional factor of 2 over the reactivity of the mixtures with 10% butane at both
pressures.
Mixtures of methane and pentane have not been extensively studied in the literature.
Crossley et al. (1972) examined one methane/pentane mixture with a low level of
pentane and found that the results were similar to those found with the same level of
butane. Although there is a lack of methane-pentane data, several studies have examined
natural gases containing pentane. Extensive ignition delay time studies have been
performed fcrossor two synthetic natural gases with less than 82% methane, NG2 and
NG3. The compositions of these two natural gases from Bourque et al. (2010) are shown
in Table 1. Experiments over a wide range of pressures showed that ignition delay times
increased by a factor of 5 from pure methane to NG2 or NG3. Ignition delay times of
NG3 were also lower than those of NG2; however the effect was not as dramatic as the
decrease from pure methane. Additionally, experiments over a range of equivalence
ratios showed that at lower temperatures and higher pressures, rich mixtures of NG2 and
NG3 have shorter ignition delay times than lean mixtures, and at higher temperatures
and lower pressures, the opposite is true.

12
Table 1 Composition of two synthetic natural gases, in volume percent.
2.3 Hydrogen Ignition Delay Time
The ignition delay time of hydrogen exhibits a counterintuitive dependence on
temperature and pressure. This behavior is due to a well-known competition between
two initiation reactions in the H2-O2 system: the termolecular reaction
H + O2 + M ⇄HO2 + M dominates at higher pressures and lower temperatures, while
the more-reactive branching reaction H + O2 ⇄ OH + O dominates at lower pressures
and higher temperatures (Law, 2006).
Species NG2 (%) NG3 (%)
CH4 81.25 62.5C2H6 10.00 20.0C3H8 5.00 10.0
n -C4H10 2.50 5.0n -C5H12 1.25 2.5
13
5 6 7 8 9 10 111E-4
1E-3
0.01
0.1
1
10
Igni
tion
Dela
y Ti
me
(mse
c)
10000 K / T(K)
1 atm 15 atm 30 atm
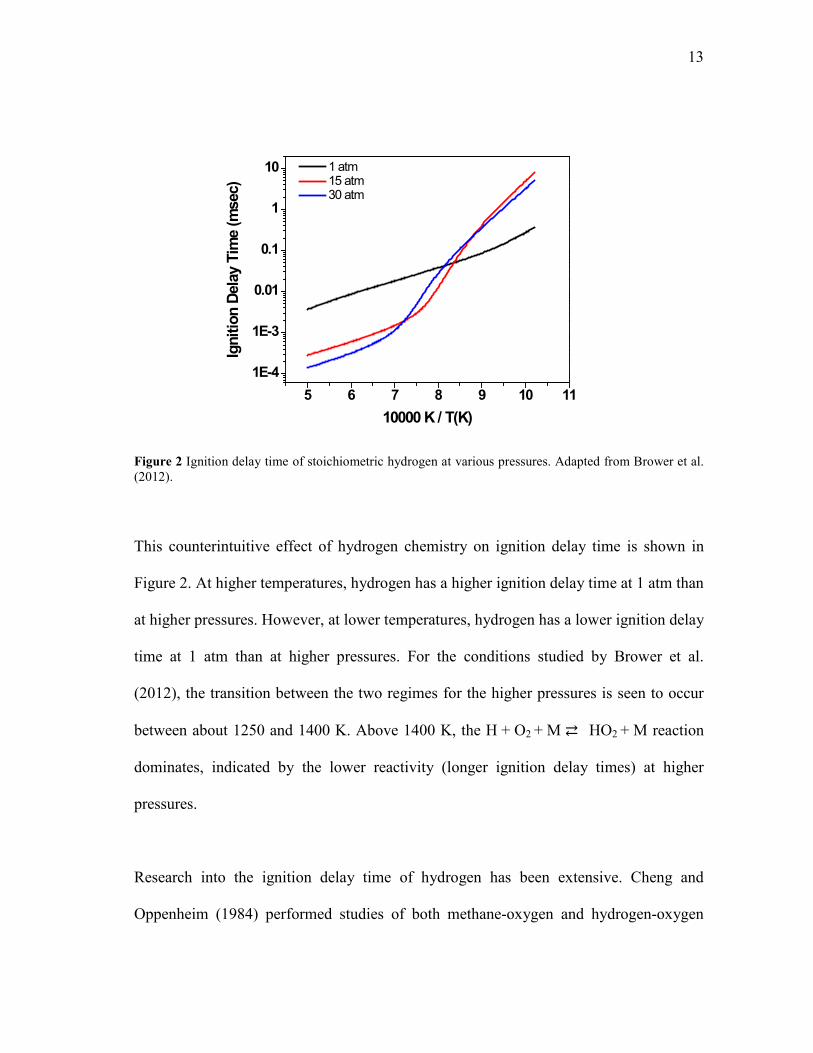
Figure 2 Ignition delay time of stoichiometric hydrogen at various pressures. Adapted from Brower et al. (2012).
This counterintuitive effect of hydrogen chemistry on ignition delay time is shown in
Figure 2. At higher temperatures, hydrogen has a higher ignition delay time at 1 atm than
at higher pressures. However, at lower temperatures, hydrogen has a lower ignition delay
time at 1 atm than at higher pressures. For the conditions studied by Brower et al.
(2012), the transition between the two regimes for the higher pressures is seen to occur
between about 1250 and 1400 K. Above 1400 K, the H + O2 + M ⇄HO2 + M reaction
dominates, indicated by the lower reactivity (longer ignition delay times) at higher
pressures.
Research into the ignition delay time of hydrogen has been extensive. Cheng and
Oppenheim (1984) performed studies of both methane-oxygen and hydrogen-oxygen

14
mixtures at low pressures (1 to 3 atm) and formulated correlations similar to Eqn. 1 for
both fuels. They found that, for these low pressures, hydrogen had an activation energy
that was a factor of two less than the activation energy of methane. This lower activation
energy indicates that hydrogen has a much smaller ignition delay time than methane at
the same temperature. Herzler and Nuamann (2009) looked at hydrogen ignition delay
times at 1, 4, and 16 atm at equivalence ratios of 0.5 and 1. The expected pressure
dependence of hydrogen ignition delay time was observed for these mixtures. The
transition temperature range at 16 atm was found to be around 1100 K for stoichiometric
mixtures and around 1000 K for mixtures with an equivalence ratio of 0.5. This trend
shows that the transition between the dominant reactions is also affected by the
equivalence ratio of the mixture.
Recently, the ignition delay time of hydrogen at gas turbine-relevant conditions was
studied by Fleck et al. (2012). Using a generic reheat gas turbine, ignition delay time of
hydrogen in air was studied at a constant pressure of 15 atm with variations in inlet
temperature of the combustor and velocity of the H2/air mixture into the combustor. It
was found that temperature dominated changes in ignition delay time for the mixtures,
especially at higher inlet velocities. Ignition of hydrogen within the burner was also
observed to be independent of the overall equivalence ratio of the mixture in the reheat
combustor. Therefore, for a constant pressure, temperature is the most significant factor
when looking at ignition delay times of hydrogen mixtures.
15
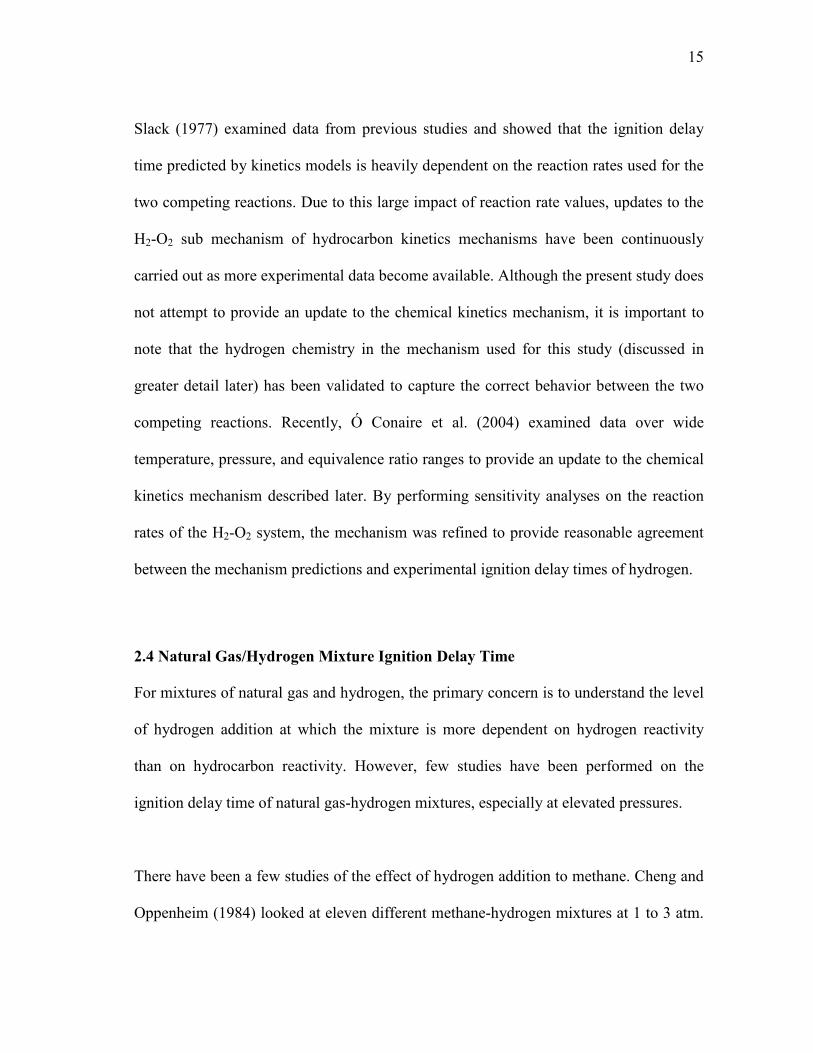
Slack (1977) examined data from previous studies and showed that the ignition delay
time predicted by kinetics models is heavily dependent on the reaction rates used for the
two competing reactions. Due to this large impact of reaction rate values, updates to the
H2-O2 sub mechanism of hydrocarbon kinetics mechanisms have been continuously
carried out as more experimental data become available. Although the present study does
not attempt to provide an update to the chemical kinetics mechanism, it is important to
note that the hydrogen chemistry in the mechanism used for this study (discussed in
greater detail later) has been validated to capture the correct behavior between the two
competing reactions. Recently, Ó Conaire et al. (2004) examined data over wide
temperature, pressure, and equivalence ratio ranges to provide an update to the chemical
kinetics mechanism described later. By performing sensitivity analyses on the reaction
rates of the H2-O2 system, the mechanism was refined to provide reasonable agreement
between the mechanism predictions and experimental ignition delay times of hydrogen.
2.4 Natural Gas/Hydrogen Mixture Ignition Delay Time
For mixtures of natural gas and hydrogen, the primary concern is to understand the level
of hydrogen addition at which the mixture is more dependent on hydrogen reactivity
than on hydrocarbon reactivity. However, few studies have been performed on the
ignition delay time of natural gas-hydrogen mixtures, especially at elevated pressures.
There have been a few studies of the effect of hydrogen addition to methane. Cheng and
Oppenheim (1984) looked at eleven different methane-hydrogen mixtures at 1 to 3 atm.

16
These mixtures varied in equivalence ratio and ranged from pure methane to pure
hydrogen. As expected, methane-hydrogen mixtures were always found to have shorter
ignition delay times than pure methane and longer ignition delay times than pure
hydrogen. A correlation, represented by Eqn. 3, was suggested for methane-hydrogen
mixture ignition delay times dependent on the amount of hydrogen in the fuel mixture
and the ignition delay times of methane and hydrogen.
𝜏𝑚𝑖𝑥 = 𝜏𝐶𝐻4(1−𝜀)𝜏𝐻2
𝜀 (3)
In this correlation, τi is the ignition delay time of species i, and ε is the mole fraction of
hydrogen in the mixture.
Fotache et al. (1997) examined ignition delay times of methane mixtures up to 60%
hydrogen heated by air in a counter-flow reactor. They observed that ignition delay time
was decreased with the addition of hydrogen to the mixture primarily because of kinetic
interactions between methane and hydrogen. Hydrogen radicals that form at the
initiation of combustion promote the formation of methyl radicals. More recently, Huang
et al. (2006) examined methane-hydrogen mixtures of up to 35% hydrogen at pressures
of 16 and 40 atm. It was observed that the difference between ignition delay times of
pure methane mixtures and mixtures containing hydrogen was more dramatic at 16 atm
than at 40 atm. For a constant pressure, the differences in ignition delay time between
mixtures containing hydrogen and pure methane became less noticeable as temperature
decreased. Additionally, it was noted that differences between pure methane and
17
mixtures containing 15% hydrogen were much less significant than differences seen
between pure methane and mixtures containing 35% hydrogen.
Zhang et al. (2012) have recently extended the ignition delay time database for methane-
hydrogen mixtures by examining reactivity of 0-100% hydrogen fuel mixtures at
pressures from 5 to 20 atm. Typical hydrocarbon ignition delay time behavior, i.e.
decreasing ignition delay time with increasing pressure, was observed when the fuel
mixture was less than 40% hydrogen. From 40 to 60% hydrogen, a linear regression
showed the exponent of pressure trending to zero, indicating that the ignition delay time
has a negligible dependence on pressure. When hydrogen was 80% of the mixture, the
complex nature of hydrogen reactivity dominated the ignition delay time of the fuel
mixture. For this mixture, at high temperatures, the ignition delay time decreased
significantly with an increase in pressure; at intermediate temperatures, the opposite
pressure dependence was found, and at low temperatures, there was no pressure
dependence exhibited. Additionally, it is shown that although hydrogen is the major
component in the 20%CH4/80%H2 mixture, the reactivity of pure hydrogen has a
noticeably different pressure dependence.
Fewer studies have been performed for natural gases with higher order hydrocarbons. A
study by Herzler and Nuamann (2009) looked at the effect of hydrogen addition to
natural gas modeled as 92% methane and 8% ethane. They looked at mixtures with 0 to
100% hydrogen at pressures of 1, 4, and 16 atm and equivalence ratios of 0.5 and 1.

18
Overall, the addition of ethane to the mixtures, and the subsequent reduction of methane,
caused a decrease in the ignition delay times. The ignition delay times were seen to have
linear dependence on temperature and pressure until hydrogen was 80% of the mixture,
similar to the methane-hydrogen mixtures seen by Zhang et al. (2012).
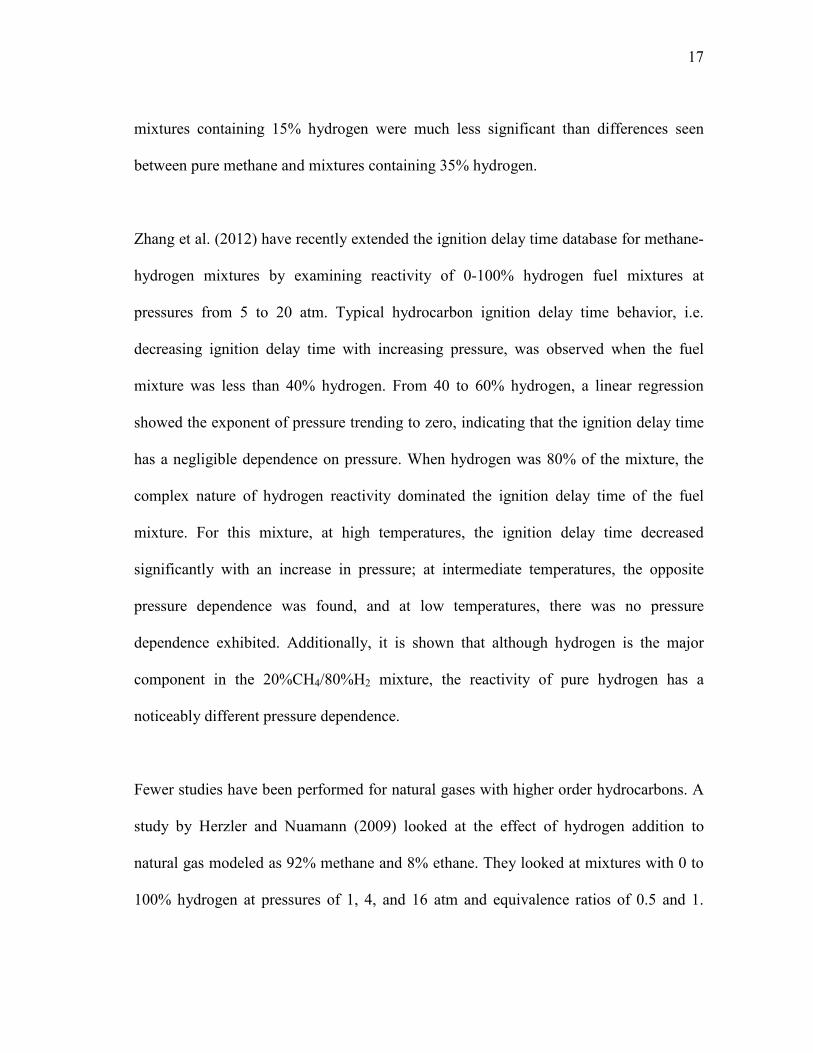
A recent study by Brower et al. (2012) contained flame speed and ignition delay time
calculations for pure methane and NG2 (described in Table 1) with 0 to 100% hydrogen.
A parametric study was performed for ignition delay times at conditions relevant for the
secondary burner of a reheat gas turbine. As pressure was varied from 1 to 30 atm, the
effect of hydrogen addition to the base hydrocarbon was observed. Figure 3, adapted
from Brower et al. (2012), shows the results from the parametric study at a temperature
of 1100 K and an equivalence ratio of 0.7. For both methane and NG2, the ignition delay
times appear to linearly decrease as pressure increases until about 70% hydrogen is
added. At 70% hydrogen addition and 90% hydrogen addition, the hydrocarbon fuels are
seen to start adapting to the pressure dependence seen in the pure-hydrogen case. The
results were similar at an inlet temperature of 1300 K and equivalence ratio of 0.7 as
well as at an inlet temperature of 1100 K and an equivalence ratio of 1.1. The last two
calculations also show slight increases in ignition delay times for higher equivalence
ratios and slight decreases in ignition delay times at higher inlet temperatures.
19
1 10
1E-4
1E-3
0.01
0.1
1 NG2: 0% H2 NG2: 5% H2 NG2: 50% H2 NG2: 70% H2 NG2: 90% H2 100% H2
Igni
tion
Dela
y Ti
me
(sec
)
Pressure (atm)
CH4: 0% H2 CH4: 5% H2 CH4: 50% H2 CH4: 70% H2 CH4: 90% H2
Figure 3 Ignition delay times of methane and NG2 with 0 to 100% hydrogen addition at an inlet temperature of 1100 K and an equivalence ratio of 0.7. From Brower et al. (2012).
Brower et al. (2012) also developed a gas turbine model using the chemical kinetics
solver CHEMKIN (Reaction Design, Inc., 2011). This model calculated laminar flame
speeds based on conditions in the primary burner and ignition delay times based on
conditions in the secondary burner. In Figure 4, the normalized ignition delay times of
methane and NG2 are plotted as a function of hydrogen addition for three different
pressures, 1, 15, and 30 atm. One can see from this figure that the ignition delay time of
a hydrocarbon decreases dramatically with the addition of hydrogen. At 15 atm, the
ignition delay time decreases by almost two orders of magnitude from pure methane to
pure hydrogen. The effect is less dramatic with NG2 since pure NG2 has a shorter
ignition delay time than pure methane. Additionally, the effect of hydrogen addition
decreases as pressure increases.

20
0.0 0.2 0.4 0.6 0.8 1.0
1E-3
0.01
0.1
1
Norm
aliz
ed τ ig
n (τ ig
n/τig
n_pu
re N
G2)
Hydrogen Mole Fraction
CH4: 1 atm CH4: 15 atm CH4: 30 atm NG2: 1 atm NG2: 15 atm NG2: 30 atm
Figure 4 Ignition delay time of mixtures of methane and NG2, plotted as a function of hydrogen mole fraction. Values are normalized to the ignition delay time of pure NG2 at each pressure. From Brower et al. (2012).
The studies highlighted above and the calculations performed by Brower et al. (2012)
highlight the need for further experimental studies. Although the study by Brower et al.
(2012) was extensive, there is still a lack of experimental data for natural gases with high
levels of hydrogen, especially at gas turbine-relevant conditions. The need for the
experimental validation of these calculations led to the study to follow.

21
CHAPTER III
EXPERIMENTAL SETUP
3.1 Shock-Tube Facility
Experiments were performed in the high-pressure shock-tube facility described in detail
by Aul (2009) and shown in Figure 5. The shock tube is made entirely of 304 stainless
steel. The driven section is 4.72-m long with an internal diameter of 15.24 cm, and the
driver section is 2.46-m long with an internal diameter of 7.62 cm. The large diameter of
the driven section allows for experiments to be performed with minimal boundary layer
effects. The length of the shock tube allows the observation of ignition delay times of up
to 2 msec before any significant pressure drop is observed.
Figure 5 Schematic drawing of high-pressure shock-tube facility from Aul (2009).
The inner diameter of the driver section is expanded to the driven section inner diameter
through a diverging section located directly after the diaphragm location. The easy

22
accessibility of the diaphragm section allows for experiments at different pressures to be
performed in the same shock tube. The diaphragms used herein were different for each
of the three pressures. For 1 atm experiments, polycarbonate diaphragms with widths of
0.01″ were used. To achieve test conditions as close as possible to 10 atm, several
polycarbonate diaphragms with widths of 0.04″, 0.01″, and 0.005″ were used. Typically,
the experiments were performed with one 0.04″ diaphragm, two 0.01″ diaphragms, and
one 0.005″ diaphragm, but this varied depending on the mixture and temperature of the
experiment to stay within ±0.5 atm of 10 atm. For 30-atm experiments, prescored
aluminum diaphragms with widths of 0.09″ were used. The experimental pressures for
the 30atm experiments varied by about 3 atm between mixtures due to slight differences
in batches of aluminum diaphragms.
Helium was used as the driver gas, and the driver section was filled slowly until the
diaphragm burst to ensure repeatability between experiments. Ultra-high purity (UHP,
99.9995%) gases were used to make the test mixtures containing Ar, O2, CH4, C2H6,
C3H8, n-C4H10, n-C5H12, and H2. The two natural gases used in the study, shown in Table
1, were each prepared separately to ensure repeatability with the natural gases used. The
natural gases were prepared using the partial pressure method in tanks that were
vacuumed down below 1×10⁻⁷ torr. The partial pressure of pentane was kept well below
the vapor pressure of pentane to ensure that it was always in the gaseous phase and well
mixed in the natural gas mixtures. The natural gas mixtures were prepared and allowed

23
to sit at least 24 hours before they were used to make the fuel-oxidizer-diluent mixtures
for the experiments.
After the natural gas mixtures were prepared, the mixtures from the test matrix were
made. All mixtures from the L9 test matrix (described later) were diluted in 90% argon.
Each mixture was made in a mixing tank connected to the shock tube using the partial
pressure method. The mix tank was vacuumed to pressures below 10-6 before each
mixture was made. The gases were introduced to the mix tank through a perforated
stinger to create turbulent mixing. In addition, each constituent was slowly added to the
mix tank to ensure proper mixing.
The conditions at which the combustion event occurs are dictated by the conditions
behind the shock wave after it is reflected off the endwall of the driven section of the
shock tube. These conditions are dependent on the incident shock wave velocity, the
initial fill conditions of the driven section, and the properties of the gas in the driven
section. For the shock tube used herein, incident-shock velocity in the test region was
found using five, PCB 113 pressure transducers in series along the shock tube. These
pressure transducers sent signals to four, Fluke PM 6666 time-interval counters that
output the time intervals that were seen by the pressure transducers as the shock wave
passes. These four time intervals and the distances between the pressure transducers
were then used to find the velocity of the incident shock wave. Using this velocity and
the standard one-dimensional shock relations that incorporate the fill conditions and
24
properties of the gas in the driven section, conditions behind the reflected shock wave
for each experiment was calculated. Petersen et al. (2005) showed that this method is
highly reliable and determines reflected-shock temperatures that are within ± 10 K of the
actual temperature.
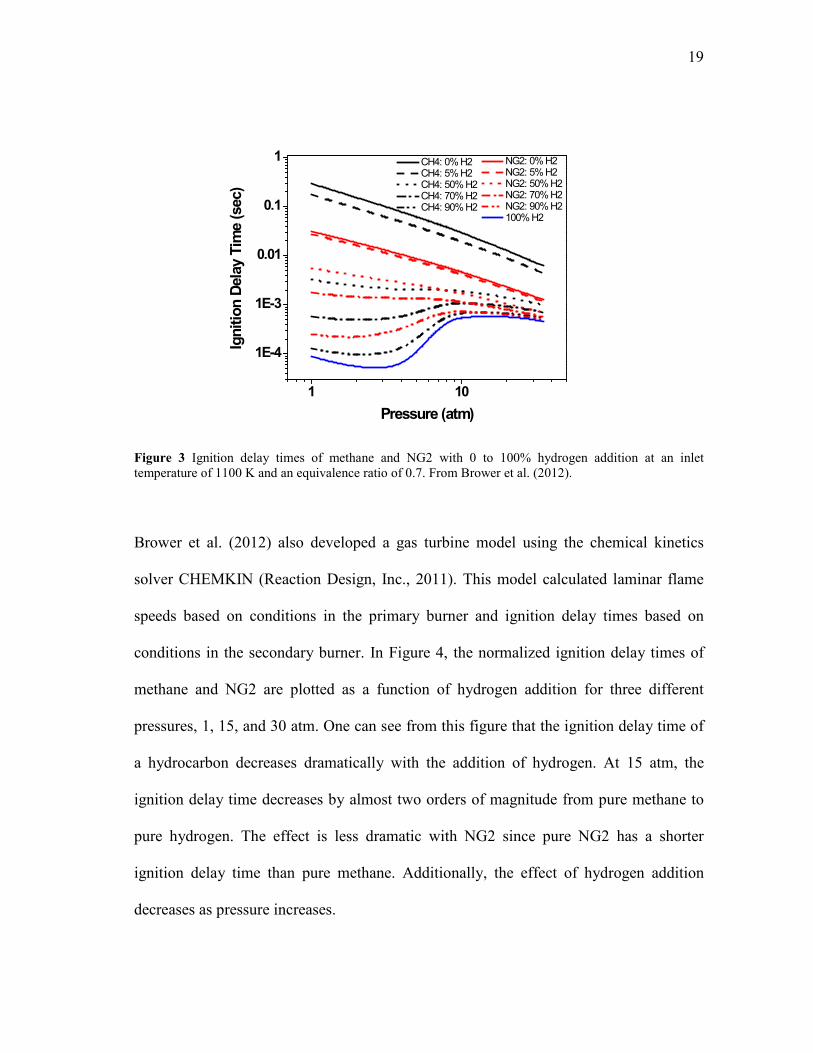
Within a shock tube, ideal ignition is an event that begins at the endwall sometime after
the reflected shockwave has passed and then travels upstream. The time between when
the reflected shockwave initially passes and when the ignition event begins is defined as
the ignition delay time (τign). It is ideal to measure the ignition event from the endwall
using the endwall pressure signal, as depicted in Figure 6. In this case, the combustion
event is exothermic enough to produce a significant and measurable rise in pressure.
0 800 16000
10
20
Endwall Pressure Signal
Endw
all P
ress
ure
(atm
)
Time (µs)
τign
Figure 6 Ignition delay time measurement from endwall pressure signal. Experiment shown was perf-ormed mixture of NG3 and 30% H2 with an equivalence ratio of 1 at conditions of 9.6 atm and 1199 K.

25
In the present study, all mixtures were diluted in 90% argon and, due to this dilution,
some of the mixtures used were not exothermic enough at all conditions to produce a
strong pressure rise at the endwall. In these few cases, the sidewall OH(A→X) (hereafter
referred to as OH*) emission was used to determine the ignition delay time, as shown in
Figure 7. The beginning of the ignition delay time was defined by the sidewall pressure
signal, and ignition was indicated by the rise in OH* emission. The ignition delay time
found from the sidewall OH* signal was preferred to the ignition delay time found from
the endwall OH* emission signal. This preference is because in dilute mixtures, using
the endwall emission to determine the ignition delay time can result in artificially long
ignition delay times (Petersen, 2009).
0 100 200
0.0
0.2
0.4
0.6
0.8
1.0 OH* Emission
Norm
aliz
ed O
H* P
rofil
e
Time (µs)
0
1
2
3
4 Sidewall Pressure
Sid
ewal
l Pre
ssur
e (a
tm)
τign
Figure 7 Ignition delay time measurement from OH* emission signal. Experiment shown was performed mixture of CH4 and 30% H2 with an equivalence ratio of 0.3 at conditions of 1.5 atm and 1645 K.

26
3.2 Experimental Uncertainty
Experimental uncertainty in ignition delay time measurements is due to several aspects
of the experiment. First, the method of determining the reflected-shock conditions is
known to be accurate to ± 10 K. At an average temperature of 1250 K for all mixtures
performed, this indicates about 2% uncertainty is added to the ignition delay time data
due to possible variations in temperature.
The mixture production method, although fairly accurate, can add some uncertainty to
the data as well. In 90% argon, the fuel constituents were at partial pressures on the
order of 100s of torr. The accuracy of the pressure gage that determined the pressure of
the mixture as these constituents were added was to 10-1 torr. Additionally, the oxygen
was usually at a pressure above the limit of the vacuum pressure gage and was therefore
added to the mixture using a psi-based pressure gage. This pressure gage was accurate to
10-1 psi. Argon was the last constituent added to the mixture and was added to the
mixture using the psi pressure gage. Overall, the mixture process and the accuracy of the
pressure gages add about 1% uncertainty to the ignition delay time of a specific mixture.
The method of determining ignition delay time also introduces a level of uncertainty to
the calculations. Since these calculations are performed graphically and are open to
interpretation (when choosing which feature(s) on which to base the ignition event), the
uncertainty is mostly due to human error. Repeat calculations of ignition delay time
measurements from the same experiment are generally within 5% of each other.

27
All of these factors introduce uncertainty to the ignition delay time measurements.
Additionally, there are slight uncertainties from experiment to experiment due to
differences in the diaphragm bursting, signals from the diagnostics, and other minor
experimental factors. Due to all of these factors, the overall uncertainty of an ignition
delay time was determined to be 10%.
3.3 Chemical Kinetics Model
The most recent chemical kinetics model from the National University of Ireland,
Galway, was compared to all experiments. This kinetics model is under constant
development at the Combustion Chemistry Center and describes the combustion
chemistry up to C5 (http://c3.nuigalway.ie/naturalgas3.html, 2010). This chemical
kinetics mechanism is based on the hierarchical nature of combustion kinetics. The basic
sub-mechanism is comprised of the H2/O2/CO chemistry that has recently been updated
based on experimental and kinetics data (Ó Conaire et al., 2004). The C1-C3 sub
mechanism has also been under constant development, with the most recent updates
described by Metcalfe et al. (2011). Some important saturated species, like 1,3-
butadiene, propene, and various alkenes, have been added to the mechanism based on
work by Davis et al. (1999) and the mechanism developed by Laskin et al. (2000).
Recent developments for the butane and pentane mechanism are described by Healy et
al. (2010-b).

28
In addition to this chemical kinetics mechanism, the OH* mechanism developed by Hall
and Petersen (2005) was used to define ignition delay times of each calculation. Using
the chemical kinetics solver CHEMKIN (Reaction Design, Inc., 2011), the complete
kinetics model was used to predict the chemistry at each specific experimental condition.
The OH* profile from each simulation was used to find the predicted ignition delay time
of the mixture at those conditions, as shown in Figure 8.
0 50 1000.0
0.2
0.4
0.6
0.8
1.0
Norm
aliz
ed O
H* P
rofil
e
Time (µsec)
Galway OH* Prediction
τign
Figure 8 Ignition delay time measurement from Galway OH* prediction. Prediction shown was performed with a mixture of CH4 and 30% H2 with an equivalence ratio of 0.3 at conditions of 1.5 atm and 1645 K.
3.4 Experimental Matrix
The effect of hydrogen addition to methane and natural gas has been shown to vary with
the amount of higher-order hydrocarbons in the natural gas, the equivalence ratio, and
the pressure. A test matrix was developed to test these different aspects in an organized

29
matter. Three baseline natural gases were used: pure methane, NG2, and NG3. From
previous studies (Brower et al., 2012), it was determined that three levels of hydrogen
addition would be sufficient to capture the key effects of different levels of hydrogen
addition. Thirty percent hydrogen addition was chosen to test the effect of a low level of
hydrogen that, in chemical calculations, was predicted to not affect the linear pressure
dependence expected for a hydrocarbon. Sixty percent hydrogen addition was tested to
determine if the reactivity would still have the linear pressure dependence even when
more than half of the fuel mixture is hydrogen. Finally, 80% hydrogen addition was
examined to determine the effect of a low level of natural gas on hydrogen reactivity.
Since it was observed previously (Brower et al., 2012) that the equivalence ratio could
play a small role on ignition delay time of a mixture, three equivalence ratios were
chosen for the experiments (0.3, 0.5, and 1). The pressure was also varied from 1 to 30
atm to test the pressure dependence of these mixtures.
Three levels of each variable were assembled into the L9 Taguchi array (Ross, 1988),
shown in Table 2. The specific mole fractions of NG2 and NG3 are listed in Table 1, and
the specific mole fractions for each combination are listed in the appendix. Experiments
were performed for each combination at the designated pressure and at 9 - 14 different
temperatures. The temperature ranges were varied to obtain ignition delay times from
around 100 μs to 2 ms for each combination.

30
Table 2 L9 test matrix developed using the Taguchi method for balanced, orthogonal arrays. Three levels of each factor were used.
Combo Fuel %H2 φ P (atm)
1 CH4 30 0.3 1
2 CH4 60 0.5 10
3 CH4 80 1 30
4 NG2 30 0.5 30
5 NG2 60 1 16 NG2 80 0.3 107 NG3 30 1 108 NG3 60 0.3 309 NG3 80 0.5 1

31
CHAPTER IV
RESULTS
Experiments were performed for each of the 9 combinations at the designated pressure
and at least nine different temperatures. The temperature ranges were varied to obtain
ignition delay times from around 100 μs to 2 ms for each combination. The experimental
data and conditions are listed for each combination of the L9 matrix in the appendix. The
experimental ignition delay times were compared to ignition delay times predicted by
the Galway mechanism. This comparison between the model and the experimental
results shows areas where the model performs well and where improvement of the model
could be implemented. The datasets are presented in the order of the experimental
matrix. After each three combinations from the same base natural gas (i.e. methane,
NG2, or NG3), the three combinations are plotted together to draw further conclusions.
All ignition delay times are plotted on a base 10-logarithmic scale as a function of the
inverse of the temperature.
32
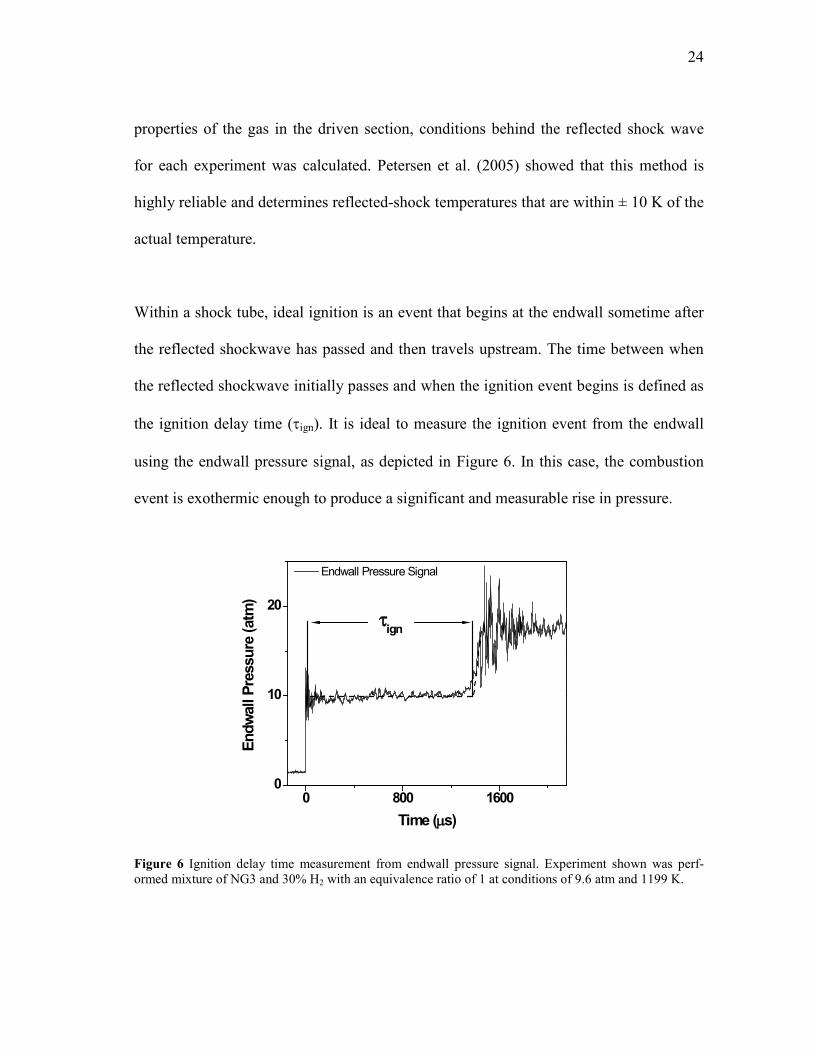
Ignition delay time data for combination 1 are presented in Figure 9. The temperature
range for this combination was 1283 K to 1722 K. It is shown later that this was one of
the least reactive combinations and therefore had the highest temperature range of all
combinations. This lower reactivity was expected since combination 1 contained the
maximum amount of methane at the lowest pressure possible. The Galway model
predicted ignition delay times that were an average of 31% higher than the experimental
data. However, the model appears to accurately predict the trend of linearly decreasing
ignition delay times with increasing temperature that is seen in the experimental data.
5.5 6.0 6.5 7.0 7.5 8.0
100
1000
Igni
tion
Dela
y Ti
me
(µse
c)
10000 K / T(K)
Combo 1 Data Galway Model
Figure 9 Ignition delay times of 30% H2 added to pure methane with an equivalence ratio of 0.3 at a pressure of 1 atm are shown. Galway model predictions are also plotted against the data as a line.

33
The ignition delay time data found for combination 2 are presented in Figure 10
compared to the Galway mechanism at the same conditions. Ignition delay times were
taken for a temperature range of 1116 K to 1317 K. The significantly lower temperature
range indicates that this combination is more reactive than combination 1 since a similar
range of ignition delay times was achieved with lower temperatures. Similar to
combination 1, the data are seen to have a fairly linear trend with temperature. The
Galway model fairly accurately describes this trend although the model has a slightly
nonlinear curve and under predicts the data. This error in the model prediction could be
due to an effect of the hydrogen addition, pressure, or equivalence ratio.
7.5 8.0 8.5 9.0
100
1000
Igni
tion
Dela
y Ti
me
(µse
c)
10000 K / T(K)
Combo 2 Data Galway Model
Figure 10 Ignition delay times of 60% hydrogen added to pure methane with an equivalence ratio of 0.5 at a pressure of 10 atm are shown. Galway model predictions are also plotted against the data as a line.

34
Ignition delay times of combination 3 are presented in Figure 11 compared to the
Galway model at the same conditions. For this combination, the temperatures ranged
from 1110 K to 1220 K. This range of temperature is the lowest seen between
combinations 1 to 3, indicating that this is the most reactive combination for the set of
methane combinations. The trend of the data, linearly decreasing ignition delay times
with increasing temperature, is captured by the Galway model but the data are under
predicted. The Galway model also appears to predict a slightly different slope than slope
of the data. This behavior again indicates that the Galway model is incorrectly predicting
the effect of hydrogen, pressure, or equivalence ratio on the reactivity at these
conditions.
8.0 8.5 9.0100
1000
Combo 3 Data Galway Model
Igni
tion
Dela
y Ti
me
(µse
c)
10000 K / T(K)
Figure 11 Ignition delay times of 80% hydrogen added to pure methane with an equivalence ratio of 1 at a pressure of 30 atm are shown. Galway model predictions are also plotted against the data as a line.

35
Ignition delay times for combinations 1, 2, and 3 are plotted in Figure 12. The reactivity
appears to increase from combination 1 to combination 2 and then from combination 2
to combination 3. Additionally, combination 1 is much less reactive than both
combinations 2 and 3, which are similar in reactivity. The trends all appear to be linear
with temperature, both for the data and the Galway models. Combination 3 appears to be
the most significantly under predicted combination, while only combination 1 is over
predicted by the model. Due to the nature of the experimental matrix, conclusions on
which factor influences the reactivity of the methane fuels cannot be made from this
information since more than one parameter was changed between each combination.
5.5 6.0 6.5 7.0 7.5 8.0 8.5 9.0
100
1000
Combo 1 Data Galway Model Combo 2 Data Galway Model Combo 3 Data Galway Model
Igni
tion
Dela
y Ti
me
(µse
c)
10000 K/T(K)
Figure 12 Ignition delay times from the CH4-based combinations 1 through 3 are plotted as a function of the inverse of the temperature. Galway models for each combination are plotted as lines.

36
Ignition delay times of combination 4 are presented in Figure 13 compared to the
Galway model calculated at the same conditions. Temperatures for the experiments with
combination 4 ranged from 1152 K to 1299 K. The data appear to have a linear trend in
which ignition delay time increases with decreasing temperature. The Galway model
describes the trend of the data fairly accurately. However, the Galway model slightly
under predicts the experimental data.
7.5 8.0 8.5 9.0100
1000
Combo 4 Data Galway Model
Igni
tion
Dela
y Ti
me
(µse
c)
10000 K / T(K)
Figure 13 Ignition delay times of 30% hydrogen added to NG2 with an equivalence ratio of 0.5 at a pressure of 30 atm are shown. Galway model predictions are also plotted against the data as a line.
37
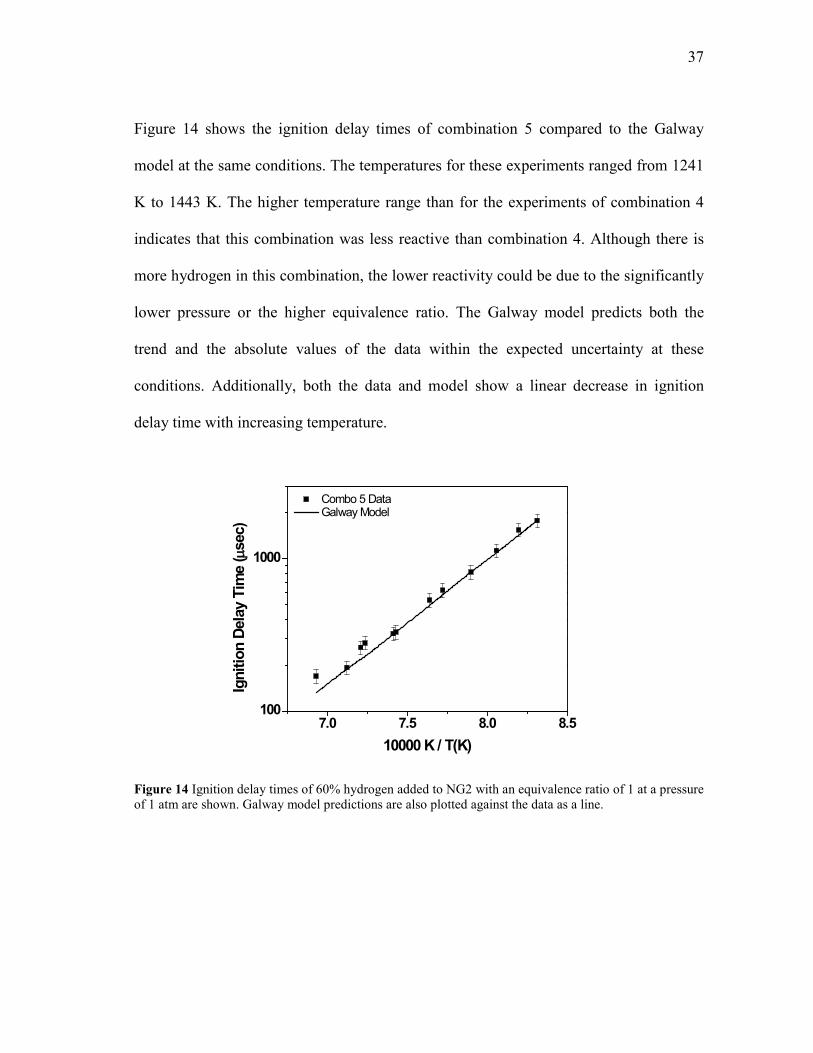
Figure 14 shows the ignition delay times of combination 5 compared to the Galway
model at the same conditions. The temperatures for these experiments ranged from 1241
K to 1443 K. The higher temperature range than for the experiments of combination 4
indicates that this combination was less reactive than combination 4. Although there is
more hydrogen in this combination, the lower reactivity could be due to the significantly
lower pressure or the higher equivalence ratio. The Galway model predicts both the
trend and the absolute values of the data within the expected uncertainty at these
conditions. Additionally, both the data and model show a linear decrease in ignition
delay time with increasing temperature.
7.0 7.5 8.0 8.5100
1000
Combo 5 Data Galway Model
Igni
tion
Dela
y Ti
me
(µse
c)
10000 K / T(K)
Figure 14 Ignition delay times of 60% hydrogen added to NG2 with an equivalence ratio of 1 at a pressure of 1 atm are shown. Galway model predictions are also plotted against the data as a line.

38
Ignition delay times for combination 6 are shown in Figure 15 along with the Galway
model predictions at the same conditions. The temperature range for this data set is
1101 K to 1196 K. The data decrease linearly from the lowest temperature until about
1150 K. Then, the linear trend of the data changes and the data begin to decrease at a
slower rate as temperature increases. The Galway model accurately predicts the lower
temperature trend seen in the data but fails to predict the change in the trend seen at
1150 K. This behavior indicates that the model might not accurately predict the effect of
hydrogen addition, pressure, or equivalence ratio at these conditions.
8.5 9.0100
1000
Igni
tion
Dela
y Ti
me
(µse
c)
10000 K / T(K)
Combo 6 Data Galway Model
Figure 15 Ignition delay times of 80% hydrogen added to NG2 with an equivalence ratio of 0.3 at a pressure of 10 atm are shown. Galway model predictions are also plotted against the data as a line.

39
Ignition delay times for combinations 4, 5, and 6 are plotted together in Figure 16.
Combination 5 appears to be the least reactive combination while combination 6 is the
most reactive. The trends of combinations 4 and 5 appear to be purely linear, while the
slope of the linear trend of combination 6 changes around 1150 K. The order of
reactivity of the combinations follows decreasing order of equivalence ratio, indicating
that equivalence ratio could play a significant role for these combinations. However,
since this is not the only factor changing between combinations, a factor sensitivity
analysis was performed to find the factor that is playing the most significant role, as
shown later. The Galway model does fairly well at predicting the data for these three
combinations, although it does not predict the change in the linear trend seen in
combination 6.
7.0 7.5 8.0 8.5 9.0100
1000
Combo 4 Data Galway Model Combo 5 Data Galway Model Combo 6 Data Galway Model
Igni
tion
Dela
y Ti
me
(µse
c)
10000 K/T(K)
Figure 16 Ignition delay times from NG2-based combinations 4 through 6 are plotted as a function of the inverse of temperature. Galway models for each combination are plotted as lines.

40
Ignition delay times from combination 7 are plotted as a function of inverse temperature
in Figure 17. The experiments were performed in a temperature range of 1192 K to 1381
K. The data appear to follow a linear trend, and ignition delay times decrease with
increasing temperature. The Galway model appears to follow a similar trend, although
the model under predicts the data. Additionally, the model under predicts the ignition
delay times more at higher temperatures.
7.0 7.5 8.0 8.5100
1000
Combo 7 Data Galway Model
Igni
tion
Dela
y Ti
me
(µse
c)
10000 K / T(K)
Figure 17 Ignition delay times for 30% hydrogen added to NG3 with an equivalence ratio of 1 at a pressure of 10 atm are shown. Galway model predictions are also plotted against the data as a line.

41
Figure 18 shows the ignition delay times of combination 8 as a function of the inverse of
the temperature. The experimental temperatures for this combination ranged from 1134
K to 1253 K. This temperature range is on the lower end of the temperature range for
combination 7, indicating that this combination is more reactive. The data appear to have
a linear trend, and the ignition delay times decrease with an increase in temperature. The
Galway model predictions show a similar trend but noticeably under predict the data.
8.0 8.5 9.0100
1000
Igni
tion
Dela
y Ti
me
(µse
c)
10000 K / T(K)
Combo 8 Data Galway Model
Figure 18 Ignition delay times of 60% hydrogen added to NG3 with an equivalence ratio of 0.3 at a pressure of 30 atm are shown. Galway model predictions are also plotted against the data as a line.
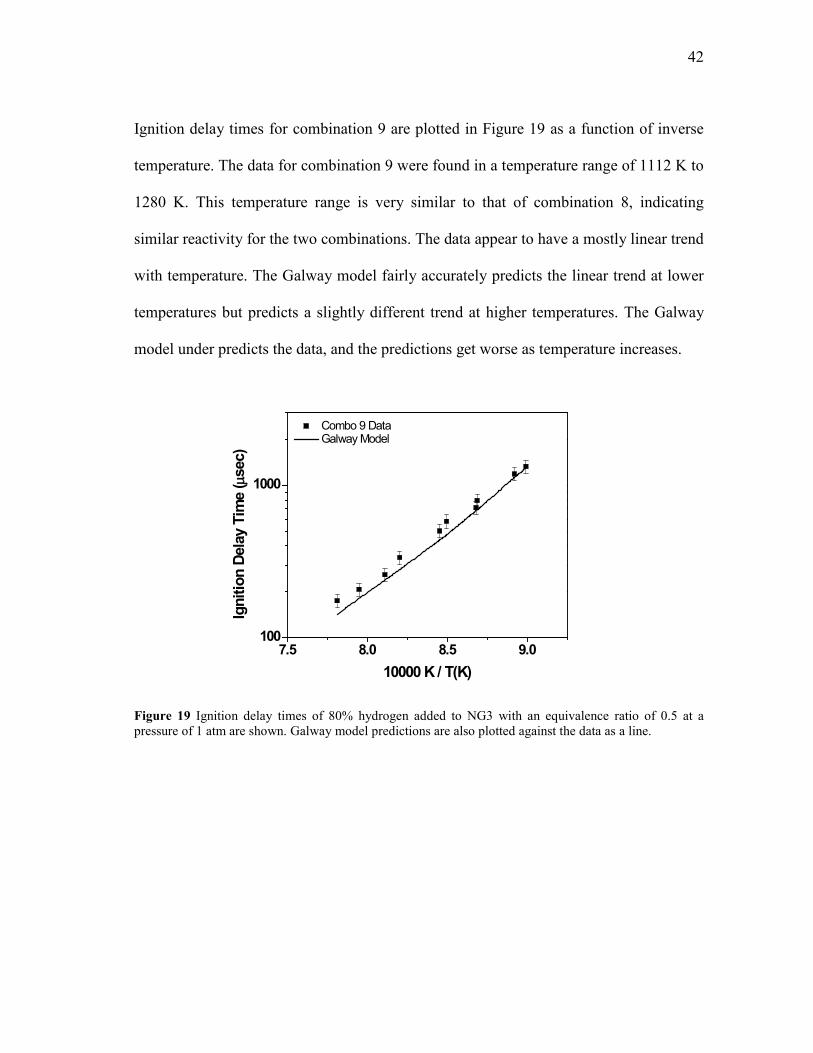
42
Ignition delay times for combination 9 are plotted in Figure 19 as a function of inverse
temperature. The data for combination 9 were found in a temperature range of 1112 K to
1280 K. This temperature range is very similar to that of combination 8, indicating
similar reactivity for the two combinations. The data appear to have a mostly linear trend
with temperature. The Galway model fairly accurately predicts the linear trend at lower
temperatures but predicts a slightly different trend at higher temperatures. The Galway
model under predicts the data, and the predictions get worse as temperature increases.
7.5 8.0 8.5 9.0100
1000
Combo 9 Data Galway Model
Igni
tion
Dela
y Ti
me
(µse
c)
10000 K / T(K)
Figure 19 Ignition delay times of 80% hydrogen added to NG3 with an equivalence ratio of 0.5 at a pressure of 1 atm are shown. Galway model predictions are also plotted against the data as a line.

43
The ignition delay times for all three combinations containing NG3 (combinations 7
through 9) are shown in Figure 20. One noticeable feature seen in this figure is that two
of the combinations, 8 and 9, have overlapping ignition delay times. Combination 9 is
seen to cross over combination 8. Additionally, combination 7 is seen to be significantly
less reactive than the other two combinations. Although the Galway model under
predicts all of the data for the NG3 combinations, the trends are very accurately
predicted. In the Galway predictions, combination 9 is seen to cross combination 8 and
combination 7 is significantly less reactive than the other two combinations.
7.0 7.5 8.0 8.5 9.0100
1000
Combo 7 Data Galway Model Combo 8 Data Galway Model Combo 9 Data Galway Model
Igni
tion
Dela
y Ti
me
(µse
c)
10000 K/T(K)
Figure 20 Ignition delay times from NG3-based combinations 7 through 9 are plotted as a function of the inverse of temperature. Galway models for each combination are plotted as lines.

44
CHAPTER V
DISCUSSION
Further analysis of the results presented in the previous chapter was performed in an
attempt to determine which factor (natural gas composition, H2 content of the fuel
mixture, equivalence ratio, or pressure) played the largest role in the ignition delay times
of the combinations studied. In this chapter, experimental correlations are developed for
each individual combination, each set of three combinations (based on the natural gas of
the combination), and for the full L9 matrix. A factor sensitivity is performed on the L9
matrix using the correlations developed for each combination. Then, calculations for all
possible combinations for the conditions of the study (the full matrix) are performed, and
correlations are developed for L9 matrices for each natural gas. Finally, comparisons are
made between correlations from the full factorial matrix and L9 matrices for each natural
gas to show the effect of using a reduced L9 matrix for each natural gas.
5.1 Experimental Correlations
To further understand the trends within the data and to provide a means of predicting
ignition delay times outside of the data set without the use of the detailed mechanism,
correlations were developed. These correlations for each individual combination were
developed using Eqn. 4. In this equation, τign is the ignition delay time, A is the
correlation constant, E is an ignition activation energy of the combination in kcal/mol, R
is the universal gas constant in units of kcal/mol-K, and T is the temperature in K.
𝜏𝑖𝑔𝑛 = 𝐴𝑒𝑥𝑝 � 𝐸𝑅𝑇� (4)
45
Three separate correlations were developed for each set of 3 combinations that contained
each natural gas (CH4, NG2, or NG3). These correlations are described in further detail
in each subsection for that natural gas below and are generally of the form of Eqn. 5.
𝜏𝑖𝑔𝑛 = 𝐴[𝑁𝐺]𝑥[𝐻2]𝑦[𝑂2]𝑧𝑒𝑥𝑝 � 𝐸𝑅𝑇� (5)
In Eqn. 5, NG indicates the natural gas common to the set of three combinations, [ ]
indicates the concentration of the species inside the brackets in mol/cm3, and x, y, and z
are empirically derived correlation exponents.
In the following subsections, the correlations are explored further for each subset of
natural gas combinations. The correlations are described, and then each data set is
plotted with the correlations to compare the correlations together with the data. In the
final subsection, an attempt at correlating the entire L9 matrix is discussed. Several
correlation schemes are shown and compared to the experimental data.
5.1.1 Methane Combination Correlations
Using Eqn. 4, individual correlations were found for combinations 1 through 3. The val-
ues for A and E for each combination are listed in Table 3. The activation energies of the
combinations are seen to increase from combination 1 to combination 3. This trend impl-
ies increasing reactivity in the combinations, which was seen in the experimental results.

46
Table 3 Correlation constants and activation energies found for correlations of combinations 1 through 3 individually.
After the correlations for the individual combinations were found, a correlation for the
natural gas set was found. This multiple-combination correlation is described in Table 4.
Table 4 Correlation for combinations 1 through 3.
Although this correlation has a coefficient of multiple determination, R2, value above
0.9, the exponents x, y, and z are quite large. Generally, the absolute value of exponents
of a correlation of this form should be on the order of 1 or less. Since the exponents in
this case are so large, it is possible that some factor, like pressure or equivalence ratio, is
over specified. Due to this potentially misleading result, other forms of the correlation
were explored using different variables to describe the combinations. The correlation
that ultimately gave the most physically realistic exponents was of the form of Eqn. 6.
𝜏𝑖𝑔𝑛 = 𝐴[𝐶𝐻4]𝑥[𝐻2]𝑦[𝐴𝑟]𝑧𝜑𝑤𝑒𝑥𝑝 � 𝐸𝑅𝑇� (6)
Combo A E (kcal/mol)
1 2.42x10⁻² 28.2
2 4.02x10⁻⁵ 38.9
3 3.72x10⁻⁶ 43.4
A x y z E R2
8.09x10⁵ 19.3 -4.71 -15.0 34.2 0.962
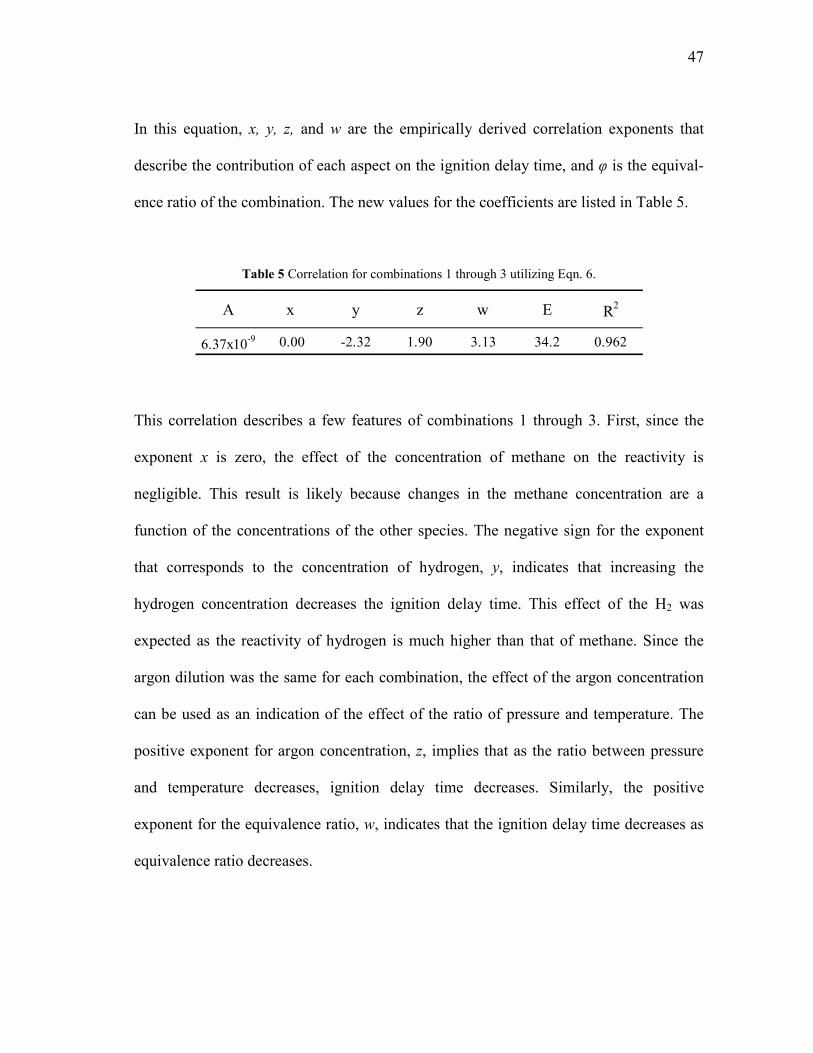
47
In this equation, x, y, z, and w are the empirically derived correlation exponents that
describe the contribution of each aspect on the ignition delay time, and φ is the equival-
ence ratio of the combination. The new values for the coefficients are listed in Table 5.
Table 5 Correlation for combinations 1 through 3 utilizing Eqn. 6.
This correlation describes a few features of combinations 1 through 3. First, since the
exponent x is zero, the effect of the concentration of methane on the reactivity is
negligible. This result is likely because changes in the methane concentration are a
function of the concentrations of the other species. The negative sign for the exponent
that corresponds to the concentration of hydrogen, y, indicates that increasing the
hydrogen concentration decreases the ignition delay time. This effect of the H2 was
expected as the reactivity of hydrogen is much higher than that of methane. Since the
argon dilution was the same for each combination, the effect of the argon concentration
can be used as an indication of the effect of the ratio of pressure and temperature. The
positive exponent for argon concentration, z, implies that as the ratio between pressure
and temperature decreases, ignition delay time decreases. Similarly, the positive
exponent for the equivalence ratio, w, indicates that the ignition delay time decreases as
equivalence ratio decreases.
A x y z w E R2
6.37x10⁻⁹ 0.00 -2.32 1.90 3.13 34.2 0.962
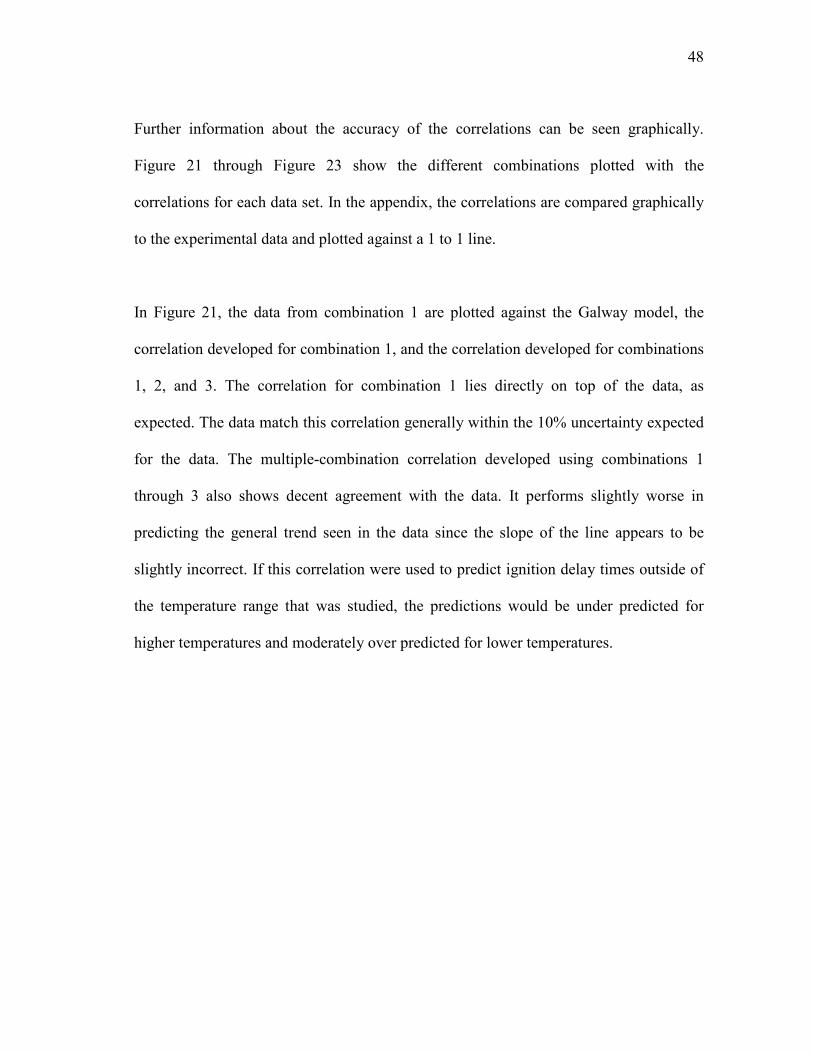
48
Further information about the accuracy of the correlations can be seen graphically.
Figure 21 through Figure 23 show the different combinations plotted with the
correlations for each data set. In the appendix, the correlations are compared graphically
to the experimental data and plotted against a 1 to 1 line.
In Figure 21, the data from combination 1 are plotted against the Galway model, the
correlation developed for combination 1, and the correlation developed for combinations
1, 2, and 3. The correlation for combination 1 lies directly on top of the data, as
expected. The data match this correlation generally within the 10% uncertainty expected
for the data. The multiple-combination correlation developed using combinations 1
through 3 also shows decent agreement with the data. It performs slightly worse in
predicting the general trend seen in the data since the slope of the line appears to be
slightly incorrect. If this correlation were used to predict ignition delay times outside of
the temperature range that was studied, the predictions would be under predicted for
higher temperatures and moderately over predicted for lower temperatures.

49
5.5 6.0 6.5 7.0 7.5 8.0
100
1000
Igni
tion
Dela
y Ti
me
(µse
c)
10000K/T(K)
Combo 1 Data Galway Model Combo 1 Correlation Combo 1-3 Correlation
Figure 21 Combination 1 data compared to the Galway model, the correlation for combination 1, and the correlation for combinations 1 through 3.
Figure 22 shows the data from combination 2 experiments compared to the Galway
model, the correlation for combination 2, and the correlation for combinations 1 through
3. Again, the correlation for the single combination is seen to lie almost directly on top
of the data points, within the 10% error expected for the data. The correlation for
combinations 1 through 3 is seen to have moderately good agreement with the data.
However, the slope of the line for the multiple-combination correlation at these
conditions does not predict the general trend seen in the data. At temperatures outside of
the experimental conditions, the multiple-combination correlation would not do a good
job of predicting the expected ignition delay times. At lower temperatures, the ignition
delay times would be significantly under predicted, and at higher temperatures, the
ignition delay times would be significantly over predicted.
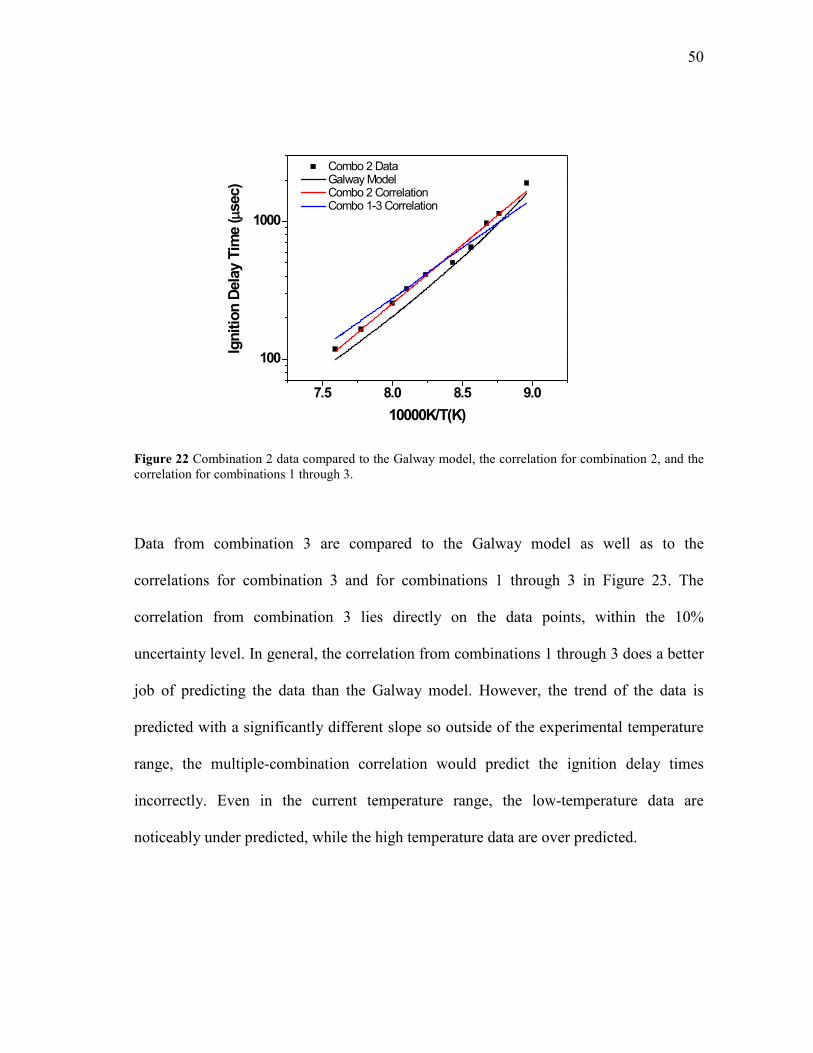
50
7.5 8.0 8.5 9.0
100
1000
Igni
tion
Dela
y Ti
me
(µse
c)
10000K/T(K)
Combo 2 Data Galway Model Combo 2 Correlation Combo 1-3 Correlation
Figure 22 Combination 2 data compared to the Galway model, the correlation for combination 2, and the correlation for combinations 1 through 3.
Data from combination 3 are compared to the Galway model as well as to the
correlations for combination 3 and for combinations 1 through 3 in Figure 23. The
correlation from combination 3 lies directly on the data points, within the 10%
uncertainty level. In general, the correlation from combinations 1 through 3 does a better
job of predicting the data than the Galway model. However, the trend of the data is
predicted with a significantly different slope so outside of the experimental temperature
range, the multiple-combination correlation would predict the ignition delay times
incorrectly. Even in the current temperature range, the low-temperature data are
noticeably under predicted, while the high temperature data are over predicted.

51
8.0 8.5 9.0100
1000
Igni
tion
Dela
y Ti
me
(µse
c)
10000K/T(K)
Combo 3 Data Galway Model Combo 3 Correlation Combo 1-3 Correlation
Figure 23 Combination 3 data compared to the Galway model, the correlation for combination 3, and the correlation for combinations 1 through 3.
5.1.2 NG2 Combination Correlations
Individual correlations were developed for combinations 4 through 6 using Eqn. 4. The
correlation constants (A) and activation energies (E) for each of these correlations are
listed in Table 6. Unlike combinations 1 through 3, the activation energy of the
combinations is not seen to increase with the increase of any specific factor (hydrogen,
pressure, or equivalence ratio). This shifting activation energy indicates that these
combinations are exhibiting a more complex relationship between the three different
factors than the methane combinations. This result shows the benefit of using an L9
matrix to capture complex effects of combination variation since more than one value is
changing between each experiment.
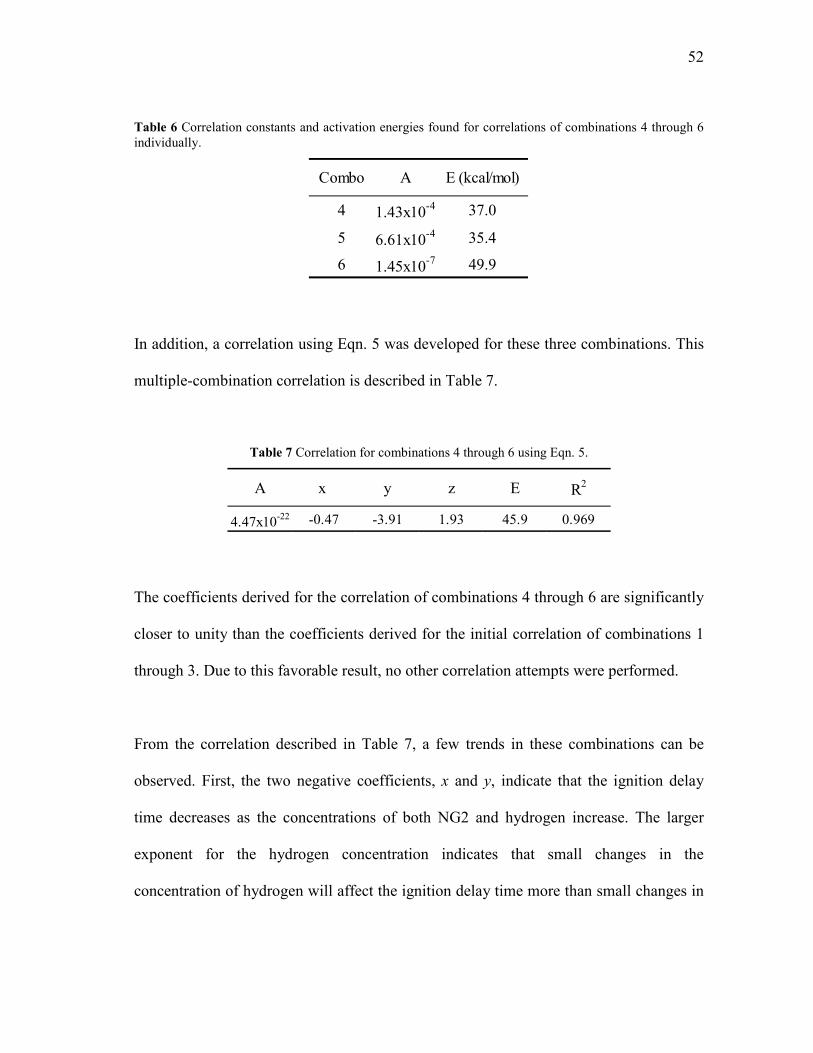
52
Table 6 Correlation constants and activation energies found for correlations of combinations 4 through 6 individually.
In addition, a correlation using Eqn. 5 was developed for these three combinations. This
multiple-combination correlation is described in Table 7.
Table 7 Correlation for combinations 4 through 6 using Eqn. 5.
The coefficients derived for the correlation of combinations 4 through 6 are significantly
closer to unity than the coefficients derived for the initial correlation of combinations 1
through 3. Due to this favorable result, no other correlation attempts were performed.
From the correlation described in Table 7, a few trends in these combinations can be
observed. First, the two negative coefficients, x and y, indicate that the ignition delay
time decreases as the concentrations of both NG2 and hydrogen increase. The larger
exponent for the hydrogen concentration indicates that small changes in the
concentration of hydrogen will affect the ignition delay time more than small changes in
Combo A E (kcal/mol)
4 1.43x10⁻⁴ 37.0
5 6.61x10⁻⁴ 35.4
6 1.45x10⁻⁷ 49.9
A x y z E R2
4.47x10⁻²² -0.47 -3.91 1.93 45.9 0.969

53
the concentration of NG2. The positive exponent for the oxygen concentration, z,
indicates that as the concentration of oxygen increases the ignition delay time will also
increase. The R2 value for this correlation is higher than for the previous combination
set, which shows that it will likely do a better job of predicting ignition delay times for
these combinations, even outside of the experimental conditions tested, although
extrapolation of the correlations beyond their stated range of applicability is not
recommended.
Again, further information from these correlations can be gained by graphical
comparison to the data. In Figure 24 through Figure 26, the data from each combination
are compared to the correlations. Additionally, the correlations are compared to the data
on a 1 to 1 basis in the appendix
In Figure 24, the data from combination 4 are compared to the Galway model, the
correlation for combination 4, and the correlation for combinations 4 through 6. The two
correlations essentially lie on top of each other and the data, showing excellent
agreement for both correlations. They both predict the experimental data more
accurately than the Galway model. Additionally, the slope of the data is also accurately
predicted by the correlation for combination 4 and for NG2 correlation for combinations
4 through 6. This level of precision indicates that the both correlations would accurately
predict data for this combination, potentially even outside of the temperature range
shown in Figure 24.

54
7.5 8.0 8.5 9.0100
1000
Combo 4 Data Galway Model Combo 4 Correlation Combo 4-6 Correlation
Igni
tion
Dela
y Ti
me
(µse
c)
10000 K / T(K)
Figure 24 Combination 4 data compared to the Galway model, the correlation for combination 4, and the correlation for combinations 4 through 6.
Experimental data from combination 5 are compared to the Galway model, the
correlation for combination 5, and the correlation for combinations 4 through 6 in Figure
25. The correlation designed for only combination 5 is seen to line up directly with the
data and can be used to make fairly accurate predictions of this combination. The
correlation for combinations 4 through 6 does an adequate job of predicting both the data
and the trend of the data. This multiple-combination correlation matches the data within
the expected 10% uncertainty, although it does not do quite as good of a job predicting
this combination as it did predicting combination 4. However, since the slope of the
multiple-combination correlation seems to accurately predict the general trend seen in
the data at the extremes of the temperatures in the experimental set, this correlation can

55
also be used to accurately predict the combination outside of the experimental
temperatures.
7.0 7.5 8.0 8.5
100
1000
Combo 5 Data Galway Model Combo 5 Correlation Combo 4-6 Correlation
Igni
tion
Dela
y Ti
me
(µse
c)
10000 K / T(K)
Figure 25 Combination 5 data compared to the Galway model, the correlation for combination 5, and the correlation for combinations 4 through 6.
Figure 26 shows the data from combination 6 compared to the Galway model, the
correlation for combination 6, and the correlation for combinations 4 through 6. The
correlation for combination 6 appears to predict the combination relatively well.
However, the slight change in slope is not captured by this correlation since it is only a
linear fit to the data. If one extends the line of the correlation, it appears that it will over
predict ignition delay times for higher temperatures and under predict ignition delay
times for lower temperatures. The correlation for combinations 4 through 6 also does a
fairly good job of predicting the data, but the slope of the multiple-combination
correlation is slightly smaller than that of the correlation for only combination 6. Due to

56
this difference in slope between the two correlations, the multiple-combination
correlation will provide better predictions at higher temperatures and worse predictions
at lower temperatures than the correlation for combination 6.
8.5 9.0100
1000
Combo 6 Data Galway Model Combo 6 Correlation Combo 4-6 Correlation
Igni
tion
Dela
y Ti
me
(µse
c)
10000 K / T(K)
Figure 26 Combination 6 data compared to the Galway model, the correlation for combination 6, and the correlation for combinations 4 through 6.
5.1.3 NG3 Combination Correlations
Similar to the previous sets of combinations, individual correlations were developed for
combinations 7 through 9. The correlation coefficients (A) and activation energies (E)
for these correlations are listed in Table 8. The activation energies in this case increase
with pressure. This trend with pressure indicates that, for these combinations, pressure
likely plays a significant role on the reactivity of the combination.

57
Table 8 Correlation constants and activation energies found for correlations of combinations 7 through 9 individually.
Additionally, a correlation using the data from all three combinations was developed
using Eqn. 5. The coefficients for this correlation are shown in Table 9. The coefficients
that were found for the correlation of combinations 7 through 9 were close to or less than
unity so no further correlations were attempted.
Table 9 Correlation for combinations 7 through 9 using Eqn. 5.
The correlation described in Table 9 indicates a few trends in combinations 7 through 9.
First, unlike the previous correlation for combinations 4 through 6, the coefficient for the
natural gas (NG3), x, is positive. This outcome could indicate that the ignition delay
times decrease with decreasing NG3 concentration (and increasing H2 concentration).
Similar to the previous multiple-combination correlations, the coefficient for hydrogen
concentration, y, is negative, while the coefficient for oxygen concentration, z, is
positive. Therefore, the ignition delay time will decrease with increasing hydrogen
Combo A E (kcal/mol)
7 2.69x10⁻⁴ 36.9
8 3.79x10⁻⁶ 44.4
9 1.75x10⁻⁴ 35.0
A x y z E R2
1.04x10⁻⁷ 0.50 -1.31 0.39 38.7 0.988
58
concentration, and the ignition delay time will increase as the oxygen concentration
increases. Additionally, the hydrogen concentration has the largest coefficient, so it is
likely that hydrogen concentration will play the largest role in determining the ignition
delay time of the combinations.
Further information can be gained by graphically comparing the data to these
correlations. Figure 27 through Figure 29 show the data from each combination
compared to the correlations for that combination. Additionally, 1 to 1 comparisons of
the combination correlations to the data are presented in the appendix.
Data from experiments with combination 7 are plotted with the Galway model, the
correlation for combination 7, and the correlation for combinations 7 through 9 in Figure
27. Both correlations do an exceptional job of predicting the experimental data. They lie
effectively on top of one another and the data. There is a slight difference in the slopes
of the two correlations, so at temperatures that are different from the experimental
temperatures by about 1000 K, errors in predicting may start to develop. However, the
good agreement between the correlations and the data shows that these correlations will
be good at predicting ignition delay times within a couple hundred Kelvin of the
experimental temperatures.

59
7.0 7.5 8.0 8.5100
1000
Combo 7 Data Galway Model Combo 7 Correlation Combo 7-9 Correlation
Igni
tion
Dela
y Ti
me
(µse
c)
10000 K / T(K)
Figure 27 Combination 7 data compared to the Galway model, the correlation for combination 7, and the correlation for combinations 7 through 9.
In Figure 28, the experimental data from combination 8 are plotted with the Galway
model as well as with the correlation for combination 8 and the correlation for
combinations 7 through 9. The correlation for combination 8 is seen to lie on top of the
experimental data, within the 10% expected uncertainty in the data. This correlation will
be able to make fairly accurate predictions of this combination, even at temperatures
outside of the experimental temperature range. The correlation for combinations 7
through 9 does an inferior job of predicting this combination than was seen for
combination 7. In the center of the data set, the correlation predicts the data very well.
However, the slope of the correlation is different than that of the data. At higher
temperatures, even within the experimental temperatures, the correlation begins to over

60
predict ignition delay times, and at lower temperatures, the correlation begins to under
predict ignition delay times.
8.0 8.5 9.0100
1000
Combo 8 Data Galway Model Combo 8 Correlation Combo 7-9 Correlation
Igni
tion
Dela
y Ti
me
(µse
c)
10000 K / T(K)
Figure 28 Combination 8 data compared to the Galway model, the correlation for combination 8, and the correlation for combinations 7 through 9.
Figure 29 shows the experimental data for combination 9 compared to the Galway
model, the correlation for combination 9, and the correlation for combinations 7 through
9. Both correlations appear to make fairly accurate predictions of the experimental data.
The correlation for combination 9 predicts the trend of the data and matches the data
points within the expected 10% uncertainty. The multiple-combination correlation also
predicts the data mostly within the expected uncertainty. However, the slope of the
correlation for combinations 7 through 9 is slightly different than that of the data.
Although the data points are well predicted for this temperature range, the multiple-
combination correlation will likely not do as well outside of the experimental
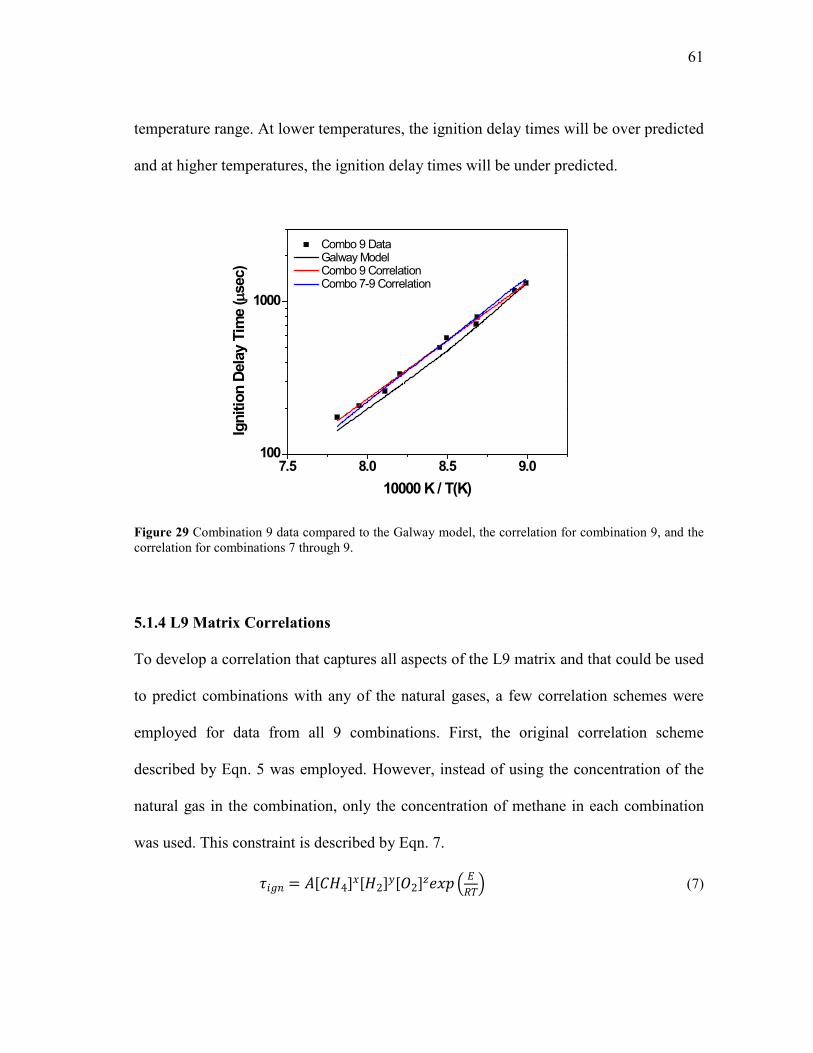
61
temperature range. At lower temperatures, the ignition delay times will be over predicted
and at higher temperatures, the ignition delay times will be under predicted.
7.5 8.0 8.5 9.0100
1000
Combo 9 Data Galway Model Combo 9 Correlation Combo 7-9 Correlation
Igni
tion
Dela
y Ti
me
(µse
c)
10000 K / T(K)
Figure 29 Combination 9 data compared to the Galway model, the correlation for combination 9, and the correlation for combinations 7 through 9.
5.1.4 L9 Matrix Correlations
To develop a correlation that captures all aspects of the L9 matrix and that could be used
to predict combinations with any of the natural gases, a few correlation schemes were
employed for data from all 9 combinations. First, the original correlation scheme
described by Eqn. 5 was employed. However, instead of using the concentration of the
natural gas in the combination, only the concentration of methane in each combination
was used. This constraint is described by Eqn. 7.
𝜏𝑖𝑔𝑛 = 𝐴[𝐶𝐻4]𝑥[𝐻2]𝑦[𝑂2]𝑧𝑒𝑥𝑝� 𝐸𝑅𝑇� (7)

62
It should be noted that the methane concentration is different for each combination in the
L9 matrix due to all four factors: base natural gas composition, hydrogen fraction of the
fuel combination, equivalence ratio, and pressure. The empirically determined
coefficients for this correlation are shown in Table 10.
Table 10 First correlation attempt using Eqn. 7 for all 9 combinations in the experimental matrix.
The conclusions that can be drawn from this correlation are similar to those that were
found for the previous correlations. As methane concentration decreases, the ignition
delay time will also decrease, and as hydrogen concentration increases, the ignition
delay time will decrease. However, the exponent for oxygen, z, is negative indicating
that as oxygen concentration increases, the ignition delay time will decrease. The R2
value of the correlation is less than 0.9, indicating that the correlation does not provide
acceptable predictions of the experimental data.
A comparison between the predictions from the correlation described by Table 10 and
the experimental data is shown in Figure 30. As expected from the low R2 value, the cor-
relation does not do well at predicting all of the combinations. The combinations that are
predicted the worst are combinations 8 and 3. Additionally, all three of the combinations
with 60% hydrogen (combinations 2, 5, and 8) are poorly predicted indicating that the
A x y z E R2
2.63x10⁻⁵ 0.68 -0.69 -0.35 31.3 0.834

63
effect of the hydrogen addition is not accurately captured by this correlation. However,
combinations 4, 7, and 9 are predicted well with this correlation. This inconsistency
amongst the different combinations indicates that the correlation captures some of the
effects of the different factors that were changed between the combinations.
0 500 1000 1500 2000
0
500
1000
1500
2000
Corr
elat
ion
1 Pr
edic
tion
(µse
c)
Experimental Data (µsec)
Combo 1 Combo 2 Combo 3 Combo 4 Combo 5 Combo 6 Combo 7 Combo 8 Combo 9
Figure 30 Comparison of the experimental data from all 9 experimental combinations to the predictions from the correlation developed using Eqn. 7. The predicted data are plotted as a function of the real data values with a 1 to 1 line.
Since the R2 value was low for the correlation described by Table 10, another correlation
scheme was attempted. The equation for this correlation is described by Eqn. 8 and
incorporates the concentration of argon in each combination.
𝜏𝑖𝑔𝑛 = 𝐴[𝐶𝐻4]𝑥[𝐻2]𝑦[𝑂2]𝑧[𝐴𝑟]𝑤𝑒𝑥𝑝 � 𝐸𝑅𝑇� (8)
By including the concentration of argon, only the concentration of higher-order
hydrocarbons in the base natural gas is not a variable. Again, the concentration of

64
methane will vary for each combination due to all four factors in the L9 matrix. The
values for each coefficient in this correlation are shown in Table 11.
Table 11 Second correlation attempt using Eqn. 8 for all 9 combinations in the experimental matrix.
The first three exponents, x, y, and z, indicate similar trends as seen with the first
correlation; ignition delay time decreases with decreasing methane and increasing
hydrogen and oxygen. The effects of hydrogen and oxygen concentrations are seen to be
more important, indicated by the larger exponents than seen before. Since the mole
fraction of argon in each combination is constant, the effect of the concentration of argon
is more of an indication of the effect of changes in the ratio between pressure and
temperature. Therefore, the positive exponent for argon concentration indicates that as
the ratio between pressure and temperature increases, the ignition delay time increases. It
should also be noted that the exponents z and w are rather far from unity, indicating that
an aspect of the correlation is likely over specified.
The ignition delay times predicted by the second correlation are compared to the
experimental data in Figure 31. The R2 value for this correlation was an improvement
from the first correlation, although still not above the desired value of at least 0.9. This
slightly better coefficient of multiple determination can be seen in the figure as the
A x y z w E R2
1.65x10⁻¹¹ 0.19 -1.47 -3.27 4.12 33.1 0.885

65
experimental data are predicted a little better in most cases than in Figure 30. The same
combinations are still noticeably under predicted (combinations 5, 6, and 8), indicating a
similar issue with the prediction of the effect of hydrogen on the combinations.
Combination 2 is under predicted by this correlation at higher ignition delay times, the
opposite of what was seen with the previous correlation. Additionally, combinations 4
and 9 are noticeably over predicted. The prediction of combination 6 is similar between
the two correlations, and the second correlation does a reasonable job of predicting
combinations 1 and 7.
0 500 1000 1500 2000
0
500
1000
1500
2000
Corr
elat
ion
2 Pr
edic
tion
(µse
c)
Experimental Data (µsec)
Combo 1 Combo 2 Combo 3 Combo 4 Combo 5 Combo 6 Combo 7 Combo 8 Combo 9
Figure 31 Comparison of the experimental data from all 9 experimental combinations to the predictions from the correlation developed using Eqn. 8. The predicted data are plotted as a function of the real data values with a 1 to 1 line.
Due to the large exponents for argon and oxygen concentration in the previous
correlation, one further correlation was attempted for the full set of experimental data.

66
This correlation is described by Eqn. 9 and attempted to incorporate the concentration of
the entire natural gas, instead of only the methane component.
𝜏𝑖𝑔𝑛 = 𝐴[𝑁𝐺]𝑥[𝐻2]𝑦[𝑂2]𝑧[𝐴𝑟]𝑤�𝑥𝐹𝑢𝑒𝑙_𝐶𝐻4�𝑣𝑒𝑥𝑝� 𝐸𝑅𝑇� (9)
In the correlation described by Eqn. 9, [NG] is the concentration of the entire natural gas
in the experiment, and 𝑥𝐹𝑢𝑒𝑙_𝐶𝐻4 is the mole fraction of methane in the natural gas. Using
this correlation, the exponents were found and are described in Table 12.
Table 12 Third correlation attempt using Eqn. 9 for all 9 combinations in the experimental matrix.
The exponents y, z, and w are almost the same as what found for the previous correlation
indicating that this correlation captures similar trends. However, they are even further
from unity than for the previous correlation. The exponent for the concentration of the
natural gas, x, is extremely small, indicating that the effect of the natural gas in the
combination is almost negligible. The positive exponent v indicates that as methane
content in the natural gas increases (and the higher-order hydrocarbon content decreases)
the ignition delay time increases, which was expected.
A comparison between the ignition delay time predictions of the third correlation and the
experimental data is shown in Figure 32. This comparison is extremely similar to that
A x y z w v E R2
8.52x10⁻¹² 0.15 -1.50 -3.36 4.30 0.32 33.2 0.887

67
shown for the second correlation. This similarity was expected since the exponents for
the two correlations are similar and the R2 values are also similar.
0 500 1000 1500 2000
0
500
1000
1500
2000
Corr
elat
ion
3 Pr
edic
tion
(µse
c)
Experimental Data (µsec)
Combo 1 Combo 2 Combo 3 Combo 4 Combo 5 Combo 6 Combo 7 Combo 8 Combo 9
Figure 32 Comparison of the experimental data from all 9 experimental combinations to the predictions from the correlation developed using Eqn. 9. The predicted data are plotted as a function of the real data values with a 1 to 1 line.
All of the correlations for the entire experimental data set were seen to do a poor job of
predicting the data from all 9 combinations. This result is likely due to nonlinear effects
introduced by the addition of hydrogen to the hydrocarbon fuels combined with effects
from changing the natural gas composition, pressure, and equivalence ratio. However, it
is beyond the scope of this thesis to develop a more-accurate correlation including these
nonlinear effects. The best correlation from the brief exploration described in this section
would be the second correlation, described by Eqn. 8 and Table 11. Although the R2
value of this correlation is slightly lower than that for the third correlation, the exponents
are closer to unity. Using a correlation with smaller exponents allows for better

68
prediction of combinations outside of the 9 combinations studied herein. However, due
to the still large exponents and poor R2 value of this correlation, care should be taken
when predicting ignition delay times with this correlation, especially outside of the
experimental conditions studied within this thesis.
5.2 L9 Matrix Factor Sensitivity
A factor sensitivity was performed on the results from the L9 matrix to determine which
aspect of the combinations plays the largest role in reactivity. By utilizing the L9 Matrix
in this manner, fewer experiments can be performed to gain the same information. The
four factors considered for the sensitivity analysis were C2+ (hydrocarbons higher than
methane) content of the natural gas, hydrogen percentage of the fuel, equivalence ratio,
and pressure.
The correlations for each individual combination (described in Table 3, Table 6, and
Table 8) were used to predict ignition delay times for each combination at different
temperatures. These correlations were used because it was found that for every
combination, the single combination correlations very accurately described the data,
usually without the risk of over or under prediction of the ignition delay time outside of
the experimental temperature range.
Four temperatures were chosen close to the experimental temperatures used throughout
the matrix: 1100 K, 1150 K, 1200 K, and 1250 K. After ignition delay times were found
69
for each combination at each temperature, an average of the ignition delay times of
combinations with a factor at a certain level were taken at each temperature. For
example, an average of ignition delay times at 1100 K was taken for each: combinations
containing CH4 (C2+ level 1), combinations containing NG2 (C2+ level 2), and
combinations containing NG3 (C2+ level 3). Then, the maximum difference between
averages was taken to be the sensitivity of that factor, at that temperature. Continuing the
same example, differences were found between the CH4 average and the NG2 average at
1100 K, between the NG2 average and the NG3 average at 1100 K, and between the
NG3 average and the CH4 average at 1100 K. The maximum of these three differences
was taken to be the sensitivity of C2+ content of the natural gas on the ignition delay time
at 1100 K. This procedure was repeated to find the factor sensitivities of each factor at
each temperature. Finally, at each temperature, all four factor sensitivities were
normalized to the largest sensitivity. The normalization of the factor sensitivities allowed
for comparison at different temperatures.
The factor sensitivity analysis for predicted ignition delay times of the full L9 matrix is
shown in Figure 33. This analysis indicates that the hydrogen content of the fuel mixture
is the most important factor. It was expected that hydrogen would play a significant role
in determining the reactivity of these combinations because hydrogen reactivity is
known to be significantly higher than for hydrocarbons at the same conditions.

70
The second most important factor in the matrix studied was pressure. The effect of
pressure is seen to increase as temperature increases and is close to as important as
hydrogen content at the highest temperature. This level of importance was expected
since, for all of the base components of the combinations, variations in pressure have
been shown to greatly affect the ignition delay time.
Equivalence ratio was a moderately significant factor in the matrix studied. Although the
effect was not negligible, equivalence ratio did not affect the reactivity of the
combinations as strongly as hydrogen content or pressure. The effect of equivalence
ratio at lean conditions is due to the increased importance of oxygen for chain branching
kinetics. However, this effect is also closely linked to the effects of pressure and
composition of the fuel mixture.
Finally, the C2+ fraction of natural gas was seen to have the smallest effect on the
ignition delay times. However, the effect was not negligible. This smaller effect was
expected since the reactivities of the different natural gases used in this matrix were
relatively similar when compared to the reactivity of hydrogen. However, the effect of
C2+ content of the natural gas increased relative to the effects of the other factors with
temperature. This result is likely due to the fact that ignition delay times of methane
decrease as temperature increases at a much slower rate than NG2 or NG3 ignition delay
times (Bourque et al., 2010).
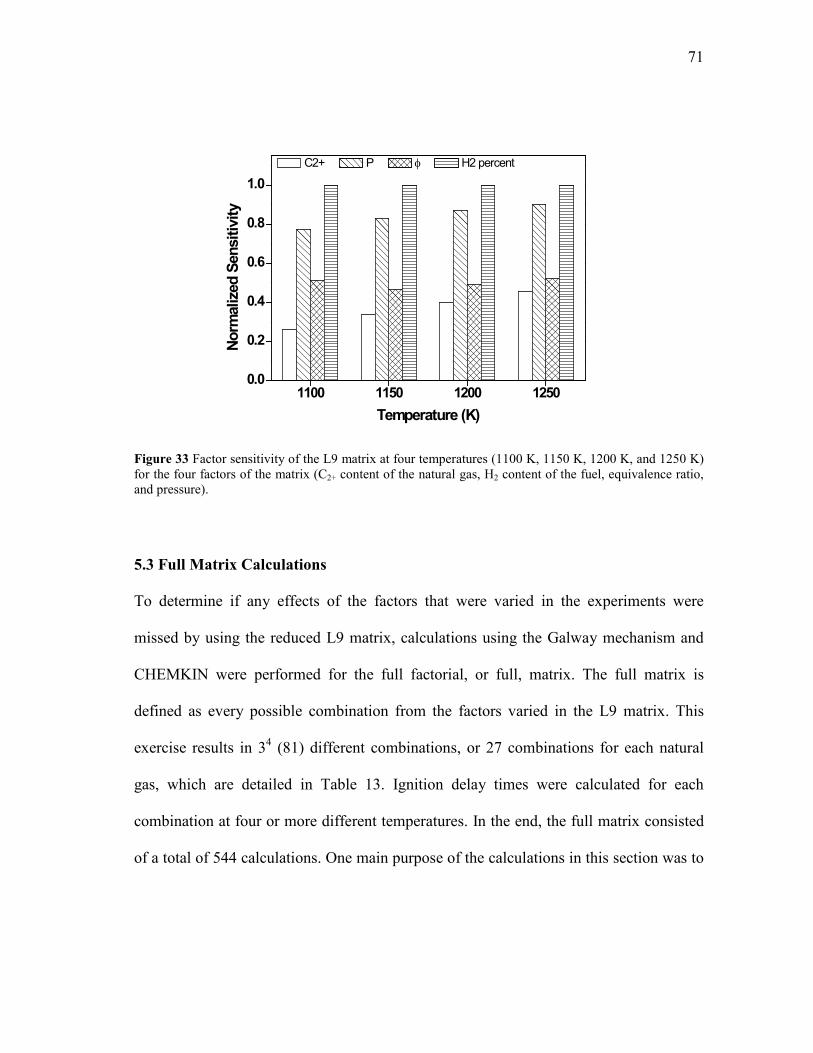
71
1100 1150 1200 12500.0
0.2
0.4
0.6
0.8
1.0
Norm
aliz
ed S
ensi
tivity
Temperature (K)
C2+ P φ H2 percent
Figure 33 Factor sensitivity of the L9 matrix at four temperatures (1100 K, 1150 K, 1200 K, and 1250 K) for the four factors of the matrix (C2+ content of the natural gas, H2 content of the fuel, equivalence ratio, and pressure).
5.3 Full Matrix Calculations
To determine if any effects of the factors that were varied in the experiments were
missed by using the reduced L9 matrix, calculations using the Galway mechanism and
CHEMKIN were performed for the full factorial, or full, matrix. The full matrix is
defined as every possible combination from the factors varied in the L9 matrix. This
exercise results in 34 (81) different combinations, or 27 combinations for each natural
gas, which are detailed in Table 13. Ignition delay times were calculated for each
combination at four or more different temperatures. In the end, the full matrix consisted
of a total of 544 calculations. One main purpose of the calculations in this section was to

72
demonstrate the utility of employing reduced matrices in lieu of full matrices when
studying the ignition (or other kinetic) behavior of fuel blends.
Similar to the correlations from the L9 matrix, the discussion of the full matrix is split
into combinations containing methane, NG2, and NG3. Using the full matrix
calculations, a separate L9 matrix was developed for each individual natural gas set.
These L9 matrices were the same as the L9 matrix originally described except the
natural gas was kept constant. Described in the following subsections are correlations
developed from the full matrix for each natural gas set and correlations developed from
the L9 matrix for each natural gas set. These correlations are compared to the full matrix
data as well as the L9 matrix data to determine if the L9 matrices of each natural gas
define the same trends seen in the full matrix of each natural gas. Additionally, a factor
sensitivity analysis was performed for each L9 matrix to predict how the effect of each
factor would change as the C2+ content of the base natural gas increases.

73
Table 13 Full matrix calculations performed for each natural gas (NG), methane, NG2, and NG3.
Combo Fuel %H2 φ P (atm)
1 NG 30 0.3 1
2 NG 30 0.3 10
3 NG 30 0.3 30
4 NG 30 0.5 1
5 NG 30 0.5 106 NG 30 0.5 307 NG 30 1 18 NG 30 1 109 NG 30 1 30
10 NG 60 0.3 111 NG 60 0.3 1012 NG 60 0.3 3013 NG 60 0.5 114 NG 60 0.5 1015 NG 60 0.5 3016 NG 60 1 117 NG 60 1 1018 NG 60 1 3019 NG 90 0.3 120 NG 90 0.3 1021 NG 90 0.3 3022 NG 90 0.5 123 NG 90 0.5 1024 NG 90 0.5 3025 NG 90 1 126 NG 90 1 1027 NG 90 1 30

74
5.3.1 Methane Calculations
The 27 possible combinations containing methane were calculated at four or more
temperatures each. Using these calculations, a full matrix correlation was constructed
using Eqn. 5. The coefficients that were found for this matrix are shown in Table 14. An
L9 matrix was developed for methane mixtures and is described in Table 15. The
correlation from this L9 matrix, also developed using Eqn. 5, is described by the
coefficients listed in Table 16.
Table 14 Correlation coefficients for a correlation developed from the full matrix calculations for methane.
Table 15 L9 Matrix for methane.
A x y z E R2
4.77x10⁻⁶ 1.44 -1.14 -0.82 31.2 0.931
Combo Fuel %H2 φ P (atm)
1 CH4 30 0.3 12 CH4 60 0.5 103 CH4 80 1 304 CH4 30 0.5 305 CH4 60 1 16 CH4 80 0.3 107 CH4 30 1 108 CH4 60 0.3 309 CH4 80 0.5 1

75
Table 16 Correlation coefficients for a correlation developed from the L9 matrix for methane.
An examination of the coefficients listed in Table 14 and Table 16 show relatively good
agreement. This favorable result indicates that the trends within the entire matrix of
methane combinations can be captured by using fewer combinations. For both
correlations, the exponential coefficient of methane, x, is positive (1.44 and 1.52). This
result shows that, as expected, the ignition delay time increases as the concentration of
methane in the fuel mixture increases (and the concentration of hydrogen decreases).
Conversely, the exponential coefficients of H2 and O2, y and z, respectively, are negative
(-1.14 and -1.17; and -0.82 and -0.92). In the hydrogen case, this result indicates that as
the H2 content of the fuel mixture increases, the ignition delay time will decrease. This
trend was expected since it is what was found from the original L9 matrix and because
the ignition delay times of pure hydrogen are shorter than the ignition delay times of
pure methane. The negative exponent for oxygen concentration indicates that as the
concentration of oxygen in the mixture decreases the ignition delay time will increase.
Additionally, the activation energies (E) found for these combinations (about 31
kcal/mol for both matrices) is relatively close to that found for the experimental methane
combinations (37 kcal/mol, on average, Table 3). This consistency indicates that the
combinations used in the full matrix came close to correctly estimating the activation
energies for methane combinations from the experiments.
A x y z E R2
3.44x10⁻⁶ 1.52 -1.17 -0.92 31.1 0.941

76
In Figure 34 and Figure 35, comparisons between the two correlations described above
are made to the methane L9 matrix data. Figure 34 shows the comparison between the
methane L9 data and predictions for the same data made using the full matrix
correlation. The points that are over predicted in this graph are from the combination
with 80% hydrogen in the fuel mixture at an equivalence ratio of 0.5 and a pressure of 1
atm. The ignition delay times that are significantly under predicted are from the
combination with 60% hydrogen in the fuel mixture with a phi of 0.5 and a pressure of
30 atm. Similarly, in Figure 35 the data from the methane L9 matrix is compared to the
predictions from the L9 matrix correlation for methane. The comparison appears to be
almost the same as that shown for the full matrix predictions. This agreement between
the two correlations indicates that the correlation from only the L9 matrix captures the
most significant aspects of the full-matrix correlation.
To further prove that the methane L9 matrix correlation captures the same features as the
full-matrix correlation, all of the data from the methane full matrix calculations were
compared to both correlations. The full matrix correlation is compared to the data in
Figure 36, and the methane L9 matrix correlation is compared to the data in Figure 37.
The similarity between the two figures shows that the L9 matrix captures all of the
aspects of changing the combinations and conditions that the full matrix does. Both
correlations do a poor job predicting long ignition delay times, but they produce similar
results. In general, the most under predicted ignition delay times are found for
combinations that are 80% hydrogen, while the most over predicted ignition delay times

77
are found for combinations that are 30% hydrogen. This dependence on H2 implies that
hydrogen addition has a nonlinear effect on the ignition delay times of methane mixtures
that is not captured by correlations of the form of Eqn. 5. While further analysis could be
performed to determine an appropriate correlation scheme, as was done for syngas
mixtures (Donato and Petersen, 2008), it is beyond the scope of the present work.
0 500 1000 1500 2000
0
500
1000
1500
2000
Corr
elat
ion
Pred
ictio
n (µ
sec)
CH4 L9 Matrix Data (µsec)
Full Matrix Correlation
Figure 34 Comparison of the data used in the methane L9 matrix to the full matrix correlation. The predicted data are plotted as a function of the real data values with a 1 to 1 line.

78
0 500 1000 1500 2000
0
500
1000
1500
2000
Corr
elat
ion
Pred
ictio
n (µ
sec)
CH4 L9 Matrix Data (µsec)
CH4 L9 Matrix Correlation
Figure 35 Comparison of the data used in the methane L9 matrix to the methane L9 matrix correlation. The predicted data are plotted as a function of the real data values with a 1 to 1 line.
0 500 1000 1500 2000
0
500
1000
1500
2000
Corr
elat
ion
Pred
ictio
n (µ
sec)
Full Matrix Data (µsec)
Full Matrix Correlation
Figure 36 Comparison of the data used in the full matrix to the methane full matrix correlation. The predicted data are plotted as a function of the real data values with a 1 to 1 line.

79
0 500 1000 1500 2000
0
500
1000
1500
2000
Corr
elat
ion
Pred
ictio
n (µ
sec)
Full Matrix Data (µsec)
CH4 L9 Matrix Correlation
Figure 37 Comparison of the data used in the full matrix to the methane L9 matrix correlation. The predicted data are plotted as a function of the real data values with a 1 to 1 line.
A final step of the analysis of the methane calculations from the methane L9 matrix was
to perform a factor sensitivity analysis for the matrix. Since the correlation from the L9
matrix and the correlation from the full matrix were proven to provide similar
predictions, only the nine combinations in the L9 matrix were used. Similar to the
previous factor sensitivity, correlations for each individual combination, listed in Table
17, were used to predict ignition delay times at a few temperatures.

80
Table 17 Correlations for individual combinations of the methane L9 matrix.
The factor sensitivity, described in detail previously, was performed at four temperatures
(1100 K, 1150 K, 1200 K, and 1250 K). The resulting factor sensitivities were
normalized and are shown in Figure 38. It is seen from this figure that hydrogen content
of the fuel mixture far outweighs any other factor. In fact, the hydrogen factor sensitivity
is more than double the sensitivity of any other factor at every temperature. This increase
in sensitivity to the hydrogen content of the fuel mixture from the experimental L9
matrix is likely due to the fact that methane has a significantly lower reactivity than pure
hydrogen and the other two natural gases used in the study. Adding hydrogen to pure
methane will almost always dramatically increase the reactivity of the mixture, despite
the pressure or equivalence ratio. The other two factors, pressure and equivalence ratio,
are seen to change order of importance as temperature increases. At lower temperatures,
equivalence ratio is more important than pressure. At higher temperatures, the pressure
of the mixture is more important than the equivalence ratio.
Combo A E (kcal/mol)
1 1.91x10⁻² 29.8
2 8.62x10⁻⁴ 31.0
3 3.87x10⁻⁵ 36.6
4 3.24x10⁻⁵ 42.6
5 4.26x10⁻² 24.9
6 8.79x10⁻⁶ 27.37 1.16x10⁻³ 36.18 1.59x10⁻⁵ 41.09 8.39x10⁻² 18.5

81
1100 1150 1200 12500.0
0.2
0.4
0.6
0.8
1.0
Norm
aliz
ed S
ensi
tivity
Temperature (K)
φ P H2 percent
Figure 38 Factor sensitivity of the methane L9 matrix at four temperatures (1100 K, 1150 K, 1200 K, and 1250 K) for the three factors of the matrix (H2 content of the fuel, equivalence ratio, and pressure).
5.3.2 NG2 Calculations
Similar to the methane calculations, full matrix calculations were performed for NG2
combinations. The same three factors were varied: hydrogen content of the fuel mixture,
equivalence ratio, and pressure. Using the 27 combinations from the full matrix
calculation, a correlation was developed, described by Table 18. Nine combinations
from the 27 were used to develop an L9 matrix from the calculations, described by Table
19. A correlation was derived from these 9 combinations and is described by Table 20.

82
Table 18 Correlation coefficients for a correlation developed from the full matrix calculations for NG2.
Table 19 L9 Matrix for NG2.
Table 20 Correlation coefficients for a correlation developed from the L9 matrix for NG2.
Similar to what was seen with the methane correlations, the coefficients for the two
correlations of NG2 calculations are very similar. This similarity again indicates that the
trends seen in all of the possible combinations of the full matrix can be predicted with
the same accuracy by only using the L9 matrix. The NG2 exponent, x, is positive so,
similar to methane, the ignition delay time increases as NG2 content increases. It is
A x y z E R2
4.71x10⁻⁷ 1.09 -0.68 -0.83 39.8 0.974
Combo Fuel %H2 φ P (atm)
1 NG2 30 0.3 1
2 NG2 60 0.5 10
3 NG2 80 1 30
4 NG2 30 0.5 30
5 NG2 60 1 16 NG2 80 0.3 107 NG2 30 1 108 NG2 60 0.3 309 NG2 80 0.5 1
A x y z E R2
2.90x10⁻⁷ 1.15 -0.67 -0.94 40.5 0.980

83
significant that the value for x in Table 20 (1.15) is lower than the value for x in Table 16
(1.52). This comparison shows that methane content has more effect on the combination
reactivity than NG2, or, in other words, decreasing the methane concentration by adding
hydrogen to the fuel mixture will have a greater effect than decreasing the NG2
concentration. This result was expected since the reactivity of methane is lower than
NG2. The coefficients for hydrogen and oxygen concentration were again found to be
negative; however, the exponent of the oxygen concentration, z, is larger than the
exponent for the hydrogen concentration, y, the opposite of what was found for the
methane correlations. The opposite trend indicates a shift in the impact of hydrogen
concentration to being almost equal to, if not less than, that of equivalence ratio and
pressure.
In Figure 39 and Figure 40, comparisons are made between the two correlations
presented above and the data used to make the L9 matrix. Figure 39 shows the
comparison between the L9 matrix data for NG2 compared to the predictions made by
the full matrix correlation at the same conditions. The NG2 full matrix correlation
appears to do a better job at predicting the data than the full matrix correlation for
methane. Similar to the methane combinations, the most over predicted points are for
combinations with 80% hydrogen in the fuel mixture at an equivalence ratio of 0.5 and a
pressure of 1 atm. There are two combinations that are under predicted: 60% hydrogen
with an equivalence ratio of 1 at a pressure of 1 and 60% hydrogen with an equivalence
ratio of 0.3 and a pressure of 30 atm. In Figure 40, the NG2 L9 matrix data are compared
84
to predictions from the NG2 L9 matrix. The plot looks similar to the previous figure, and
the same combinations are under and over predicted as observed with the full matrix
correlation. This result again indicates that the correlation from the NG2 L9 matrix
manages to capture the most significant aspects of the full matrix correlation, while
missing the same few aspects.
The complete set of data used to compile the full matrix correlation for NG2 was
compared to predictions from both the full matrix correlation, shown in Figure 41, and
the NG2 L9 matrix correlation, shown in Figure 42. The similarity between the two
figures indicates that the L9 matrix correlation is able to capture the same predictions as
the full matrix correlation, even without using the data from the additional combinations.
Additionally, both correlations do a better job of predicting the ignition delay times of
NG2 combinations than the previous correlations did for methane combinations. The
most under predicted ignition delay times are generally found for combinations with
30% hydrogen, while the most over predicted ignition delay times are generally found
for combinations with 80% hydrogen. This trend is again likely due to the nonlinear
effect of hydrogen addition to a hydrocarbon mixture. Although it is beyond the scope of
this work, further analysis could be performed to find additional correlations that model
this effect, similar to Donato and Petersen (2008).

85
0 500 1000 1500 2000 2500
0
500
1000
1500
2000
2500
Corr
elat
ion
Pred
ictio
n (µ
sec)
NG2 L9 Matrix Data (µsec)
Full Matrix Correlation
Figure 39 Comparison of the data used in the NG2 L9 matrix to the full matrix correlation. The predicted data are plotted as a function of the real data values with a 1 to 1 line.
0 500 1000 1500 2000 2500
0
500
1000
1500
2000
2500
Corr
elat
ion
Pred
ictio
n (µ
sec)
NG2 L9 Matrix Data (µsec)
NG2 L9 Matrix Correlation
Figure 40 Comparison of the data used in the NG2 L9 matrix to the NG2 L9 matrix correlation. The predicted data are plotted as a function of the real data values with a 1 to 1 line.

86
0 500 1000 1500 2000 2500
0
500
1000
1500
2000
2500
Corr
elat
ion
Pred
ictio
n (µ
sec)
Full Matrix Data (µsec)
Full Matrix Correlation
Figure 41 Comparison of the data used in the full matrix to the NG2 full matrix correlation. The predicted data are plotted as a function of the real data values with a 1 to 1 line.
0 500 1000 1500 2000 2500
0
500
1000
1500
2000
2500
Corr
elat
ion
Pred
ictio
n (µ
sec)
Full Matrix Data (µsec)
NG2 L9 Matrix Correlation
Figure 42 Comparison of the data used in the full matrix to the NG2 L9 matrix correlation. The predicted data are plotted as a function of the real data values with a 1 to 1 line.

87
The final step in the analysis of the NG2 L9 matrix was a factor sensitivity analysis for
the matrix. The correlation from the NG2 L9 matrix was found to be almost identical to
the correlation using the full matrix, so only the 9 combinations in the NG2 L9 matrix
were used. Correlations found for each individual combination of the NG2 L9 matrix,
listed in Table 21, were used to predict the ignition delay times of each combination at a
few different temperatures.
Table 21 Correlations for individual combinations of the NG2 L9 matrix.
A factor sensitivity was applied to the matrix as described earlier. Ignition delay times
were found at four temperatures (1100 K, 1150 K, 1200 K, and 1250 K), and the
resulting factor sensitivities were normalized for each temperature. Figure 43 shows that
the hydrogen content of the fuel mixture is again the main factor in determining the
ignition delay times of the combinations. However, the effect of hydrogen is less
important compared to the other factors than it was for the methane L9 matrix, especially
Combo A E (kcal/mol)
1 1.02x10⁻⁴ 39.9
2 2.62x10⁻⁵ 39.5
3 7.77x10⁻⁶ 40.8
4 1.02x10⁻⁵ 43.2
5 3.53x10⁻⁴ 36.8
6 1.74x10⁻⁵ 38.07 5.68x10⁻⁵ 41.18 2.23x10⁻⁶ 45.29 8.02x10⁻⁴ 30.5

88
at higher temperatures. Hydrogen likely plays less of a role in the reactivity of the NG2
combinations because the reactivity of NG2 is closer to the reactivity of pure hydrogen.
The correlations for NG2 already alluded to this reduced sensitivity to hydrogen, but the
factor sensitivity also demonstrates that the relative importance of hydrogen decreases
with temperature. The effects of pressure and equivalence ratio are shown to have a
greater effect relative to the hydrogen effect than they had on the methane combinations.
1100 1150 1200 12500.0
0.2
0.4
0.6
0.8
1.0
Norm
aliz
ed S
ensi
tivity
Temperature (K)
φ P H2 percent
Figure 43 Factor sensitivity of the NG2 L9 matrix at four temperatures (1100 K, 1150 K, 1200 K, and 1250 K) for the three factors of the matrix (H2 content of the fuel, equivalence ratio, and pressure).
5.3.3 NG3 Calculations
Full matrix and L9 calculations were also performed for NG3 combinations. Again,
hydrogen content of the fuel mixture, equivalence ratio, and pressure were varied
between the different combinations. From the full matrix calculations, including all 27
possible combinations, a correlation was developed, shown in Table 22. From the 27

89
combinations used in the full matrix calculations, nine combinations were used to
develop an NG3 L9 matrix, described in Table 23. Using the calculations of ignition
delay times for these nine combinations, a correlation was developed, described by
Table 24.
Table 22 Correlation coefficients for a correlation developed from the full matrix calculations for NG3.
Table 23 L9 Matrix for NG3.
Table 24 Correlation coefficients for a correlation developed from the L9 matrix for NG3.
A x y z E R2
1.08x10⁻⁷ 0.95 -0.50 -0.93 42.0 0.984
Combo Fuel %H2 φ P (atm)
1 NG3 30 0.3 1
2 NG3 60 0.5 10
3 NG3 80 1 30
4 NG3 30 0.5 30
5 NG3 60 1 16 NG3 80 0.3 107 NG3 30 1 108 NG3 60 0.3 309 NG3 80 0.5 1
A x y z E R2
1.30x10⁻⁷ 1.02 -0.49 -1.01 41.9 0.985

90
There is again excellent agreement between coefficients found for the full matrix
correlation (Table 22) and the L9 matrix correlation (Table 24). The values for the
individual exponents as well as the values for A and E are extremely similar. Therefore,
the trends seen in all 27 combinations can be predicted with the same accuracy using a
correlation with only 9 combinations. The R2 value for both correlations is greater than
0.98, which indicates that both correlations should also correspond quite will with the
data. As seen with the NG2 combinations, the exponent for the natural gas, x, is positive
while the exponents for hydrogen and oxygen concentrations, y and z, respectively, are
negative. Therefore, the ignition delay time will increase when the concentration of NG3
increases compared to hydrogen in the fuel mixture. Also, the ignition delay time will
increase when hydrogen or oxygen concentration decreases in the mixture. Since the
hydrogen exponent is even smaller than the oxygen exponent than for the NG2
combinations, the impact of hydrogen concentration will not be as significant as seen
before.
In Figure 44 and Figure 45 comparisons are made between the correlations for the full
matrix and the L9 matrix to the data used for the L9 matrix. A comparison between the
NG3 L9 matrix data to the predictions made by the full matrix correlation at the same
conditions is shown in Figure 44. For the most part, the full matrix correlation appears to
do an accurate job of predicting the L9 matrix data, which was expected due to the R2
value close to unity for this correlation. Similar to the correlation studies for methane
and NG2 combinations, the most over predicted ignition delay times are found for the

91
combination that is 80% hydrogen at an equivalence ratio of 0.5 and at a pressure of 1
atm. Also, as seen with the NG2 correlations, the most under predicted combinations are
60% hydrogen at an equivalence ratio of 1 and a pressure of 1 atm; and 60% hydrogen
with an equivalence ratio of 0.3 and a pressure of 30 atm. A similar comparison between
the L9 matrix correlation and the L9 matrix data is shown in Figure 45. As expected
from the similarity in the two correlations, the figures look almost identical. This
similarity again illustrates that the L9 matrix captures the features that are predicted by
using the full matrix for correlations.
The complete set of data used for the full matrix correlation of NG3 is compared to
predictions from the full matrix correlation in Figure 46 and to predictions from the L9
matrix correlation in Figure 47. The similarity between the two figures again illustrates
the effectiveness of using the L9 matrix to capture the trends seen in the full matrix.
Generally, as seen with the previous correlations, the 30% hydrogen combinations tend
to be the most under predicted, while the 80% hydrogen combinations tend to be the
most over predicted. This behavior is likely due to the fact that addition of hydrogen to
the combinations does not have a linear relationship with ignition delay time. Since Eqn.
5 is a linear correlation (on a log plot), the correlations presented are likely missing the
true effect of hydrogen addition to these combinations. However, it is beyond the scope
of this work to further develop the correlations, similar to what was performed by
Donato and Petersen (2008).

92
0 500 1000 1500 2000 2500 3000
0
500
1000
1500
2000
2500
3000
Corr
elat
ion
Pred
ictio
n (µ
sec)
NG3 L9 Matrix Data (µsec)
Full Matrix Correlation
Figure 44 Comparison of the data used in the NG3 L9 matrix to the full matrix correlation. The predicted data are plotted as a function of the real data values with a 1 to 1 line.
0 500 1000 1500 2000 2500 3000
0
500
1000
1500
2000
2500
3000
Corr
elat
ion
Pred
ictio
n (µ
sec)
NG3 L9 Matrix Data (µsec)
NG3 L9 Correlation
Figure 45 Comparison of the data used in the NG3 L9 matrix to the NG3 L9 matrix correlation. The predicted data are plotted as a function of the real data values with a 1 to 1 line.
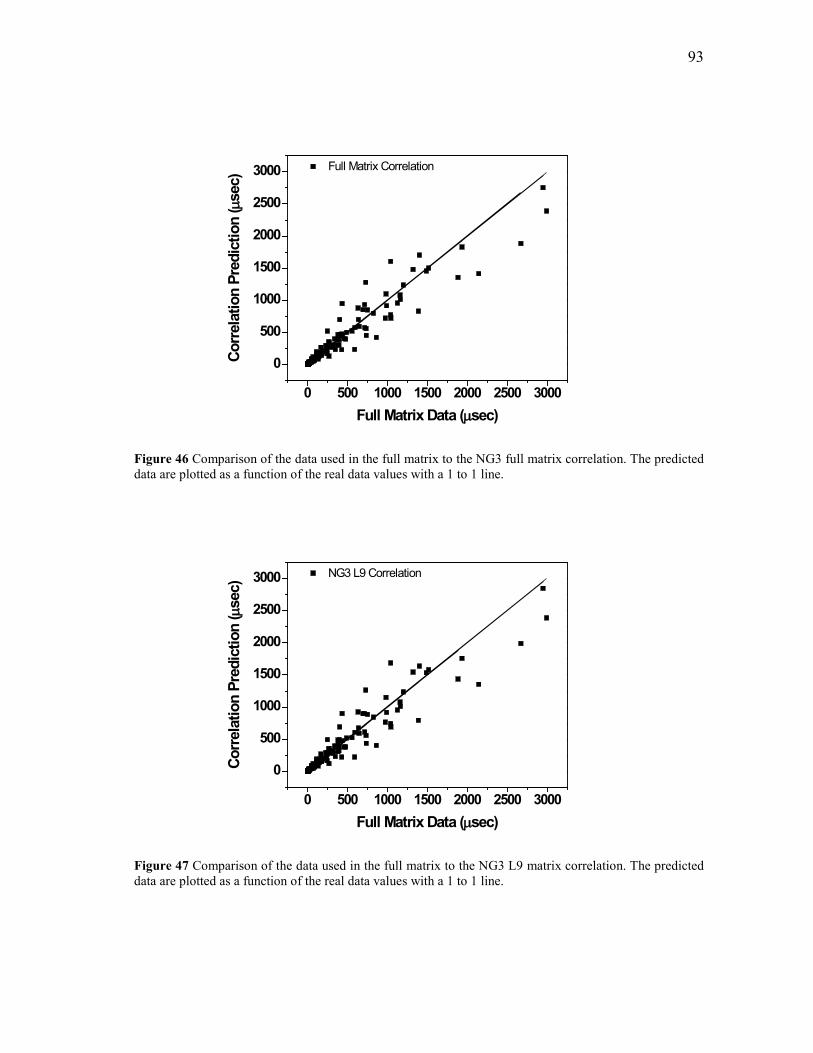
93
0 500 1000 1500 2000 2500 3000
0
500
1000
1500
2000
2500
3000
Corr
elat
ion
Pred
ictio
n (µ
sec)
Full Matrix Data (µsec)
Full Matrix Correlation
Figure 46 Comparison of the data used in the full matrix to the NG3 full matrix correlation. The predicted data are plotted as a function of the real data values with a 1 to 1 line.
0 500 1000 1500 2000 2500 3000
0
500
1000
1500
2000
2500
3000
Corr
elat
ion
Pred
ictio
n (µ
sec)
Full Matrix Data (µsec)
NG3 L9 Correlation
Figure 47 Comparison of the data used in the full matrix to the NG3 L9 matrix correlation. The predicted data are plotted as a function of the real data values with a 1 to 1 line.

94
Finally, a factor sensitivity analysis was performed for the NG3 L9 matrix. Since the
correlations from the L9 matrix and the full matrix were found to be almost identical,
only the 9 combinations from the L9 matrix were used for the factor sensitivity. Listed in
Table 25 are correlations found for each individual combination of the NG3 L9 matrix.
These correlations were used to predict the ignition delay times of each combination at a
few different temperatures.
Table 25 Correlations for individual combinations of the NG3 L9 matrix.
A factor sensitivity was performed on the L9 matrix, as described previously. Ignition
delay times were found at the same four temperatures (1100 K, 1150 K, 1200 K, and
1250 K), and the factor sensitivities for each factor were normalized at each temperature.
As seen Figure 48, the results are slightly different for NG3 than for the previous
combinations. Hydrogen and pressure are almost equally important. For the two lower
temperatures, hydrogen is most important, while at the two higher temperatures, pressure
Combo A E (kcal/mol)
1 5.12x10⁻⁵ 40.9
2 1.17x10⁻⁵ 41.7
3 4.87x10⁻⁶ 42.1
4 6.44x10⁻⁶ 43.5
5 1.17x10⁻⁴ 39.8
6 2.53x10⁻⁵ 36.87 3.10x10⁻⁵ 41.98 1.22x10⁻⁶ 46.49 4.20x10⁻⁴ 32.5
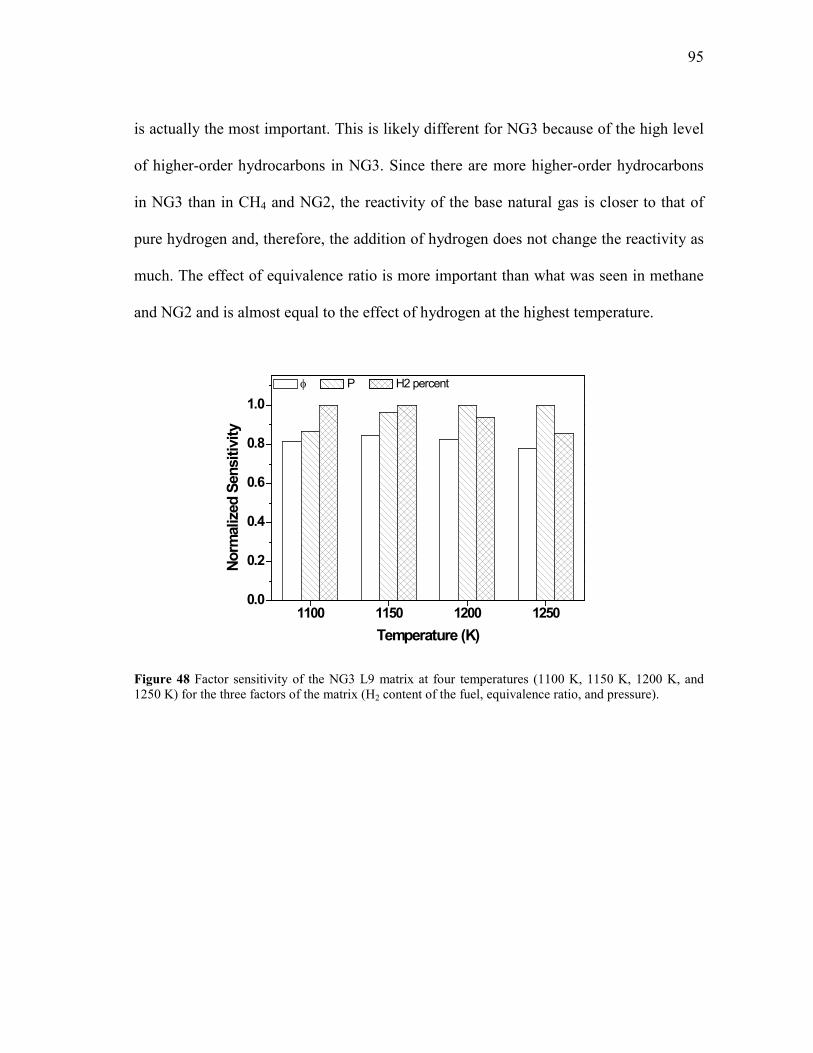
95
is actually the most important. This is likely different for NG3 because of the high level
of higher-order hydrocarbons in NG3. Since there are more higher-order hydrocarbons
in NG3 than in CH4 and NG2, the reactivity of the base natural gas is closer to that of
pure hydrogen and, therefore, the addition of hydrogen does not change the reactivity as
much. The effect of equivalence ratio is more important than what was seen in methane
and NG2 and is almost equal to the effect of hydrogen at the highest temperature.
1100 1150 1200 12500.0
0.2
0.4
0.6
0.8
1.0
Norm
aliz
ed S
ensi
tivity
Temperature (K)
φ P H2 percent
Figure 48 Factor sensitivity of the NG3 L9 matrix at four temperatures (1100 K, 1150 K, 1200 K, and 1250 K) for the three factors of the matrix (H2 content of the fuel, equivalence ratio, and pressure).

96
CHAPTER VI
CONCLUSION
Variations in fuel composition drive the need for fuel flexibility in gas turbine
combustors. Recently, interest has grown in using natural gases with high levels of
hydrogen in current gas turbines. For reheat gas turbines, the ignition delay times of
different fuels are of interest for two reasons: first, the ignition delay time must be longer
than the residence time of the fuel in the mixer before the primary burner to prevent
early ignition; and second, the ignition delay time must allow for stabilization of the
flame in the secondary burner. Although there have been multiple studies on hydrogen
ignition delay times and on ignition delay times of the various hydrocarbons of which
most natural gases are composed, there have been few experimental studies performed
on the ignition delay times of natural gases with high levels of hydrogen.
The study described herein looked at the impact of four different factors on ignition
delay time: higher-order hydrocarbon content of a natural gas, hydrogen content of a fuel
mixture, equivalence ratio, and pressure. An L9 matrix was developed to study all four
factors in an efficient manner, and each factor was given three levels: higher-order
hydrocarbon content was 0, 18.75, or 37.5%; hydrogen content of the total fuel mixture
was 30, 60, or 80%; equivalence ratio was 0.3, 0.5, or 1; and experiments were
performed at pressures of 1, 10, or 30 atm. Shock-tube experiments were performed for
nine combinations of these factors with mixtures that were diluted in 90%, and
experimental temperatures ranged from 1092 K to 1722 K. The Galway chemical
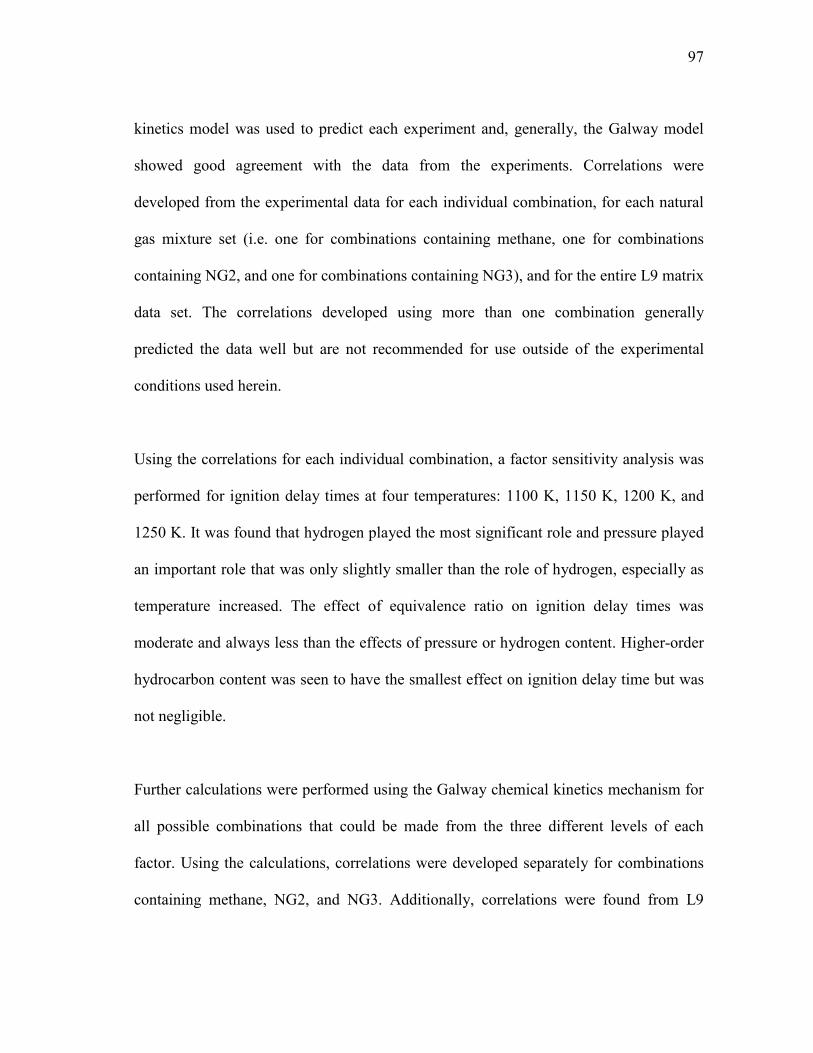
97
kinetics model was used to predict each experiment and, generally, the Galway model
showed good agreement with the data from the experiments. Correlations were
developed from the experimental data for each individual combination, for each natural
gas mixture set (i.e. one for combinations containing methane, one for combinations
containing NG2, and one for combinations containing NG3), and for the entire L9 matrix
data set. The correlations developed using more than one combination generally
predicted the data well but are not recommended for use outside of the experimental
conditions used herein.
Using the correlations for each individual combination, a factor sensitivity analysis was
performed for ignition delay times at four temperatures: 1100 K, 1150 K, 1200 K, and
1250 K. It was found that hydrogen played the most significant role and pressure played
an important role that was only slightly smaller than the role of hydrogen, especially as
temperature increased. The effect of equivalence ratio on ignition delay times was
moderate and always less than the effects of pressure or hydrogen content. Higher-order
hydrocarbon content was seen to have the smallest effect on ignition delay time but was
not negligible.
Further calculations were performed using the Galway chemical kinetics mechanism for
all possible combinations that could be made from the three different levels of each
factor. Using the calculations, correlations were developed separately for combinations
containing methane, NG2, and NG3. Additionally, correlations were found from L9

98
matrices that were developed for each baseline natural gas. A comparison between the
correlations from the full matrix calculations and from the calculations for the L9 matrix
for each natural gas showed the predictions were similar for both correlations.
Additionally, data points that were poorly predicted by one correlation were also poorly
predicted by the other. Although it was determined that these linear correlations could
not completely capture the ignition delay time changes due to the complicated impact of
hydrogen addition, the comparison proved that a reduced L9 matrix could indeed capture
the same trends and produce a similar correlation to that provided by the full matrix.
It is recommended that further experiments be performed to develop correlations for
each baseline natural gas that can be used outside of the experimental conditions herein.
These additional experiments would improve the predicting capability of the correlations
for each natural gas set. Moreover, experiments for each of the L9 matrices presented for
the individual natural gases would provide three comprehensive correlations that could
be used for different pressures, levels of hydrogen addition, and equivalence ratios.
Furthermore, to develop correlations that properly predict the effect of hydrogen
addition, it is recommended that other correlation methods be explored.

99
REFERENCES
Aul, C.J. (2009) An Experimental Study into the Ignition of Methane and Ethane Blends
in a New Shock-Tube Facility. A Thesis, Texas A&M University.
Bourque, G., Healy, D., Curran, H., Zinner, C., Kalitan, D., de Vries, J., Aul, C., and
Petersen, E. (2010) Ignition and Flame Speed Kinetics of Two Natural Gas
Blends with High Levels of Heavier Hydrocarbons. J. Eng. Gas Turbines Power,
132, 21504-21504.
Brower, M., Petersen, E., Metcalfe, W., Curran, H., Furi, M., Bourque, G., Aluri, N., and
Guethe, F. (2012) Ignition Delay Time and Laminar Flame Speed Calculations
for Natural Gas/Hydrogen Blends at Elevated Pressures. ASME Paper GT2012-
69310, ASME Turbo Expo, June 11-15, 2012, Copenhagen, Denmark.
Cheng, R.K., and Oppenheim, A.K. (1984) Autoignition in Methane-Hydrogen
Mixtures. Combust. Flame, 58, 125-139.
Crossley, R.W., Dorko, E.A., Scheller, K., and Burcat, A. (1972) The Effect of Higher
Alkanes on the Ignition of Methane-Oxygen-Argon Mixtures in Shock Waves.
Combust. Flame, 19, 373-378.
Davis, S.G., Law, C.K., and Wang, H. (1999) Propene Pyrolysis and Oxidation Kinetics
in a Flow Reactor and Laminar Flames. Combust. Flame, 199, 375-399.
de Vries, J., and Petersen, E.L. (2007) Autoignition of methane-based fuel blends under
gas turbine conditions. Proc. Combust. Instit., 31, 3163-3171.
Donato, N.S., and Petersen, E.L. (2008) Simplified Correlation Models for CO/H2
Chemical Reaction Times. Int. J. Hydrogen Energy, 33, 7565-7579.
Fleck, J., Griebel, P., Steinberg, A.M., Stoehr, M., Aigner, M., and Ciani, A. (2012)
Autoignition Limits of Hydrogen at Relevant Reheat Combustor Operating
Conditions. J. Eng. Gas Turbines Power, 134, 41502-41502.

100
Fotache, C.G., Kreutz, T.G., and Law, C.K. (1997) Ignition of Hydrogen-Enriched
Methane by Heated Air. Combust. Flame, 110, 429-440.
Güthe, F., Hellat, J., and Flohr, P. (2009) The Reheat Concept: The Proven Pathway to
Ultralow Emissions and High Efficiency and Flexibility. J. Eng. Gas Turbines
Power, 131, 21503 – 21503.
Hall, J.M., and Petersen, E.L. (2006) An Optimized Kinetics Model for OH
Chemiluminescence at High Temperatures and Atmospheric Pressures. Int. J.
Chem. Kinet.,38, 714-724.
Healy, D., Kopp, M.M., Polley, N.L., Petersen, E.L., Bourque, G., Curran, H.J., (2010-a)
Methane/n-Butane Ignition Delay Measurements at High Pressure and Detailed
Chemical Kinetic Simulations. Energy Fuels, 24, 1617-1627.
Healy, D., Kalitan, D.M., Aul, C.J., Petersen, E.L., Bourque, G., and Curran, H.J. (2010-
b) Oxidation of C1-C5 Alkane Quinternary Natural Gas Mixtures at High
Pressures. Energy Fuels, 24, 1521-1528.
Herzler, J. and Naumann, C. (2009) Shock-tube Study of the Ignition of
Methane/Ethane/Hydrogen Mixtures with Hydrogen Contents from 0% to 100%
at Different Pressures. Proc. Combust. Instit., 32, 213-220.
Higgin, R.M.R., Williams, A. (1969) A Shock-Tube Investigation of the Ignition of Lean
Methane and n-Butane Mixtures with Oxygen. Proc. Combust. Instit., 12, 579-
590.
Holton, M. M., Gokularkrishnan, P., Klassen, M.S., Roby, R.J., and Jackson, G.S.
(2010) Autoignition Delay Time Measurements of Methane, Ethane, and Propane
Pure Fuels and Methane-Based Fuel Blends. J. Eng. Gas Turbines Power, 132,
91502 – 91502.
Huang, J., Bushe, W.K., Hill, P.G., and Munshi, S.R. (2006) Experimental and Kinetic
Study of Shock Initiated Ignition in Homogeneous Methane-Hydrogen-Air
Mixtures at Engine-Relevant Conditions. Int. J. Chem. Kinet., 38, 221-233.
101
Huang, J., Hill, P.G., Bushe, W.K., and Munshi, S.R. (2003) Shock-Tube Study of
Methane Ignition under Engine-Relevant Conditions: Experiments and
Modeling. Combust. Flame, 136, 25-42.
Reaction Design, Inc. (2011) CHEMKIN 10112, San Diego.
Laskin, A., Wang, H., and Law, C.K. (2000) Detailed Kinetic Model of 1,3-Butadiene
Oxidation at High Temperatures. Int. J. Chem. Kinet., 32, 589-614.
Law, C.K., (2006) Combustion Physics, 1st ed. Cambridge University Press, New York,
89-93.
Lieuwen, T., McDonell, V., Petersen, E., and Santavicca, D. (2008) Fuel Flexibility
Influences on Premixed Combustor Blowout, Flashback, Autoignition, and
Stability. J. Eng. Gas Turbines Power, 130, 11506-11506.
Lifshitz, A., Scheller, K., Burcat, A., and Skinner, G.B. (1971) Shock-Tube Investigation
of Ignition in Methane-Oxygen-Argon Mixtures. Combust. Flame, 16, 311-321.
Metcalfe, W.K., Burke, S.M., Aul, C.J., Petersen, E.L., and Curran, H.J. (2011) A
Detailed Chemical Kinetic Modelling and Experimental Study of C1 – C2
Hydrocarbons. Fifth Europ. Combust. Meet., June 28 – July 1, 2011, Cardiff,
Wales.
Ó Conaire, M., Curran, H.J., Simmie, J.M., Pitz, W.J., and Westbrook, C.K. (2004) A
Comprehensive Modeling Study of Hydrogen Oxidation. Int. J. Chem. Kinet., 36,
603-622.
Petersen, E.L. (2009) Interpreting Endwall and Sidewall Measurements in Shock-Tube
Ignition Studies. Combust. Sci. Tech., 181, 1123-1144.
Petersen, E.L., Hall, J.M., Smith, S.D., de Vries, J., Amadio, A.R., and Crofton, M.W.
(2007-a) Ignition of Lean Methane-Based Fuel Blends at Gas Turbine Pressures.
J. Eng. Gas Turbine Power, 129, 937-944.

102
Petersen, E.L., Kalitan, D.M., Simmons, S., Bourque, G., Curran, H.J., Simmie, J.M.
(2007-b) Methane/Propane Oxidation at High Pressures: Experimental and
Detailed Chemical Kinetic Modeling. Proc. Combust. Instit., 31, 447-454.
Petersen, E.L., Rickard, M.J.A., Crofton, M.W., Abbey, E.D., Traum, M.J., and Kalitan
D.M. (2005) A Facility for Gas- and Condensed-Phase Measurements Behind
Shock Waves. Meas. Sci. Technol., 16, 1716.
Ross, P.J. (1988) Taguchi Techniques for Quality Engineering. McGraw-Hill, New
York, 101-114.
Slack, M.W. (1977) Rate Coefficient for H + O2 + M = HO2 + M Evaluated from Shock
Tube Measurements of Induction Times. Combust. Flame, 28, 241-249.
Spadaccini, L. J., and Colket III, M. B. (1994) Ignition delay characteristics of methane
fuels. Prog. Energy Combust. Sci., 20, 431-460.
Turns, S.R. (2000) An Introduction to Combustion: Concepts and Applications, 2nd ed.,
McGraw Hill, Boston, 253-283.
Zhang, Y., Zuohua, H., Wei, L. Zhang, J., and Law, C.K. (2012) Experimental and
Modeling Study on Ignition Delays of Lean Mixtures of Methane, Hydrogen,
Oxygen, and Argon at Elevated Pressures. Combust. Flame, 159, 918-931.

103
APPENDIX
Table 26 Experimental data and conditions for combination 1.
Table 27 Experimental data and conditions for combination 2.
CH4 (%) H2 (%) O2 (%) Ar (%) H2 (% fuel) φ P (atm) T (K) τign (µsec)
1.14 0.487 8.38 90 30 0.3 1.67 1283 1764.1
1.14 0.487 8.38 90 30 0.3 1.62 1311 1108.7
1.14 0.487 8.38 90 30 0.3 1.62 1354 865.3
1.14 0.487 8.38 90 30 0.3 1.59 1397 574.1
1.14 0.487 8.38 90 30 0.3 1.60 1454 460.71.14 0.487 8.38 90 30 0.3 1.56 1529 289.21.14 0.487 8.38 90 30 0.3 1.55 1555 195.81.14 0.487 8.38 90 30 0.3 1.54 1600 169.91.14 0.487 8.38 90 30 0.3 1.51 1645 132.71.14 0.487 8.38 90 30 0.3 1.55 1722 98.7
CH4 (%) H2 (%) O2 (%) Ar (%) H2 (% fuel) φ P (atm) T (K) τign (µsec)
1.25 1.88 6.88 90 60 0.5 10.32 1116 1902.91.25 1.88 6.88 90 60 0.5 10.17 1141 1144.11.25 1.88 6.88 90 60 0.5 10.10 1153 972.61.25 1.88 6.88 90 60 0.5 9.86 1168 651.81.25 1.88 6.88 90 60 0.5 9.81 1186 504.51.25 1.88 6.88 90 60 0.5 9.77 1214 411.91.25 1.88 6.88 90 60 0.5 10.49 1234 325.61.25 1.88 6.88 90 60 0.5 10.01 1250 255.41.25 1.88 6.88 90 60 0.5 10.01 1286 165.01.25 1.88 6.88 90 60 0.5 10.00 1317 118.7
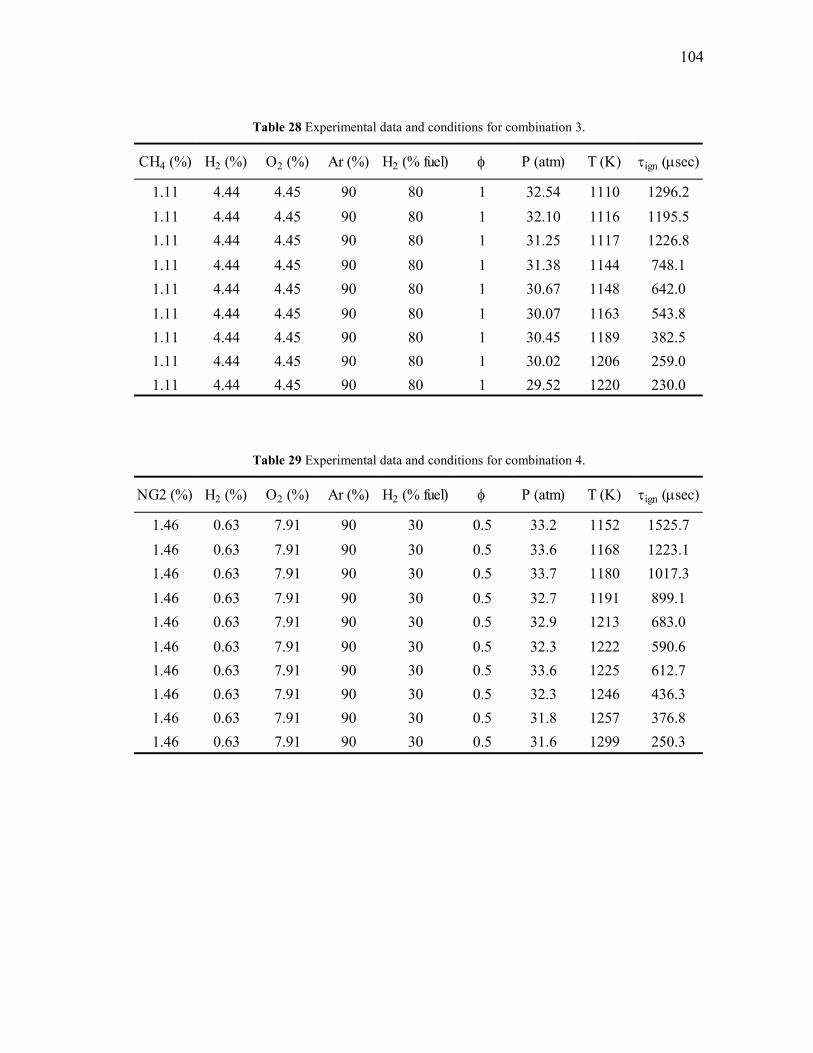
104
Table 28 Experimental data and conditions for combination 3.
Table 29 Experimental data and conditions for combination 4.
CH4 (%) H2 (%) O2 (%) Ar (%) H2 (% fuel) φ P (atm) T (K) τign (µsec)
1.11 4.44 4.45 90 80 1 32.54 1110 1296.21.11 4.44 4.45 90 80 1 32.10 1116 1195.51.11 4.44 4.45 90 80 1 31.25 1117 1226.81.11 4.44 4.45 90 80 1 31.38 1144 748.11.11 4.44 4.45 90 80 1 30.67 1148 642.01.11 4.44 4.45 90 80 1 30.07 1163 543.81.11 4.44 4.45 90 80 1 30.45 1189 382.51.11 4.44 4.45 90 80 1 30.02 1206 259.01.11 4.44 4.45 90 80 1 29.52 1220 230.0
NG2 (%) H2 (%) O2 (%) Ar (%) H2 (% fuel) φ P (atm) T (K) τign (µsec)
1.46 0.63 7.91 90 30 0.5 33.2 1152 1525.71.46 0.63 7.91 90 30 0.5 33.6 1168 1223.11.46 0.63 7.91 90 30 0.5 33.7 1180 1017.31.46 0.63 7.91 90 30 0.5 32.7 1191 899.11.46 0.63 7.91 90 30 0.5 32.9 1213 683.01.46 0.63 7.91 90 30 0.5 32.3 1222 590.61.46 0.63 7.91 90 30 0.5 33.6 1225 612.71.46 0.63 7.91 90 30 0.5 32.3 1246 436.31.46 0.63 7.91 90 30 0.5 31.8 1257 376.81.46 0.63 7.91 90 30 0.5 31.6 1299 250.3

105
Table 30 Experimental data and conditions for combination 5.
Table 31 Experimental data and conditions for combination 6.
NG2 (%) H2 (%) O2 (%) Ar (%) H2 (% fuel) φ P (atm) T (K) τign (µsec)
1.74 2.61 5.64 90 60 1 1.72 1203 1779.41.74 2.61 5.64 90 60 1 1.71 1220 1546.81.74 2.61 5.64 90 60 1 1.72 1241 1133.61.74 2.61 5.64 90 60 1 1.64 1266 817.71.74 2.61 5.64 90 60 1 1.66 1295 620.51.74 2.61 5.64 90 60 1 1.66 1309 534.91.74 2.61 5.64 90 60 1 1.71 1346 329.91.74 2.61 5.64 90 60 1 1.66 1349 321.91.74 2.61 5.64 90 60 1 1.68 1382 279.61.74 2.61 5.64 90 60 1 1.64 1387 261.71.74 2.61 5.64 90 60 1 1.61 1404 192.91.74 2.61 5.64 90 60 1 1.64 1443 169.6
NG2 (%) H2 (%) O2 (%) Ar (%) H2 (% fuel) φ P (atm) T (K) τign (µsec)
0.501 2.00 7.49 90 80 0.3 10.24 1092 1593.40.501 2.00 7.49 90 80 0.3 9.87 1101 1423.30.501 2.00 7.49 90 80 0.3 10.34 1118 820.20.501 2.00 7.49 90 80 0.3 10.35 1129 615.90.501 2.00 7.49 90 80 0.3 10.23 1131 557.90.501 2.00 7.49 90 80 0.3 10.02 1145 464.40.501 2.00 7.49 90 80 0.3 10.24 1147 419.60.501 2.00 7.49 90 80 0.3 10.24 1166 364.80.501 2.00 7.49 90 80 0.3 10.07 1168 302.50.501 2.00 7.49 90 80 0.3 10.48 1187 295.20.501 2.00 7.49 90 80 0.3 10.33 1196 188.6

106
Table 32 Experimental data and conditions for combination 7.
Table 33 Experimental data and conditions for combination 8.
NG3 (%) H2 (%) O2 (%) Ar (%) H2 (% fuel) φ P (atm) T (K) τign (µsec)
2.17 0.928 6.91 90 30 1 9.76 1192 1584.42.17 0.928 6.91 90 30 1 9.63 1199 1404.12.17 0.928 6.91 90 30 1 9.60 1214 1274.02.17 0.928 6.91 90 30 1 9.37 1228 1039.72.17 0.928 6.91 90 30 1 9.97 1258 623.32.17 0.928 6.91 90 30 1 9.75 1261 598.72.17 0.928 6.91 90 30 1 10.14 1302 401.72.17 0.928 6.91 90 30 1 9.95 1312 370.62.17 0.928 6.91 90 30 1 9.35 1335 303.52.17 0.928 6.91 90 30 1 10.02 1349 257.32.17 0.928 6.91 90 30 1 9.97 1374 204.62.17 0.928 6.91 90 30 1 9.87 1381 186.4
NG3 (%)
H2 (%) O2 (%) Ar (%) H2 (% fuel) φ P (atm) T (K) τign (µsec)
0.670 1.01 8.32 90 60 0.3 33.2 1134 1377.1
0.670 1.01 8.32 90 60 0.3 32.8 1158 949.5
0.670 1.01 8.32 90 60 0.3 33.6 1161 853.1
0.670 1.01 8.32 90 60 0.3 32.1 1167 726.6
0.670 1.01 8.32 90 60 0.3 32.7 1190 531.70.670 1.01 8.32 90 60 0.3 32.9 1198 455.10.670 1.01 8.32 90 60 0.3 32.3 1206 416.40.670 1.01 8.32 90 60 0.3 32.2 1225 303.90.670 1.01 8.32 90 60 0.3 32.3 1247 231.80.670 1.01 8.32 90 60 0.3 31.9 1253 213.5

107
Table 34 Experimental data and conditions for combination 9.
0 500 1000 1500 2000
0
500
1000
1500
2000
Combo 1 Correlation
Corr
elat
ion
(µse
c)
Experimental Data (µsec)
Figure 49 Comparison of combination 1 data to the combination 1 correlation. The predicted data are plotted as a function of the real data values with a 1 to 1 line.
NG3 (%) H2 (%) O2 (%) Ar (%) H2 (% fuel) φ P (atm) T (K) τign (µsec)
0.669 2.68 6.66 90 80 0.5 1.87 1112 1330.50.669 2.68 6.66 90 80 0.5 1.77 1121 1189.20.669 2.68 6.66 90 80 0.5 1.81 1151 793.40.669 2.68 6.66 90 80 0.5 1.77 1152 713.20.669 2.68 6.66 90 80 0.5 1.79 1177 580.80.669 2.68 6.66 90 80 0.5 1.76 1183 501.80.669 2.68 6.66 90 80 0.5 1.70 1219 336.20.669 2.68 6.66 90 80 0.5 1.66 1233 258.70.669 2.68 6.66 90 80 0.5 1.67 1258 207.50.669 2.68 6.66 90 80 0.5 1.68 1280 174.5

108
0 500 1000 1500 2000
0
500
1000
1500
2000 Combo 2 Correlation
Corr
elat
ion
(µse
c)
Experimental Data (µsec)
Figure 50 Comparison of combination 2 data to the combination 2 correlation. The predicted data are plotted as a function of the real data values with a 1 to 1 line.
0 500 1000 15000
500
1000
1500 Combo 3 Correlation
Corr
elat
ion
(µse
c)
Experimental Data
Figure 51 Comparison of combination 3 data to the combination 3 correlation. The predicted data are plotted as a function of the real data values with a 1 to 1 line.
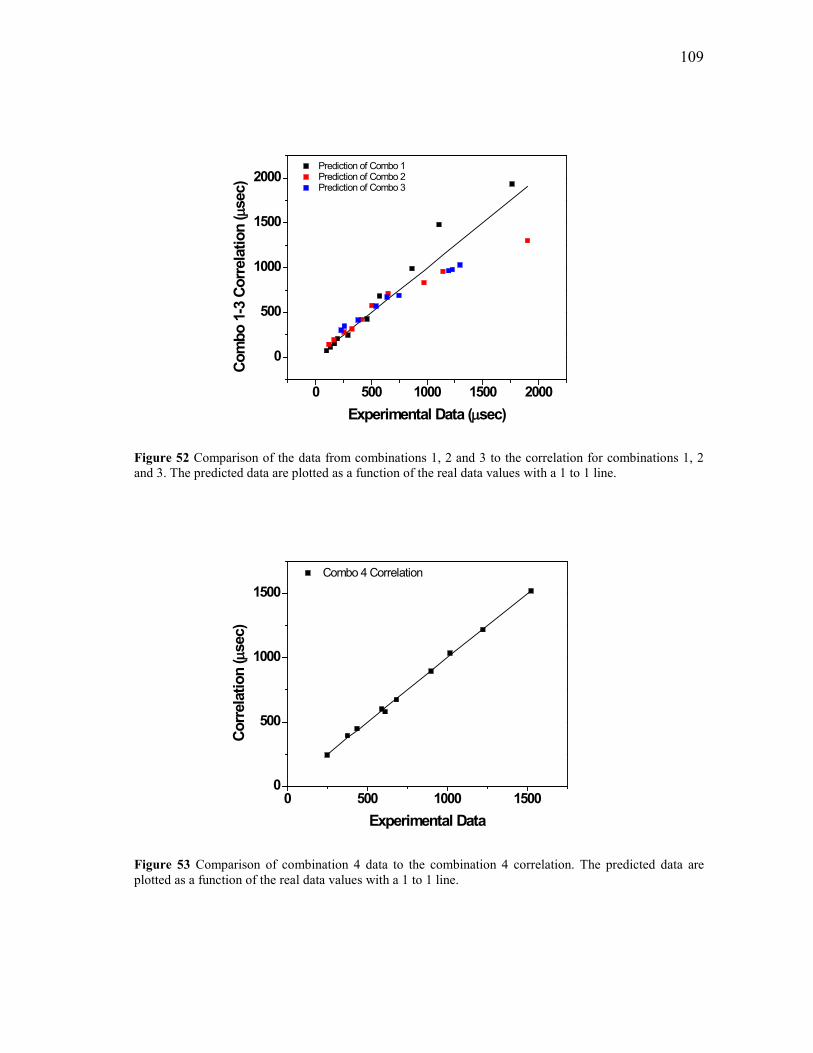
109
0 500 1000 1500 2000
0
500
1000
1500
2000
Prediction of Combo 1 Prediction of Combo 2 Prediction of Combo 3
Com
bo 1
-3 C
orre
latio
n (µ
sec)
Experimental Data (µsec)
Figure 52 Comparison of the data from combinations 1, 2 and 3 to the correlation for combinations 1, 2 and 3. The predicted data are plotted as a function of the real data values with a 1 to 1 line.
0 500 1000 15000
500
1000
1500 Combo 4 Correlation
Corr
elat
ion
(µse
c)
Experimental Data
Figure 53 Comparison of combination 4 data to the combination 4 correlation. The predicted data are plotted as a function of the real data values with a 1 to 1 line.

110
0 500 1000 1500 2000
0
500
1000
1500
2000 Combo 5 Correlation
Corr
elat
ion
(µse
c)
Experimental Data (µsec)
Figure 54 Comparison of combination 5 data to the combination 5 correlation. The predicted data are plotted as a function of the real data values with a 1 to 1 line.
0 500 1000 1500
0
500
1000
1500
2000 Combo 6 Correlation
Corr
elat
ion
(µse
c)
Experimental Data
Figure 55 Comparison of combination 6 data to the combination 6 correlation. The predicted data are plotted as a function of the real data values with a 1 to 1 line.

111
0 500 1000 15000
500
1000
1500 Prediction of Combo 4 Prediction of Combo 5 Prediction of Combo 6
Com
bo 4
- 6
Corr
elat
ion
(µse
c)
Experimental Data (µsec)
Figure 56 Comparison of the data from combinations 4, 5, and 6 to the correlation for combinations 4, 5, and 6. The predicted data are plotted as a function of the real data values with a 1 to 1 line.
0 500 1000 15000
500
1000
1500 Combo 7 Correlation
Corr
elat
ion
Experimental Data (µsec)
Figure 57 Comparison of combination 7 data to the combination 7 correlation. The predicted data are plotted as a function of the real data values with a 1 to 1 line.

112
0 500 1000 15000
500
1000
1500 Combo 8 Correlation
Corr
elat
ion
(µse
c)
Experimental Data
Figure 58 Comparison of combination 8 data to the combination 8 correlation. The predicted data are plotted as a function of the real data values with a 1 to 1 line.
0 500 1000 15000
500
1000
1500 Combo 9 Correlation
Corr
elat
ion
(µse
c)
Experimental Data
Figure 59 Comparison of combination 9 data to the combination 9 correlation. The predicted data are plotted as a function of the real data values with a 1 to 1 line.

113
0 500 1000 15000
500
1000
1500 Prediction of Combo 7 Prediction of Combo 8 Prediction of Combo 9
Com
bo 7
- 9
Corr
elat
ion
(µse
c)
Experimental Data (µsec)
Figure 60 Comparison of the data from combinations 7, 8, and 9 to the correlation for combinations 7, 8, and 9. The predicted data are plotted as a function of the real data values with a 1 to 1 line.


![Research Article Numerical and Experimental Research of ...of the established [ ] integrated ignition characteristics (especially ignition delay time ) can be considered as high values](https://img.dokumen.tips/doc/110x75/60ea10ec318bfb5fb13c7e0e/research-article-numerical-and-experimental-research-of-of-the-established-.jpg)