Embed Size (px)
Citation preview
To: Mayor and City Councilmembers From: Tho Kraus, Assistant City Manager/Administrative Services
Through: John J. Caulfield, City Manager Date: September 14, 2015 Subject: Six-Year Financial Forecast Update INTRODUCTION The City’s financial policy requires the City to prepare a financial forecast for six years to include the current budget period. The projection extends current operations to determine if the services are sustainable and the magnitude of, if any, future financing gaps. This glimpse into the future allows the City to proactively plan and implement corrective measures over time to avoid sudden drastic changes in service levels and/or in revenues. The original, preliminary six-year financial forecast was developed in October 2014 for the 2015/2016 biennial budget. It has been updated as part of the mid-biennial budget process and will continue to be updated as we continue to have a better understanding of the City’s economic conditions. Items in this report include: an executive summary; financial forecast narrative that serves as a revenue and expenditure manual; and the six-year forecast. The expenditure portion of the narrative will be enhanced as we approach the development of the 2017/2018 biennial budget. The focus of this report is primarily on the General and Street O&M Funds. A complete listing of all items in all funds will be incorporated in the 2015/2016 mid-biennial budget adjustments memo which is scheduled for City Council review on September 28, 2015. GENERAL & STREET O&M FUND – HIGHLIGHTS OF “NEW” ITEMS IN 2015/2016 Independent Salary Commission Decision, Ongoing – Add $21,175 in 2015 and $46,200 in 2016 to implement the City’s first Independent Salary Commission decision on City Council salaries. City Manager Department Interns, 1-Time – Add $18,800 of expenditures for 2 interns in the City Manager Department funded by Finance Division position vacancy savings. Public Defender, Ongoing – Add $15,000 in 2015 and $66,200 in 2016 for total expenditures of $400,000 in 2015 and $451,200 in 2016.
2
Position Realignment (Permit Coordinator, offset by Development Services Revenue), Ongoing – Add $18,300 in 2015 and $42,100 in 2015 to account for the costs of the realignment of the Office Assistant position to Permit Coordinator, funded by additional development services revenue. Tacoma Pierce County Economic Development Board, Ongoing – Add $5,000 in 2016 to bring the current commitment level from $15,000 to $20,000. Garbage Utility Savings, Ongoing – Eliminate garbage utilities paid by the City with the new contract to be implemented July 1, 2016. The estimated savings in 2016 is 25,000 (six months of savings). South Sound 911 Dispatch Services, Ongoing – Add $26,059 in 2016 bringing the total estimated cost for dispatch services, including City of Tacoma radio fees to $2,137,469. Puget Sound Clean Air Assessment, Ongoing – Add $5,357 in 2016 for the Puget Sound Clean Air Assessment, which will increase the budget to a total of $36,332. The agency’s Board adopted the rate of 81 cents per capita (a 10 cent increase) to fund critical regional public health and climate protection work. This is the second part of a two-year planned increase that started in 2015.The City’s portion of the per capita is based on a formula using the City’s population and assessed valuation of taxable property, as defined by the Washington State Clean Air Act (RCW 70.94). Transfer to Fund 504 Fleet & Equipment Fund, 1-Time – Add $233,239 in 2016 to replenish the Fleet & Equipment Fund replacement reserves. In June 2015 the City Council approved the transfer from the Fleet & Equipment Fund to the Information Technology Fund to provide for much needed basic information technology related needs. The goal was to make the fleet and equipment reserves whole by the end of 2016 through expenditure savings and/or use of revenues received above and beyond estimates 2016 WCIA Liability Assessment, Ongoing – Appropriate an additional $10,500 in 2015 and $187,500 in 2016 due to an increase in assessments a result of paying for the City’s past claims and losses dating back to 2010.
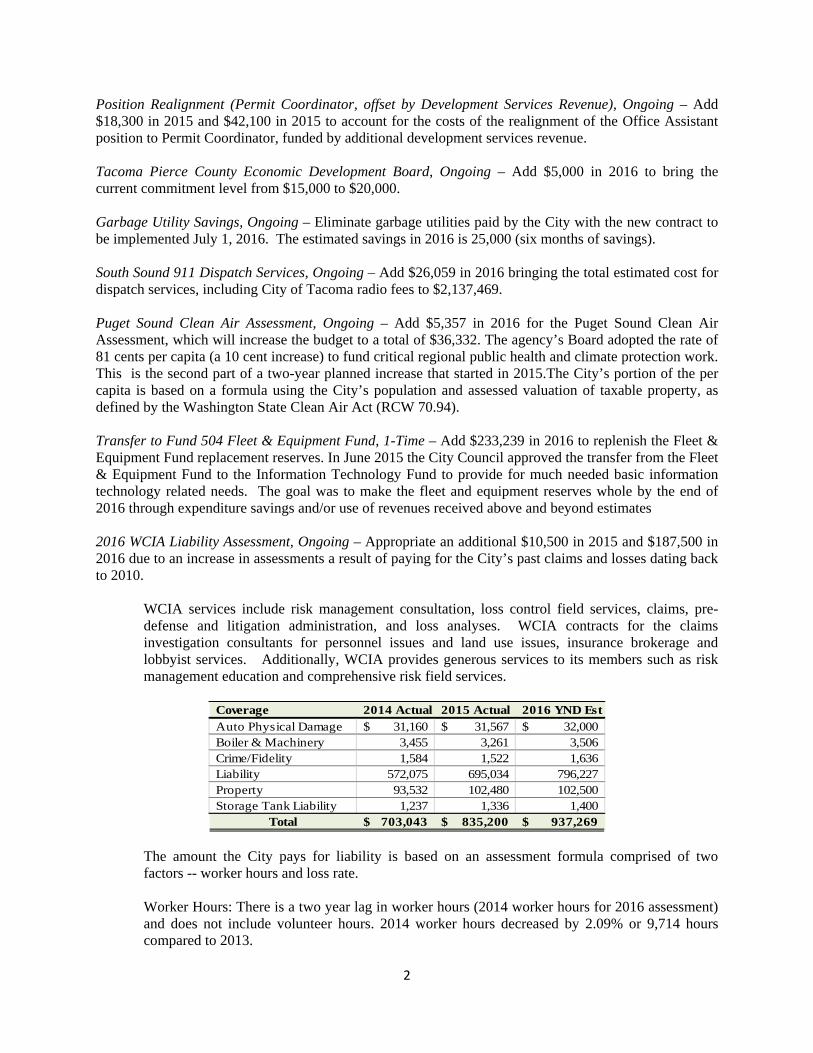
WCIA services include risk management consultation, loss control field services, claims, pre-defense and litigation administration, and loss analyses. WCIA contracts for the claims investigation consultants for personnel issues and land use issues, insurance brokerage and lobbyist services. Additionally, WCIA provides generous services to its members such as risk management education and comprehensive risk field services.
Coverage 2014 Actual 2015 Actual 2016 YND EstAuto Physical Damage 31,160$ 31,567$ 32,000$ Boiler & Machinery 3,455 3,261 3,506 Crime/Fidelity 1,584 1,522 1,636 Liability 572,075 695,034 796,227 Property 93,532 102,480 102,500 Storage Tank Liability 1,237 1,336 1,400
Total 703,043$ 835,200$ 937,269$
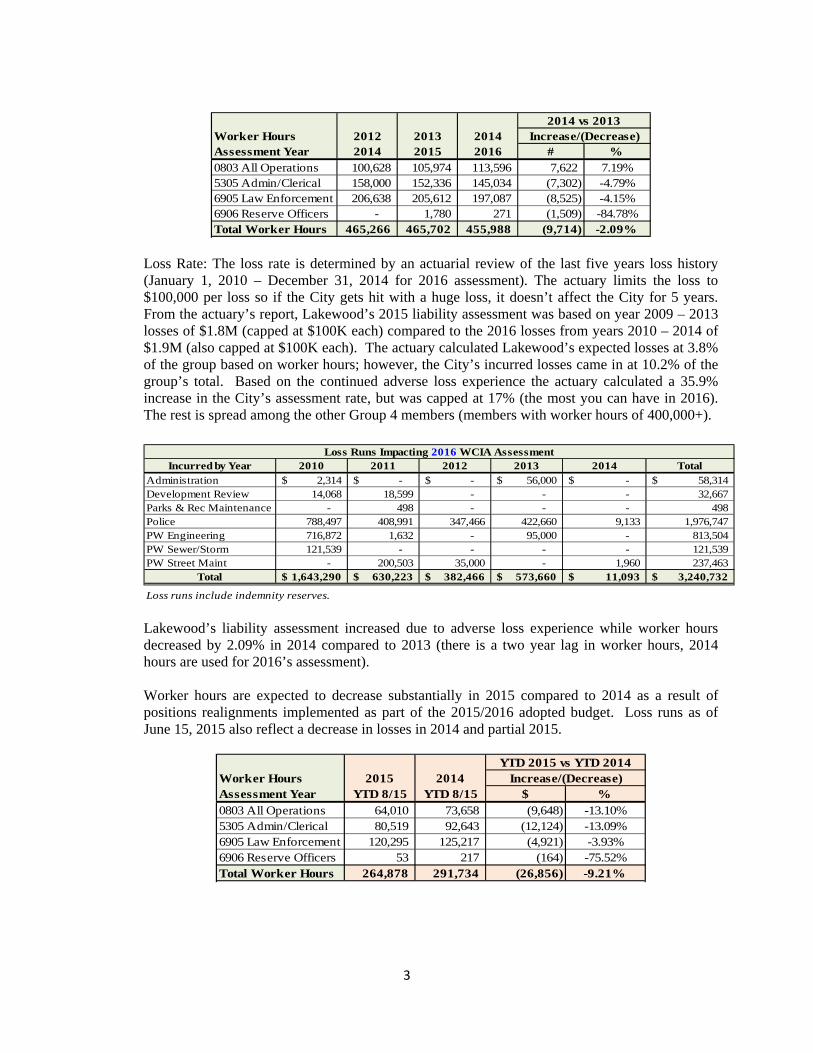
The amount the City pays for liability is based on an assessment formula comprised of two factors -- worker hours and loss rate. Worker Hours: There is a two year lag in worker hours (2014 worker hours for 2016 assessment) and does not include volunteer hours. 2014 worker hours decreased by 2.09% or 9,714 hours compared to 2013.
3
2014 vs 2013
Worker Hours 2012 2013 2014 Increase/(Decrease)Assessment Year 2014 2015 2016 # %0803 All Operations 100,628 105,974 113,596 7,622 7.19%5305 Admin/Clerical 158,000 152,336 145,034 (7,302) -4.79%6905 Law Enforcement 206,638 205,612 197,087 (8,525) -4.15%6906 Reserve Officers - 1,780 271 (1,509) -84.78%Total Worker Hours 465,266 465,702 455,988 (9,714) -2.09%
Loss Rate: The loss rate is determined by an actuarial review of the last five years loss history (January 1, 2010 – December 31, 2014 for 2016 assessment). The actuary limits the loss to $100,000 per loss so if the City gets hit with a huge loss, it doesn’t affect the City for 5 years. From the actuary’s report, Lakewood’s 2015 liability assessment was based on year 2009 – 2013 losses of $1.8M (capped at $100K each) compared to the 2016 losses from years 2010 – 2014 of $1.9M (also capped at $100K each). The actuary calculated Lakewood’s expected losses at 3.8% of the group based on worker hours; however, the City’s incurred losses came in at 10.2% of the group’s total. Based on the continued adverse loss experience the actuary calculated a 35.9% increase in the City’s assessment rate, but was capped at 17% (the most you can have in 2016). The rest is spread among the other Group 4 members (members with worker hours of 400,000+).
Loss Runs Impacting 2016 WCIA Assessment
Incurred by Year 2010 2011 2012 2013 2014 TotalAdministration 2,314$ -$ -$ 56,000$ -$ 58,314$ Development Review 14,068 18,599 - - - 32,667 Parks & Rec Maintenance - 498 - - - 498 Police 788,497 408,991 347,466 422,660 9,133 1,976,747 PW Engineering 716,872 1,632 - 95,000 - 813,504 PW Sewer/Storm 121,539 - - - - 121,539 PW Street Maint - 200,503 35,000 - 1,960 237,463
Total 1,643,290$ 630,223$ 382,466$ 573,660$ 11,093$ 3,240,732$
Loss runs include indemnity reserves. Lakewood’s liability assessment increased due to adverse loss experience while worker hours decreased by 2.09% in 2014 compared to 2013 (there is a two year lag in worker hours, 2014 hours are used for 2016’s assessment). Worker hours are expected to decrease substantially in 2015 compared to 2014 as a result of positions realignments implemented as part of the 2015/2016 adopted budget. Loss runs as of June 15, 2015 also reflect a decrease in losses in 2014 and partial 2015.
YTD 2015 vs YTD 2014Worker Hours 2015 2014 Increase/(Decrease)Assessment Year YTD 8/15 YTD 8/15 $ %0803 All Operations 64,010 73,658 (9,648) -13.10%5305 Admin/Clerical 80,519 92,643 (12,124) -13.09%6905 Law Enforcement 120,295 125,217 (4,921) -3.93%6906 Reserve Officers 53 217 (164) -75.52%Total Worker Hours 264,878 291,734 (26,856) -9.21%
4
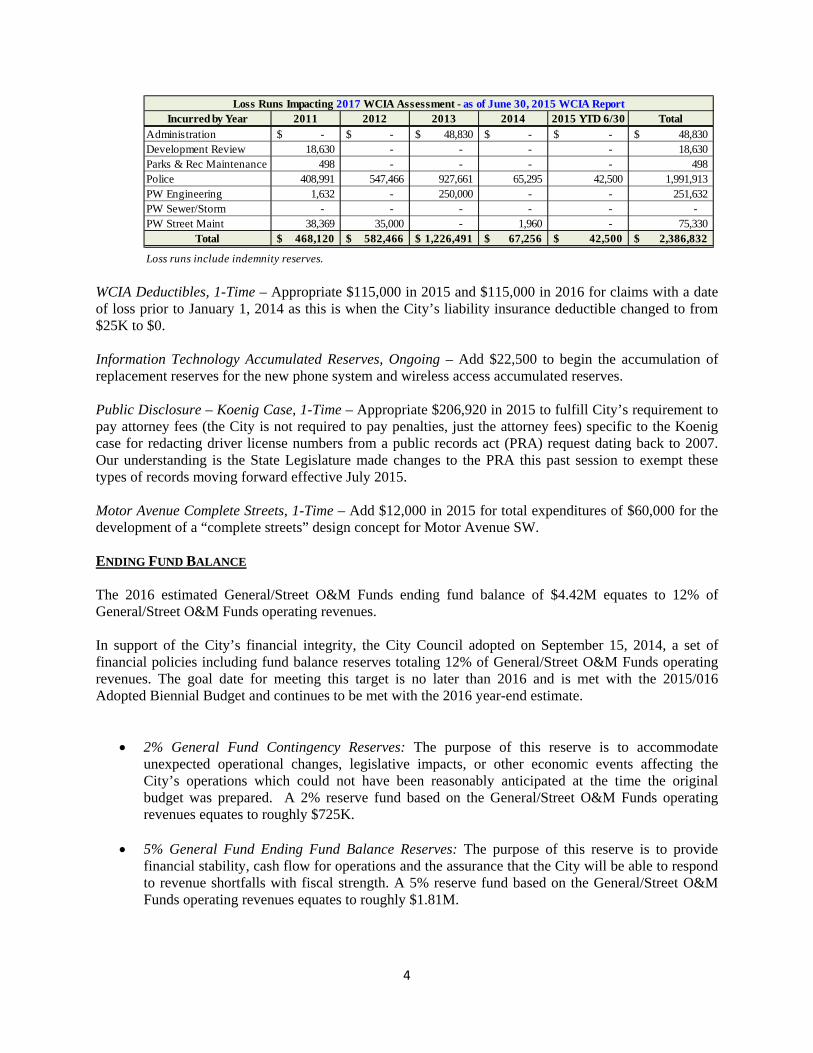
Loss Runs Impacting 2017 WCIA Assessment - as of June 30, 2015 WCIA ReportIncurred by Year 2011 2012 2013 2014 2015 YTD 6/30 Total
Administration -$ -$ 48,830$ -$ -$ 48,830$ Development Review 18,630 - - - - 18,630 Parks & Rec Maintenance 498 - - - - 498 Police 408,991 547,466 927,661 65,295 42,500 1,991,913 PW Engineering 1,632 - 250,000 - - 251,632 PW Sewer/Storm - - - - - - PW Street Maint 38,369 35,000 - 1,960 - 75,330
Total 468,120$ 582,466$ 1,226,491$ 67,256$ 42,500$ 2,386,832$
Loss runs include indemnity reserves.
WCIA Deductibles, 1-Time – Appropriate $115,000 in 2015 and $115,000 in 2016 for claims with a date of loss prior to January 1, 2014 as this is when the City’s liability insurance deductible changed to from $25K to $0. Information Technology Accumulated Reserves, Ongoing – Add $22,500 to begin the accumulation of replacement reserves for the new phone system and wireless access accumulated reserves. Public Disclosure – Koenig Case, 1-Time – Appropriate $206,920 in 2015 to fulfill City’s requirement to pay attorney fees (the City is not required to pay penalties, just the attorney fees) specific to the Koenig case for redacting driver license numbers from a public records act (PRA) request dating back to 2007. Our understanding is the State Legislature made changes to the PRA this past session to exempt these types of records moving forward effective July 2015. Motor Avenue Complete Streets, 1-Time – Add $12,000 in 2015 for total expenditures of $60,000 for the development of a “complete streets” design concept for Motor Avenue SW. ENDING FUND BALANCE The 2016 estimated General/Street O&M Funds ending fund balance of $4.42M equates to 12% of General/Street O&M Funds operating revenues. In support of the City’s financial integrity, the City Council adopted on September 15, 2014, a set of financial policies including fund balance reserves totaling 12% of General/Street O&M Funds operating revenues. The goal date for meeting this target is no later than 2016 and is met with the 2015/016 Adopted Biennial Budget and continues to be met with the 2016 year-end estimate.
2% General Fund Contingency Reserves: The purpose of this reserve is to accommodate unexpected operational changes, legislative impacts, or other economic events affecting the City’s operations which could not have been reasonably anticipated at the time the original budget was prepared. A 2% reserve fund based on the General/Street O&M Funds operating revenues equates to roughly $725K.
5% General Fund Ending Fund Balance Reserves: The purpose of this reserve is to provide
financial stability, cash flow for operations and the assurance that the City will be able to respond to revenue shortfalls with fiscal strength. A 5% reserve fund based on the General/Street O&M Funds operating revenues equates to roughly $1.81M.
5
5% Strategic Reserves: The purpose of this reserve is to provide some fiscal means for the City to respond to potential adversities such as public emergencies, natural disasters or similarly major, unanticipated events. A 5% reserve fund based on the General/Street O&M Funds operating revenues equates to roughly $1.81M.
NEXT STEPS AND UPCOMING ITEMS Continue updating the Municipal Finances 101 document.
Service Delivery Analysis. An analysis of service delivery will be conducted in various areas based
on a set of evaluation criteria such as:
Specialized Services - Services and activities, which the City provides that, require specialized skills, knowledge or licenses that City personnel does not possess.
Current Personnel Resources are Limited - Situations where the City may not have the personnel resources available to implement a specific task or project, making contracted services a viable alternative.
Politically Sensitive Project - Projects or studies that may have significant political implications and/or require a third party review are typically outsourced to a private contractor.
Risk - Tasks that pose a risk or liability to City personnel or equipment are outsourced to a private contractor.
Routine Task - The City provides routine and predictable services that can be tied to a fixed schedule without impacting or conflicting with the public.
Cost Effectiveness and Efficiency - The cost/benefit analysis will assist in determining whether it is advantageous to contract versus hiring personnel internally.
Improved Level of Service (LOS) - Limited resources can be efficiently allocated through a system of internal personnel and external contracts to ensure the highest levels of service are provided to citizens.
Competitive - Competition for contract work continues to increase as more private firms vie for services traditionally provided by government.
Monitoring and Evaluation - One of the most important criteria surrounding private contracts is the monitoring and evaluation process which should be relatively inexpensive and easy to measure versus time consuming and expensive.
Customer Complaints - Resources are optimally allocated to ensure that all services provided by the City are done so with limited impact to citizens.
Cost Recovery, including Policy Recommendation for Development Services and Parks &
Recreation.
Revenue Audits. Admissions Tax

6
Western State Hospital Community Policing Program – The $462K biennial funding the City has received since 2007 has not increased; however, costs of providing this program has increased to roughly $550K. We will be seeking increased funding from the state legislature in the future.
Fleet & Equipment Analysis. Fleet Maintenance Services RFP/Contract; Fleet Users Manual.
Information Technology. The updated 6-year information technology strategic plan was presented to
the City Council in June 2015 and the City Council subsequently adopted and provided funding for the 2015/2016 services and program at the June 15th City Council meeting. In addition to the items listed in that 6-year plan, there are numerous others which will require additional research to determine departmental needs, potential replacement solutions, maintenance & operations cost, and reserves necessary for future upgrades and/or replacements. These items include:
Police
o Virtual Shooting Range Simulator (current system is no longer supported) o In-Car Police Video Systems (not installed in all vehicles, limited replacement parts,
outdated) o Forensic Systems such as Encase & FTK (hardware & software upgrades) o Electronic Display Signage Systems o Body Cameras (PRA issues need to be addressed by State, Federal government
looking at funding)
Public Works, Parks & Recreation, Maintenance o Electronic Display Signage Systems o Handheld Radio Systems o GPS Systems
City Hall o Electronic Display Signage Systems o Secure Entry (Badge System)
Municipal Court o Body Scanners o Electronic Display Signage System o X-Ray Machine/Metal Detector (original machine funded by grant) o FTR Gold – Audio Recording & Archival Software
Also, additional analysis is needed to determine the operational efficiencies to be gained as a result of implementing services/programs for items identified in the 6-year IT strategic plan.
Collective Bargaining Agreements. The City has three labor contracts that expire at the end of 2015
and one that will expire at the end of 2016. The City has started the process to begin in May, 2015.
Labor Group Current Contract Period______ AFSCME 01/01/2013 through 12/31/2016 LPIG 01/01/2013 through 12/31/2015 LPMG 02/01/2013 through 12/31/2015 Teamsters 01/01/2013 through 12/31/2015

7
Budget Related Items. Items tentatively scheduled are: September 28, 2015 Study Session
o Review 2015 Property Tax Levy (may need Substantial Need Ordinance) o Review 2015/2016 Mid-Biennium Budget Adjustments o Review 2nd Quarter Financial Report
October 12, 2015 Study Session
o Review of Parks Recreation Fee Analysis
November 2, 2015 Regular Meeting o Public Hearing on 2015 Property Tax Levy (may need Substantial Need Ordinance) o Public Hearing on 2015/2016 Mid-Biennium Budget Adjustments o Adopt 2015 Fee Schedule
November 16, 2015 Regular Meeting
o Adopt 2015 Property Tax Levy (may need Substantial Need Ordinance) o Adopt 2015/2016 Mid-Biennium Budget Adjustments
ATTACHMENTS
6-Year Financial Forecast (Executive Summary, Narrative, and 6-Year Forecast) Capital Projects Summary and Worksheets

8
SIX-YEAR FINANCIAL FORECAST (Revenue & Expenditure Manual)
The City’s financial policy requires the City to prepare a financial forecast for six years beyond the current budget period. The projection extends current operations to the future to determine if the services are sustainable and the magnitude of, if any, future financing gaps. This glimpse into the future allows the City to proactively plan and implement corrective measures over time to avoid sudden drastic changes in service levels and/or in revenues. Additionally, the City’s financial policy requires the city to balance its ongoing services with ongoing revenues. Therefore, the six-year financial forecast distinguishes between services and revenues that are considered ongoing “operating” revenues/expenditures versus one-time “capital and other” sources/uses. The City utilizes a five-year trend to project for future sources/uses; however, the City also takes into consideration of the current economic climate and adjusts these trends accordingly.
Police27.0%
City Council, City Manager,
Legal2.8%
Admin Svcs/Non-Dept
4.6%
Comm & Economic Dev
3.1%
Parks, Rec & Comm Svcs
3.1%
Street O&M5.1%
Municipal Court2.2%
Other Uses52.1%
2015 Adjusted Expenditures All Funds $79.3M
Property Tax15.2%
Sales Tax19.5%
Utility Tax14.1%
Chgs for Svcs9.4%
REET2.2%
Gambling Tax5.8%
Other Taxes7.4%
Lic & Permits3.4%
Franchise Fees7.5%
Intergovt'l5.2%
Fines & Forfeits
5.1%Misc0.4%
Other Sources4.8%
2016 Adjusted Revenues All Funds $43.2M
Property Tax8.7%
Sales Tax11.1%
Utility Tax8.0%
Chgs for Svcs5.4%
REET1.3%
Gambling Tax3.3%
Other Taxes4.1%
Lic & Permits2.0%
Franchise Fees4.3%
Intergovt'l3.1%
Fines & Forfeits
2.9%Misc0.3%
Other Sources45.4%
2015 Adjusted Revenues All Funds $74.4M
Police48.5%
City Council, City Manager,
Legal5.0%
Admin Svcs/Non-Dept
8.3%
Comm & Economic Dev
5.7%
Parks, Rec & Comm Svcs
5.6%
Street O&M9.2%Municipal
Court4.1%
Other Uses13.6%
2016 Adjusted Expenditures All Funds $44.7M

9
CONSOLIDATED GENERAL AND STREET OPERATIONS Operating revenues and expenditures projection is an integral part of planning the City’s future financial strategy. Revenues are projected conservatively using a five year trend and adjusted accordingly for current economic condition, recent activity and anticipated activity. Expenditures are based on prior year spending with adjustments for known items such as increase/decrease in contract costs and salaries/benefits. Of all the funds, the General and Street Operations & Maintenance Funds are the two funds accounting for general city services that are primarily supported by taxes. In total, taxes account for 71% of the $35.4M adjusted 2015 operating revenue source which includes sales tax, property tax, utility tax and other taxes such as gambling tax, admissions tax, parks sales tax, natural gas tax, and criminal justice sales tax. Among the taxes supporting General and Street fund operations, sales tax is by far the most significant source and accounts for 23% of the General & Street Fund operating revenues. Sales tax revenue fluctuates from year to year depending on the local economic condition. With that in mind, economic development continues to be a priority of the City, particularly focusing on the community’s commercial corridors to improve the City’s tax base. The next largest source of tax revenue is property tax followed by utility tax which accounts for 18% and 17%, respectively, of the General and Street O&M operating revenues.
Property Tax18.3%
Sales Tax23.5%
Utility Tax16.9%
Chgs for Svcs3.7%
Gambling Tax7.0%
Other Taxes5.6%
Lic & Permits4.1%
Franchise Fees9.1%
Intergovt'l5.4%Fines &
Forfeits6.1%
Misc0.2%
2016 Adopted Operating Revenues General and Street O&M
$35.8M
Police56.7%
City Council, City Manager,
Legal5.4%
Admin Svcs/Non-Dept
11.8%
Comm & Economic Dev
6.1%
Parks, Rec & Comm Svcs
8.8%Street O&M
5.9%Municipal
Court5.3%
2015 Adjusted Operating ExpendituresGeneral and Street O&M
$35.0M
Police60.5%
City Council, City Manager,
Legal6.4%
Admin Svcs/Non-Dept
10.5%
Comm & Economic Dev
5.3%
Parks, Rec & Comm Svcs
7.0%
Street O&M5.2%Municipal
Court5.1%
2016 Adjusted Operating Expenditures General and Street O&M
$34.8M
Property Tax18.2%
Sales Tax23.4%
Utility Tax16.9%
Chgs for Svcs3.8%
Gambling Tax7.0%
Other Taxes5.6%
Lic & Permits4.1%
Franchise Fees9.0%
Intergovt'l5.5%Fines &
Forfeits6.2%
Misc0.2%
2015 Adjusted Operating RevenuesGeneral and Street O&M
$35.4M
10
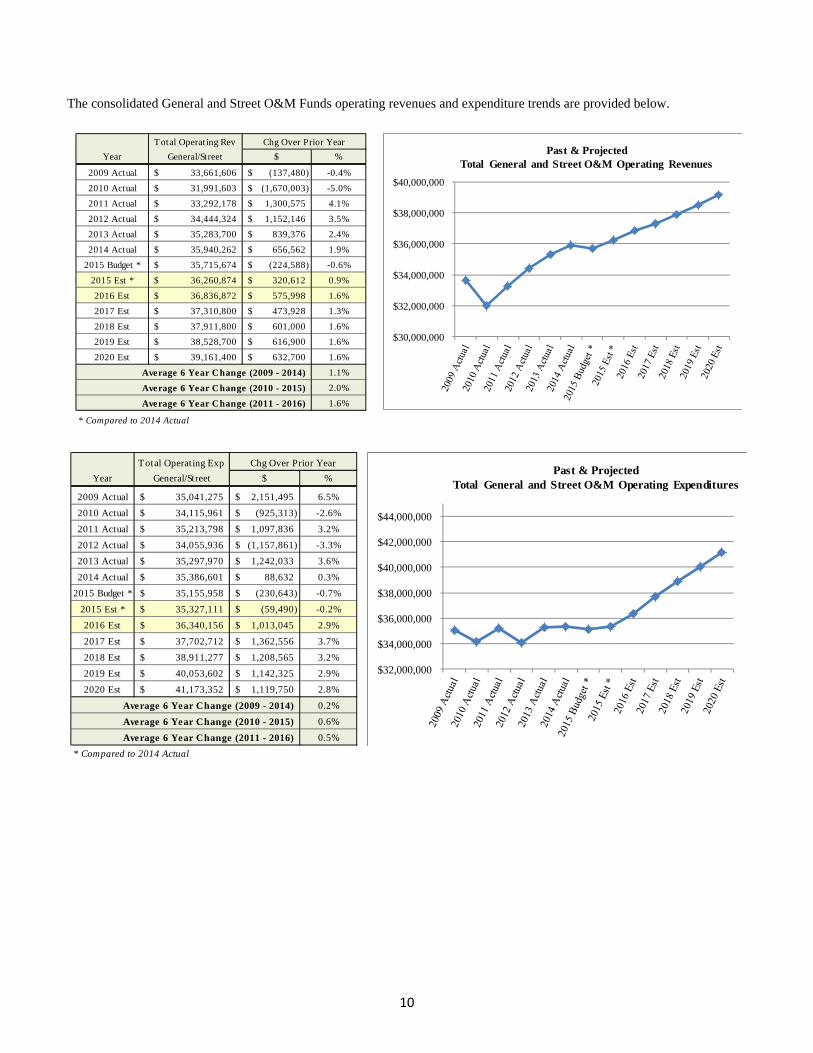
The consolidated General and Street O&M Funds operating revenues and expenditure trends are provided below.
Total Operating Rev Chg Over Prior Year
Year General/Street $ %
2009 Actual 33,661,606$ (137,480)$ -0.4%
2010 Actual 31,991,603$ (1,670,003)$ -5.0%
2011 Actual 33,292,178$ 1,300,575$ 4.1%
2012 Actual 34,444,324$ 1,152,146$ 3.5%
2013 Actual 35,283,700$ 839,376$ 2.4%
2014 Actual 35,940,262$ 656,562$ 1.9%
2015 Budget * 35,715,674$ (224,588)$ -0.6%
2015 Est * 36,260,874$ 320,612$ 0.9%
2016 Est 36,836,872$ 575,998$ 1.6%
2017 Est 37,310,800$ 473,928$ 1.3%
2018 Est 37,911,800$ 601,000$ 1.6%
2019 Est 38,528,700$ 616,900$ 1.6%
2020 Est 39,161,400$ 632,700$ 1.6%
Average 6 Year Change (2009 - 2014) 1.1%
Average 6 Year Change (2010 - 2015) 2.0%
Average 6 Year Change (2011 - 2016) 1.6%
* Compared to 2014 Actual
$30,000,000
$32,000,000
$34,000,000
$36,000,000
$38,000,000
$40,000,000
Past & Projected Total General and Street O&M Operating Revenues
$32,000,000
$34,000,000
$36,000,000
$38,000,000
$40,000,000
$42,000,000
$44,000,000
Past & ProjectedTotal General and Street O&M Operating Expenditures
Total Operating Exp Chg Over Prior Year
Year General/Street $ %
2009 Actual 35,041,275$ 2,151,495$ 6.5%
2010 Actual 34,115,961$ (925,313)$ -2.6%
2011 Actual 35,213,798$ 1,097,836$ 3.2%
2012 Actual 34,055,936$ (1,157,861)$ -3.3%
2013 Actual 35,297,970$ 1,242,033$ 3.6%
2014 Actual 35,386,601$ 88,632$ 0.3%
2015 Budget * 35,155,958$ (230,643)$ -0.7%
2015 Est * 35,327,111$ (59,490)$ -0.2%
2016 Est 36,340,156$ 1,013,045$ 2.9%
2017 Est 37,702,712$ 1,362,556$ 3.7%
2018 Est 38,911,277$ 1,208,565$ 3.2%
2019 Est 40,053,602$ 1,142,325$ 2.9%
2020 Est 41,173,352$ 1,119,750$ 2.8%
Average 6 Year Change (2009 - 2014) 0.2%
Average 6 Year Change (2010 - 2015) 0.6%
Average 6 Year Change (2011 - 2016) 0.5%
* Compared to 2014 Actual
11
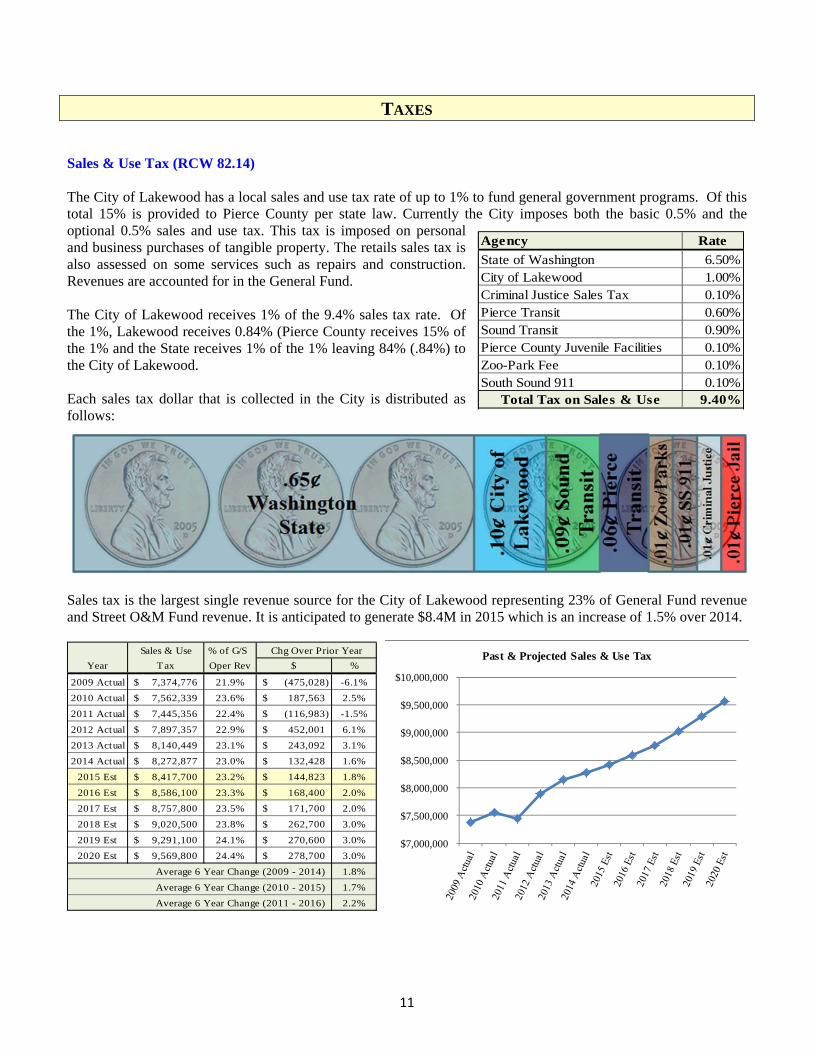
TAXES Sales & Use Tax (RCW 82.14) The City of Lakewood has a local sales and use tax rate of up to 1% to fund general government programs. Of this total 15% is provided to Pierce County per state law. Currently the City imposes both the basic 0.5% and the optional 0.5% sales and use tax. This tax is imposed on personal and business purchases of tangible property. The retails sales tax is also assessed on some services such as repairs and construction. Revenues are accounted for in the General Fund. The City of Lakewood receives 1% of the 9.4% sales tax rate. Of the 1%, Lakewood receives 0.84% (Pierce County receives 15% of the 1% and the State receives 1% of the 1% leaving 84% (.84%) to the City of Lakewood. Each sales tax dollar that is collected in the City is distributed as follows:
Sales tax is the largest single revenue source for the City of Lakewood representing 23% of General Fund revenue and Street O&M Fund revenue. It is anticipated to generate $8.4M in 2015 which is an increase of 1.5% over 2014.
Sales & Use % of G/S Chg Over Prior Year
Year Tax Oper Rev $ %
2009 Actual 7,374,776$ 21.9% (475,028)$ -6.1%
2010 Actual 7,562,339$ 23.6% 187,563$ 2.5%
2011 Actual 7,445,356$ 22.4% (116,983)$ -1.5%
2012 Actual 7,897,357$ 22.9% 452,001$ 6.1%
2013 Actual 8,140,449$ 23.1% 243,092$ 3.1%
2014 Actual 8,272,877$ 23.0% 132,428$ 1.6%
2015 Est 8,417,700$ 23.2% 144,823$ 1.8%
2016 Est 8,586,100$ 23.3% 168,400$ 2.0%
2017 Est 8,757,800$ 23.5% 171,700$ 2.0%
2018 Est 9,020,500$ 23.8% 262,700$ 3.0%
2019 Est 9,291,100$ 24.1% 270,600$ 3.0%
2020 Est 9,569,800$ 24.4% 278,700$ 3.0%
Average 6 Year Change (2009 - 2014) 1.8%
Average 6 Year Change (2010 - 2015) 1.7%
Average 6 Year Change (2011 - 2016) 2.2%
Agency Rate
State of Washington 6.50%City of Lakewood 1.00%Criminal Justice Sales Tax 0.10%Pierce Transit 0.60%Sound Transit 0.90%Pierce County Juvenile Facilities 0.10%Zoo-Park Fee 0.10%South Sound 911 0.10%
Total Tax on Sales & Use 9.40%
$7,000,000
$7,500,000
$8,000,000
$8,500,000
$9,000,000
$9,500,000
$10,000,000
Past & Projected Sales & Use Tax
12
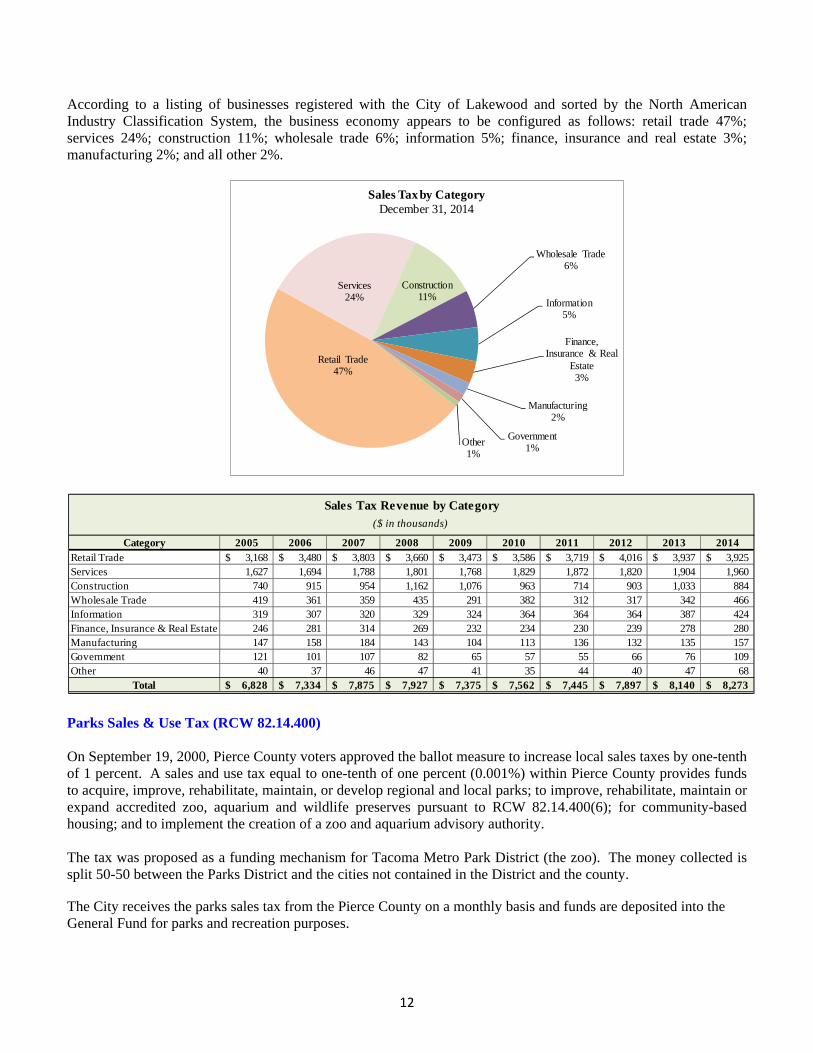
According to a listing of businesses registered with the City of Lakewood and sorted by the North American Industry Classification System, the business economy appears to be configured as follows: retail trade 47%; services 24%; construction 11%; wholesale trade 6%; information 5%; finance, insurance and real estate 3%; manufacturing 2%; and all other 2%.
Parks Sales & Use Tax (RCW 82.14.400) On September 19, 2000, Pierce County voters approved the ballot measure to increase local sales taxes by one-tenth of 1 percent. A sales and use tax equal to one-tenth of one percent (0.001%) within Pierce County provides funds to acquire, improve, rehabilitate, maintain, or develop regional and local parks; to improve, rehabilitate, maintain or expand accredited zoo, aquarium and wildlife preserves pursuant to RCW 82.14.400(6); for community-based housing; and to implement the creation of a zoo and aquarium advisory authority. The tax was proposed as a funding mechanism for Tacoma Metro Park District (the zoo). The money collected is split 50-50 between the Parks District and the cities not contained in the District and the county. The City receives the parks sales tax from the Pierce County on a monthly basis and funds are deposited into the General Fund for parks and recreation purposes.
($ in thousands)
Category 2005 2006 2007 2008 2009 2010 2011 2012 2013 2014Retail Trade 3,168$ 3,480$ 3,803$ 3,660$ 3,473$ 3,586$ 3,719$ 4,016$ 3,937$ 3,925$ Services 1,627 1,694 1,788 1,801 1,768 1,829 1,872 1,820 1,904 1,960 Construction 740 915 954 1,162 1,076 963 714 903 1,033 884 Wholesale Trade 419 361 359 435 291 382 312 317 342 466 Information 319 307 320 329 324 364 364 364 387 424 Finance, Insurance & Real Estate 246 281 314 269 232 234 230 239 278 280 Manufacturing 147 158 184 143 104 113 136 132 135 157 Government 121 101 107 82 65 57 55 66 76 109 Other 40 37 46 47 41 35 44 40 47 68
Total 6,828$ 7,334$ 7,875$ 7,927$ 7,375$ 7,562$ 7,445$ 7,897$ 8,140$ 8,273$
Sales Tax Revenue by Category
Retail Trade47%
Services24%
Construction11%
Wholesale Trade6%
Information5%
Finance, Insurance & Real
Estate3%
Manufacturing2%
Government1%
Other 1%
Sales Tax by CategoryDecember 31, 2014

13
Parks % of G/S Chg Over Prior Year
Year Sales & Use Tax Oper Rev $ %
2009 Actual 363,218$ 1.1% (98,193)$ -21.3%
2010 Actual 437,146$ 1.4% 73,928$ 20.4%
2011 Actual 403,822$ 1.2% (33,324)$ -7.6%
2012 Actual 412,204$ 1.2% 8,382$ 2.1%
2013 Actual 458,373$ 1.3% 46,169$ 11.2%
2014 Actual 481,690$ 1.3% 23,317$ 5.1%
2015 Est 490,100$ 1.4% 8,410$ 1.7%
2016 Est 499,900$ 1.4% 9,800$ 2.0%
2017 Est 509,900$ 1.4% 10,000$ 2.0%
2018 Est 525,200$ 1.4% 15,300$ 3.0%
2019 Est 541,000$ 1.4% 15,800$ 3.0%
2020 Est 557,200$ 1.4% 16,200$ 3.0%
Average 6 Year Change (2009 - 2014) 4.1%
Average 6 Year Change (2010 - 2015) 1.8%
Average 6 Year Change (2011 - 2016) 3.2%
Natural Gas Use Tax (RCW 82.14.230) The governing body of any city, while not required by legislative mandate to do so, may by resolution or ordinance, fix and impose on every person a use tax for the privilege of using natural gas or manufactured gas in the City as a consumer. The Department of Revenue administers and collects the natural gas use tax. The State Treasurer’s Office, upon certification from the Department of Revenue, remits amounts due to local governments on a monthly basis. Funds are receipted into the General Fund and used for general purposes.
Natural Gas % of G/S Chg Over Prior Year
Year Use Tax Oper Rev $ %
2009 Actual -$ 0.0% -$ n/a
2010 Actual -$ 0.0% -$ n/a
2011 Actual 38,585$ 0.1% 38,585$ n/a
2012 Actual 11,296$ 0.0% (27,289)$ -70.7%
2013 Actual 30,120$ 0.1% 18,824$ 166.6%
2014 Actual 79,394$ 0.2% 49,274$ 163.6%
2015 Est 30,000$ 0.1% (49,394)$ -62.2%
2016 Est 30,000$ 0.1% -$ 0.0%
2017 Est 30,000$ 0.1% -$ 0.0%
2018 Est 30,000$ 0.1% -$ 0.0%
2019 Est 30,000$ 0.1% -$ 0.0%
2020 Est 30,000$ 0.1% -$ 0.0%
Average 6 Year Change (2009 - 2014) 16.7%
Average 6 Year Change (2010 - 2015) 16.7%
Average 6 Year Change (2011 - 2016) -4.8%
Note - The increase is 2014 is due to payments received and reported in 4th quarter 2014 for taxes related to years 2012, 2013 and 2014.
Criminal Justice Sales Tax (RCW 82.14.340) Criminal Justice Sales Tax is a local option sales tax of 0.10 percent that is collected in addition to retail sales tax and use taxes by the Department of Revenue. Ten percent of the funds are distributed to the county in which the tax was collected. The remainder of the funds (90%) is then distributed to the county (for unincorporated areas) and cities within the county based on population as last determined by the Office of Financial Management.
$300,000
$350,000
$400,000
$450,000
$500,000
$550,000
$600,000
Past & Projected Parks Sales & Use Tax
$-
$10,000
$20,000
$30,000
$40,000
$50,000
$60,000
$70,000
$80,000
$90,000
Past & Projected Natural Gas Tax

14
Moneys received from this tax must be expended for criminal justice purposes. Criminal justice purposes are defined as activities that substantially assist the criminal justice system, which may include circumstances where ancillary benefit to the civil justice system occurs, and which includes domestic violence services such as those provided by domestic violence programs, community advocates, and legal advocates, as defined by RCW 0.123.020. In the expenditure of funds for criminal justice purposes, cities and counties, or any combination thereof, are authorized to participate in agreements to jointly expend funds for criminal justice purposes of mutual benefit. Such criminal justice purposes of mutual benefit include, but are not limited to, the construction, improvement, and expansion of jails, court facilities, juvenile justice facilities, and services with ancillary benefits to the civil justice system.
Criminal Justice % of G/S Chg Over Prior Year
Year Sales Tax Oper Rev $ %
2009 Actual 715,292$ 2.1% (103,318)$ -12.6%
2010 Actual 743,835$ 2.3% 28,543$ 4.0%
2011 Actual 732,065$ 2.2% (11,770)$ -1.6%
2012 Actual 756,800$ 2.2% 24,735$ 3.4%
2013 Actual 824,003$ 2.3% 67,203$ 8.9%
2014 Actual 863,463$ 2.4% 39,460$ 4.8%
2015 Est 880,700$ 2.4% 17,237$ 2.0%
2016 Est 898,300$ 2.4% 17,600$ 2.0%
2017 Est 916,300$ 2.5% 18,000$ 2.0%
2018 Est 934,600$ 2.5% 18,300$ 2.0%
2019 Est 953,300$ 2.5% 18,700$ 2.0%
2020 Est 972,400$ 2.5% 19,100$ 2.0%
Average 6 Year Change (2009 - 2014) 2.9%
Average 6 Year Change (2010 - 2015) 2.6%
Average 6 Year Change (2011 - 2016) 3.1%
Property Tax (RCW 84.52) A property tax is a rate placed on each piece of property within the city and is used for general governmental purposes. The rate is expressed in “Dollars per $1,000 of Assessed Value (AV), and is a function of the property tax levy permitted by law and adopted by the Lakewood City Council. In the City of Lakewood, as in other Washington cities, the maximum regular levy cannot exceed $3.60 which includes the maximum regular levy of $3.375 plus an additional $0.225 per $1,000 AV to provide for the Firemen’s Pension Fund. Property tax is assessed on all land, buildings, and residential homes, and on inventory and improvements to commercial property within the Lakewood city limits. Each year the City Council adopts a property tax rate by ordinance, which although established by ordinance is not codified. The ordinance must be provided to the Pierce County Council by November 30th as they have the duty to establish the actual property tax rate based upon the amount of property tax collections requested by a city, unless the City Council establishes a rate. The Lakewood City Council does not set the rate; however, does limit the amount of taxes to be collected. The following tables show the City’s past and projected property tax. New construction and other add-ons such as administrative refunds and increase from state-assessed public utilities are also added to the 1% levy limit. Another factor affecting the actual property tax collection is delinquent taxes.
$700,000
$750,000
$800,000
$850,000
$900,000
$950,000
$1,000,000
Past & Projected Criminal Justice Sales Tax

15
% of G/S Chg Over Prior Year
Year Property Tax Oper Rev $ %
2009 Actual 5,895,610$ 17.5% 173,312$ 3.0%
2010 Actual 6,047,325$ 18.9% 151,715$ 2.6%
2011 Actual 6,116,332$ 18.4% 69,007$ 1.1%
2012 Actual 6,227,924$ 18.1% 111,592$ 1.8%
2013 Actual 6,295,819$ 17.8% 67,895$ 1.1%
2014 Actual 6,468,617$ 18.0% 172,798$ 2.7%
2015 Est 6,565,600$ 18.1% 96,983$ 1.5%
2016 Est 6,664,100$ 18.1% 98,500$ 1.5%
2017 Est 6,764,100$ 18.1% 100,000$ 1.5%
2018 Est 6,865,600$ 18.1% 101,500$ 1.5%
2019 Est 6,968,600$ 18.1% 103,000$ 1.5%
2020 Est 7,073,100$ 18.1% 104,500$ 1.5%
Average 6 Year Change (2009 - 2014) 1.5%
Average 6 Year Change (2010 - 2015) 1.3%
Average 6 Year Change (2011 - 2016) 1.4%
Property tax is the second largest revenue source for Lakewood and is deposited into the General Fund for general governmental operations. The City's property tax levy amount is subject to a number of limitations in the state statute:
1. The $1.60 Levy Cap: The state constitution establishes the maximum regular property tax levy for all taxing districts combined at 1%, or $10 per $1000 market value of the property. This cap is further divided by the RCW to the various taxing districts, with the maximum regular property tax levy for most cities at $3.375 per thousand dollars assessed valuation (AV). Cities with the Firemen's Pension Fund can levy an additional $0.225 per thousand dollars AV, resulting in a maximum levy of $3.60 per thousand dollars AV. For cities belonging to a fire district and/or library district, such as Lakewood, the combined total levies for the City and special districts cannot exceed $3.60 per thousand dollars AV. The amount the City could levy is reduced by what the library district and the fire district are levying. The library and fire districts each have a maximum allowed rate of $0.50 and $1.50 respectively. If both levy the maximum amount, the City can only levy up to $1.60. If one or both of the special districts are not levying the maximum amount, the City's portion could exceed $1.60, but must reduce its levy by the same amount if the library or fire district raises its levy in the future; so that the combined total is never above $3.60. Currently, the Fire District and the Library District are both levying at their maximum amount; therefore the City’s maximum levy rate is $1.60. This levy cap can be exceeded (excess levy) with voter approval. Depending on its purpose, if the levy were to be used for operational and maintenance purposes (O & M levy), the voters' approval is only good for a year. If the additional levy is for capital purposes, the approval does not have to have a time limit; however, one is normally given based on the expected life of the bonds.
2. The 106 percent lid and other limits in property tax growth rates: Before 1997, a taxing district could increase the property tax levy amount annually by 6% (for a total of 106% of the amount levied in the previous year), up to the applicable levy cap. This growth rate limit was established in 1973 as the legislature responded to people's concerns that property taxes were rising too fast with the real estate boom.
$5,500,000
$6,000,000
$6,500,000
$7,000,000
$7,500,000
Past & Projected Property Tax
16
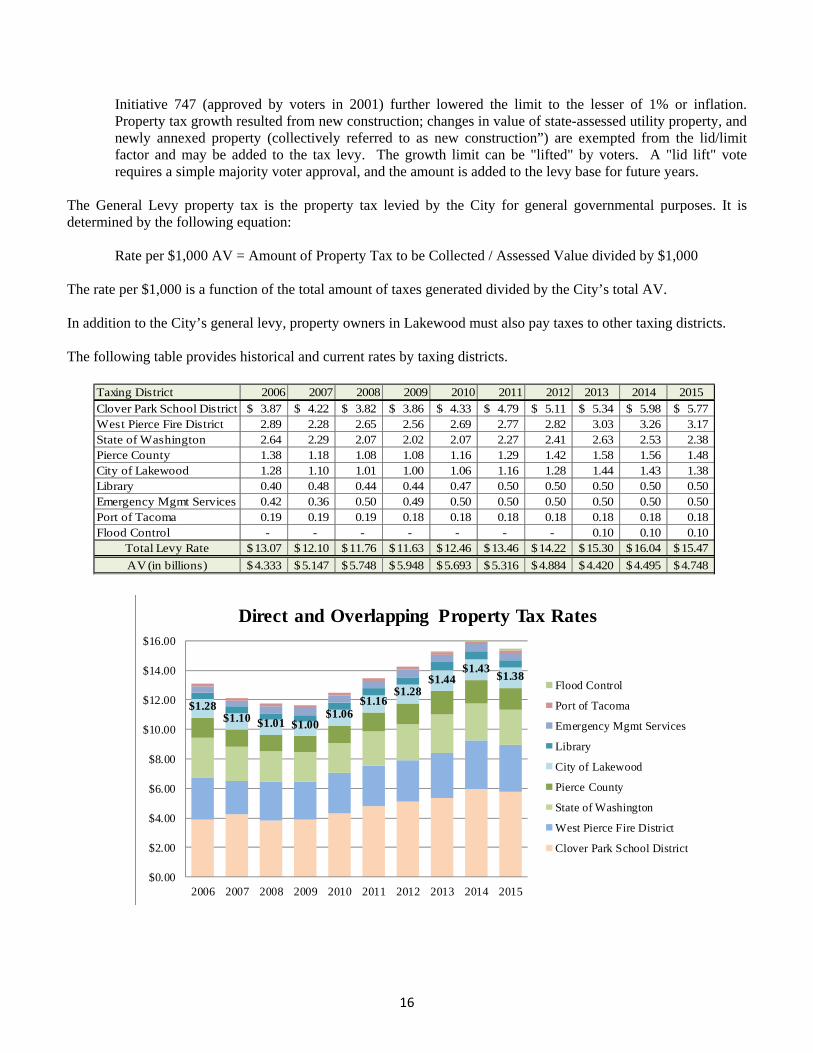
Initiative 747 (approved by voters in 2001) further lowered the limit to the lesser of 1% or inflation. Property tax growth resulted from new construction; changes in value of state-assessed utility property, and newly annexed property (collectively referred to as new construction”) are exempted from the lid/limit factor and may be added to the tax levy. The growth limit can be "lifted" by voters. A "lid lift" vote requires a simple majority voter approval, and the amount is added to the levy base for future years.
The General Levy property tax is the property tax levied by the City for general governmental purposes. It is determined by the following equation: Rate per $1,000 AV = Amount of Property Tax to be Collected / Assessed Value divided by $1,000 The rate per $1,000 is a function of the total amount of taxes generated divided by the City’s total AV. In addition to the City’s general levy, property owners in Lakewood must also pay taxes to other taxing districts. The following table provides historical and current rates by taxing districts.
Taxing District 2006 2007 2008 2009 2010 2011 2012 2013 2014 2015Clover Park School District 3.87$ 4.22$ 3.82$ 3.86$ 4.33$ 4.79$ 5.11$ 5.34$ 5.98$ 5.77$ West Pierce Fire District 2.89 2.28 2.65 2.56 2.69 2.77 2.82 3.03 3.26 3.17 State of Washington 2.64 2.29 2.07 2.02 2.07 2.27 2.41 2.63 2.53 2.38 Pierce County 1.38 1.18 1.08 1.08 1.16 1.29 1.42 1.58 1.56 1.48 City of Lakewood 1.28 1.10 1.01 1.00 1.06 1.16 1.28 1.44 1.43 1.38 Library 0.40 0.48 0.44 0.44 0.47 0.50 0.50 0.50 0.50 0.50 Emergency Mgmt Services 0.42 0.36 0.50 0.49 0.50 0.50 0.50 0.50 0.50 0.50 Port of Tacoma 0.19 0.19 0.19 0.18 0.18 0.18 0.18 0.18 0.18 0.18 Flood Control - - - - - - - 0.10 0.10 0.10
Total Levy Rate 13.07$ 12.10$ 11.76$ 11.63$ 12.46$ 13.46$ 14.22$ 15.30$ 16.04$ 15.47$
AV (in billions) 4.333$ 5.147$ 5.748$ 5.948$ 5.693$ 5.316$ 4.884$ 4.420$ 4.495$ 4.748$
$1.28$1.10 $1.01 $1.00
$1.06$1.16
$1.28$1.44
$1.43$1.38
$0.00
$2.00
$4.00
$6.00
$8.00
$10.00
$12.00
$14.00
$16.00
2006 2007 2008 2009 2010 2011 2012 2013 2014 2015
Direct and Overlapping Property Tax Rates
Flood Control
Port of Tacoma
Emergency Mgmt Services
Library
City of Lakewood
Pierce County
State of Washington
West Pierce Fire District
Clover Park School District
17
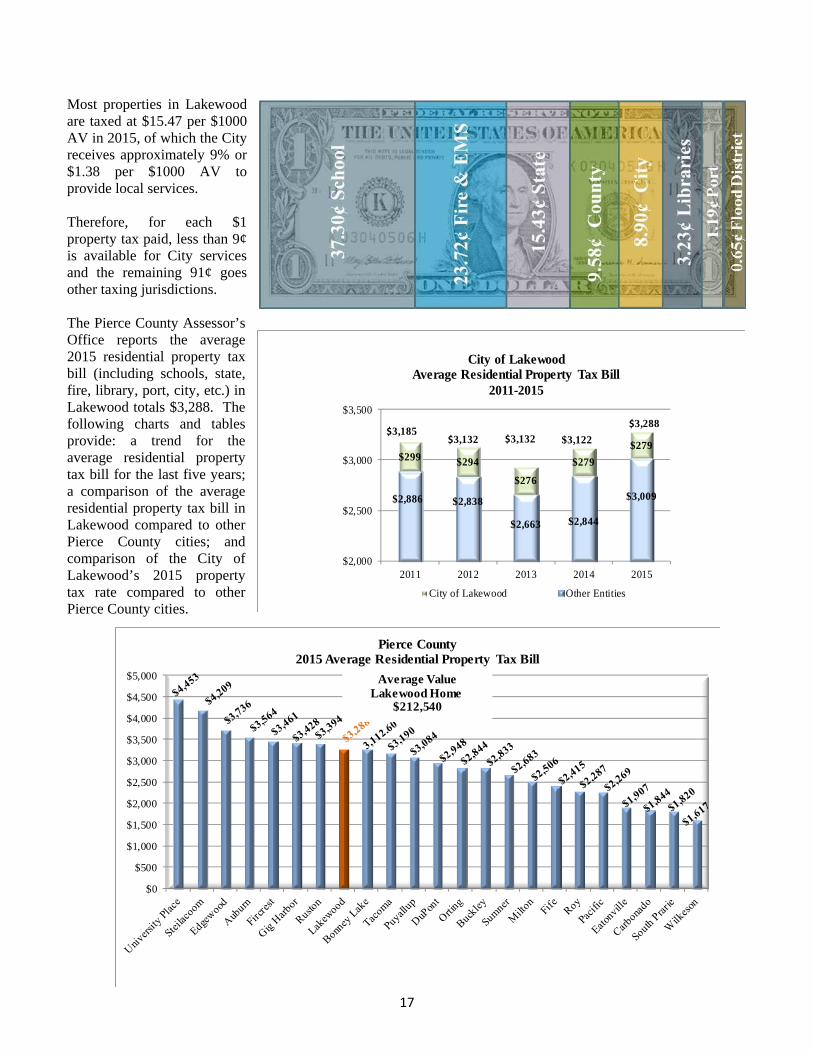
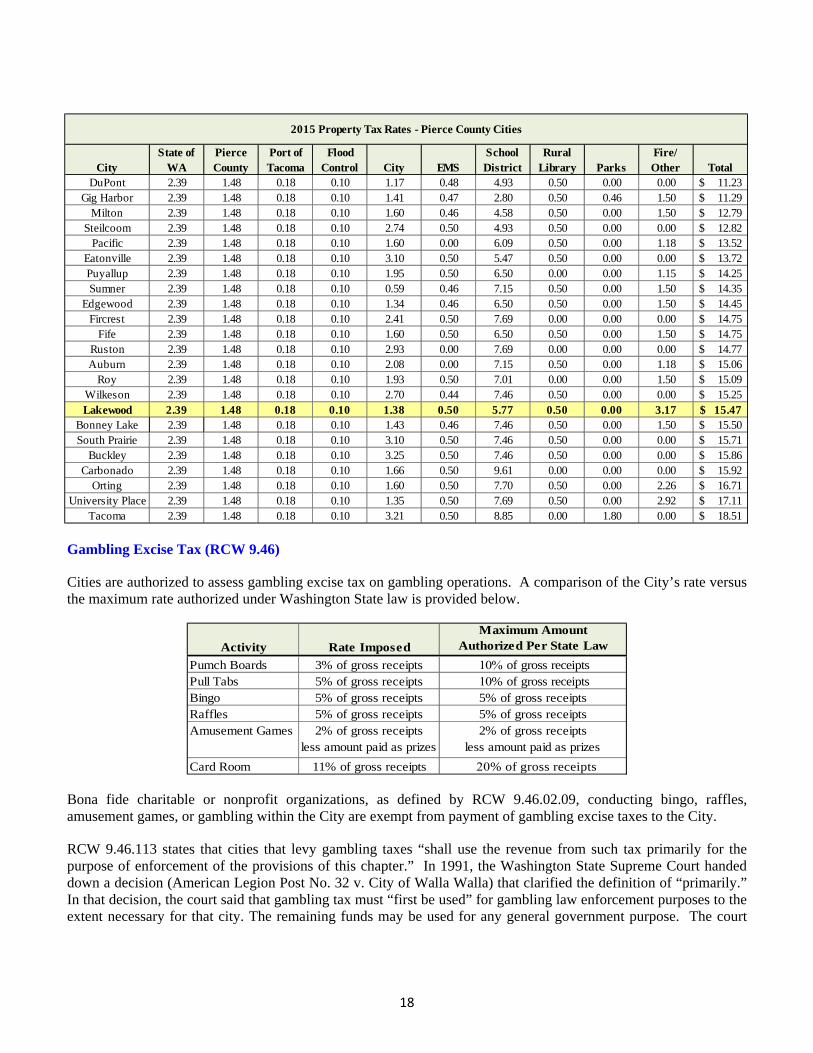
Most properties in Lakewood are taxed at $15.47 per $1000 AV in 2015, of which the City receives approximately 9% or $1.38 per $1000 AV to provide local services. Therefore, for each $1 property tax paid, less than 9¢ is available for City services and the remaining 91¢ goes other taxing jurisdictions. The Pierce County Assessor’s Office reports the average 2015 residential property tax bill (including schools, state, fire, library, port, city, etc.) in Lakewood totals $3,288. The following charts and tables provide: a trend for the average residential property tax bill for the last five years; a comparison of the average residential property tax bill in Lakewood compared to other Pierce County cities; and comparison of the City of Lakewood’s 2015 property tax rate compared to other Pierce County cities.
$2,886 $2,838
$2,663 $2,844
$3,009
$299 $294
$276
$279
$279
$2,000
$2,500
$3,000
$3,500
2011 2012 2013 2014 2015
City of LakewoodAverage Residential Property Tax Bill
2011-2015
City of Lakewood Other Entities
$3,185$3,132 $3,122$3,132
$3,288
$0
$500
$1,000
$1,500
$2,000
$2,500
$3,000
$3,500
$4,000
$4,500
$5,000
Pierce County2015 Average Residential Property Tax Bill
Average ValueLakewood Home
$212,540
18
Gambling Excise Tax (RCW 9.46)
Cities are authorized to assess gambling excise tax on gambling operations. A comparison of the City’s rate versus the maximum rate authorized under Washington State law is provided below.
Activity Rate Imposed
Maximum Amount Authorized Per State Law
Pumch Boards 3% of gross receipts 10% of gross receiptsPull Tabs 5% of gross receipts 10% of gross receiptsBingo 5% of gross receipts 5% of gross receiptsRaffles 5% of gross receipts 5% of gross receiptsAmusement Games 2% of gross receipts
less amount paid as prizes2% of gross receipts
less amount paid as prizes
Card Room 11% of gross receipts 20% of gross receipts
Bona fide charitable or nonprofit organizations, as defined by RCW 9.46.02.09, conducting bingo, raffles, amusement games, or gambling within the City are exempt from payment of gambling excise taxes to the City.
RCW 9.46.113 states that cities that levy gambling taxes “shall use the revenue from such tax primarily for the purpose of enforcement of the provisions of this chapter.” In 1991, the Washington State Supreme Court handed down a decision (American Legion Post No. 32 v. City of Walla Walla) that clarified the definition of “primarily.” In that decision, the court said that gambling tax must “first be used” for gambling law enforcement purposes to the extent necessary for that city. The remaining funds may be used for any general government purpose. The court
CityState of
WAPierce County
Port of Tacoma
Flood Control City EMS
School District
Rural Library Parks
Fire/Other Total
DuPont 2.39 1.48 0.18 0.10 1.17 0.48 4.93 0.50 0.00 0.00 11.23$ Gig Harbor 2.39 1.48 0.18 0.10 1.41 0.47 2.80 0.50 0.46 1.50 11.29$
Milton 2.39 1.48 0.18 0.10 1.60 0.46 4.58 0.50 0.00 1.50 12.79$ Steilcoom 2.39 1.48 0.18 0.10 2.74 0.50 4.93 0.50 0.00 0.00 12.82$
Pacific 2.39 1.48 0.18 0.10 1.60 0.00 6.09 0.50 0.00 1.18 13.52$ Eatonville 2.39 1.48 0.18 0.10 3.10 0.50 5.47 0.50 0.00 0.00 13.72$ Puyallup 2.39 1.48 0.18 0.10 1.95 0.50 6.50 0.00 0.00 1.15 14.25$ Sumner 2.39 1.48 0.18 0.10 0.59 0.46 7.15 0.50 0.00 1.50 14.35$
Edgewood 2.39 1.48 0.18 0.10 1.34 0.46 6.50 0.50 0.00 1.50 14.45$ Fircrest 2.39 1.48 0.18 0.10 2.41 0.50 7.69 0.00 0.00 0.00 14.75$
Fife 2.39 1.48 0.18 0.10 1.60 0.50 6.50 0.50 0.00 1.50 14.75$ Ruston 2.39 1.48 0.18 0.10 2.93 0.00 7.69 0.00 0.00 0.00 14.77$ Auburn 2.39 1.48 0.18 0.10 2.08 0.00 7.15 0.50 0.00 1.18 15.06$
Roy 2.39 1.48 0.18 0.10 1.93 0.50 7.01 0.00 0.00 1.50 15.09$ Wilkeson 2.39 1.48 0.18 0.10 2.70 0.44 7.46 0.50 0.00 0.00 15.25$ Lakewood 2.39 1.48 0.18 0.10 1.38 0.50 5.77 0.50 0.00 3.17 15.47$
Bonney Lake 2.39 1.48 0.18 0.10 1.43 0.46 7.46 0.50 0.00 1.50 15.50$ South Prairie 2.39 1.48 0.18 0.10 3.10 0.50 7.46 0.50 0.00 0.00 15.71$
Buckley 2.39 1.48 0.18 0.10 3.25 0.50 7.46 0.50 0.00 0.00 15.86$ Carbonado 2.39 1.48 0.18 0.10 1.66 0.50 9.61 0.00 0.00 0.00 15.92$
Orting 2.39 1.48 0.18 0.10 1.60 0.50 7.70 0.50 0.00 2.26 16.71$ University Place 2.39 1.48 0.18 0.10 1.35 0.50 7.69 0.50 0.00 2.92 17.11$
Tacoma 2.39 1.48 0.18 0.10 3.21 0.50 8.85 0.00 1.80 0.00 18.51$
2015 Property Tax Rates - Pierce County Cities
19
also recognized that enforcement does not necessarily encompass only police activity related to gambling activities. A general police presence can help prevent illegal gambling activities.
The majority of the City’s gambling tax comes from card rooms (94%) and the remainder comes primarily from punchboards and pull-tabs.
Gambling taxes are due by the 15th day of the month following the month in which the tax is accrued and are accounted for in the General Fund.
% of G/S Chg Over Prior Year
Year Gambling Tax Oper Rev $ %
2009 Actual 2,759,297$ 8.2% (209,277)$ -7.0%
2010 Actual 2,615,460$ 8.2% (143,837)$ -5.2%
2011 Actual 2,432,400$ 7.3% (183,060)$ -7.0%
2012 Actual 2,425,133$ 7.0% (7,267)$ -0.3%
2013 Actual 2,434,051$ 6.9% 8,918$ 0.4%
2014 Actual 2,482,403$ 6.9% 48,352$ 2.0%
2015 Est 2,507,300$ 6.9% 24,897$ 1.0%
2016 Est 2,532,300$ 6.9% 25,000$ 1.0%
2017 Est 2,557,500$ 6.9% 25,200$ 1.0%
2018 Est 2,583,100$ 6.8% 25,600$ 1.0%
2019 Est 2,608,900$ 6.8% 25,800$ 1.0%
2020 Est 2,635,000$ 6.7% 26,100$ 1.0%
Average 6 Year Change (2009 - 2014) -1.9%
Average 6 Year Change (2010 - 2015) -0.7%
Average 6 Year Change (2011 - 2016) 0.7%
Admissions Tax (RCW 36.38)
An admissions tax of 5% is levied and imposed upon every person (including children without regard to age) who pays and admission charge to any place or event including play tickets, entrance fees and cover charges to clubs. The tax is due to the City of Lakewood from the person or organization collecting the admission fee by the 15th day of the month following the “reporting period” in which the activity occurred. The reporting periods are two-month blocks of time (i.e. Jan/Feb reporting period due March 15th).
$2,400,000
$2,450,000
$2,500,000
$2,550,000
$2,600,000
$2,650,000
$2,700,000
$2,750,000
$2,800,000
Past & Projected Gambling Tax
$400,000
$450,000
$500,000
$550,000
$600,000
$650,000
$700,000
$750,000
$800,000
Past & Projected Admissions TaxAdmissions % of G/S Chg Over Prior Year
Year Tax Oper Rev $ %
2009 Actual 485,308$ 1.4% (26,423)$ -5.2%
2010 Actual 484,607$ 1.5% (701)$ -0.1%
2011 Actual 517,350$ 1.6% 32,743$ 6.8%
2012 Actual 591,704$ 1.7% 74,354$ 14.4%
2013 Actual 641,151$ 1.8% 49,447$ 8.4%
2014 Actual 654,011$ 1.8% 12,860$ 2.0%
2015 Est 667,100$ 1.8% 13,089$ 2.0%
2016 Est 680,400$ 1.8% 13,300$ 2.0%
2017 Est 694,000$ 1.9% 13,600$ 2.0%
2018 Est 707,900$ 1.9% 13,900$ 2.0%
2019 Est 722,100$ 1.9% 14,200$ 2.0%
2020 Est 736,500$ 1.9% 14,400$ 2.0%
Average 6 Year Change (2009 - 2014) 4.3%
Average 6 Year Change (2010 - 2015) 4.6%
Average 6 Year Change (2011 - 2016) 4.0%

20
Utility Tax (RCW 35.21.870)
Cities and towns in Washington State are authorized to levy a business and occupation tax (RCW 35.22.280(32)) on public utility businesses based on revenues they generate within the city or town, known as a utility tax. The rate of taxes for electric, phone, and natural gas utilities are limited to 6% (RCW 35.21.870) without voter approval. No limitation on tax rates on other public utilities. Utility taxes are levied on the gross income earned by private utilities from operations within the City of Lakewood boundaries. Taxable utilities include electric, natural gas, cable, cellular, telephone, and solid waste.
Prior to 2011, utility tax revenues were deposited into the general, street o&m, and street capital funds. The breakdown of utility tax receipts by fund is in the following table.
Note - The 2011 storm drainage revenue is high due receiving 2010 revenues in 2011.
Utility RateElectric 5%Natural Gas 5%Cable 6%Cellular 6%Telephone 6%Solid Waste 6%Stormwater 6%
Utility Tax by TypeChange Over Prior Year
Type 2011 2012 2013 2014 2015 Est 2016 Est 2017 Est 2018 Est 2019 Est 2020 Est
Electricity 1,360,252$ 1,402,152$ 1,602,288$ 1,595,942$ 1,580,000$ 1,580,000$ 1,580,000$ 1,580,000$ 1,580,000$ 1,580,000$
$ Change $49,834 $41,900 $200,136 ($6,346) ($15,942) $0 $0 $0 $0 $0
% Change 4% 3% 14% 0% -1% 0% 0% 0% 0% 0%
Natural Gas 864,155 787,425 762,036 720,699 657,000 657,000 657,000 657,000 657,000 657,000
$ Change $80,871 ($76,730) ($25,389) ($41,337) ($63,699) $0 $0 $0 $0 $0
% Change 10% -9% -3% -5% -9% 0% 0% 0% 0% 0%
Solid Waste 681,964 596,041 740,532 720,197 747,000 747,000 747,000 747,000 747,000 747,000
$ Change $111,166 ($85,923) $144,491 ($20,335) $26,803 $0 $0 $0 $0 $0
% Change 19% -13% 24% -3% 4% 0% 0% 0% 0% 0%
Cable 879,211 874,579 942,278 944,860 990,000 990,000 990,000 990,000 990,000 990,000
$ Change $23,651 ($4,632) $67,699 $2,582 $45,140 $0 $0 $0 $0 $0
% Change 3% -1% 8% 0% 5% 0% 0% 0% 0% 0%
Phone/Cell 1,948,426 1,806,362 1,689,516 1,602,189 1,503,000 1,503,000 1,503,000 1,503,000 1,503,000 1,503,000
$ Change $277,564 ($142,064) ($116,846) ($87,327) ($99,189) $0 $0 $0 $0 $0
% Change 17% -7% -6% -5% -6% 0% 0% 0% 0% 0%
Storm Drainage 313,016 155,781 163,204 163,968 165,000 165,000 165,000 165,000 165,000 165,000
$ Change $313,016 ($157,235) $7,423 $764 $1,032 $0 $0 $0 $0 $0
% Change n/a -50% 5% 0% 1% 0% 0% 0% 0% 0%
Total 6,047,024$ 5,622,340$ 5,899,854$ 5,747,855$ 5,642,000$ 5,642,000$ 5,642,000$ 5,642,000$ 5,642,000$ 5,642,000$
$ Change 856,103$ (424,687)$ 277,516$ ($151,999) ($105,855) $0 $0 $0 $0 $0
% Change 16% -7% 5% -3% -2% 0% 0% 0% 0% 0%
Utility Tax Revenue Allocation by Fund Chg Over Prior Year
Year General Fund Street O&M Street CIP Total $ %
2009 Actual 4,947,757$ 754,880$ 61,950$ 5,764,587$ (170,297)$ -2.9%
2010 Actual 4,448,209$ 680,143$ 62,570$ 5,190,922$ (573,665)$ -10.0%
2011 Actual 6,047,025$ -$ -$ 6,047,025$ 856,103$ 16.5%
2012 Actual 5,622,338$ -$ -$ 5,622,338$ (424,687)$ -7.0%
2013 Actual 5,899,854$ -$ -$ 5,899,854$ 277,516$ 4.9%
2014 Actual 5,747,855$ -$ -$ 5,747,855$ (151,999)$ -2.6%
2015 Est 5,642,000$ -$ -$ 5,642,000$ (105,855)$ -1.8%
2016 Est 5,642,000$ -$ -$ 5,642,000$ -$ 0.0%
2017 Est 5,642,000$ -$ -$ 5,642,000$ -$ 0.0%
2018 Est 5,642,000$ -$ -$ 5,642,000$ -$ 0.0%
2019 Est 5,642,000$ -$ -$ 5,642,000$ -$ 0.0%
2020 Est 5,642,000$ -$ -$ 5,642,000$ -$ 0.0%
Average 6 Year Change (2009 - 2014) 0.0%
Average 6 Year Change (2010 - 2015) 1.3%
Average 6 Year Change (2011 - 2016) -1.2%

21
Beginning in 2011, the utility tax is a general purpose revenue source receipted into the General Fund. For purposes of showing the utility tax revenue collections as a percentage of General and Street O&M funds, the portion accounted for in the Street Capital Fund is excluded in the table below. The 2015 year-end estimate reflects a decrease in electricity, natural gas, and phone/cell, offset by increases in solid waste and cable. Since utility tax is an unpredictable revenue source, no change is estimated in future years.
Utility % of G/S Chg Over Prior Year
Year Tax Oper Rev $ %
2009 Actual 5,702,637$ 16.9% (173,247)$ -2.9%
2010 Actual 5,128,352$ 16.0% (574,285)$ -10.1%
2011 Actual 6,047,025$ 18.2% 918,673$ 17.9%
2012 Actual 5,622,338$ 16.3% (424,687)$ -7.0%
2013 Actual 5,899,854$ 16.7% 277,516$ 4.9%
2014 Actual 5,747,855$ 16.0% (151,999)$ -2.6%
2015 Est 5,642,000$ 15.6% (105,855)$ -1.8%
2016 Est 5,642,000$ 15.3% -$ 0.0%
2017 Est 5,642,000$ 15.1% -$ 0.0%
2018 Est 5,642,000$ 14.9% -$ 0.0%
2019 Est 5,642,000$ 14.6% -$ 0.0%
2020 Est 5,642,000$ 14.4% -$ 0.0%
Average 6 Year Change (2009 - 2014) 0.1%
Average 6 Year Change (2010 - 2015) 1.5%
Average 6 Year Change (2011 - 2016) -1.2%
The City of Lakewood offers a utility tax relief program to reimburse qualifying low income seniors and disabled persons for their utility tax payments. To qualify a person must be either 62 years of age or older or be permanently disabled, and the person must have an income less than 50% of the median income. Applicants must be a resident of Lakewood and the amount of relief will be prorated on a monthly basis for each month that the customer was a resident. Applicants must apply each year for the program. The maximum relief available is $30 per year ($10 per utility for electric, natural gas and telephone). Real Estate Excise Tax (REET) The State of Washington is authorized to levy a real estate excise tax on all sales of real estate (measured by the full selling price, including the amount of any liens, mortgages and other debts given to secure the purchase) at a rate of 1.28 percent. A locally-imposed tax is also authorized. All cities and counties may levy a quarter percent tax (described as "the first quarter percent of the real estate excise tax" or "REET 1"). Cities and counties planning under the Growth Management Act (GMA) have the authority to levy a second quarter percent tax (REET 2). The statute further specifies that if a county is required to plan under GMA or if a city is located in such a county, the tax may be levied by a vote of the legislative body. If, however, the county chooses to plan under GMA, the tax must be approved by a majority of the voters. The City of Lakewood enacted both the first ¼% and second ¼% tax, for a total of 0.50%.
REET 1 RCW 82.46.010: Initially authorized in 1982, cities and counties can use the receipts of REET 1 for all capital purposes. An amendment in 1992 states that cities and counties with a population of 5,000 or more planning under the GMA must spend REET 1 receipts solely on capital projects that are listed in the capital facilities plan element of their comprehensive plan.
$5,000,000
$5,200,000
$5,400,000
$5,600,000
$5,800,000
$6,000,000
$6,200,000
Past & Projected Utility Tax
22
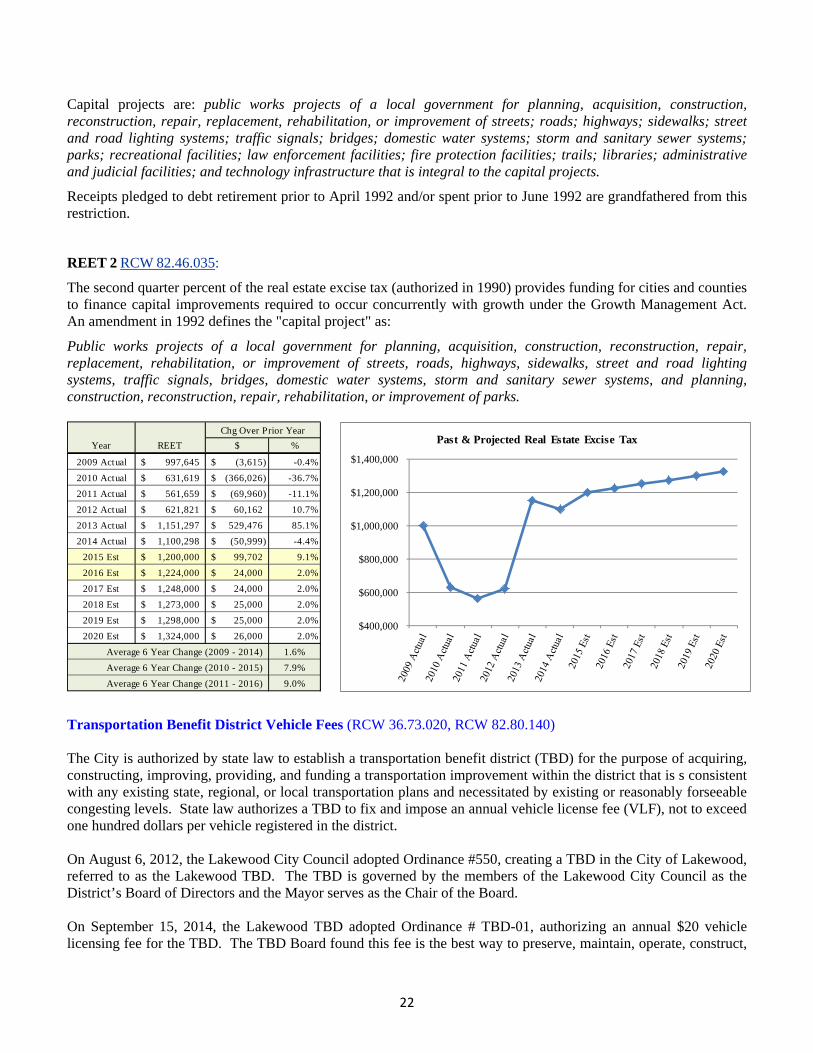
Capital projects are: public works projects of a local government for planning, acquisition, construction, reconstruction, repair, replacement, rehabilitation, or improvement of streets; roads; highways; sidewalks; street and road lighting systems; traffic signals; bridges; domestic water systems; storm and sanitary sewer systems; parks; recreational facilities; law enforcement facilities; fire protection facilities; trails; libraries; administrative and judicial facilities; and technology infrastructure that is integral to the capital projects.
Receipts pledged to debt retirement prior to April 1992 and/or spent prior to June 1992 are grandfathered from this restriction.
REET 2 RCW 82.46.035:
The second quarter percent of the real estate excise tax (authorized in 1990) provides funding for cities and counties to finance capital improvements required to occur concurrently with growth under the Growth Management Act. An amendment in 1992 defines the "capital project" as:
Public works projects of a local government for planning, acquisition, construction, reconstruction, repair, replacement, rehabilitation, or improvement of streets, roads, highways, sidewalks, street and road lighting systems, traffic signals, bridges, domestic water systems, storm and sanitary sewer systems, and planning, construction, reconstruction, repair, rehabilitation, or improvement of parks.
Transportation Benefit District Vehicle Fees (RCW 36.73.020, RCW 82.80.140) The City is authorized by state law to establish a transportation benefit district (TBD) for the purpose of acquiring, constructing, improving, providing, and funding a transportation improvement within the district that is s consistent with any existing state, regional, or local transportation plans and necessitated by existing or reasonably forseeable congesting levels. State law authorizes a TBD to fix and impose an annual vehicle license fee (VLF), not to exceed one hundred dollars per vehicle registered in the district. On August 6, 2012, the Lakewood City Council adopted Ordinance #550, creating a TBD in the City of Lakewood, referred to as the Lakewood TBD. The TBD is governed by the members of the Lakewood City Council as the District’s Board of Directors and the Mayor serves as the Chair of the Board. On September 15, 2014, the Lakewood TBD adopted Ordinance # TBD-01, authorizing an annual $20 vehicle licensing fee for the TBD. The TBD Board found this fee is the best way to preserve, maintain, operate, construct,
$400,000
$600,000
$800,000
$1,000,000
$1,200,000
$1,400,000
Past & Projected Real Estate Excise TaxChg Over Prior Year
Year REET $ %
2009 Actual 997,645$ (3,615)$ -0.4%
2010 Actual 631,619$ (366,026)$ -36.7%
2011 Actual 561,659$ (69,960)$ -11.1%
2012 Actual 621,821$ 60,162$ 10.7%
2013 Actual 1,151,297$ 529,476$ 85.1%
2014 Actual 1,100,298$ (50,999)$ -4.4%
2015 Est 1,200,000$ 99,702$ 9.1%
2016 Est 1,224,000$ 24,000$ 2.0%
2017 Est 1,248,000$ 24,000$ 2.0%
2018 Est 1,273,000$ 25,000$ 2.0%
2019 Est 1,298,000$ 25,000$ 2.0%
2020 Est 1,324,000$ 26,000$ 2.0%
Average 6 Year Change (2009 - 2014) 1.6%
Average 6 Year Change (2010 - 2015) 7.9%
Average 6 Year Change (2011 - 2016) 9.0%
23
or reconstruct the transportation infrastructure of the City of Lakewood and fund transportation improvements within the district that are consistent with existing state, regional or local transportation plans necessitated by existing or reasonably forseeable congestion levels. The $20 VLF, effective March 2015 applies to the following:
Auto stage, six seats or less Commercial trailer For hire vehicle, six seats or less Mobile home (if registered) Motor home Motorcyle Passenger Car Sports utility vehicle Tow truck Trailer, over 2000 pounds (but if private use single-axel, it’s exempt) Travel trailer; and Each vehicle subject to grow weight license fees with a scale weight of 6000 pounds or less
The following vehicle are exempt from the $20 VLF:
Campers, as defined in RCW 46.04.085 Farm tractors or farm vehicles, as defined in RCW 46.04.180 and 46.04.181 Mopeds, as defined in RCW 46.04.304 Off-road and non-highway vehicles, as defined in RCW 46.04.365 Private use single-axel trailer, as defined RCW 46.04.422 Snowmobiles, as defined in RCW 46.04.546; and Vehicles registered under chapter 46.87 RCW and the international registration plan.
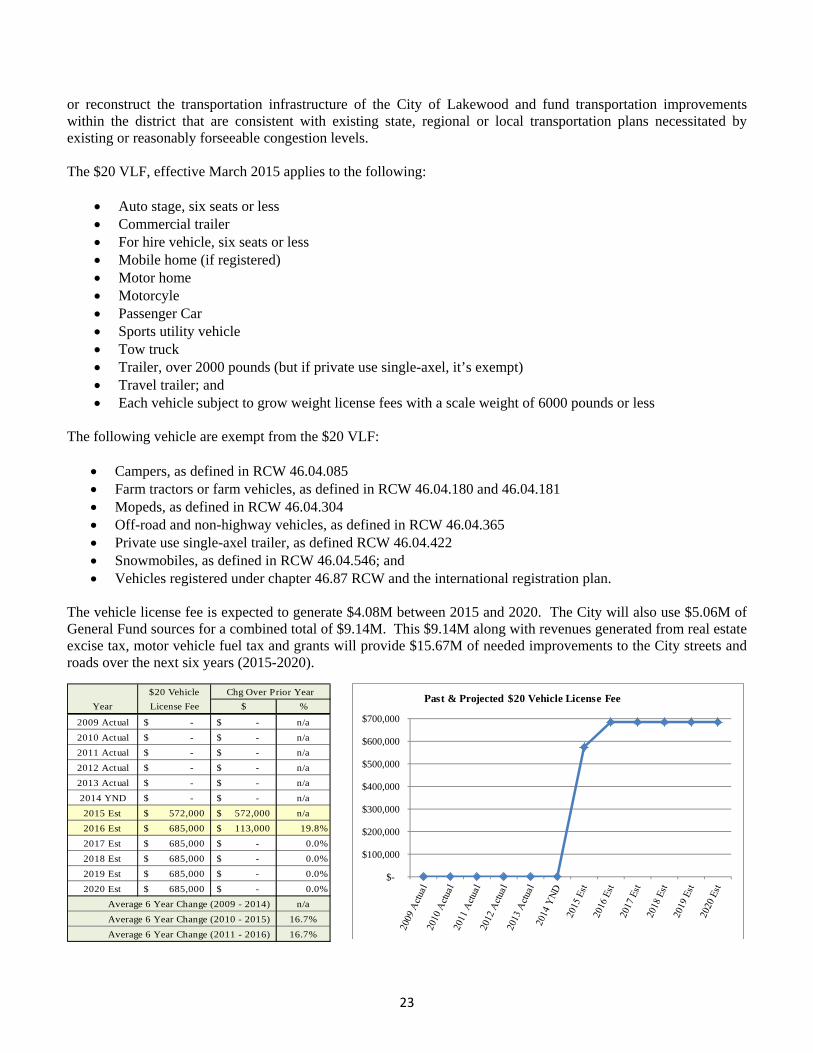
The vehicle license fee is expected to generate $4.08M between 2015 and 2020. The City will also use $5.06M of General Fund sources for a combined total of $9.14M. This $9.14M along with revenues generated from real estate excise tax, motor vehicle fuel tax and grants will provide $15.67M of needed improvements to the City streets and roads over the next six years (2015-2020).
$-
$100,000
$200,000
$300,000
$400,000
$500,000
$600,000
$700,000
Past & Projected $20 Vehicle License Fee $20 Vehicle Chg Over Prior Year
Year License Fee $ %
2009 Actual -$ -$ n/a
2010 Actual -$ -$ n/a
2011 Actual -$ -$ n/a
2012 Actual -$ -$ n/a
2013 Actual -$ -$ n/a
2014 YND -$ -$ n/a
2015 Est 572,000$ 572,000$ n/a
2016 Est 685,000$ 113,000$ 19.8%
2017 Est 685,000$ -$ 0.0%
2018 Est 685,000$ -$ 0.0%
2019 Est 685,000$ -$ 0.0%
2020 Est 685,000$ -$ 0.0%
Average 6 Year Change (2009 - 2014) n/a
Average 6 Year Change (2010 - 2015) 16.7%
Average 6 Year Change (2011 - 2016) 16.7%
24
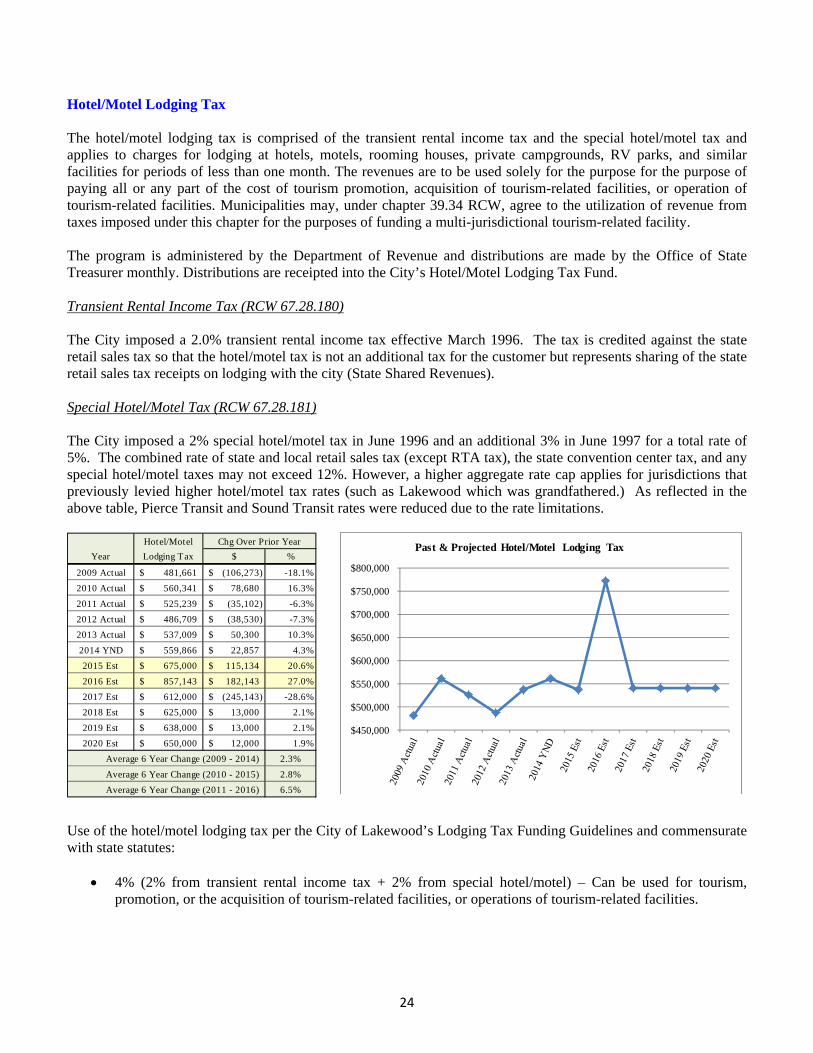
Hotel/Motel Lodging Tax The hotel/motel lodging tax is comprised of the transient rental income tax and the special hotel/motel tax and applies to charges for lodging at hotels, motels, rooming houses, private campgrounds, RV parks, and similar facilities for periods of less than one month. The revenues are to be used solely for the purpose for the purpose of paying all or any part of the cost of tourism promotion, acquisition of tourism-related facilities, or operation of tourism-related facilities. Municipalities may, under chapter 39.34 RCW, agree to the utilization of revenue from taxes imposed under this chapter for the purposes of funding a multi-jurisdictional tourism-related facility. The program is administered by the Department of Revenue and distributions are made by the Office of State Treasurer monthly. Distributions are receipted into the City’s Hotel/Motel Lodging Tax Fund. Transient Rental Income Tax (RCW 67.28.180) The City imposed a 2.0% transient rental income tax effective March 1996. The tax is credited against the state retail sales tax so that the hotel/motel tax is not an additional tax for the customer but represents sharing of the state retail sales tax receipts on lodging with the city (State Shared Revenues). Special Hotel/Motel Tax (RCW 67.28.181) The City imposed a 2% special hotel/motel tax in June 1996 and an additional 3% in June 1997 for a total rate of 5%. The combined rate of state and local retail sales tax (except RTA tax), the state convention center tax, and any special hotel/motel taxes may not exceed 12%. However, a higher aggregate rate cap applies for jurisdictions that previously levied higher hotel/motel tax rates (such as Lakewood which was grandfathered.) As reflected in the above table, Pierce Transit and Sound Transit rates were reduced due to the rate limitations.
Hotel/Motel Chg Over Prior Year
Year Lodging Tax $ %
2009 Actual 481,661$ (106,273)$ -18.1%
2010 Actual 560,341$ 78,680$ 16.3%
2011 Actual 525,239$ (35,102)$ -6.3%
2012 Actual 486,709$ (38,530)$ -7.3%
2013 Actual 537,009$ 50,300$ 10.3%
2014 YND 559,866$ 22,857$ 4.3%
2015 Est 675,000$ 115,134$ 20.6%
2016 Est 857,143$ 182,143$ 27.0%
2017 Est 612,000$ (245,143)$ -28.6%
2018 Est 625,000$ 13,000$ 2.1%
2019 Est 638,000$ 13,000$ 2.1%
2020 Est 650,000$ 12,000$ 1.9%
Average 6 Year Change (2009 - 2014) 2.3%
Average 6 Year Change (2010 - 2015) 2.8%
Average 6 Year Change (2011 - 2016) 6.5%
Use of the hotel/motel lodging tax per the City of Lakewood’s Lodging Tax Funding Guidelines and commensurate with state statutes:
4% (2% from transient rental income tax + 2% from special hotel/motel) – Can be used for tourism,
promotion, or the acquisition of tourism-related facilities, or operations of tourism-related facilities.
$450,000
$500,000
$550,000
$600,000
$650,000
$700,000
$750,000
$800,000
Past & Projected Hotel/Motel Lodging Tax
25
3% - Can only be used for the acquisition, construction, expansion, marketing, management, and financing of convention facilities, and facilities necessary to support major tourism destination attractions that serve a minimum of one million visitors per year.
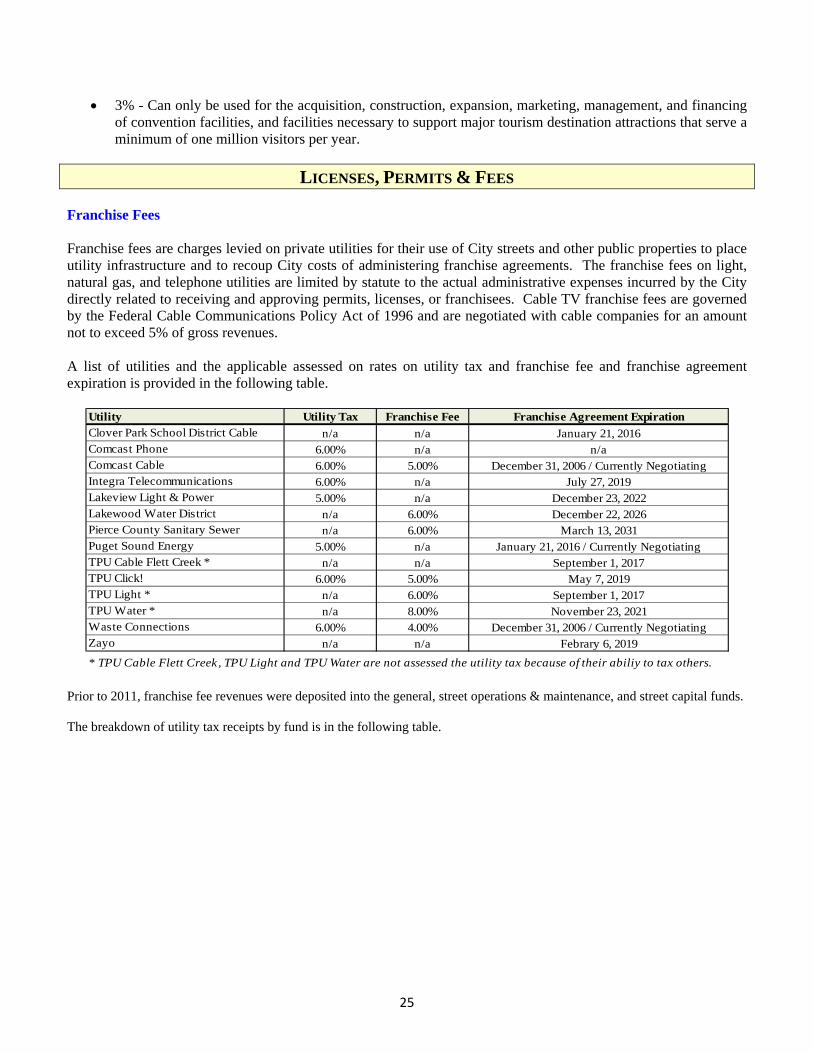
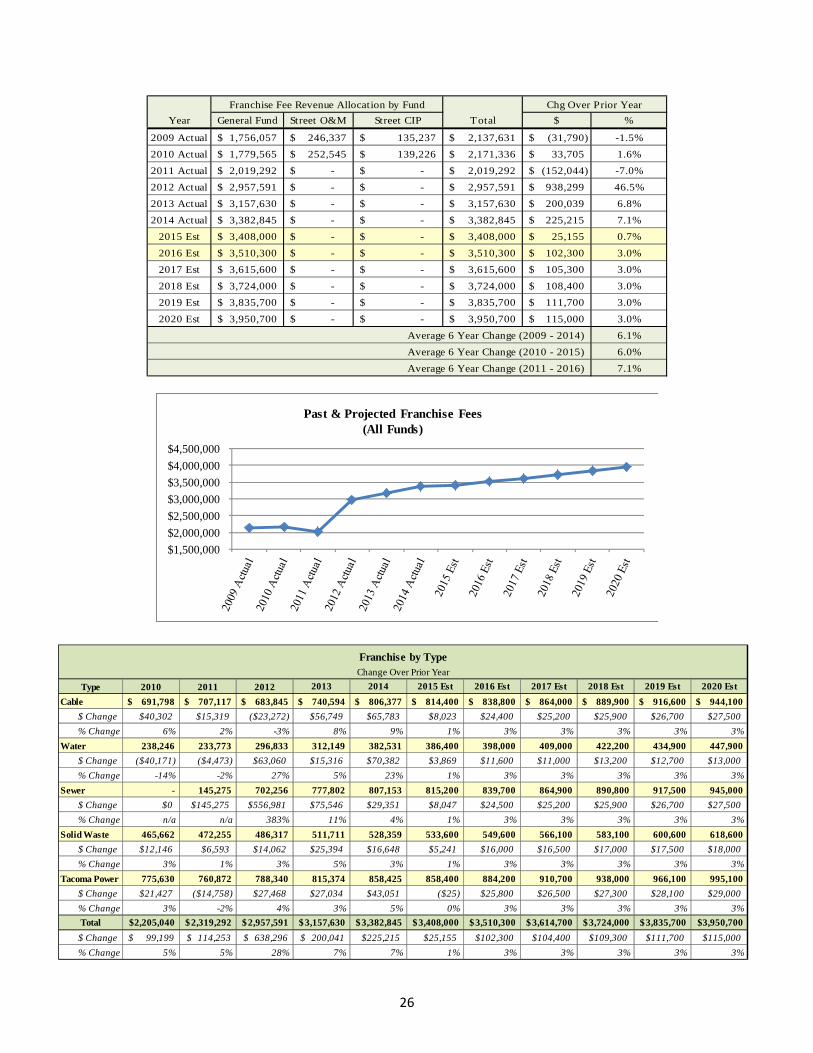
LICENSES, PERMITS & FEES Franchise Fees Franchise fees are charges levied on private utilities for their use of City streets and other public properties to place utility infrastructure and to recoup City costs of administering franchise agreements. The franchise fees on light, natural gas, and telephone utilities are limited by statute to the actual administrative expenses incurred by the City directly related to receiving and approving permits, licenses, or franchisees. Cable TV franchise fees are governed by the Federal Cable Communications Policy Act of 1996 and are negotiated with cable companies for an amount not to exceed 5% of gross revenues. A list of utilities and the applicable assessed on rates on utility tax and franchise fee and franchise agreement expiration is provided in the following table.
Prior to 2011, franchise fee revenues were deposited into the general, street operations & maintenance, and street capital funds. The breakdown of utility tax receipts by fund is in the following table.
Utility Utility Tax Franchise Fee Franchise Agreement ExpirationClover Park School District Cable n/a n/a January 21, 2016Comcast Phone 6.00% n/a n/aComcast Cable 6.00% 5.00% December 31, 2006 / Currently NegotiatingIntegra Telecommunications 6.00% n/a July 27, 2019Lakeview Light & Power 5.00% n/a December 23, 2022Lakewood Water District n/a 6.00% December 22, 2026Pierce County Sanitary Sewer n/a 6.00% March 13, 2031Puget Sound Energy 5.00% n/a January 21, 2016 / Currently NegotiatingTPU Cable Flett Creek * n/a n/a September 1, 2017TPU Click! 6.00% 5.00% May 7, 2019TPU Light * n/a 6.00% September 1, 2017TPU Water * n/a 8.00% November 23, 2021Waste Connections 6.00% 4.00% December 31, 2006 / Currently NegotiatingZayo n/a n/a Febrary 6, 2019
* TPU Cable Flett Creek, TPU Light and TPU Water are not assessed the utility tax because of their abiliy to tax others.
26
Franchise Fee Revenue Allocation by Fund Chg Over Prior Year
Year General Fund Street O&M Street CIP Total $ %
2009 Actual 1,756,057$ 246,337$ 135,237$ 2,137,631$ (31,790)$ -1.5%
2010 Actual 1,779,565$ 252,545$ 139,226$ 2,171,336$ 33,705$ 1.6%
2011 Actual 2,019,292$ -$ -$ 2,019,292$ (152,044)$ -7.0%
2012 Actual 2,957,591$ -$ -$ 2,957,591$ 938,299$ 46.5%
2013 Actual 3,157,630$ -$ -$ 3,157,630$ 200,039$ 6.8%
2014 Actual 3,382,845$ -$ -$ 3,382,845$ 225,215$ 7.1%
2015 Est 3,408,000$ -$ -$ 3,408,000$ 25,155$ 0.7%
2016 Est 3,510,300$ -$ -$ 3,510,300$ 102,300$ 3.0%
2017 Est 3,615,600$ -$ -$ 3,615,600$ 105,300$ 3.0%
2018 Est 3,724,000$ -$ -$ 3,724,000$ 108,400$ 3.0%
2019 Est 3,835,700$ -$ -$ 3,835,700$ 111,700$ 3.0%
2020 Est 3,950,700$ -$ -$ 3,950,700$ 115,000$ 3.0%
Average 6 Year Change (2009 - 2014) 6.1%
Average 6 Year Change (2010 - 2015) 6.0%
Average 6 Year Change (2011 - 2016) 7.1%
$1,500,000
$2,000,000
$2,500,000
$3,000,000
$3,500,000
$4,000,000
$4,500,000
Past & Projected Franchise Fees(All Funds)
Franchise by TypeChange Over Prior Year
Type 2010 2011 2012 2013 2014 2015 Est 2016 Est 2017 Est 2018 Est 2019 Est 2020 Est
Cable 691,798$ 707,117$ 683,845$ 740,594$ 806,377$ 814,400$ 838,800$ 864,000$ 889,900$ 916,600$ 944,100$
$ Change $40,302 $15,319 ($23,272) $56,749 $65,783 $8,023 $24,400 $25,200 $25,900 $26,700 $27,500
% Change 6% 2% -3% 8% 9% 1% 3% 3% 3% 3% 3%
Water 238,246 233,773 296,833 312,149 382,531 386,400 398,000 409,000 422,200 434,900 447,900
$ Change ($40,171) ($4,473) $63,060 $15,316 $70,382 $3,869 $11,600 $11,000 $13,200 $12,700 $13,000
% Change -14% -2% 27% 5% 23% 1% 3% 3% 3% 3% 3%
Sewer - 145,275 702,256 777,802 807,153 815,200 839,700 864,900 890,800 917,500 945,000
$ Change $0 $145,275 $556,981 $75,546 $29,351 $8,047 $24,500 $25,200 $25,900 $26,700 $27,500
% Change n/a n/a 383% 11% 4% 1% 3% 3% 3% 3% 3%
Solid Waste 465,662 472,255 486,317 511,711 528,359 533,600 549,600 566,100 583,100 600,600 618,600
$ Change $12,146 $6,593 $14,062 $25,394 $16,648 $5,241 $16,000 $16,500 $17,000 $17,500 $18,000
% Change 3% 1% 3% 5% 3% 1% 3% 3% 3% 3% 3%
Tacoma Power 775,630 760,872 788,340 815,374 858,425 858,400 884,200 910,700 938,000 966,100 995,100
$ Change $21,427 ($14,758) $27,468 $27,034 $43,051 ($25) $25,800 $26,500 $27,300 $28,100 $29,000
% Change 3% -2% 4% 3% 5% 0% 3% 3% 3% 3% 3%
Total 2,205,040$ 2,319,292$ 2,957,591$ 3,157,630$ 3,382,845$ 3,408,000$ 3,510,300$ 3,614,700$ 3,724,000$ 3,835,700$ 3,950,700$
$ Change 99,199$ 114,253$ 638,296$ 200,041$ $225,215 $25,155 $102,300 $104,400 $109,300 $111,700 $115,000
% Change 5% 5% 28% 7% 7% 1% 3% 3% 3% 3% 3%
27
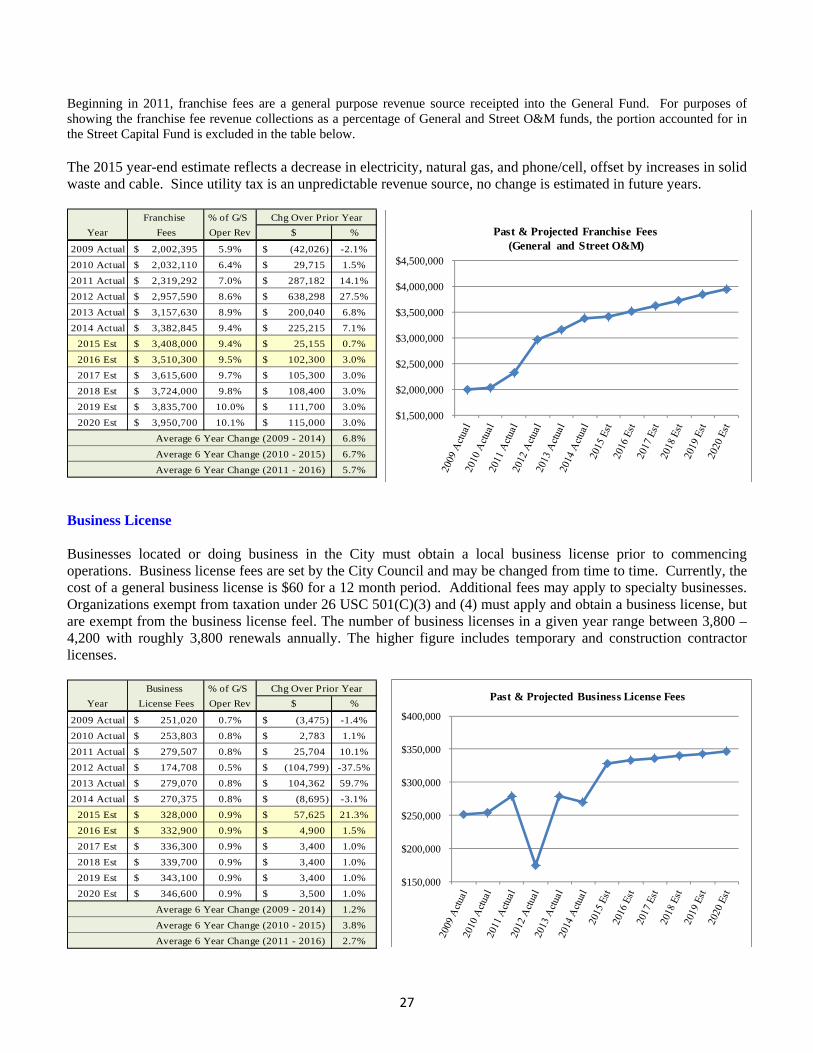
Beginning in 2011, franchise fees are a general purpose revenue source receipted into the General Fund. For purposes of showing the franchise fee revenue collections as a percentage of General and Street O&M funds, the portion accounted for in the Street Capital Fund is excluded in the table below. The 2015 year-end estimate reflects a decrease in electricity, natural gas, and phone/cell, offset by increases in solid waste and cable. Since utility tax is an unpredictable revenue source, no change is estimated in future years.
Franchise % of G/S Chg Over Prior Year
Year Fees Oper Rev $ %
2009 Actual 2,002,395$ 5.9% (42,026)$ -2.1%
2010 Actual 2,032,110$ 6.4% 29,715$ 1.5%
2011 Actual 2,319,292$ 7.0% 287,182$ 14.1%
2012 Actual 2,957,590$ 8.6% 638,298$ 27.5%
2013 Actual 3,157,630$ 8.9% 200,040$ 6.8%
2014 Actual 3,382,845$ 9.4% 225,215$ 7.1%
2015 Est 3,408,000$ 9.4% 25,155$ 0.7%
2016 Est 3,510,300$ 9.5% 102,300$ 3.0%
2017 Est 3,615,600$ 9.7% 105,300$ 3.0%
2018 Est 3,724,000$ 9.8% 108,400$ 3.0%
2019 Est 3,835,700$ 10.0% 111,700$ 3.0%
2020 Est 3,950,700$ 10.1% 115,000$ 3.0%
Average 6 Year Change (2009 - 2014) 6.8%
Average 6 Year Change (2010 - 2015) 6.7%
Average 6 Year Change (2011 - 2016) 5.7%
Business License Businesses located or doing business in the City must obtain a local business license prior to commencing operations. Business license fees are set by the City Council and may be changed from time to time. Currently, the cost of a general business license is $60 for a 12 month period. Additional fees may apply to specialty businesses. Organizations exempt from taxation under 26 USC 501(C)(3) and (4) must apply and obtain a business license, but are exempt from the business license feel. The number of business licenses in a given year range between 3,800 – 4,200 with roughly 3,800 renewals annually. The higher figure includes temporary and construction contractor licenses.
Business % of G/S Chg Over Prior Year
Year License Fees Oper Rev $ %
2009 Actual 251,020$ 0.7% (3,475)$ -1.4%
2010 Actual 253,803$ 0.8% 2,783$ 1.1%
2011 Actual 279,507$ 0.8% 25,704$ 10.1%
2012 Actual 174,708$ 0.5% (104,799)$ -37.5%
2013 Actual 279,070$ 0.8% 104,362$ 59.7%
2014 Actual 270,375$ 0.8% (8,695)$ -3.1%
2015 Est 328,000$ 0.9% 57,625$ 21.3%
2016 Est 332,900$ 0.9% 4,900$ 1.5%
2017 Est 336,300$ 0.9% 3,400$ 1.0%
2018 Est 339,700$ 0.9% 3,400$ 1.0%
2019 Est 343,100$ 0.9% 3,400$ 1.0%
2020 Est 346,600$ 0.9% 3,500$ 1.0%
Average 6 Year Change (2009 - 2014) 1.2%
Average 6 Year Change (2010 - 2015) 3.8%
Average 6 Year Change (2011 - 2016) 2.7%
$1,500,000
$2,000,000
$2,500,000
$3,000,000
$3,500,000
$4,000,000
$4,500,000
Past & Projected Franchise Fees (General and Street O&M)
$150,000
$200,000
$250,000
$300,000
$350,000
$400,000
Past & Projected Business License Fees
28
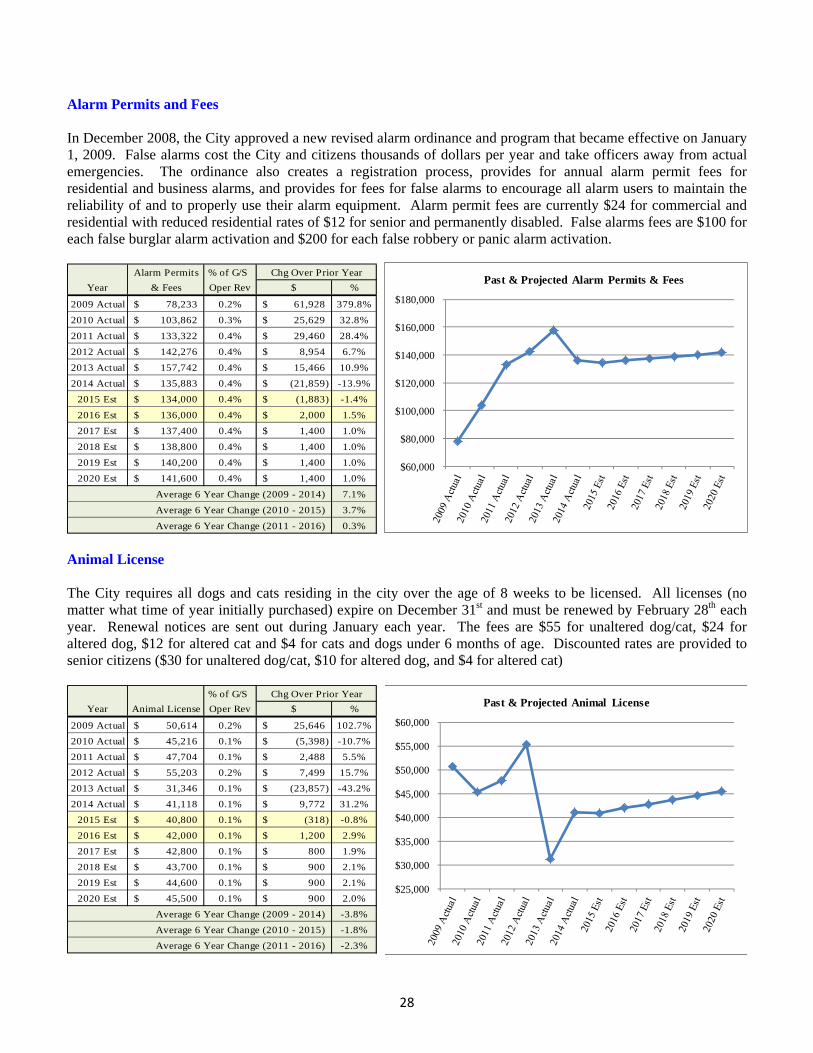
Alarm Permits and Fees In December 2008, the City approved a new revised alarm ordinance and program that became effective on January 1, 2009. False alarms cost the City and citizens thousands of dollars per year and take officers away from actual emergencies. The ordinance also creates a registration process, provides for annual alarm permit fees for residential and business alarms, and provides for fees for false alarms to encourage all alarm users to maintain the reliability of and to properly use their alarm equipment. Alarm permit fees are currently $24 for commercial and residential with reduced residential rates of $12 for senior and permanently disabled. False alarms fees are $100 for each false burglar alarm activation and $200 for each false robbery or panic alarm activation.
Alarm Permits % of G/S Chg Over Prior Year
Year & Fees Oper Rev $ %
2009 Actual 78,233$ 0.2% 61,928$ 379.8%
2010 Actual 103,862$ 0.3% 25,629$ 32.8%
2011 Actual 133,322$ 0.4% 29,460$ 28.4%
2012 Actual 142,276$ 0.4% 8,954$ 6.7%
2013 Actual 157,742$ 0.4% 15,466$ 10.9%
2014 Actual 135,883$ 0.4% (21,859)$ -13.9%
2015 Est 134,000$ 0.4% (1,883)$ -1.4%
2016 Est 136,000$ 0.4% 2,000$ 1.5%
2017 Est 137,400$ 0.4% 1,400$ 1.0%
2018 Est 138,800$ 0.4% 1,400$ 1.0%
2019 Est 140,200$ 0.4% 1,400$ 1.0%
2020 Est 141,600$ 0.4% 1,400$ 1.0%
Average 6 Year Change (2009 - 2014) 7.1%
Average 6 Year Change (2010 - 2015) 3.7%
Average 6 Year Change (2011 - 2016) 0.3%
Animal License The City requires all dogs and cats residing in the city over the age of 8 weeks to be licensed. All licenses (no matter what time of year initially purchased) expire on December 31st and must be renewed by February 28th each year. Renewal notices are sent out during January each year. The fees are $55 for unaltered dog/cat, $24 for altered dog, $12 for altered cat and $4 for cats and dogs under 6 months of age. Discounted rates are provided to senior citizens ($30 for unaltered dog/cat, $10 for altered dog, and $4 for altered cat)
% of G/S Chg Over Prior Year
Year Animal License Oper Rev $ %
2009 Actual 50,614$ 0.2% 25,646$ 102.7%
2010 Actual 45,216$ 0.1% (5,398)$ -10.7%
2011 Actual 47,704$ 0.1% 2,488$ 5.5%
2012 Actual 55,203$ 0.2% 7,499$ 15.7%
2013 Actual 31,346$ 0.1% (23,857)$ -43.2%
2014 Actual 41,118$ 0.1% 9,772$ 31.2%
2015 Est 40,800$ 0.1% (318)$ -0.8%
2016 Est 42,000$ 0.1% 1,200$ 2.9%
2017 Est 42,800$ 0.1% 800$ 1.9%
2018 Est 43,700$ 0.1% 900$ 2.1%
2019 Est 44,600$ 0.1% 900$ 2.1%
2020 Est 45,500$ 0.1% 900$ 2.0%
Average 6 Year Change (2009 - 2014) -3.8%
Average 6 Year Change (2010 - 2015) -1.8%
Average 6 Year Change (2011 - 2016) -2.3%
$60,000
$80,000
$100,000
$120,000
$140,000
$160,000
$180,000
Past & Projected Alarm Permits & Fees
$25,000
$30,000
$35,000
$40,000
$45,000
$50,000
$55,000
$60,000
Past & Projected Animal License

29
STATE SHARED REVENUES State-shared revenues are from taxes and fees collected by the State and disbursed to municipalities based on population or other criteria. The source of these shared revenues include: sales tax mitigation, criminal justice, leasehold excise tax, state lodging tax sharing, liquor excise tax and liquor profits, and motor vehicle excise tax. The following table provides a comparison to state shared revenues, including the portion of motor vehicle fuel tax receipted directly in the transportation capital fund.
Sales Tax Criminal Justice Criminal Justice Liquor Liquor Motor Veh Subtotal Motor Veh Total
Year Mitigation & DUI Cities High Crime Excise Tax Profits Fuel Tax Gen/St O&M Fuel Tax-CIP All Funds
2009 Actual 37,800$ 127,431$ 139,494$ 289,374$ 404,466$ 926,995$ 1,925,560$ 369,502$ 2,295,062$
2010 Actual 62,808$ 121,941$ 132,507$ 291,060$ 470,667$ 894,867$ 1,973,850$ 372,861$ 2,346,711$
2011 Actual 39,782$ 121,470$ 119,789$ 283,260$ 405,405$ 860,093$ 1,829,799$ 351,306$ 2,181,105$
2012 Actual 49,158$ 123,883$ 125,164$ 145,808$ 580,449$ 843,743$ 1,868,205$ 344,627$ 2,212,832$
2013 Actual 48,029$ 131,854$ 263,208$ 77,675$ 523,698$ 858,750$ 1,903,214$ 350,757$ 2,253,971$
2014 Actual 48,556$ 147,169$ 332,925$ 99,953$ 518,105$ 840,700$ 1,987,408$ 348,310$ 2,335,718$
2015 Est 72,800$ 144,400$ 236,700$ 161,100$ 511,200$ 852,300$ 1,978,500$ 340,000$ 2,318,500$
2016 Est 96,100$ 150,200$ 236,700$ 258,500$ 502,500$ 840,700$ 2,084,700$ 340,000$ 2,424,700$
2017 Est 96,100$ 150,200$ 236,700$ 267,900$ 498,400$ 840,300$ 2,089,600$ 340,000$ 2,429,600$
2018 Est 96,100$ 150,200$ 236,700$ 267,900$ 498,400$ 840,300$ 2,089,600$ 340,000$ 2,429,600$
2019 Est 96,100$ 150,200$ 236,700$ 267,900$ 498,400$ 840,300$ 2,089,600$ 340,000$ 2,429,600$
2020 Est 96,100$ 150,200$ 236,700$ 267,900$ 498,400$ 840,300$ 2,089,600$ 340,000$ 2,429,600$
Average 6 Year Change (2009 - 2014) 0.3%
Average 6 Year Change (2010 - 2015) -0.2%
Average 6 Year Change (2011 - 2016) 1.7%
$2,100,000
$2,150,000
$2,200,000
$2,250,000
$2,300,000
$2,350,000
$2,400,000
$2,450,000
Past & Projected Total State Shared Revenues
30
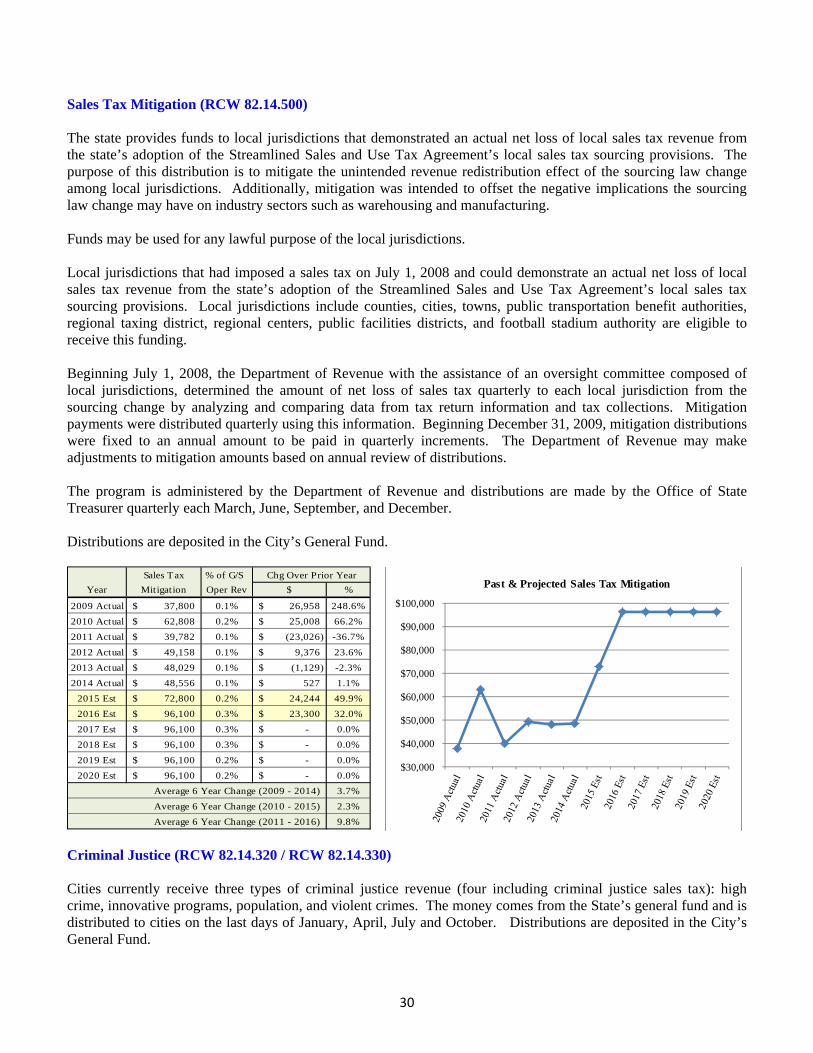
Sales Tax Mitigation (RCW 82.14.500) The state provides funds to local jurisdictions that demonstrated an actual net loss of local sales tax revenue from the state’s adoption of the Streamlined Sales and Use Tax Agreement’s local sales tax sourcing provisions. The purpose of this distribution is to mitigate the unintended revenue redistribution effect of the sourcing law change among local jurisdictions. Additionally, mitigation was intended to offset the negative implications the sourcing law change may have on industry sectors such as warehousing and manufacturing. Funds may be used for any lawful purpose of the local jurisdictions. Local jurisdictions that had imposed a sales tax on July 1, 2008 and could demonstrate an actual net loss of local sales tax revenue from the state’s adoption of the Streamlined Sales and Use Tax Agreement’s local sales tax sourcing provisions. Local jurisdictions include counties, cities, towns, public transportation benefit authorities, regional taxing district, regional centers, public facilities districts, and football stadium authority are eligible to receive this funding. Beginning July 1, 2008, the Department of Revenue with the assistance of an oversight committee composed of local jurisdictions, determined the amount of net loss of sales tax quarterly to each local jurisdiction from the sourcing change by analyzing and comparing data from tax return information and tax collections. Mitigation payments were distributed quarterly using this information. Beginning December 31, 2009, mitigation distributions were fixed to an annual amount to be paid in quarterly increments. The Department of Revenue may make adjustments to mitigation amounts based on annual review of distributions. The program is administered by the Department of Revenue and distributions are made by the Office of State Treasurer quarterly each March, June, September, and December. Distributions are deposited in the City’s General Fund.
Sales Tax % of G/S Chg Over Prior Year
Year Mitigation Oper Rev $ %
2009 Actual 37,800$ 0.1% 26,958$ 248.6%
2010 Actual 62,808$ 0.2% 25,008$ 66.2%
2011 Actual 39,782$ 0.1% (23,026)$ -36.7%
2012 Actual 49,158$ 0.1% 9,376$ 23.6%
2013 Actual 48,029$ 0.1% (1,129)$ -2.3%
2014 Actual 48,556$ 0.1% 527$ 1.1%
2015 Est 72,800$ 0.2% 24,244$ 49.9%
2016 Est 96,100$ 0.3% 23,300$ 32.0%
2017 Est 96,100$ 0.3% -$ 0.0%
2018 Est 96,100$ 0.3% -$ 0.0%
2019 Est 96,100$ 0.2% -$ 0.0%
2020 Est 96,100$ 0.2% -$ 0.0%
Average 6 Year Change (2009 - 2014) 3.7%
Average 6 Year Change (2010 - 2015) 2.3%
Average 6 Year Change (2011 - 2016) 9.8% Criminal Justice (RCW 82.14.320 / RCW 82.14.330) Cities currently receive three types of criminal justice revenue (four including criminal justice sales tax): high crime, innovative programs, population, and violent crimes. The money comes from the State’s general fund and is distributed to cities on the last days of January, April, July and October. Distributions are deposited in the City’s General Fund.
$30,000
$40,000
$50,000
$60,000
$70,000
$80,000
$90,000
$100,000
Past & Projected Sales Tax Mitigation
31
Population, Violent Crime, Innovative Programs and Contracted Programs (RCW 82.14.330) The state provides formula funding for criminal justices purposes to cities and towns each fiscal year. The purpose of these funds is to provide fiscal assistance to local governments for criminal justice systems in order to ensure public safety. “Contracted Programs”, “Violent Crime,” and “Population” distributions must be used for criminal justice purposes as activities that substantially assist the criminal justice system, including domestic violence programs and advocates as defined in RCW 70.12.020. The uses are the same as for high crime except it cannot be used for publications and public educational efforts dealing with runaway or at-risk youth. Additionally, these distributions may not be used to replace or supplant existing funding, which is defined as calendar year 1989 actual operating expenditures for criminal justice purposes, excluding expenditures for extraordinary events not likely to reoccur; changes in contracted for criminal justice services, beyond the control of the jurisdiction receiving the services; and major nonrecurring capital expenditures. “Innovative Programs” distributions must be used for 1) innovative law enforcement strategies; 2) programs to help at-risk children or child abuse victim response programs; and 3) programs designed to reduce the level of domestic violence or to provide counseling for domestic violence victims. All cities and towns are eligible for “Population” and “Innovative Programs” distribution. Cities that contract with another governmental agency for the majority of the city’s law enforcement services may notify the Department of Commerce by November 30th of their eligibility to receive “Contracted Services” distribution the following calendar year. The City of Lakewood does not receive the “Contracted Programs” distribution since it has its own police force. Cities and towns eligible for a “Violent Crime” distribution must have a three-year average violent crime in excess of 150% of the statewide three-year average violent crime as reported annually by the Washington Association of Sheriffs and Police Chiefs. RCW 82.14.320 directs a state general fund transfer each fiscal year into the Municipal Criminal Justice Assistant Account. The transfer is to increase each fiscal year by the state’s fiscal grown factor under RCW 43.135.025.
Sixteen percent (16%) of these funds are distributed ratably to cities based on population, with each city receiving a minimum of $1,000 per year.
Twenty percent (20%) is distributed based on population to those cities that have had an average violent crime rate in the last three years that is 150% of the statewide average for those three years, but no more than $1 per capita.
Ten percent (10%) of funds are distributed on a per capita basis to “Contracted Services” cities and towns.
Fifty-four percent (54%) of funds are distributed on a per capita basis for “Innovative Programs.”
No city or town may receive more than 30% of total funds Population and High Crime Distributions. Cities receive two Municipal Criminal Justice Assistance distributions based solely on population, but are combined into a single distribution by the Office of the State Treasurer. Distributions are made by the Office of the State Treasurer quarterly each January, April, July and October.

32
Criminal % of G/S Chg Over Prior Year
Year Justice Oper Rev $ %
2009 Actual 108,068$ 0.3% 40,629$ 60.2%
2010 Actual 111,107$ 0.3% 3,039$ 2.8%
2011 Actual 109,056$ 0.3% (2,051)$ -1.8%
2012 Actual 113,161$ 0.3% 4,105$ 3.8%
2013 Actual 121,197$ 0.3% 8,035$ 7.1%
2014 Actual 136,811$ 0.4% 15,614$ 12.9%
2015 Est 128,900$ 0.4% (7,911)$ -5.8%
2016 Est 134,100$ 0.4% 5,200$ 4.0%
2017 Est 134,100$ 0.4% -$ 0.0%
2018 Est 134,100$ 0.4% -$ 0.0%
2019 Est 134,100$ 0.3% -$ 0.0%
2020 Est 134,100$ 0.3% -$ 0.0%
Average 6 Year Change (2009 - 2014) 3.5%
Average 6 Year Change (2010 - 2015) 2.3%
Average 6 Year Change (2011 - 2016) 3.1% DUI Assistance (RCW 46.68.260) The state provides Impaired Driving Safety Account Funds to counties, cities and towns to help offset costs for implementing criminal justice laws related to driving under the influence. The purpose is to offset county, city and town criminal justice costs from ten separate driving under the influence laws enacted in 1998. Funds must be used for enforcing laws relating to driving and boating while under the influence of either an intoxicating liquor or any drug. The Impaired Driving Safety Account receives a portion (63%) of a $150 fee charged to reissue a driver’s license after suspension or revocation due to a violation of RCW 46.20.308 (implied consent), RCW 46.61.502 (driving under the influence) and/or RCW 46.61.504 (physical control of a vehicle under the influence. Impaired Driving Safety Account funds are distributed to counties, cities and towns through an omnibus operating budget appropriation to the County Criminal Justice Assistance Account and the Municipal Criminal Justice Assistance Account. Total funds deposited in the account are split between counties (60%) and cities and towns (40%); this fund split was established with the first appropriation in 1998. Individual cities receive their share ratably based on population as provided in RCW 82.14.330. Distributions are made by the Office of State Treasurer quarterly each January, April, July and October.
$100,000
$110,000
$120,000
$130,000
$140,000
Past & Projected Criminal Justice
DUI % of G/S Chg Over Prior Year
Year Cities Oper Rev $ %
2009 Actual 19,363$ 0.1% (27,825)$ -59.0%
2010 Actual 10,834$ 0.0% (8,529)$ -44.0%
2011 Actual 12,413$ 0.0% 1,580$ 14.6%
2012 Actual 10,722$ 0.0% (1,692)$ -13.6%
2013 Actual 10,658$ 0.0% (64)$ -0.6%
2014 Actual 10,358$ 0.0% (300)$ -2.8%
2015 Est 15,500$ 0.0% 5,142$ 49.6%
2016 Est 16,100$ 0.0% 600$ 3.9%
2017 Est 16,100$ 0.0% -$ 0.0%
2018 Est 16,100$ 0.0% -$ 0.0%
2019 Est 16,100$ 0.0% -$ 0.0%
2020 Est 16,100$ 0.0% -$ 0.0%
Average 6 Year Change (2009 - 2014) -14.5%
Average 6 Year Change (2010 - 2015) 5.0%
Average 6 Year Change (2011 - 2016) 3.8%
$5,000
$10,000
$15,000
$20,000
Past & Projected DUI Cities
33
High Crime (RCW 82.14.320) The state provides formula funding for criminal justice purposes to cities and towns each fiscal year. The purpose of these funds is to provide fiscal assistance to local governments for criminal justice systems in order to ensure public safety. Funds must be used for criminal justice purposes defined as activities that substantially assist the criminal justice system, including domestic violence programs and advocates as defined in RCW 70.123.020, and publications and educational efforts to assist parents dealing with runaway or at-risk youth. Funds may not be used to replace or supplant existing funding, which is defined as calendar year 1989 actual operating expenditures for extraordinary events not likely to reoccur; changes in contracted for criminal justice services, beyond the control of the local jurisdiction receiving the services; and major nonrecurring capital expenditures.
All cities and towns are eligible for a “Population” distribution. To qualify for the “high crime” distribution cities and towns must:
Have a crime rate in excess of 125% of the state-wide average as calculated in the most recent annual
report on crime in Washington State is published by the Washington Association of Sheriffs and Police Chiefs;
Be levying, at the maximum rate, the second ½ cent of the sales tax or half cent real estate excise tax; and
Have a per capita yield from the first ½ cent of the sales tax of less than 150% of the state-wide average per capita yield for all cities.
Cities have to re-qualify for the distribution each year based on the above criteria. The determination is made in July of each year for distribution in the four quarters of the state fiscal year (July 1st – June 30th).
RCW 82.14.320 directs a state general fund transfer each fiscal year into the Municipal Criminal Justice Assistance Account. The transfer is to increase each year by the state’s fiscal growth factor under RCW 43.135.025.
Seventy percent (70%) of the funds are distributed to individual cities and towns ratably by population.
Thirty percent (30%) of the funds are distributed ratably by population to cities and towns eligible for a “High Crime” distribution and have a crime rate greater than 175% of the statewide average crime rate. No city may receive more than 50% of these funds; if a city or town distribution is reduced because of this limit, the excess is added to the pool of funds to be distributed by population-only.
No city or town may receive more than 30% of funds through both “Population” and “High Crime” distributions.
The City has received criminal justice high crime funding since 1997 and continues to qualify for the distribution through June 30, 2015.

34
Criminal Justice % of G/S Chg Over Prior Year
Year High Crime Oper Rev $ %
2009 Actual 139,494$ 0.4% 7,811$ 5.9%
2010 Actual 132,507$ 0.4% (6,987)$ -5.0%
2011 Actual 119,789$ 0.4% (12,718)$ -9.6%
2012 Actual 125,164$ 0.4% 5,375$ 4.5%
2013 Actual 263,208$ 0.7% 138,044$ 110.3%
2014 Actual 332,925$ 0.9% 69,717$ 26.5%
2015 Est 236,700$ 0.7% (96,225)$ -28.9%
2016 Est 236,700$ 0.6% -$ 0.0%
2017 Est 236,700$ 0.6% -$ 0.0%
2018 Est 236,700$ 0.6% -$ 0.0%
2019 Est 236,700$ 0.6% -$ 0.0%
2020 Est 236,700$ 0.6% -$ 0.0%
Average 6 Year Change (2009 - 2014) 9.7%
Average 6 Year Change (2010 - 2015) 7.3%
Average 6 Year Change (2011 - 2016) 8.2% Leasehold Excise Tax (RCW 82.29A) A county or city may impose a local leasehold excise tax that is credited against the state leasehold tax on the privilege of using or occupying publicly owned real or personal property through a leasehold. Through the credit, the local government receives a portion of the state leasehold excise tax rather than leaseholders paying an additional local leasehold excise tax. The purpose of the leasehold excise tax is “in lieu” of property tax. The distribution to taxing districts provides revenue that would otherwise be generated by the property tax. Funds may be used for any lawful purpose of the local taxing district. Local taxing districts in counties and cities that have imposed a local leasehold excise tax are eligible to receive the funds. Counties and cities are authorized to impose a local leasehold tax on taxable rent at the rate of 6% and 4%, respectively, to be credited against the state’s leasehold excise tax rate of 12.84%. Counties must provide a credit for the full amount of any city tax imposed upon the same taxable event. As a result, the effective rate of the state leasehold excise tax is 6.84%. County treasurers are required to district any county imposed leasehold tax to other taxing districts, excluding cities, according to each district’s pro rata share of the property tax in the county. The program is administered by the Department and Revenue and distributions are made by the Office of State Treasurer on the last business day of even numbered months. Distributions are deposited in the City’s General Fund.
$100,000
$150,000
$200,000
$250,000
$300,000
$350,000
Past & Projected Criminal Justice High Crime
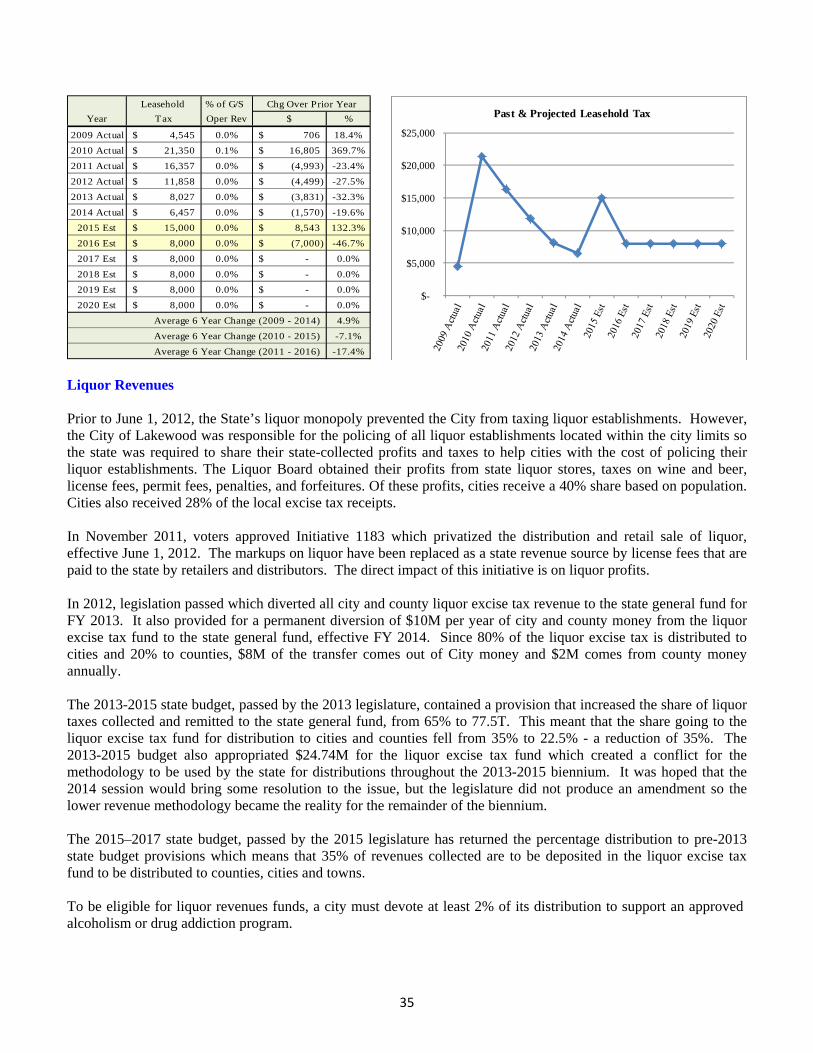
35
Leasehold % of G/S Chg Over Prior Year
Year Tax Oper Rev $ %
2009 Actual 4,545$ 0.0% 706$ 18.4%
2010 Actual 21,350$ 0.1% 16,805$ 369.7%
2011 Actual 16,357$ 0.0% (4,993)$ -23.4%
2012 Actual 11,858$ 0.0% (4,499)$ -27.5%
2013 Actual 8,027$ 0.0% (3,831)$ -32.3%
2014 Actual 6,457$ 0.0% (1,570)$ -19.6%
2015 Est 15,000$ 0.0% 8,543$ 132.3%
2016 Est 8,000$ 0.0% (7,000)$ -46.7%
2017 Est 8,000$ 0.0% -$ 0.0%
2018 Est 8,000$ 0.0% -$ 0.0%
2019 Est 8,000$ 0.0% -$ 0.0%
2020 Est 8,000$ 0.0% -$ 0.0%
Average 6 Year Change (2009 - 2014) 4.9%
Average 6 Year Change (2010 - 2015) -7.1%
Average 6 Year Change (2011 - 2016) -17.4% Liquor Revenues Prior to June 1, 2012, the State’s liquor monopoly prevented the City from taxing liquor establishments. However, the City of Lakewood was responsible for the policing of all liquor establishments located within the city limits so the state was required to share their state-collected profits and taxes to help cities with the cost of policing their liquor establishments. The Liquor Board obtained their profits from state liquor stores, taxes on wine and beer, license fees, permit fees, penalties, and forfeitures. Of these profits, cities receive a 40% share based on population. Cities also received 28% of the local excise tax receipts. In November 2011, voters approved Initiative 1183 which privatized the distribution and retail sale of liquor, effective June 1, 2012. The markups on liquor have been replaced as a state revenue source by license fees that are paid to the state by retailers and distributors. The direct impact of this initiative is on liquor profits.
In 2012, legislation passed which diverted all city and county liquor excise tax revenue to the state general fund for FY 2013. It also provided for a permanent diversion of $10M per year of city and county money from the liquor excise tax fund to the state general fund, effective FY 2014. Since 80% of the liquor excise tax is distributed to cities and 20% to counties, $8M of the transfer comes out of City money and $2M comes from county money annually.
The 2013-2015 state budget, passed by the 2013 legislature, contained a provision that increased the share of liquor taxes collected and remitted to the state general fund, from 65% to 77.5T. This meant that the share going to the liquor excise tax fund for distribution to cities and counties fell from 35% to 22.5% - a reduction of 35%. The 2013-2015 budget also appropriated $24.74M for the liquor excise tax fund which created a conflict for the methodology to be used by the state for distributions throughout the 2013-2015 biennium. It was hoped that the 2014 session would bring some resolution to the issue, but the legislature did not produce an amendment so the lower revenue methodology became the reality for the remainder of the biennium. The 2015–2017 state budget, passed by the 2015 legislature has returned the percentage distribution to pre-2013 state budget provisions which means that 35% of revenues collected are to be deposited in the liquor excise tax fund to be distributed to counties, cities and towns. To be eligible for liquor revenues funds, a city must devote at least 2% of its distribution to support an approved alcoholism or drug addiction program.
$-
$5,000
$10,000
$15,000
$20,000
$25,000
Past & Projected Leasehold Tax

36
Liquor Excise Tax (RCW 82.08.150 through RCW 82.08.170, RCW 66.08.195, RCW 66.08.200, RCW 66.08.210, RCW 66.24.290, RCW 70.96A.085, RCW 70.96A.8) The liquor excise tax is the state distributed tax on liquor sold by spirit retail license. With the exception of border areas, distribution is based on population, except that local governments that prohibit the sale of liquor within their jurisdictions do not share in the distribution. For border areas, the distribution includes the tax imposed on all beer. For 2015, the first three distributions from the State Treasurer reflects the 2013-2015 state budget provision and the final distribution in September will be made under the 2015-2017 state budget, split 80% to cities and 20% to counties. For 2016, all of the distributions will be calculated using the original distribution, wherein the state general fund receives 65% of liquor tax collections and 35% will go into the liquor excise tax fund for distribution to counties, cities and towns less the $10M ($2.5M a quarter) permanent transfer to the state general fund. The State Treasurer distributes liquor excise tax revenues to the City in January, April, July and September which are deposited in the City’s General Fund.
$50,000
$100,000
$150,000
$200,000
$250,000
$300,000
$350,000
Past & Projected Liquor Excise Tax
Liquor Profits (RCW 66.08.190 through RCW 66.08.210, RCW 70.96A.085, RCW 70.96A.087, RCW 66.24.065) Under Initiative 1183 passed in November 2011, the state collects revenue in the form of license fees from distributors and retailers. A portion of these “liquor profits” (the Liquor Control Board continues to call these funds “liquor profits”) goes to cities, counties, and border cities and counties. The distribution of spirit license fees through the liquor revolving fund to border areas, counties, cities, towns and the municipal research center must be made in a manner that provides that each category of recipients receive, in the aggregate, no less that it received from the liquor revolving fund during comparable periods prior to December 8, 2011.
Liquor % of G/S Chg Over Prior Year
Year Excise Tax Oper Rev $ %
2009 Actual 289,374$ 0.9% 3,644$ 1.3%
2010 Actual 291,060$ 0.9% 1,686$ 0.6%
2011 Actual 283,260$ 0.9% (7,800)$ -2.7%
2012 Actual 145,808$ 0.4% (137,452)$ -48.5%
2013 Actual 77,675$ 0.2% (68,133)$ -46.7%
2014 Actual 99,953$ 0.3% 22,278$ 28.7%
2015 Est 161,100$ 0.4% 61,147$ 61.2%
2016 Est 258,500$ 0.7% 97,400$ 60.5%
2017 Est 267,900$ 0.7% 9,400$ 3.6%
2018 Est 267,900$ 0.7% -$ 0.0%
2019 Est 267,900$ 0.7% -$ 0.0%
2020 Est 267,900$ 0.7% -$ 0.0%
Average 6 Year Change (2009 - 2014) -31.6%
Average 6 Year Change (2010 - 2015) -13.4%
Average 6 Year Change (2011 - 2016) -1.6%

37
The “comparable periods prior to December 8, 2011” were determined by the Office of Financial Management to be December 2010, March 2011, July 2011, and September 2011. An additional distribution of ten million dollars per year from the spirits license fees was added to enhance public safety programs. Three-tenths of one percent (0.3%) is distributed to border areas, counties, and towns. Of the remaining amount, the distribution is 80% to cities and 20% to counties. Each city and county must split its distributions so that it can account separately for the portion that can be spent for any general purpose and the portion that must be spent to enhance public safety programs. To make this split, 20.23% of liquor profits for enhancing public safety. The liquor control board profits are the state distribution of a portion of beer tax and spirit fees. Distribution is based on population, except that local governments that prohibit the sale of liquor within their jurisdictions do not share in the distribution. The State Treasurer distributes liquor excise tax revenues to the City in January, April, July and September which are deposited in the City’s General Fund.
Liquor Board % of G/S Chg Over Prior Year
Year Profits Oper Rev $ %
2009 Actual 404,466$ 1.2% 6,040$ 1.5%
2010 Actual 470,667$ 1.5% 66,201$ 16.4%
2011 Actual 405,405$ 1.2% (65,262)$ -13.9%
2012 Actual 580,449$ 1.7% 175,044$ 43.2%
2013 Actual 523,698$ 1.5% (56,751)$ -9.8%
2014 Actual 518,105$ 1.4% (5,593)$ -1.1%
2015 Est 511,200$ 1.4% (6,905)$ -1.3%
2016 Est 502,500$ 1.4% (8,700)$ -1.7%
2017 Est 498,400$ 1.3% (4,100)$ -0.8%
2018 Est 498,400$ 1.3% -$ 0.0%
2019 Est 498,400$ 1.3% -$ 0.0%
2020 Est 498,400$ 1.3% -$ 0.0%
Average 6 Year Change (2009 - 2014) 3.7%
Average 6 Year Change (2010 - 2015) 1.3%
Average 6 Year Change (2011 - 2016) 3.2%
Motor Vehicle Fuel Tax (RCW 46.68) This tax is placed on the sale of motor vehicle gas in the State of Washington. Taxes on motor vehicle fuels from prior month's collections of the preceding month's station sales are to be used for construction, improvements, and repair of highways, streets and roads. The motor vehicle fuel tax (MVET) is levied on consumption rather than price. The state currently levies a tax of 37.5 cents per gallon on motor vehicle fuel under RCW 82.36.025(1) through (6) and on special fuel (diesel) under RCW 82.38.030(1) through (6). Cities receive 10.6961% of the 23 cents per gallon tax levied under RCW 82.36.025(1) and RCW 82.38.030(1), from which some small deductions are made. Cities also are given 8.3333% share of the 3 cent taxes levied under RCW 82.36.025(3) and (4) and RCW 82.38.030(3) and (4). These funds are distributed on a per capita basis and are to be placed in the city’s Street Operations & Maintenance Fund and Transportation Capital Fund to be spent for: salaries and wages, material, supplies, equipment, purchase or condemnation of right-of-way, engineering or any other proper highway or street purpose in connection with the construction, alteration, repair, improvement or maintenance of city street or bridge, or viaduct of under passage along, upon or across such streets.
$350,000
$400,000
$450,000
$500,000
$550,000
$600,000
Past & Projected Liquor Board Profits
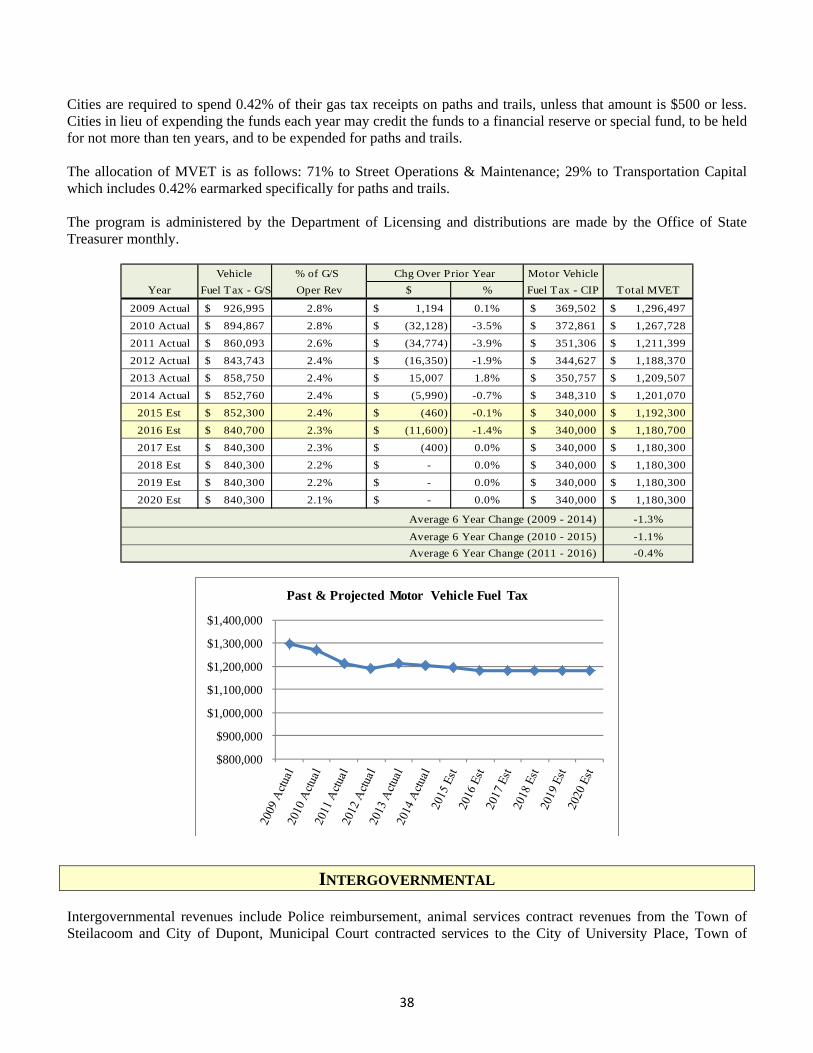
38
Cities are required to spend 0.42% of their gas tax receipts on paths and trails, unless that amount is $500 or less. Cities in lieu of expending the funds each year may credit the funds to a financial reserve or special fund, to be held for not more than ten years, and to be expended for paths and trails. The allocation of MVET is as follows: 71% to Street Operations & Maintenance; 29% to Transportation Capital which includes 0.42% earmarked specifically for paths and trails. The program is administered by the Department of Licensing and distributions are made by the Office of State Treasurer monthly.
Vehicle % of G/S Chg Over Prior Year Motor Vehicle
Year Fuel Tax - G/S Oper Rev $ % Fuel Tax - CIP Total MVET
2009 Actual 926,995$ 2.8% 1,194$ 0.1% 369,502$ 1,296,497$
2010 Actual 894,867$ 2.8% (32,128)$ -3.5% 372,861$ 1,267,728$
2011 Actual 860,093$ 2.6% (34,774)$ -3.9% 351,306$ 1,211,399$
2012 Actual 843,743$ 2.4% (16,350)$ -1.9% 344,627$ 1,188,370$
2013 Actual 858,750$ 2.4% 15,007$ 1.8% 350,757$ 1,209,507$
2014 Actual 852,760$ 2.4% (5,990)$ -0.7% 348,310$ 1,201,070$
2015 Est 852,300$ 2.4% (460)$ -0.1% 340,000$ 1,192,300$
2016 Est 840,700$ 2.3% (11,600)$ -1.4% 340,000$ 1,180,700$
2017 Est 840,300$ 2.3% (400)$ 0.0% 340,000$ 1,180,300$
2018 Est 840,300$ 2.2% -$ 0.0% 340,000$ 1,180,300$
2019 Est 840,300$ 2.2% -$ 0.0% 340,000$ 1,180,300$
2020 Est 840,300$ 2.1% -$ 0.0% 340,000$ 1,180,300$
Average 6 Year Change (2009 - 2014) -1.3%
Average 6 Year Change (2010 - 2015) -1.1%
Average 6 Year Change (2011 - 2016) -0.4%
INTERGOVERNMENTAL Intergovernmental revenues include Police reimbursement, animal services contract revenues from the Town of Steilacoom and City of Dupont, Municipal Court contracted services to the City of University Place, Town of
$800,000
$900,000
$1,000,000
$1,100,000
$1,200,000
$1,300,000
$1,400,000
Past & Projected Motor Vehicle Fuel Tax
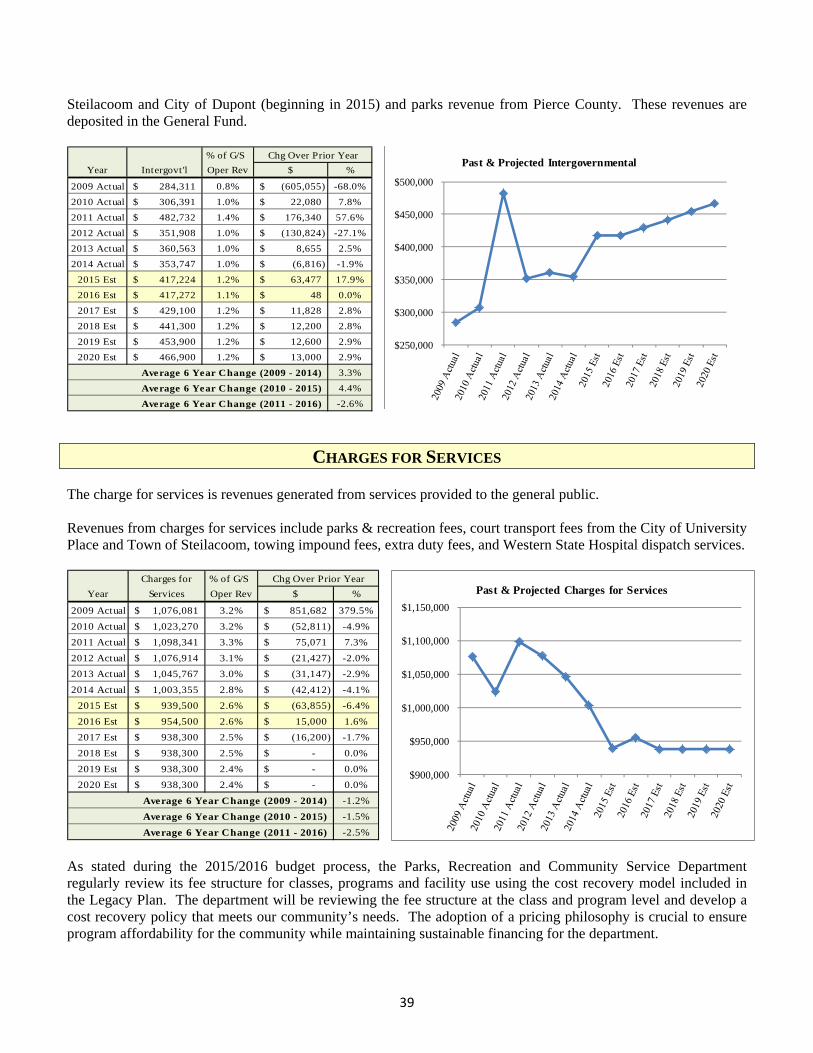
39
Steilacoom and City of Dupont (beginning in 2015) and parks revenue from Pierce County. These revenues are deposited in the General Fund.
$250,000
$300,000
$350,000
$400,000
$450,000
$500,000
Past & Projected Intergovernmental
CHARGES FOR SERVICES The charge for services is revenues generated from services provided to the general public. Revenues from charges for services include parks & recreation fees, court transport fees from the City of University Place and Town of Steilacoom, towing impound fees, extra duty fees, and Western State Hospital dispatch services.
$900,000
$950,000
$1,000,000
$1,050,000
$1,100,000
$1,150,000
Past & Projected Charges for Services
As stated during the 2015/2016 budget process, the Parks, Recreation and Community Service Department regularly review its fee structure for classes, programs and facility use using the cost recovery model included in the Legacy Plan. The department will be reviewing the fee structure at the class and program level and develop a cost recovery policy that meets our community’s needs. The adoption of a pricing philosophy is crucial to ensure program affordability for the community while maintaining sustainable financing for the department.
% of G/S Chg Over Prior Year
Year Intergovt 'l Oper Rev $ %
2009 Actual 284,311$ 0.8% (605,055)$ -68.0%
2010 Actual 306,391$ 1.0% 22,080$ 7.8%
2011 Actual 482,732$ 1.4% 176,340$ 57.6%
2012 Actual 351,908$ 1.0% (130,824)$ -27.1%
2013 Actual 360,563$ 1.0% 8,655$ 2.5%
2014 Actual 353,747$ 1.0% (6,816)$ -1.9%
2015 Est 417,224$ 1.2% 63,477$ 17.9%
2016 Est 417,272$ 1.1% 48$ 0.0%
2017 Est 429,100$ 1.2% 11,828$ 2.8%
2018 Est 441,300$ 1.2% 12,200$ 2.8%
2019 Est 453,900$ 1.2% 12,600$ 2.9%
2020 Est 466,900$ 1.2% 13,000$ 2.9%
Average 6 Year Change (2009 - 2014) 3.3%
Average 6 Year Change (2010 - 2015) 4.4%
Average 6 Year Change (2011 - 2016) -2.6%
Charges for % of G/S Chg Over Prior Year
Year Services Oper Rev $ %
2009 Actual 1,076,081$ 3.2% 851,682$ 379.5%
2010 Actual 1,023,270$ 3.2% (52,811)$ -4.9%
2011 Actual 1,098,341$ 3.3% 75,071$ 7.3%
2012 Actual 1,076,914$ 3.1% (21,427)$ -2.0%
2013 Actual 1,045,767$ 3.0% (31,147)$ -2.9%
2014 Actual 1,003,355$ 2.8% (42,412)$ -4.1%
2015 Est 939,500$ 2.6% (63,855)$ -6.4%
2016 Est 954,500$ 2.6% 15,000$ 1.6%
2017 Est 938,300$ 2.5% (16,200)$ -1.7%
2018 Est 938,300$ 2.5% -$ 0.0%
2019 Est 938,300$ 2.4% -$ 0.0%
2020 Est 938,300$ 2.4% -$ 0.0%
Average 6 Year Change (2009 - 2014) -1.2%
Average 6 Year Change (2010 - 2015) -1.5%
Average 6 Year Change (2011 - 2016) -2.5%
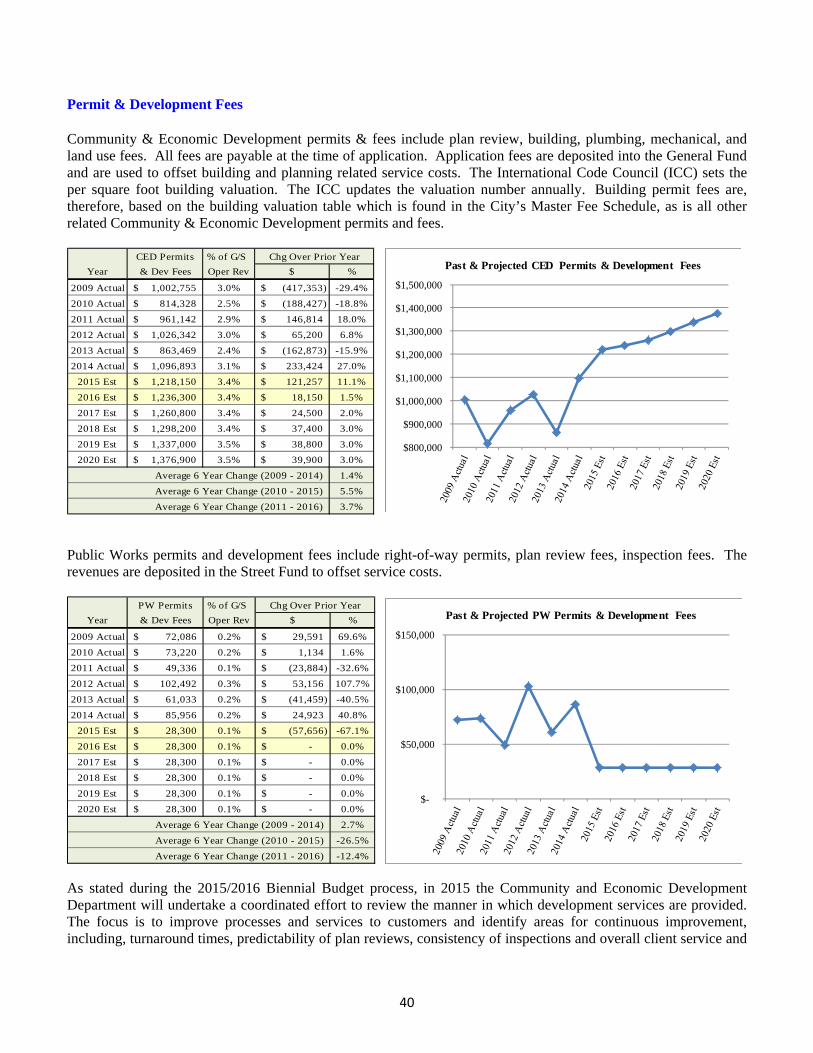
40
Permit & Development Fees Community & Economic Development permits & fees include plan review, building, plumbing, mechanical, and land use fees. All fees are payable at the time of application. Application fees are deposited into the General Fund and are used to offset building and planning related service costs. The International Code Council (ICC) sets the per square foot building valuation. The ICC updates the valuation number annually. Building permit fees are, therefore, based on the building valuation table which is found in the City’s Master Fee Schedule, as is all other related Community & Economic Development permits and fees.
Public Works permits and development fees include right-of-way permits, plan review fees, inspection fees. The revenues are deposited in the Street Fund to offset service costs.
PW Permits % of G/S Chg Over Prior Year
Year & Dev Fees Oper Rev $ %
2009 Actual 72,086$ 0.2% 29,591$ 69.6%
2010 Actual 73,220$ 0.2% 1,134$ 1.6%
2011 Actual 49,336$ 0.1% (23,884)$ -32.6%
2012 Actual 102,492$ 0.3% 53,156$ 107.7%
2013 Actual 61,033$ 0.2% (41,459)$ -40.5%
2014 Actual 85,956$ 0.2% 24,923$ 40.8%
2015 Est 28,300$ 0.1% (57,656)$ -67.1%
2016 Est 28,300$ 0.1% -$ 0.0%
2017 Est 28,300$ 0.1% -$ 0.0%
2018 Est 28,300$ 0.1% -$ 0.0%
2019 Est 28,300$ 0.1% -$ 0.0%
2020 Est 28,300$ 0.1% -$ 0.0%
Average 6 Year Change (2009 - 2014) 2.7%
Average 6 Year Change (2010 - 2015) -26.5%
Average 6 Year Change (2011 - 2016) -12.4%
As stated during the 2015/2016 Biennial Budget process, in 2015 the Community and Economic Development Department will undertake a coordinated effort to review the manner in which development services are provided. The focus is to improve processes and services to customers and identify areas for continuous improvement, including, turnaround times, predictability of plan reviews, consistency of inspections and overall client service and
CED Permits % of G/S Chg Over Prior Year
Year & Dev Fees Oper Rev $ %
2009 Actual 1,002,755$ 3.0% (417,353)$ -29.4%
2010 Actual 814,328$ 2.5% (188,427)$ -18.8%
2011 Actual 961,142$ 2.9% 146,814$ 18.0%
2012 Actual 1,026,342$ 3.0% 65,200$ 6.8%
2013 Actual 863,469$ 2.4% (162,873)$ -15.9%
2014 Actual 1,096,893$ 3.1% 233,424$ 27.0%
2015 Est 1,218,150$ 3.4% 121,257$ 11.1%
2016 Est 1,236,300$ 3.4% 18,150$ 1.5%
2017 Est 1,260,800$ 3.4% 24,500$ 2.0%
2018 Est 1,298,200$ 3.4% 37,400$ 3.0%
2019 Est 1,337,000$ 3.5% 38,800$ 3.0%
2020 Est 1,376,900$ 3.5% 39,900$ 3.0%
Average 6 Year Change (2009 - 2014) 1.4%
Average 6 Year Change (2010 - 2015) 5.5%
Average 6 Year Change (2011 - 2016) 3.7%
$800,000
$900,000
$1,000,000
$1,100,000
$1,200,000
$1,300,000
$1,400,000
$1,500,000
Past & Projected CED Permits & Development Fees
$-
$50,000
$100,000
$150,000
Past & Projected PW Permits & Development Fees

41
satisfaction. It will also include a review of fees and charges, program recovery ratios and resource needs. The goal is to have a streamlined, coordinated and predictable development service program that provides efficient review of project applications in a manner that meets the definition of success for both the City and prospective applicants. Work is currently underway on this project. Surface Water Management Fees The Surface Water Management (SWM) fund manages surface water run-off accounts for the City’s only utility operation. The City applies a rate structure as a utility service charge to all parcels within the City and those incorporated areas defined by an interlocal drainage agreement as authorized by the City’s municipal code. The purpose of this charge is to provide resources to plan, manage, design, construct, maintain, revise, and upgrade the storm drainage and surface water runoff systems within the corporate limits of the City of Lakewood. This authority is invoked to minimize the property damage, promote and protect public health, safety , and welfare, minimize water quality degradation by preventing siltation, contamination and erosion of the City’s waterways, protect aquifers, insure the safety of City streets, and rights-of-way, assure compliance with federal and state storm drainage, surface water management, and water quality regulations and legislation, increase educational and recreational opportunities, encourage the preservation of natural drainage systems, and foster other beneficial public uses. All parcels are subject to a service charge with some exceptions. The following parcels are exempt from paying the utility service charge: all parcels consisting of mineral rights only; all parcels consisting of entirely tidelands, rivers, lakes, creeks and/or streams; all vacant/undeveloped parcels less than two-tenths (2/10ths) of an acre (8,712 square feet) in total area; all parcels within national parks due to minuscule amount of impervious area compared to the pristine nature of total acreage protected for future generations; all parcels that are used for church, community center, community hall, grange or community service-oriented purposes as well as those owned by an organization with nonprofit benefit as defined by state statute. Low income senior citizens and disabled persons receiving relief under RCW 84.36.381 receive partial exemption from surface water service charges and surcharge as defined in the City’s municipal code. The annual service charge rates are as follows:
Type Fee Residential $77.40 Duplex $101.15 Multi-Family $0.03102 per square foot of impervious area, less an additional $5.00 All Mobile Homes other than Residential
$40.70 per vacant or occupied mobile home site (mobile home equivalent) plus $0.03102 per square foot of impervious areas in addition to mobile home site.
Vacant/Undeveloped $0.410 per acre, less an additional $5.00, but in no case shall the minimum service charge be less than $15.98
Forest and Timber Land $15.98 per parcel, plus $0.410/acre on lands classified as forest lands under RCW 84.33 or RCW 84.34
City Streets, Roads and Public Highways
$0.00930 per square feet of impervious area, less an additional $5.00
All Other Parcels $0.03102 per square foot of impervious area, less an additional $5.00, but in no case shall the minimum service charge be less than the higher of the residential equivalent rate for each year of the charge for a vacant/undeveloped parcel of equal acreage.
The annual service charge is calculated based on impervious area and parcel status as of January 1 each year. The annual service charge is due the City on or before April 30 of each year and shall be paid together with payment of
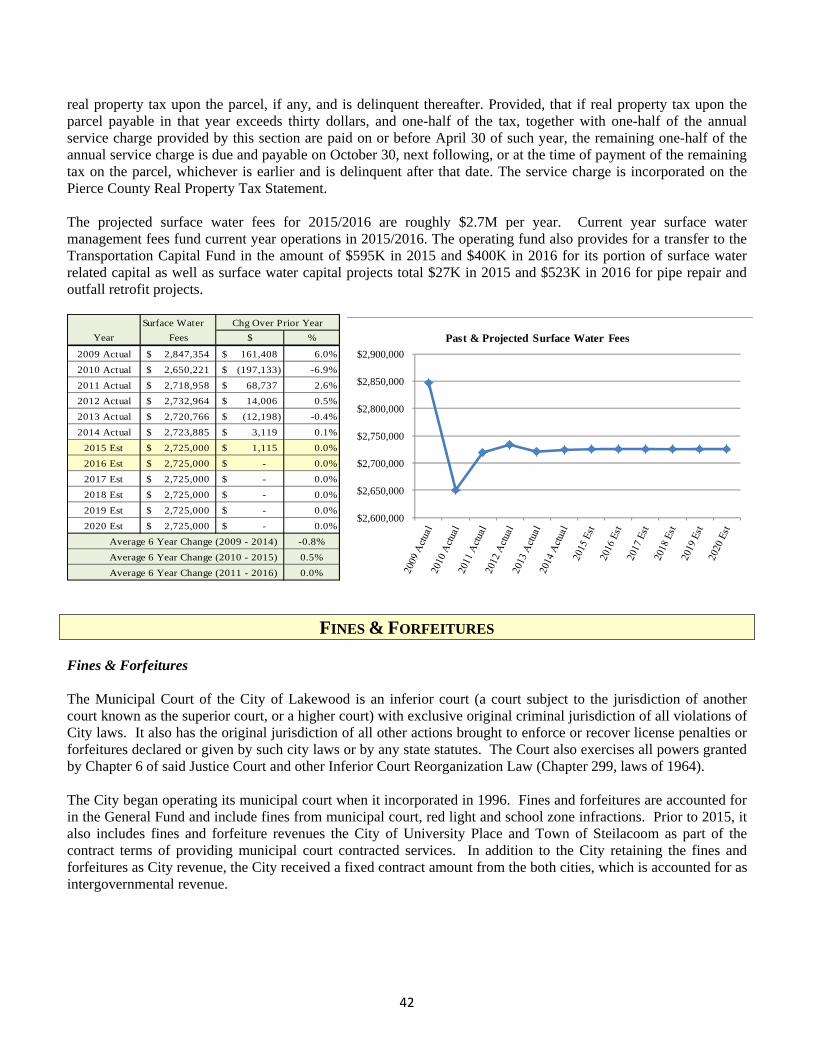
42
real property tax upon the parcel, if any, and is delinquent thereafter. Provided, that if real property tax upon the parcel payable in that year exceeds thirty dollars, and one-half of the tax, together with one-half of the annual service charge provided by this section are paid on or before April 30 of such year, the remaining one-half of the annual service charge is due and payable on October 30, next following, or at the time of payment of the remaining tax on the parcel, whichever is earlier and is delinquent after that date. The service charge is incorporated on the Pierce County Real Property Tax Statement. The projected surface water fees for 2015/2016 are roughly $2.7M per year. Current year surface water management fees fund current year operations in 2015/2016. The operating fund also provides for a transfer to the Transportation Capital Fund in the amount of $595K in 2015 and $400K in 2016 for its portion of surface water related capital as well as surface water capital projects total $27K in 2015 and $523K in 2016 for pipe repair and outfall retrofit projects.
Surface Water Chg Over Prior Year
Year Fees $ %
2009 Actual 2,847,354$ 161,408$ 6.0%
2010 Actual 2,650,221$ (197,133)$ -6.9%
2011 Actual 2,718,958$ 68,737$ 2.6%
2012 Actual 2,732,964$ 14,006$ 0.5%
2013 Actual 2,720,766$ (12,198)$ -0.4%
2014 Actual 2,723,885$ 3,119$ 0.1%
2015 Est 2,725,000$ 1,115$ 0.0%
2016 Est 2,725,000$ -$ 0.0%
2017 Est 2,725,000$ -$ 0.0%
2018 Est 2,725,000$ -$ 0.0%
2019 Est 2,725,000$ -$ 0.0%
2020 Est 2,725,000$ -$ 0.0%
Average 6 Year Change (2009 - 2014) -0.8%
Average 6 Year Change (2010 - 2015) 0.5%
Average 6 Year Change (2011 - 2016) 0.0%
FINES & FORFEITURES Fines & Forfeitures The Municipal Court of the City of Lakewood is an inferior court (a court subject to the jurisdiction of another court known as the superior court, or a higher court) with exclusive original criminal jurisdiction of all violations of City laws. It also has the original jurisdiction of all other actions brought to enforce or recover license penalties or forfeitures declared or given by such city laws or by any state statutes. The Court also exercises all powers granted by Chapter 6 of said Justice Court and other Inferior Court Reorganization Law (Chapter 299, laws of 1964). The City began operating its municipal court when it incorporated in 1996. Fines and forfeitures are accounted for in the General Fund and include fines from municipal court, red light and school zone infractions. Prior to 2015, it also includes fines and forfeiture revenues the City of University Place and Town of Steilacoom as part of the contract terms of providing municipal court contracted services. In addition to the City retaining the fines and forfeitures as City revenue, the City received a fixed contract amount from the both cities, which is accounted for as intergovernmental revenue.
$2,600,000
$2,650,000
$2,700,000
$2,750,000
$2,800,000
$2,850,000
$2,900,000
Past & Projected Surface Water Fees
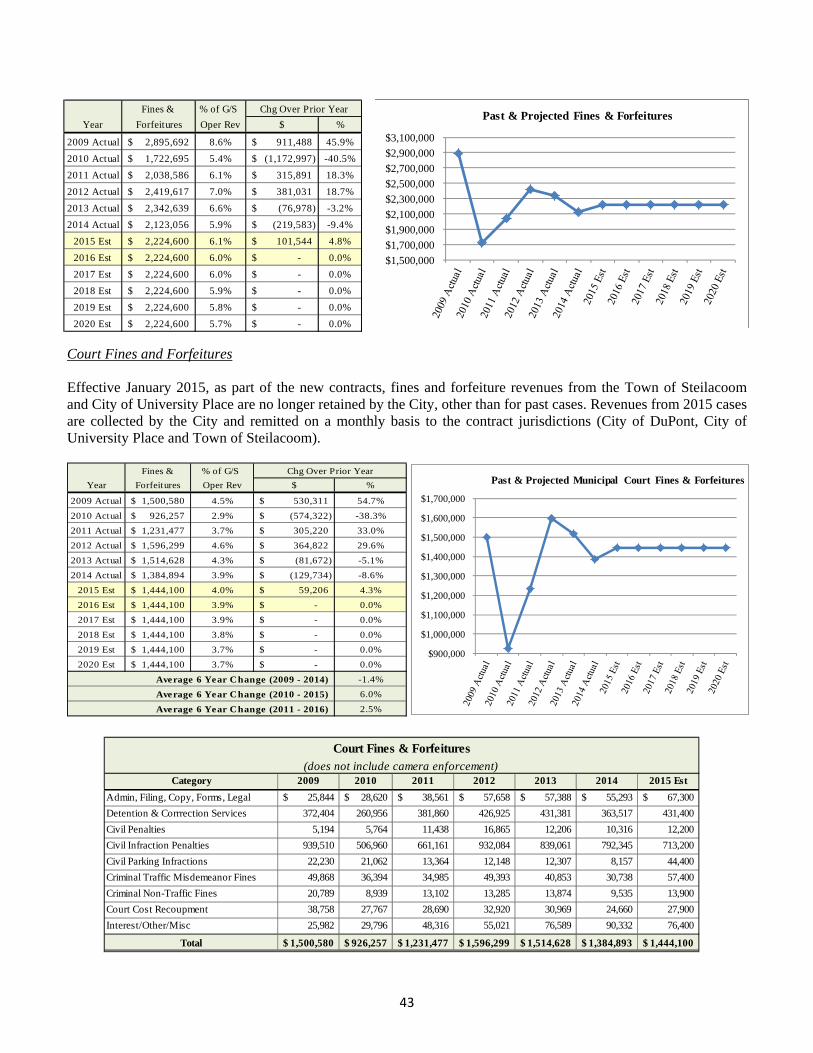
43
Court Fines and Forfeitures Effective January 2015, as part of the new contracts, fines and forfeiture revenues from the Town of Steilacoom and City of University Place are no longer retained by the City, other than for past cases. Revenues from 2015 cases are collected by the City and remitted on a monthly basis to the contract jurisdictions (City of DuPont, City of University Place and Town of Steilacoom).
Fines & % of G/S Chg Over Prior Year
Year Forfeitures Oper Rev $ %
2009 Actual 1,500,580$ 4.5% 530,311$ 54.7%
2010 Actual 926,257$ 2.9% (574,322)$ -38.3%
2011 Actual 1,231,477$ 3.7% 305,220$ 33.0%
2012 Actual 1,596,299$ 4.6% 364,822$ 29.6%
2013 Actual 1,514,628$ 4.3% (81,672)$ -5.1%
2014 Actual 1,384,894$ 3.9% (129,734)$ -8.6%
2015 Est 1,444,100$ 4.0% 59,206$ 4.3%
2016 Est 1,444,100$ 3.9% -$ 0.0%
2017 Est 1,444,100$ 3.9% -$ 0.0%
2018 Est 1,444,100$ 3.8% -$ 0.0%
2019 Est 1,444,100$ 3.7% -$ 0.0%
2020 Est 1,444,100$ 3.7% -$ 0.0%
Average 6 Year Change (2009 - 2014) -1.4%
Average 6 Year Change (2010 - 2015) 6.0%
Average 6 Year Change (2011 - 2016) 2.5%
Fines & % of G/S Chg Over Prior Year
Year Forfeitures Oper Rev $ %
2009 Actual 2,895,692$ 8.6% 911,488$ 45.9%
2010 Actual 1,722,695$ 5.4% (1,172,997)$ -40.5%
2011 Actual 2,038,586$ 6.1% 315,891$ 18.3%
2012 Actual 2,419,617$ 7.0% 381,031$ 18.7%
2013 Actual 2,342,639$ 6.6% (76,978)$ -3.2%
2014 Actual 2,123,056$ 5.9% (219,583)$ -9.4%
2015 Est 2,224,600$ 6.1% 101,544$ 4.8%
2016 Est 2,224,600$ 6.0% -$ 0.0%
2017 Est 2,224,600$ 6.0% -$ 0.0%
2018 Est 2,224,600$ 5.9% -$ 0.0%
2019 Est 2,224,600$ 5.8% -$ 0.0%
2020 Est 2,224,600$ 5.7% -$ 0.0%
$1,500,000
$1,700,000
$1,900,000
$2,100,000
$2,300,000
$2,500,000
$2,700,000
$2,900,000
$3,100,000
Past & Projected Fines & Forfeitures
$900,000
$1,000,000
$1,100,000
$1,200,000
$1,300,000
$1,400,000
$1,500,000
$1,600,000
$1,700,000
Past & Projected Municipal Court Fines & Forfeitures
Court Fines & Forfeitures (does not include camera enforcement)
Category 2009 2010 2011 2012 2013 2014 2015 Est
Admin, Filing, Copy, Forms, Legal 25,844$ 28,620$ 38,561$ 57,658$ 57,388$ 55,293$ 67,300$
Detention & Corrrection Services 372,404 260,956 381,860 426,925 431,381 363,517 431,400
Civil Penalties 5,194 5,764 11,438 16,865 12,206 10,316 12,200
Civil Infraction Penalties 939,510 506,960 661,161 932,084 839,061 792,345 713,200
Civil Parking Infractions 22,230 21,062 13,364 12,148 12,307 8,157 44,400
Criminal Traffic Misdemeanor Fines 49,868 36,394 34,985 49,393 40,853 30,738 57,400
Criminal Non-Traffic Fines 20,789 8,939 13,102 13,285 13,874 9,535 13,900
Court Cost Recoupment 38,758 27,767 28,690 32,920 30,969 24,660 27,900
Interest/Other/Misc 25,982 29,796 48,316 55,021 76,589 90,332 76,400
Total 1,500,580$ 926,257$ 1,231,477$ 1,596,299$ 1,514,628$ 1,384,893$ 1,444,100$
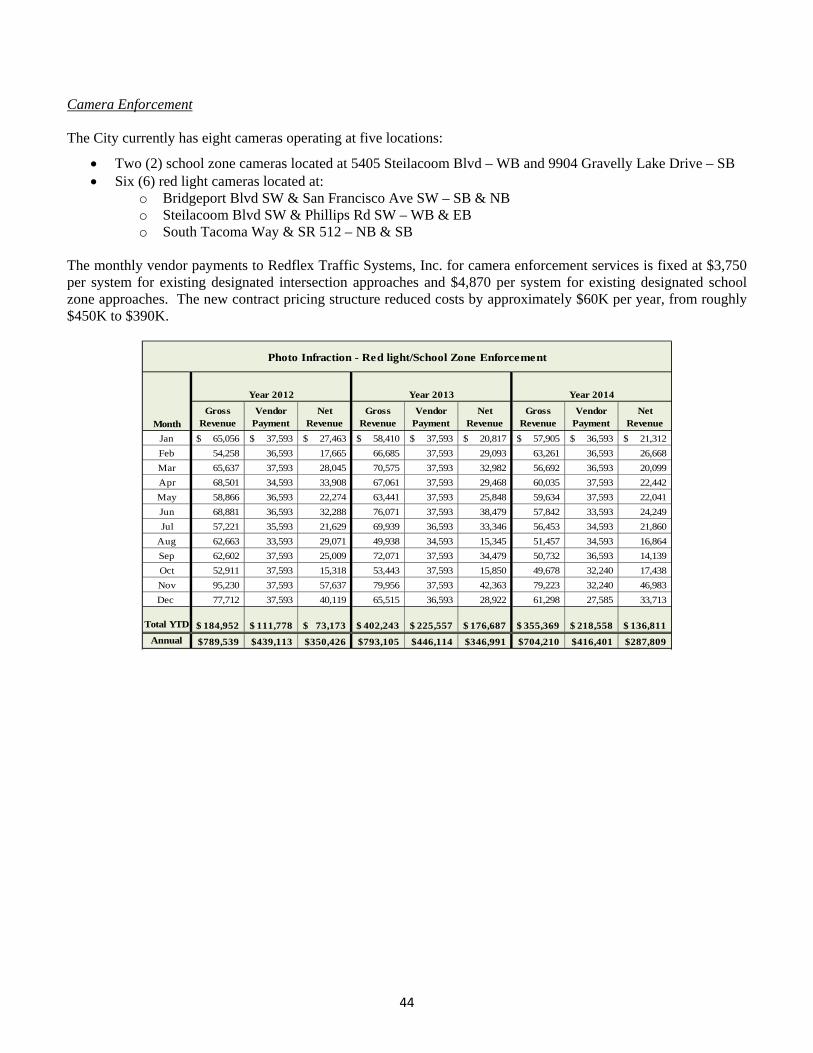
44
Camera Enforcement The City currently has eight cameras operating at five locations:
Two (2) school zone cameras located at 5405 Steilacoom Blvd – WB and 9904 Gravelly Lake Drive – SB Six (6) red light cameras located at:
o Bridgeport Blvd SW & San Francisco Ave SW – SB & NB o Steilacoom Blvd SW & Phillips Rd SW – WB & EB o South Tacoma Way & SR 512 – NB & SB
The monthly vendor payments to Redflex Traffic Systems, Inc. for camera enforcement services is fixed at $3,750 per system for existing designated intersection approaches and $4,870 per system for existing designated school zone approaches. The new contract pricing structure reduced costs by approximately $60K per year, from roughly $450K to $390K.
Photo Infraction - Red light/School Zone Enforcement
Year 2012 Year 2013 Year 2014
MonthGross
RevenueVendor
PaymentNet
RevenueGross
RevenueVendor
PaymentNet
RevenueGross
RevenueVendor
PaymentNet
Revenue
Jan 65,056$ 37,593$ 27,463$ 58,410$ 37,593$ 20,817$ 57,905$ 36,593$ 21,312$
Feb 54,258 36,593 17,665 66,685 37,593 29,093 63,261 36,593 26,668
Mar 65,637 37,593 28,045 70,575 37,593 32,982 56,692 36,593 20,099
Apr 68,501 34,593 33,908 67,061 37,593 29,468 60,035 37,593 22,442
May 58,866 36,593 22,274 63,441 37,593 25,848 59,634 37,593 22,041
Jun 68,881 36,593 32,288 76,071 37,593 38,479 57,842 33,593 24,249
Jul 57,221 35,593 21,629 69,939 36,593 33,346 56,453 34,593 21,860
Aug 62,663 33,593 29,071 49,938 34,593 15,345 51,457 34,593 16,864
Sep 62,602 37,593 25,009 72,071 37,593 34,479 50,732 36,593 14,139
Oct 52,911 37,593 15,318 53,443 37,593 15,850 49,678 32,240 17,438
Nov 95,230 37,593 57,637 79,956 37,593 42,363 79,223 32,240 46,983
Dec 77,712 37,593 40,119 65,515 36,593 28,922 61,298 27,585 33,713
Total YTD 184,952$ 111,778$ 73,173$ 402,243$ 225,557$ 176,687$ 355,369$ 218,558$ 136,811$
Annual 789,539$ 439,113$ 350,426$ 793,105$ 446,114$ 346,991$ 704,210$ 416,401$ 287,809$

45
EXPENDITURES Expenditure Assumptions Expenditure inflationary increases assumes a 7.5% increase in benefits, 2% for intergovernmental; 3% for internal service charges; 3% for salaries and wages (step increases based on performance) and 0% for all other expenditures. Based on a weighted average, the increase is 3% annually. City Council
City Manager
% of G/S Chg Over Prior Year
Year City Manager Oper Exp $ %
2009 Actual 511,061$ 1.5% (44,635)$ -8.0%
2010 Actual 490,397$ 1.4% (20,664)$ -4.0%
2011 Actual 482,766$ 1.4% (7,632)$ -1.6%
2012 Actual 409,921$ 1.2% (72,845)$ -15.1%
2013 Actual 419,386$ 1.2% 9,465$ 2.3%
2014 Actual 528,918$ 1.5% 109,532$ 26.1%
2015 Est 563,590$ 1.6% 34,672$ 6.6%
2016 Est 552,260$ 1.5% (11,330)$ -2.0%
2017 Est 569,000$ 1.5% 16,740$ 3.0%
2018 Est 586,000$ 1.5% 17,000$ 3.0%
2019 Est 603,000$ 1.5% 17,000$ 2.9%
2020 Est 621,000$ 1.5% 18,000$ 3.0%
Average 6 Year Change (2009 - 2014) 0.6%
Average 6 Year Change (2010 - 2015) 2.2%
Average 6 Year Change (2011 - 2016) 2.1%
% of G/S Chg Over Prior Year
Year City Council Oper Exp $ %
2009 Actual 91,945$ 0.3% (9,001)$ -8.9%
2010 Actual 93,597$ 0.3% 1,652$ 1.8%
2011 Actual 99,617$ 0.3% 6,020$ 6.4%
2012 Actual 97,927$ 0.3% (1,689)$ -1.7%
2013 Actual 85,530$ 0.2% (12,397)$ -12.7%
2014 Actual 94,441$ 0.3% 8,911$ 10.4%
2015 Est 111,125$ 0.3% 16,684$ 17.7%
2016 Est 136,290$ 0.4% 25,165$ 22.6%
2017 Est 139,200$ 0.4% 2,910$ 2.1%
2018 Est 142,200$ 0.4% 3,000$ 2.2%
2019 Est 145,200$ 0.4% 3,000$ 2.1%
2020 Est 148,200$ 0.4% 3,000$ 2.1%
Average 6 Year Change (2009 - 2014) 0.4%
Average 6 Year Change (2010 - 2015) 2.6%
Average 6 Year Change (2011 - 2016) 4.5%
$-
$50,000
$100,000
$150,000
$200,000
Past & Projected City Council
$300,000
$350,000
$400,000
$450,000
$500,000
$550,000
$600,000
$650,000
$700,000
Past & Projected City Manager
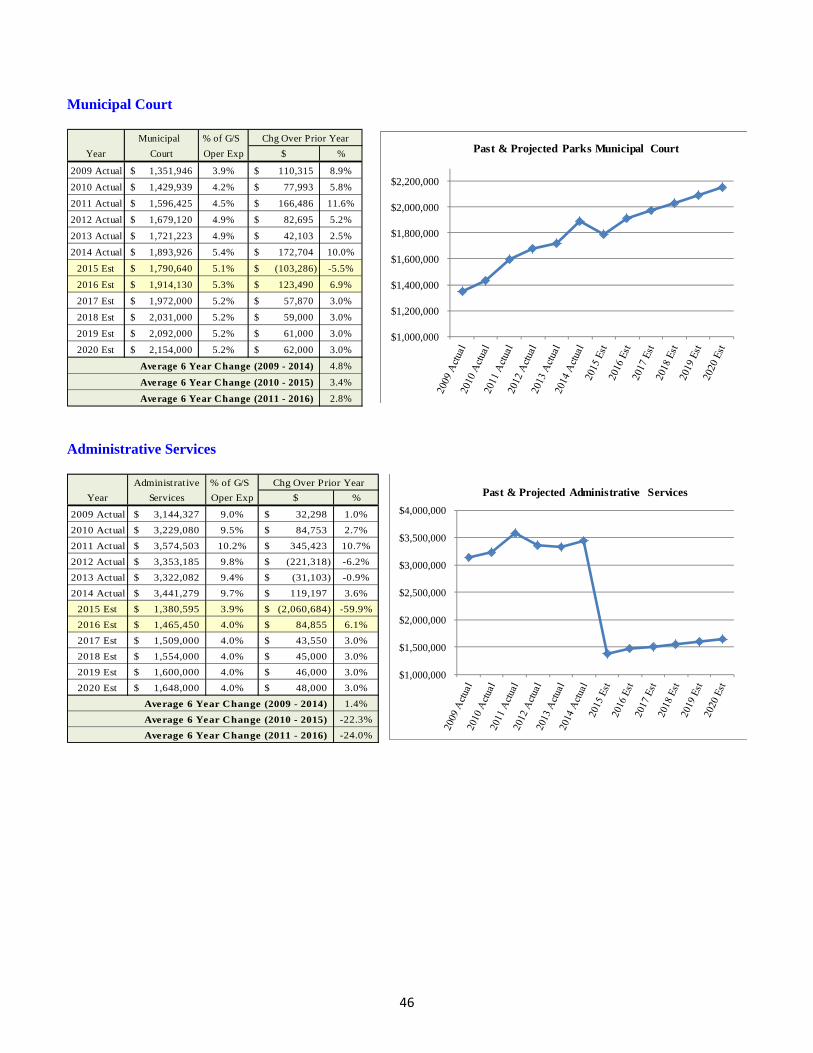
46
Municipal Court
Municipal % of G/S Chg Over Prior Year
Year Court Oper Exp $ %
2009 Actual 1,351,946$ 3.9% 110,315$ 8.9%
2010 Actual 1,429,939$ 4.2% 77,993$ 5.8%
2011 Actual 1,596,425$ 4.5% 166,486$ 11.6%
2012 Actual 1,679,120$ 4.9% 82,695$ 5.2%
2013 Actual 1,721,223$ 4.9% 42,103$ 2.5%
2014 Actual 1,893,926$ 5.4% 172,704$ 10.0%
2015 Est 1,790,640$ 5.1% (103,286)$ -5.5%
2016 Est 1,914,130$ 5.3% 123,490$ 6.9%
2017 Est 1,972,000$ 5.2% 57,870$ 3.0%
2018 Est 2,031,000$ 5.2% 59,000$ 3.0%
2019 Est 2,092,000$ 5.2% 61,000$ 3.0%
2020 Est 2,154,000$ 5.2% 62,000$ 3.0%
Average 6 Year Change (2009 - 2014) 4.8%
Average 6 Year Change (2010 - 2015) 3.4%
Average 6 Year Change (2011 - 2016) 2.8% Administrative Services
Administrative % of G/S Chg Over Prior Year
Year Services Oper Exp $ %
2009 Actual 3,144,327$ 9.0% 32,298$ 1.0%
2010 Actual 3,229,080$ 9.5% 84,753$ 2.7%
2011 Actual 3,574,503$ 10.2% 345,423$ 10.7%
2012 Actual 3,353,185$ 9.8% (221,318)$ -6.2%
2013 Actual 3,322,082$ 9.4% (31,103)$ -0.9%
2014 Actual 3,441,279$ 9.7% 119,197$ 3.6%
2015 Est 1,380,595$ 3.9% (2,060,684)$ -59.9%
2016 Est 1,465,450$ 4.0% 84,855$ 6.1%
2017 Est 1,509,000$ 4.0% 43,550$ 3.0%
2018 Est 1,554,000$ 4.0% 45,000$ 3.0%
2019 Est 1,600,000$ 4.0% 46,000$ 3.0%
2020 Est 1,648,000$ 4.0% 48,000$ 3.0%
Average 6 Year Change (2009 - 2014) 1.4%
Average 6 Year Change (2010 - 2015) -22.3%
Average 6 Year Change (2011 - 2016) -24.0%
$1,000,000
$1,200,000
$1,400,000
$1,600,000
$1,800,000
$2,000,000
$2,200,000
Past & Projected Parks Municipal Court
$1,000,000
$1,500,000
$2,000,000
$2,500,000
$3,000,000
$3,500,000
$4,000,000
Past & Projected Administrative Services

47
Non-Department
Administrative % of G/S Chg Over Prior Year
Year Services Oper Exp $ %
2009 Actual 3,144,327$ 9.0% 32,298$ 1.0%
2010 Actual 3,229,080$ 9.5% 84,753$ 2.7%
2011 Actual 3,574,503$ 10.2% 345,423$ 10.7%
2012 Actual 3,353,185$ 9.8% (221,318)$ -6.2%
2013 Actual 3,322,082$ 9.4% (31,103)$ -0.9%
2014 Actual 3,441,279$ 9.7% 119,197$ 3.6%
2015 Est 1,380,595$ 3.9% (2,060,684)$ -59.9%
2016 Est 1,465,450$ 4.0% 84,855$ 6.1%
2017 Est 1,509,000$ 4.0% 43,550$ 3.0%
2018 Est 1,554,000$ 4.0% 45,000$ 3.0%
2019 Est 1,600,000$ 4.0% 46,000$ 3.0%
2020 Est 1,648,000$ 4.0% 48,000$ 3.0%
Average 6 Year Change (2009 - 2014) 1.4%
Average 6 Year Change (2010 - 2015) -22.3%
Average 6 Year Change (2011 - 2016) -24.0%
Legal
% of G/S Chg Over Prior Year
Year Legal Oper Exp $ %
2009 Actual 1,424,993$ 4.1% (77,418)$ -5.2%
2010 Actual 1,404,412$ 4.1% (20,581)$ -1.4%
2011 Actual 1,511,178$ 4.3% 106,766$ 7.6%
2012 Actual 1,407,092$ 4.1% (104,086)$ -6.9%
2013 Actual 1,249,436$ 3.5% (157,656)$ -11.2%
2014 Actual 1,272,057$ 3.6% 22,621$ 1.8%
2015 Est 1,580,960$ 4.5% 308,903$ 24.3%
2016 Est 1,591,360$ 4.4% 10,400$ 0.7%
2017 Est 1,701,000$ 4.5% 109,640$ 6.9%
2018 Est 1,683,000$ 4.3% (18,000)$ -1.1%
2019 Est 1,795,000$ 4.5% 112,000$ 6.7%
2020 Est 1,779,000$ 4.3% (16,000)$ -0.9%
Average 6 Year Change (2009 - 2014) -2.0%
Average 6 Year Change (2010 - 2015) 1.9%
Average 6 Year Change (2011 - 2016) 0.8%
$700,000
$900,000
$1,100,000
$1,300,000
$1,500,000
$1,700,000
$1,900,000
Past & Projected Legal
$1,000,000
$1,500,000
$2,000,000
$2,500,000
$3,000,000
$3,500,000
$4,000,000
Past & Projected Administrative Services

48
Community & Economic Development
Community & % of G/S Chg Over Prior Year
Year Economic Dev Oper Exp $ %
2009 Actual 2,400,933$ 6.9% 363,884$ 17.9%
2010 Actual 2,208,234$ 6.5% (192,699)$ -8.0%
2011 Actual 2,145,108$ 6.1% (63,126)$ -2.9%
2012 Actual 2,036,213$ 6.0% (108,895)$ -5.1%
2013 Actual 2,219,754$ 6.3% 183,541$ 9.0%
2014 Actual 2,068,245$ 5.8% (151,509)$ -6.8%
2015 Est 1,871,135$ 5.3% (197,110)$ -9.5%
2016 Est 1,989,196$ 5.5% 118,061$ 6.3%
2017 Est 2,048,000$ 5.4% 58,804$ 3.0%
2018 Est 2,108,000$ 5.4% 60,000$ 2.9%
2019 Est 2,171,000$ 5.4% 63,000$ 3.0%
2020 Est 2,235,000$ 5.4% 64,000$ 2.9%
Average 6 Year Change (2009 - 2014) -2.7%
Average 6 Year Change (2010 - 2015) -3.0%
Average 6 Year Change (2011 - 2016) -1.3%
Parks, Recreation & Community Services
Parks, Rec, & % of G/S Chg Over Prior Year
Year Community Svcs Oper Exp $ %
2009 Actual 2,040,225$ 5.8% (64,318)$ -3.1%
2010 Actual 2,066,238$ 6.1% 26,013$ 1.3%
2011 Actual 2,165,104$ 6.1% 98,866$ 4.8%
2012 Actual 2,165,776$ 6.4% 672$ 0.0%
2013 Actual 1,997,690$ 5.7% (168,086)$ -7.8%
2014 Actual 2,155,686$ 6.1% 157,996$ 7.9%
2015 Est 2,428,260$ 6.9% 272,574$ 12.6%
2016 Est 2,483,650$ 6.8% 55,390$ 2.3%
2017 Est 2,534,000$ 6.7% 50,350$ 2.0%
2018 Est 2,610,000$ 6.7% 76,000$ 3.0%
2019 Est 2,688,000$ 6.7% 78,000$ 3.0%
2020 Est 2,768,000$ 6.7% 80,000$ 3.0%
Average 6 Year Change (2009 - 2014) 0.9%
Average 6 Year Change (2010 - 2015) 2.5%
Average 6 Year Change (2011 - 2016) 2.1%
$1,800,000
$2,000,000
$2,200,000
$2,400,000
$2,600,000
Past & Projected Community & Economic Development
$1,800,000
$2,000,000
$2,200,000
$2,400,000
$2,600,000
$2,800,000
$3,000,000
Past & Parks, Recreation & Community Services

49
Police
% of G/S Chg Over Prior Year
Year Police Oper Exp $ %
2009 Actual 19,064,039$ 54.4% 1,277,724$ 7.2%
2010 Actual 19,032,395$ 55.8% (31,644)$ -0.2%
2011 Actual 19,265,013$ 54.7% 232,618$ 1.2%
2012 Actual 19,297,759$ 56.7% 32,746$ 0.2%
2013 Actual 19,844,706$ 56.2% 546,946$ 2.8%
2014 Actual 19,600,949$ 55.4% (243,757)$ -1.2%
2015 Est 21,031,567$ 59.5% 1,430,618$ 7.3%
2016 Est 21,373,122$ 58.8% 341,555$ 1.6%
2017 Est 21,992,000$ 58.3% 618,878$ 2.9%
2018 Est 22,628,000$ 58.2% 636,000$ 2.9%
2019 Est 23,283,000$ 58.1% 655,000$ 2.9%
2020 Est 23,957,000$ 58.2% 674,000$ 2.9%
Average 6 Year Change (2009 - 2014) 0.5%
Average 6 Year Change (2010 - 2015) 1.6%
Average 6 Year Change (2011 - 2016) 1.6% Property Management
Property % of G/S Chg Over Prior Year
Year Management Oper Exp $ %
2009 Actual 740,718$ 2.1% (57,237)$ -7.2%
2010 Actual 791,204$ 2.3% 50,486$ 6.8%
2011 Actual 759,895$ 2.2% (31,309)$ -4.0%
2012 Actual 819,370$ 2.4% 59,475$ 7.8%
2013 Actual 861,916$ 2.4% 42,547$ 5.2%
2014 Actual 825,723$ 2.3% (36,193)$ -4.2%
2015 Est -$ 0.0% (825,723)$ -100.0%
2016 Est -$ 0.0% -$ n/a
2017 Est -$ 0.0% -$ n/a
2018 Est -$ 0.0% -$ n/a
2019 Est -$ 0.0% -$ n/a
2020 Est -$ 0.0% -$ n/a
Average 6 Year Change (2009 - 2014) 1.7%
Average 6 Year Change (2010 - 2015) n/a
Average 6 Year Change (2011 - 2016) n/a
$18,000,000
$19,000,000
$20,000,000
$21,000,000
$22,000,000
$23,000,000
$24,000,000
$25,000,000
Past & Projected Police
$-
$100,000
$200,000
$300,000
$400,000
$500,000
$600,000
$700,000
$800,000
$900,000
Past & Projected Property Management
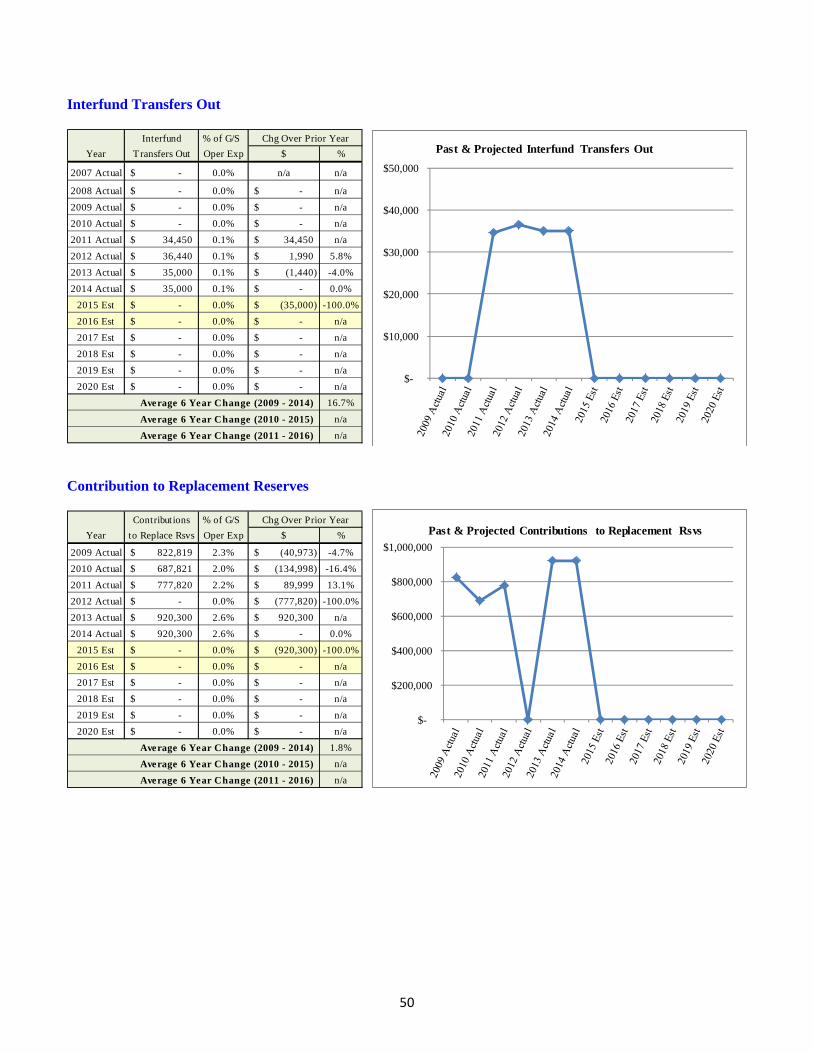
50
Interfund Transfers Out
Interfund % of G/S Chg Over Prior Year
Year Transfers Out Oper Exp $ %
2007 Actual -$ 0.0% n/a n/a
2008 Actual -$ 0.0% -$ n/a
2009 Actual -$ 0.0% -$ n/a
2010 Actual -$ 0.0% -$ n/a
2011 Actual 34,450$ 0.1% 34,450$ n/a
2012 Actual 36,440$ 0.1% 1,990$ 5.8%
2013 Actual 35,000$ 0.1% (1,440)$ -4.0%
2014 Actual 35,000$ 0.1% -$ 0.0%
2015 Est -$ 0.0% (35,000)$ -100.0%
2016 Est -$ 0.0% -$ n/a
2017 Est -$ 0.0% -$ n/a
2018 Est -$ 0.0% -$ n/a
2019 Est -$ 0.0% -$ n/a
2020 Est -$ 0.0% -$ n/a
Average 6 Year Change (2009 - 2014) 16.7%
Average 6 Year Change (2010 - 2015) n/a
Average 6 Year Change (2011 - 2016) n/a
Contribution to Replacement Reserves
Contributions % of G/S Chg Over Prior Year
Year to Replace Rsvs Oper Exp $ %
2009 Actual 822,819$ 2.3% (40,973)$ -4.7%
2010 Actual 687,821$ 2.0% (134,998)$ -16.4%
2011 Actual 777,820$ 2.2% 89,999$ 13.1%
2012 Actual -$ 0.0% (777,820)$ -100.0%
2013 Actual 920,300$ 2.6% 920,300$ n/a
2014 Actual 920,300$ 2.6% -$ 0.0%
2015 Est -$ 0.0% (920,300)$ -100.0%
2016 Est -$ 0.0% -$ n/a
2017 Est -$ 0.0% -$ n/a
2018 Est -$ 0.0% -$ n/a
2019 Est -$ 0.0% -$ n/a
2020 Est -$ 0.0% -$ n/a
Average 6 Year Change (2009 - 2014) 1.8%
Average 6 Year Change (2010 - 2015) n/a
Average 6 Year Change (2011 - 2016) n/a
$-
$10,000
$20,000
$30,000
$40,000
$50,000
Past & Projected Interfund Transfers Out
$-
$200,000
$400,000
$600,000
$800,000
$1,000,000
Past & Projected Contributions to Replacement Rsvs

51
Public Works
Public Works % of G/S Chg Over Prior Year
Year Street O&M Oper Exp $ %
2009 Actual 2,914,841$ 8.3% 428,077$ 17.2%
2010 Actual 2,079,639$ 6.1% (835,202)$ -28.7%
2011 Actual 2,168,166$ 6.2% 88,527$ 4.3%
2012 Actual 2,136,773$ 6.3% (31,393)$ -1.4%
2013 Actual 2,110,188$ 6.0% (26,585)$ -1.2%
2014 Actual 2,066,337$ 5.8% (43,851)$ -2.1%
2015 Est 1,819,386$ 5.2% (246,951)$ -12.0%
2016 Est 1,779,960$ 5.0% (39,426)$ -2.2%
2017 Est 1,833,000$ 5.0% 53,040$ 3.0%
2018 Est 1,888,000$ 5.0% 55,000$ 3.0%
2019 Est 1,944,000$ 5.0% 56,000$ 3.0%
2020 Est 2,002,000$ 5.0% 58,000$ 3.0%
Average 6 Year Change (2009 - 2014) -6.8%
Average 6 Year Change (2010 - 2015) -2.4%
Average 6 Year Change (2011 - 2016) -3.6%
$-
$500,000
$1,000,000
$1,500,000
$2,000,000
$2,500,000
$3,000,000
$3,500,000
Past & Projected Public Works Street O&M
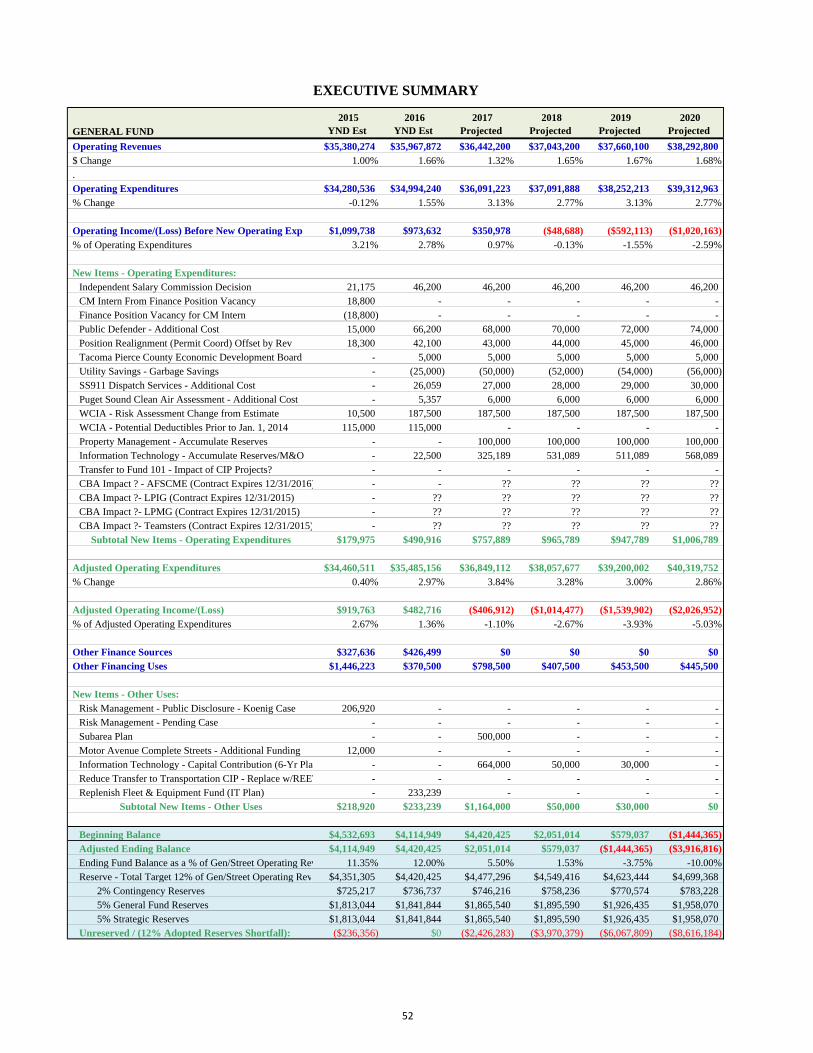
EXECUTIVE SUMMARY
GENERAL FUND 2015
YND Est 2016
YND Est 2017
Projected 2018
Projected 2019
Projected 2020
Projected
Operating Revenues $35,380,274 $35,967,872 $36,442,200 $37,043,200 $37,660,100 $38,292,800$ Change 1.00% 1.66% 1.32% 1.65% 1.67% 1.68%.Operating Expenditures $34,280,536 $34,994,240 $36,091,223 $37,091,888 $38,252,213 $39,312,963% Change -0.12% 1.55% 3.13% 2.77% 3.13% 2.77%
Operating Income/(Loss) Before New Operating Exp $1,099,738 $973,632 $350,978 ($48,688) ($592,113) ($1,020,163)% of Operating Expenditures 3.21% 2.78% 0.97% -0.13% -1.55% -2.59%
New Items - Operating Expenditures:Independent Salary Commission Decision 21,175 46,200 46,200 46,200 46,200 46,200 CM Intern From Finance Position Vacancy 18,800 - - - - - Finance Position Vacancy for CM Intern (18,800) - - - - - Public Defender - Additional Cost 15,000 66,200 68,000 70,000 72,000 74,000 Position Realignment (Permit Coord) Offset by Rev 18,300 42,100 43,000 44,000 45,000 46,000 Tacoma Pierce County Economic Development Board - 5,000 5,000 5,000 5,000 5,000 Utility Savings - Garbage Savings - (25,000) (50,000) (52,000) (54,000) (56,000) SS911 Dispatch Services - Additional Cost - 26,059 27,000 28,000 29,000 30,000 Puget Sound Clean Air Assessment - Additional Cost - 5,357 6,000 6,000 6,000 6,000 WCIA - Risk Assessment Change from Estimate 10,500 187,500 187,500 187,500 187,500 187,500 WCIA - Potential Deductibles Prior to Jan. 1, 2014 115,000 115,000 - - - - Property Management - Accumulate Reserves - - 100,000 100,000 100,000 100,000 Information Technology - Accumulate Reserves/M&O - 22,500 325,189 531,089 511,089 568,089 Transfer to Fund 101 - Impact of CIP Projects? - - - - - - CBA Impact ? - AFSCME (Contract Expires 12/31/2016) - - ?? ?? ?? ??CBA Impact ?- LPIG (Contract Expires 12/31/2015) - ?? ?? ?? ?? ??CBA Impact ?- LPMG (Contract Expires 12/31/2015) - ?? ?? ?? ?? ??CBA Impact ?- Teamsters (Contract Expires 12/31/2015) - ?? ?? ?? ?? ??
Subtotal New Items - Operating Expenditures $179,975 $490,916 $757,889 $965,789 $947,789 $1,006,789
Adjusted Operating Expenditures $34,460,511 $35,485,156 $36,849,112 $38,057,677 $39,200,002 $40,319,752% Change 0.40% 2.97% 3.84% 3.28% 3.00% 2.86%
Adjusted Operating Income/(Loss) $919,763 $482,716 ($406,912) ($1,014,477) ($1,539,902) ($2,026,952)% of Adjusted Operating Expenditures 2.67% 1.36% -1.10% -2.67% -3.93% -5.03%
Other Finance Sources $327,636 $426,499 $0 $0 $0 $0Other Financing Uses $1,446,223 $370,500 $798,500 $407,500 $453,500 $445,500
New Items - Other Uses:Risk Management - Public Disclosure - Koenig Case 206,920 - - - - - Risk Management - Pending Case - - - - - - Subarea Plan - - 500,000 - - - Motor Avenue Complete Streets - Additional Funding 12,000 - - - - - Information Technology - Capital Contribution (6-Yr Plan - - 664,000 50,000 30,000 - Reduce Transfer to Transportation CIP - Replace w/REET - - - - - - Replenish Fleet & Equipment Fund (IT Plan) - 233,239 - - - -
Subtotal New Items - Other Uses $218,920 $233,239 $1,164,000 $50,000 $30,000 $0
Beginning Balance $4,532,693 $4,114,949 $4,420,425 $2,051,014 $579,037 ($1,444,365)Adjusted Ending Balance $4,114,949 $4,420,425 $2,051,014 $579,037 ($1,444,365) ($3,916,816)Ending Fund Balance as a % of Gen/Street Operating Rev 11.35% 12.00% 5.50% 1.53% -3.75% -10.00%Reserve - Total Target 12% of Gen/Street Operating Rev $4,351,305 $4,420,425 $4,477,296 $4,549,416 $4,623,444 $4,699,368 2% Contingency Reserves $725,217 $736,737 $746,216 $758,236 $770,574 $783,228 5% General Fund Reserves $1,813,044 $1,841,844 $1,865,540 $1,895,590 $1,926,435 $1,958,070 5% Strategic Reserves $1,813,044 $1,841,844 $1,865,540 $1,895,590 $1,926,435 $1,958,070Unreserved / (12% Adopted Reserves Shortfall): ($236,356) $0 ($2,426,283) ($3,970,379) ($6,067,809) ($8,616,184)
52
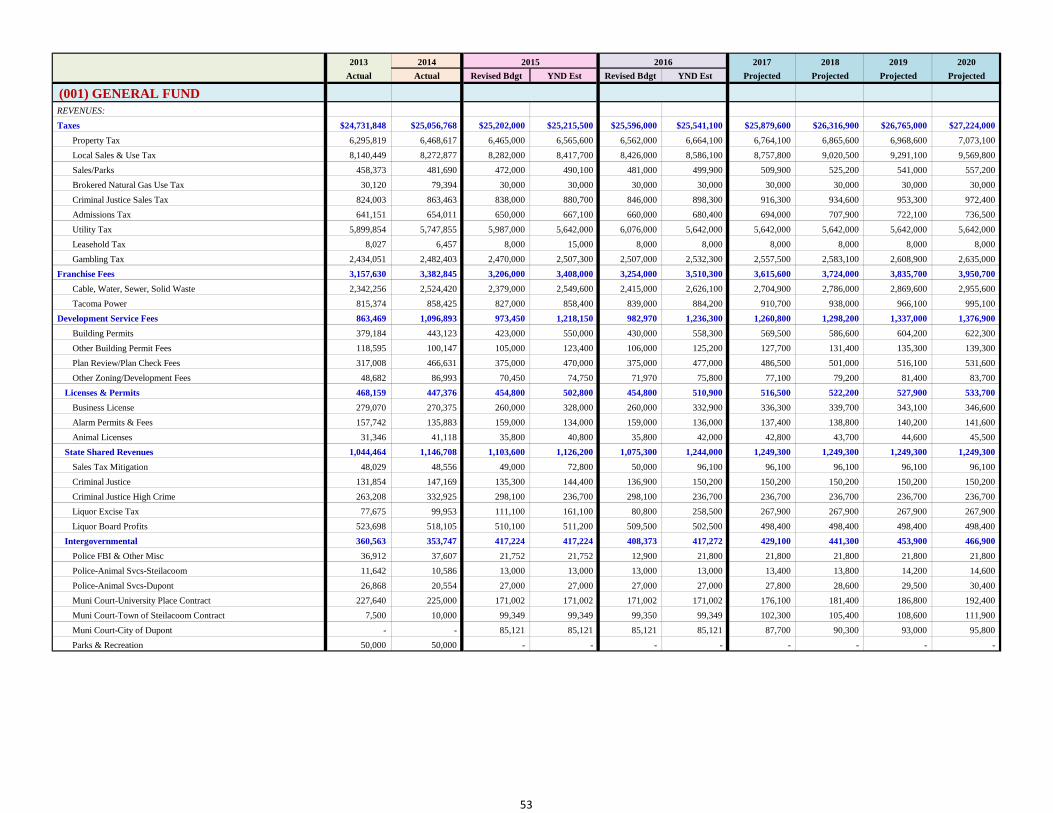
2013 2014 2015 2016 2017 2018 2019 2020
Actual Actual Revised Bdgt YND Est Revised Bdgt YND Est Projected Projected Projected Projected
(001) GENERAL FUNDREVENUES:
Taxes $24,731,848 $25,056,768 $25,202,000 $25,215,500 $25,596,000 $25,541,100 $25,879,600 $26,316,900 $26,765,000 $27,224,000
Property Tax 6,295,819 6,468,617 6,465,000 6,565,600 6,562,000 6,664,100 6,764,100 6,865,600 6,968,600 7,073,100
Local Sales & Use Tax 8,140,449 8,272,877 8,282,000 8,417,700 8,426,000 8,586,100 8,757,800 9,020,500 9,291,100 9,569,800
Sales/Parks 458,373 481,690 472,000 490,100 481,000 499,900 509,900 525,200 541,000 557,200
Brokered Natural Gas Use Tax 30,120 79,394 30,000 30,000 30,000 30,000 30,000 30,000 30,000 30,000
Criminal Justice Sales Tax 824,003 863,463 838,000 880,700 846,000 898,300 916,300 934,600 953,300 972,400
Admissions Tax 641,151 654,011 650,000 667,100 660,000 680,400 694,000 707,900 722,100 736,500
Utility Tax 5,899,854 5,747,855 5,987,000 5,642,000 6,076,000 5,642,000 5,642,000 5,642,000 5,642,000 5,642,000
Leasehold Tax 8,027 6,457 8,000 15,000 8,000 8,000 8,000 8,000 8,000 8,000
Gambling Tax 2,434,051 2,482,403 2,470,000 2,507,300 2,507,000 2,532,300 2,557,500 2,583,100 2,608,900 2,635,000
Franchise Fees 3,157,630 3,382,845 3,206,000 3,408,000 3,254,000 3,510,300 3,615,600 3,724,000 3,835,700 3,950,700
Cable, Water, Sewer, Solid Waste 2,342,256 2,524,420 2,379,000 2,549,600 2,415,000 2,626,100 2,704,900 2,786,000 2,869,600 2,955,600
Tacoma Power 815,374 858,425 827,000 858,400 839,000 884,200 910,700 938,000 966,100 995,100
Development Service Fees 863,469 1,096,893 973,450 1,218,150 982,970 1,236,300 1,260,800 1,298,200 1,337,000 1,376,900
Building Permits 379,184 443,123 423,000 550,000 430,000 558,300 569,500 586,600 604,200 622,300
Other Building Permit Fees 118,595 100,147 105,000 123,400 106,000 125,200 127,700 131,400 135,300 139,300
Plan Review/Plan Check Fees 317,008 466,631 375,000 470,000 375,000 477,000 486,500 501,000 516,100 531,600
Other Zoning/Development Fees 48,682 86,993 70,450 74,750 71,970 75,800 77,100 79,200 81,400 83,700
Licenses & Permits 468,159 447,376 454,800 502,800 454,800 510,900 516,500 522,200 527,900 533,700
Business License 279,070 270,375 260,000 328,000 260,000 332,900 336,300 339,700 343,100 346,600
Alarm Permits & Fees 157,742 135,883 159,000 134,000 159,000 136,000 137,400 138,800 140,200 141,600
Animal Licenses 31,346 41,118 35,800 40,800 35,800 42,000 42,800 43,700 44,600 45,500
State Shared Revenues 1,044,464 1,146,708 1,103,600 1,126,200 1,075,300 1,244,000 1,249,300 1,249,300 1,249,300 1,249,300
Sales Tax Mitigation 48,029 48,556 49,000 72,800 50,000 96,100 96,100 96,100 96,100 96,100
Criminal Justice 131,854 147,169 135,300 144,400 136,900 150,200 150,200 150,200 150,200 150,200
Criminal Justice High Crime 263,208 332,925 298,100 236,700 298,100 236,700 236,700 236,700 236,700 236,700
Liquor Excise Tax 77,675 99,953 111,100 161,100 80,800 258,500 267,900 267,900 267,900 267,900
Liquor Board Profits 523,698 518,105 510,100 511,200 509,500 502,500 498,400 498,400 498,400 498,400
Intergovernmental 360,563 353,747 417,224 417,224 408,373 417,272 429,100 441,300 453,900 466,900
Police FBI & Other Misc 36,912 37,607 21,752 21,752 12,900 21,800 21,800 21,800 21,800 21,800
Police-Animal Svcs-Steilacoom 11,642 10,586 13,000 13,000 13,000 13,000 13,400 13,800 14,200 14,600
Police-Animal Svcs-Dupont 26,868 20,554 27,000 27,000 27,000 27,000 27,800 28,600 29,500 30,400
Muni Court-University Place Contract 227,640 225,000 171,002 171,002 171,002 171,002 176,100 181,400 186,800 192,400
Muni Court-Town of Steilacoom Contract 7,500 10,000 99,349 99,349 99,350 99,349 102,300 105,400 108,600 111,900
Muni Court-City of Dupont - - 85,121 85,121 85,121 85,121 87,700 90,300 93,000 95,800
Parks & Recreation 50,000 50,000 - - - - - - - -
53
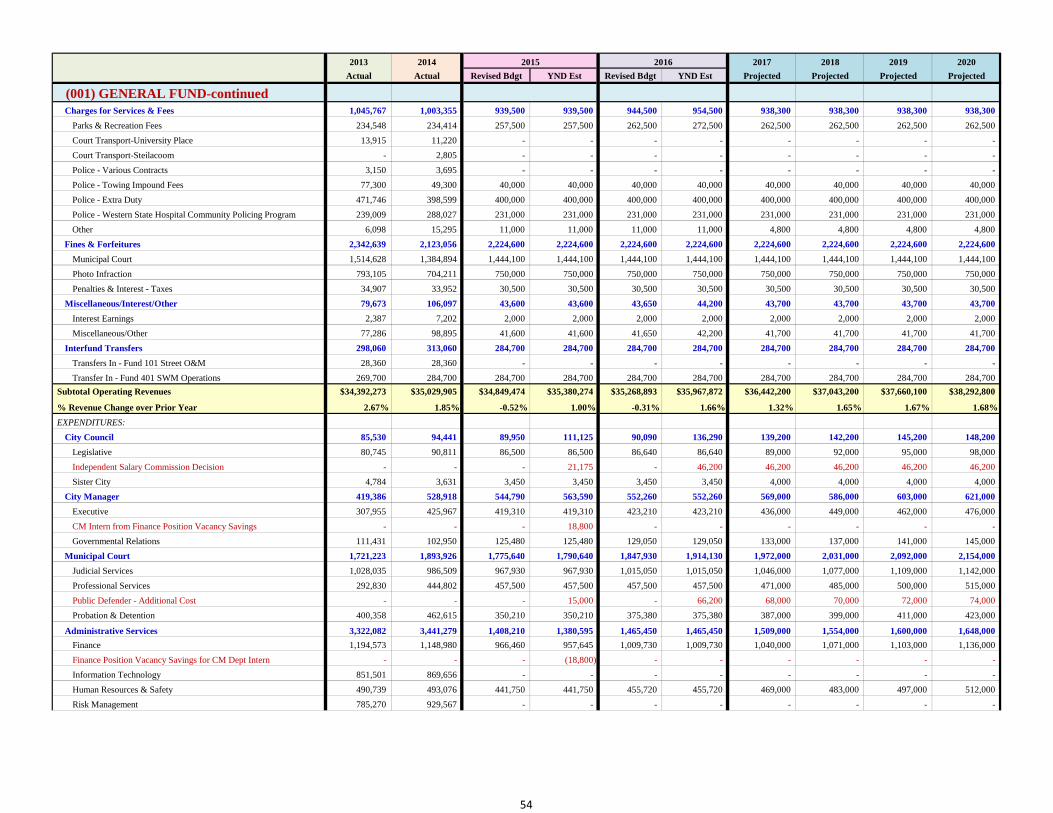
2013 2014 2015 2016 2017 2018 2019 2020
Actual Actual Revised Bdgt YND Est Revised Bdgt YND Est Projected Projected Projected Projected
(001) GENERAL FUND-continuedCharges for Services & Fees 1,045,767 1,003,355 939,500 939,500 944,500 954,500 938,300 938,300 938,300 938,300
Parks & Recreation Fees 234,548 234,414 257,500 257,500 262,500 272,500 262,500 262,500 262,500 262,500
Court Transport-University Place 13,915 11,220 - - - - - - - -
Court Transport-Steilacoom - 2,805 - - - - - - - -
Police - Various Contracts 3,150 3,695 - - - - - - - -
Police - Towing Impound Fees 77,300 49,300 40,000 40,000 40,000 40,000 40,000 40,000 40,000 40,000
Police - Extra Duty 471,746 398,599 400,000 400,000 400,000 400,000 400,000 400,000 400,000 400,000
Police - Western State Hospital Community Policing Program 239,009 288,027 231,000 231,000 231,000 231,000 231,000 231,000 231,000 231,000
Other 6,098 15,295 11,000 11,000 11,000 11,000 4,800 4,800 4,800 4,800
Fines & Forfeitures 2,342,639 2,123,056 2,224,600 2,224,600 2,224,600 2,224,600 2,224,600 2,224,600 2,224,600 2,224,600
Municipal Court 1,514,628 1,384,894 1,444,100 1,444,100 1,444,100 1,444,100 1,444,100 1,444,100 1,444,100 1,444,100
Photo Infraction 793,105 704,211 750,000 750,000 750,000 750,000 750,000 750,000 750,000 750,000
Penalties & Interest - Taxes 34,907 33,952 30,500 30,500 30,500 30,500 30,500 30,500 30,500 30,500
Miscellaneous/Interest/Other 79,673 106,097 43,600 43,600 43,650 44,200 43,700 43,700 43,700 43,700
Interest Earnings 2,387 7,202 2,000 2,000 2,000 2,000 2,000 2,000 2,000 2,000
Miscellaneous/Other 77,286 98,895 41,600 41,600 41,650 42,200 41,700 41,700 41,700 41,700
Interfund Transfers 298,060 313,060 284,700 284,700 284,700 284,700 284,700 284,700 284,700 284,700
Transfers In - Fund 101 Street O&M 28,360 28,360 - - - - - - - -
Transfer In - Fund 401 SWM Operations 269,700 284,700 284,700 284,700 284,700 284,700 284,700 284,700 284,700 284,700
Subtotal Operating Revenues $34,392,273 $35,029,905 $34,849,474 $35,380,274 $35,268,893 $35,967,872 $36,442,200 $37,043,200 $37,660,100 $38,292,800
% Revenue Change over Prior Year 2.67% 1.85% -0.52% 1.00% -0.31% 1.66% 1.32% 1.65% 1.67% 1.68%
EXPENDITURES:
City Council 85,530 94,441 89,950 111,125 90,090 136,290 139,200 142,200 145,200 148,200
Legislative 80,745 90,811 86,500 86,500 86,640 86,640 89,000 92,000 95,000 98,000
Independent Salary Commission Decision - - - 21,175 - 46,200 46,200 46,200 46,200 46,200
Sister City 4,784 3,631 3,450 3,450 3,450 3,450 4,000 4,000 4,000 4,000
City Manager 419,386 528,918 544,790 563,590 552,260 552,260 569,000 586,000 603,000 621,000
Executive 307,955 425,967 419,310 419,310 423,210 423,210 436,000 449,000 462,000 476,000
CM Intern from Finance Position Vacancy Savings - - - 18,800 - - - - - -
Governmental Relations 111,431 102,950 125,480 125,480 129,050 129,050 133,000 137,000 141,000 145,000
Municipal Court 1,721,223 1,893,926 1,775,640 1,790,640 1,847,930 1,914,130 1,972,000 2,031,000 2,092,000 2,154,000
Judicial Services 1,028,035 986,509 967,930 967,930 1,015,050 1,015,050 1,046,000 1,077,000 1,109,000 1,142,000
Professional Services 292,830 444,802 457,500 457,500 457,500 457,500 471,000 485,000 500,000 515,000
Public Defender - Additional Cost - - - 15,000 - 66,200 68,000 70,000 72,000 74,000
Probation & Detention 400,358 462,615 350,210 350,210 375,380 375,380 387,000 399,000 411,000 423,000
Administrative Services 3,322,082 3,441,279 1,408,210 1,380,595 1,465,450 1,465,450 1,509,000 1,554,000 1,600,000 1,648,000
Finance 1,194,573 1,148,980 966,460 957,645 1,009,730 1,009,730 1,040,000 1,071,000 1,103,000 1,136,000
Finance Position Vacancy Savings for CM Dept Intern - - - (18,800) - - - - - -
Information Technology 851,501 869,656 - - - - - - - -
Human Resources & Safety 490,739 493,076 441,750 441,750 455,720 455,720 469,000 483,000 497,000 512,000
Risk Management 785,270 929,567 - - - - - - - -
54
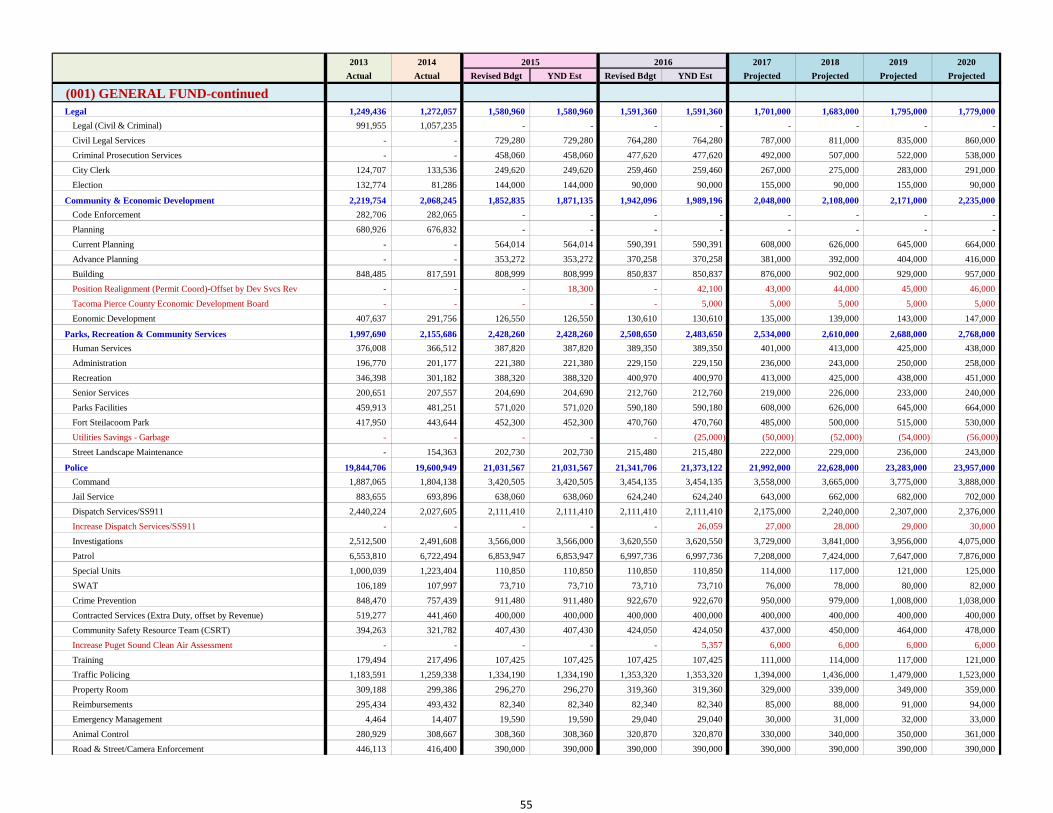
2013 2014 2015 2016 2017 2018 2019 2020
Actual Actual Revised Bdgt YND Est Revised Bdgt YND Est Projected Projected Projected Projected
(001) GENERAL FUND-continuedLegal 1,249,436 1,272,057 1,580,960 1,580,960 1,591,360 1,591,360 1,701,000 1,683,000 1,795,000 1,779,000
Legal (Civil & Criminal) 991,955 1,057,235 - - - - - - - -
Civil Legal Services - - 729,280 729,280 764,280 764,280 787,000 811,000 835,000 860,000
Criminal Prosecution Services - - 458,060 458,060 477,620 477,620 492,000 507,000 522,000 538,000
City Clerk 124,707 133,536 249,620 249,620 259,460 259,460 267,000 275,000 283,000 291,000
Election 132,774 81,286 144,000 144,000 90,000 90,000 155,000 90,000 155,000 90,000
Community & Economic Development 2,219,754 2,068,245 1,852,835 1,871,135 1,942,096 1,989,196 2,048,000 2,108,000 2,171,000 2,235,000
Code Enforcement 282,706 282,065 - - - - - - - -
Planning 680,926 676,832 - - - - - - - -
Current Planning - - 564,014 564,014 590,391 590,391 608,000 626,000 645,000 664,000
Advance Planning - - 353,272 353,272 370,258 370,258 381,000 392,000 404,000 416,000
Building 848,485 817,591 808,999 808,999 850,837 850,837 876,000 902,000 929,000 957,000
Position Realignment (Permit Coord)-Offset by Dev Svcs Rev - - - 18,300 - 42,100 43,000 44,000 45,000 46,000
Tacoma Pierce County Economic Development Board - - - - - 5,000 5,000 5,000 5,000 5,000
Eonomic Development 407,637 291,756 126,550 126,550 130,610 130,610 135,000 139,000 143,000 147,000
Parks, Recreation & Community Services 1,997,690 2,155,686 2,428,260 2,428,260 2,508,650 2,483,650 2,534,000 2,610,000 2,688,000 2,768,000
Human Services 376,008 366,512 387,820 387,820 389,350 389,350 401,000 413,000 425,000 438,000
Administration 196,770 201,177 221,380 221,380 229,150 229,150 236,000 243,000 250,000 258,000
Recreation 346,398 301,182 388,320 388,320 400,970 400,970 413,000 425,000 438,000 451,000
Senior Services 200,651 207,557 204,690 204,690 212,760 212,760 219,000 226,000 233,000 240,000
Parks Facilities 459,913 481,251 571,020 571,020 590,180 590,180 608,000 626,000 645,000 664,000
Fort Steilacoom Park 417,950 443,644 452,300 452,300 470,760 470,760 485,000 500,000 515,000 530,000
Utilities Savings - Garbage - - - - - (25,000) (50,000) (52,000) (54,000) (56,000)
Street Landscape Maintenance - 154,363 202,730 202,730 215,480 215,480 222,000 229,000 236,000 243,000
Police 19,844,706 19,600,949 21,031,567 21,031,567 21,341,706 21,373,122 21,992,000 22,628,000 23,283,000 23,957,000
Command 1,887,065 1,804,138 3,420,505 3,420,505 3,454,135 3,454,135 3,558,000 3,665,000 3,775,000 3,888,000
Jail Service 883,655 693,896 638,060 638,060 624,240 624,240 643,000 662,000 682,000 702,000
Dispatch Services/SS911 2,440,224 2,027,605 2,111,410 2,111,410 2,111,410 2,111,410 2,175,000 2,240,000 2,307,000 2,376,000
Increase Dispatch Services/SS911 - - - - - 26,059 27,000 28,000 29,000 30,000
Investigations 2,512,500 2,491,608 3,566,000 3,566,000 3,620,550 3,620,550 3,729,000 3,841,000 3,956,000 4,075,000
Patrol 6,553,810 6,722,494 6,853,947 6,853,947 6,997,736 6,997,736 7,208,000 7,424,000 7,647,000 7,876,000
Special Units 1,000,039 1,223,404 110,850 110,850 110,850 110,850 114,000 117,000 121,000 125,000
SWAT 106,189 107,997 73,710 73,710 73,710 73,710 76,000 78,000 80,000 82,000
Crime Prevention 848,470 757,439 911,480 911,480 922,670 922,670 950,000 979,000 1,008,000 1,038,000
Contracted Services (Extra Duty, offset by Revenue) 519,277 441,460 400,000 400,000 400,000 400,000 400,000 400,000 400,000 400,000
Community Safety Resource Team (CSRT) 394,263 321,782 407,430 407,430 424,050 424,050 437,000 450,000 464,000 478,000
Increase Puget Sound Clean Air Assessment - - - - - 5,357 6,000 6,000 6,000 6,000
Training 179,494 217,496 107,425 107,425 107,425 107,425 111,000 114,000 117,000 121,000
Traffic Policing 1,183,591 1,259,338 1,334,190 1,334,190 1,353,320 1,353,320 1,394,000 1,436,000 1,479,000 1,523,000
Property Room 309,188 299,386 296,270 296,270 319,360 319,360 329,000 339,000 349,000 359,000
Reimbursements 295,434 493,432 82,340 82,340 82,340 82,340 85,000 88,000 91,000 94,000
Emergency Management 4,464 14,407 19,590 19,590 29,040 29,040 30,000 31,000 32,000 33,000
Animal Control 280,929 308,667 308,360 308,360 320,870 320,870 330,000 340,000 350,000 361,000
Road & Street/Camera Enforcement 446,113 416,400 390,000 390,000 390,000 390,000 390,000 390,000 390,000 390,000
55
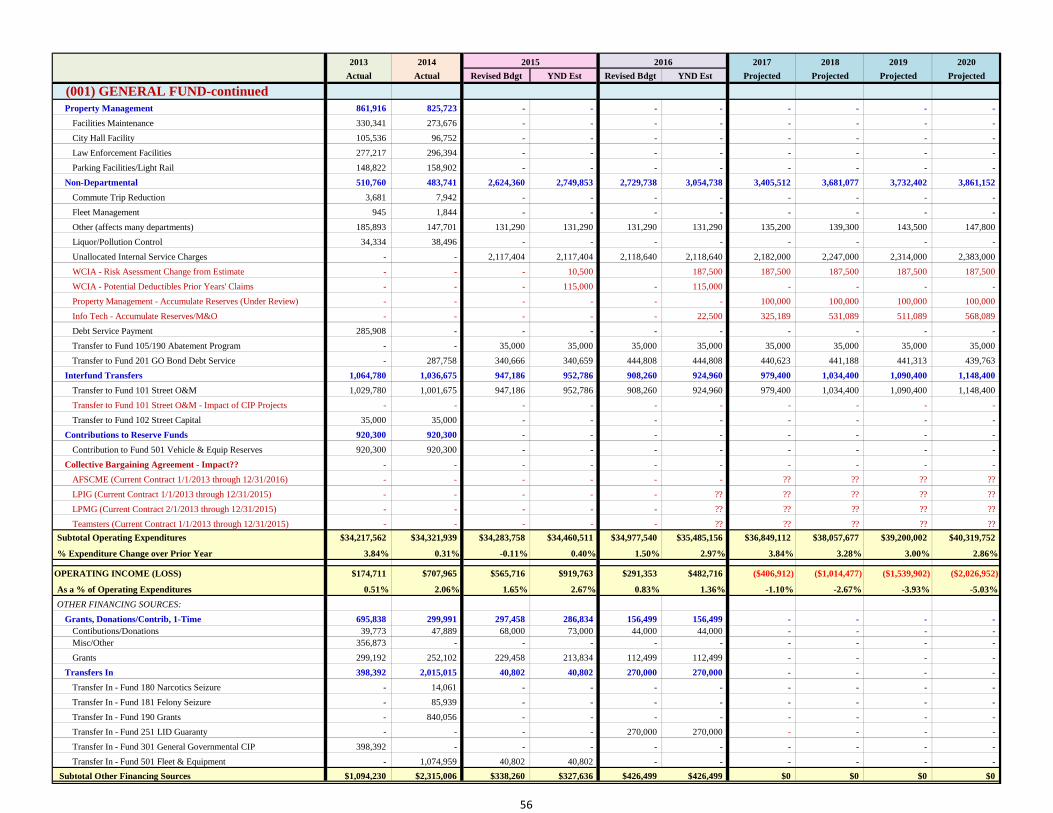
2013 2014 2015 2016 2017 2018 2019 2020
Actual Actual Revised Bdgt YND Est Revised Bdgt YND Est Projected Projected Projected Projected
(001) GENERAL FUND-continuedProperty Management 861,916 825,723 - - - - - - - -
Facilities Maintenance 330,341 273,676 - - - - - - - -
City Hall Facility 105,536 96,752 - - - - - - - -
Law Enforcement Facilities 277,217 296,394 - - - - - - - -
Parking Facilities/Light Rail 148,822 158,902 - - - - - - - -
Non-Departmental 510,760 483,741 2,624,360 2,749,853 2,729,738 3,054,738 3,405,512 3,681,077 3,732,402 3,861,152
Commute Trip Reduction 3,681 7,942 - - - - - - - -
Fleet Management 945 1,844 - - - - - - - -
Other (affects many departments) 185,893 147,701 131,290 131,290 131,290 131,290 135,200 139,300 143,500 147,800
Liquor/Pollution Control 34,334 38,496 - - - - - - - -
Unallocated Internal Service Charges - - 2,117,404 2,117,404 2,118,640 2,118,640 2,182,000 2,247,000 2,314,000 2,383,000
WCIA - Risk Asessment Change from Estimate - - - 10,500 187,500 187,500 187,500 187,500 187,500
WCIA - Potential Deductibles Prior Years' Claims - - - 115,000 - 115,000 - - - -
Property Management - Accumulate Reserves (Under Review) - - - - - - 100,000 100,000 100,000 100,000
Info Tech - Accumulate Reserves/M&O - - - - - 22,500 325,189 531,089 511,089 568,089
Debt Service Payment 285,908 - - - - - - - - -
Transfer to Fund 105/190 Abatement Program - - 35,000 35,000 35,000 35,000 35,000 35,000 35,000 35,000
Transfer to Fund 201 GO Bond Debt Service - 287,758 340,666 340,659 444,808 444,808 440,623 441,188 441,313 439,763
Interfund Transfers 1,064,780 1,036,675 947,186 952,786 908,260 924,960 979,400 1,034,400 1,090,400 1,148,400
Transfer to Fund 101 Street O&M 1,029,780 1,001,675 947,186 952,786 908,260 924,960 979,400 1,034,400 1,090,400 1,148,400
Transfer to Fund 101 Street O&M - Impact of CIP Projects - - - - - - - - - -
Transfer to Fund 102 Street Capital 35,000 35,000 - - - - - - - -
Contributions to Reserve Funds 920,300 920,300 - - - - - - - -
Contribution to Fund 501 Vehicle & Equip Reserves 920,300 920,300 - - - - - - - -
Collective Bargaining Agreement - Impact?? - - - - - - - - - -
AFSCME (Current Contract 1/1/2013 through 12/31/2016) - - - - - - ?? ?? ?? ??
LPIG (Current Contract 1/1/2013 through 12/31/2015) - - - - - ?? ?? ?? ?? ??
LPMG (Current Contract 2/1/2013 through 12/31/2015) - - - - - ?? ?? ?? ?? ??
Teamsters (Current Contract 1/1/2013 through 12/31/2015) - - - - - ?? ?? ?? ?? ??
Subtotal Operating Expenditures $34,217,562 $34,321,939 $34,283,758 $34,460,511 $34,977,540 $35,485,156 $36,849,112 $38,057,677 $39,200,002 $40,319,752
% Expenditure Change over Prior Year 3.84% 0.31% -0.11% 0.40% 1.50% 2.97% 3.84% 3.28% 3.00% 2.86%
OPERATING INCOME (LOSS) $174,711 $707,965 $565,716 $919,763 $291,353 $482,716 ($406,912) ($1,014,477) ($1,539,902) ($2,026,952)
As a % of Operating Expenditures 0.51% 2.06% 1.65% 2.67% 0.83% 1.36% -1.10% -2.67% -3.93% -5.03%
OTHER FINANCING SOURCES:
Grants, Donations/Contrib, 1-Time 695,838 299,991 297,458 286,834 156,499 156,499 - - - - Contibutions/Donations 39,773 47,889 68,000 73,000 44,000 44,000 - - - - Misc/Other 356,873 - - - - - - - - -
Grants 299,192 252,102 229,458 213,834 112,499 112,499 - - - -
Transfers In 398,392 2,015,015 40,802 40,802 270,000 270,000 - - - -
Transfer In - Fund 180 Narcotics Seizure - 14,061 - - - - - - - -
Transfer In - Fund 181 Felony Seizure - 85,939 - - - - - - - -
Transfer In - Fund 190 Grants - 840,056 - - - - - - - -
Transfer In - Fund 251 LID Guaranty - - - - 270,000 270,000 - - - -
Transfer In - Fund 301 General Governmental CIP 398,392 - - - - - - - - -
Transfer In - Fund 501 Fleet & Equipment - 1,074,959 40,802 40,802 - - - - - -
Subtotal Other Financing Sources $1,094,230 $2,315,006 $338,260 $327,636 $426,499 $426,499 $0 $0 $0 $0
56

2013 2014 2015 2016 2017 2018 2019 2020
Actual Actual Revised Bdgt YND Est Revised Bdgt YND Est Projected Projected Projected Projected
(001) GENERAL FUND-continuedOTHER FINANCING USES:
Capital & Other 1-Time 1,295,389 973,111 544,994 763,914 10,000 10,000 1,164,000 50,000 30,000 -
Municipal Court 34,039 51,459 50,000 50,000 - - - - - -
City Council - 5,264 - - - - - - -
City Manager 2,301 18,000 10,000 10,000 - - Administrative Services 999,976 285,692 114,322 114,322 - - - - - -
Non-Departmental 36,000 - - - - - - - - -
Legal/Clerk 7,663 21,209 120,271 120,271 10,000 10,000 - - - -
Risk Management - Public Disclosure - Keonig Case - - - 206,920 - - - - - -
Community & Economic Development 101,673 338,966 111,075 111,075 - - - - - -
CED - Subarea Plan - - - - - - 500,000 - - -
Add'l Funding for Motor Avenue Complete Streets Concept - - - 12,000 - - - - - -
Info Tech - Capital Contribution (6-Yr Plan) - - - - - - 664,000 50,000 30,000 -
Parks, Recreation & Community Services 79,034 9,725 - - - - - - - -
Police 34,703 215,412 139,326 139,326 - - - - - -
Public Works/Property Management - 27,385 - - - - - - - -
Interfund Transfers 8,179 97,848 901,229 901,229 360,500 593,739 798,500 407,500 453,500 445,500
Transfer Out - Fund 101 Street O&M - 37,000 15,000 15,000 -
Transfer Out - Fund 102 Street Capital 3,826 - - - - - - - -
Transfer Out - Fund 106 Public Art 2,000 - - - - - - - - -
Transfer Out - Fund 192 OEA Grant - 50,000 50,000 50,000 50,000 50,000 50,000 50,000 50,000 50,000
Transfer Out - Fund 195 Police Grants 2,353 10,848 - - - - - - - -
Transfer Out - Fund 301 General Govt'l/Parks CIP - - 146,729 146,729 - - - - - -
Transfer Out - Fund 302 Transportation CIP - - 689,500 689,500 310,500 310,500 748,500 357,500 403,500 395,500
Reduce Transfer to Fund 302 - Replace with REET - - - - - - - - - -
Transfer Out - Fund 501 Fleet & Equip (IT Plan) - - - - - 233,239 - - - -
Subtotal Other Financing Uses $1,303,568 $1,070,959 $1,446,223 $1,665,143 $370,500 $603,739 $1,962,500 $457,500 $483,500 $445,500
Total Revenues and Other Sources $35,486,503 $37,344,911 $35,187,734 $35,707,910 $35,695,392 $36,394,371 $36,442,200 $37,043,200 $37,660,100 $38,292,800
Total Expenditures and other Uses $35,521,130 $35,392,899 $35,729,981 $36,125,654 $35,348,040 $36,088,895 $38,811,612 $38,515,177 $39,683,502 $40,765,252
Beginning Fund Balance: $2,615,308 $2,580,681 $4,532,693 $4,532,693 $3,990,446 $4,114,949 $4,420,425 $2,051,014 $579,037 ($1,444,365)
Ending Fund Balance: $2,580,681 $4,532,693 $3,990,446 $4,114,949 $4,337,798 $4,420,425 $2,051,014 $579,037 ($1,444,365) ($3,916,816)
Ending Fund Balance as a % of Gen/Street Operating Revenues 7.3% 12.6% 11.2% 11.3% 12.0% 12.0% 5.5% 1.5% -3.7% -10.0%
Reserve - Total Target 12% of Gen/Street Operating Revenues $4,237,447 $4,316,235 $4,285,881 $4,351,305 $4,336,151 $4,420,425 $4,477,296 $4,549,416 $4,623,444 $4,699,368
2% Contingency Reserves $706,241 $719,372 $714,313 $725,217 $722,692 $736,737 $746,216 $758,236 $770,574 $783,228
5% General Fund Reserves $1,765,603 $1,798,431 $1,785,784 $1,813,044 $1,806,730 $1,841,844 $1,865,540 $1,895,590 $1,926,435 $1,958,070
5% Strategic Reserves $1,765,603 $1,798,431 $1,785,784 $1,813,044 $1,806,730 $1,841,844 $1,865,540 $1,895,590 $1,926,435 $1,958,070
Unreserved / (12% Adopted Reserves Shortfall): ($1,656,766) $216,459 ($295,435) ($236,356) $1,647 $0 ($2,426,283) ($3,970,379) ($6,067,809) ($8,616,184)
57
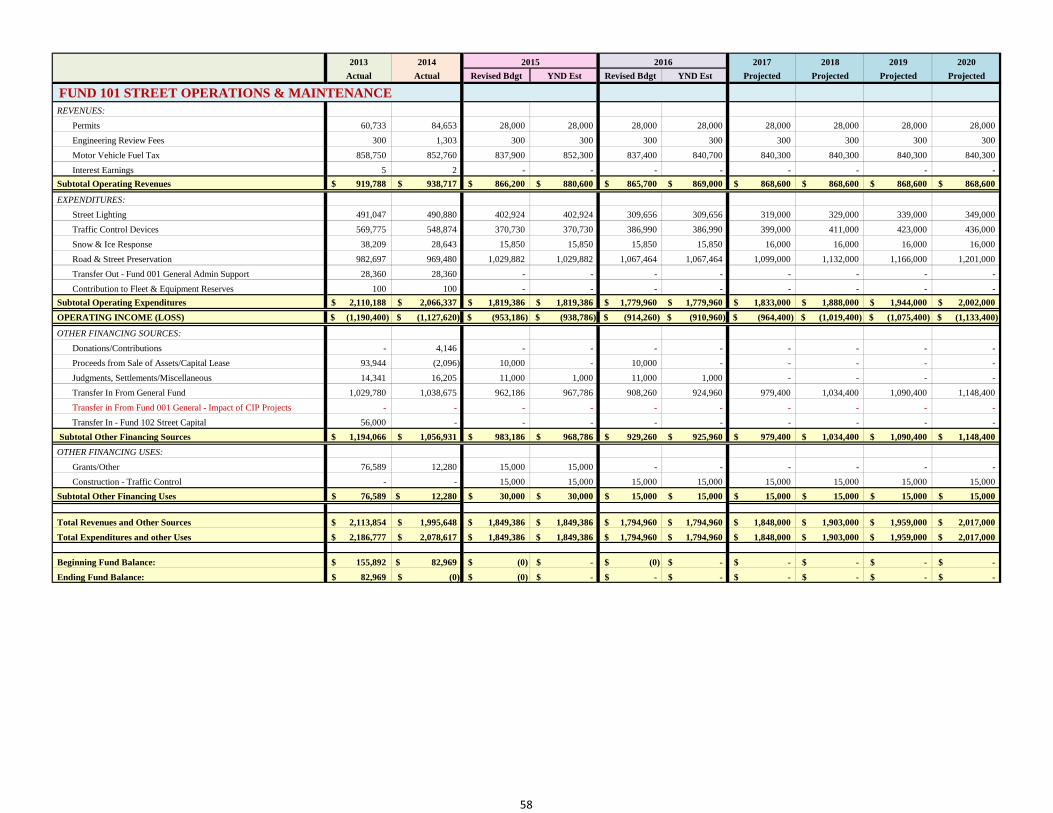
2013 2014 2015 2016 2017 2018 2019 2020
Actual Actual Revised Bdgt YND Est Revised Bdgt YND Est Projected Projected Projected Projected
FUND 101 STREET OPERATIONS & MAINTENANCEREVENUES:
Permits 60,733 84,653 28,000 28,000 28,000 28,000 28,000 28,000 28,000 28,000
Engineering Review Fees 300 1,303 300 300 300 300 300 300 300 300
Motor Vehicle Fuel Tax 858,750 852,760 837,900 852,300 837,400 840,700 840,300 840,300 840,300 840,300
Interest Earnings 5 2 - - - - - - - -
Subtotal Operating Revenues 919,788$ 938,717$ 866,200$ 880,600$ 865,700$ 869,000$ 868,600$ 868,600$ 868,600$ 868,600$
EXPENDITURES:
Street Lighting 491,047 490,880 402,924 402,924 309,656 309,656 319,000 329,000 339,000 349,000
Traffic Control Devices 569,775 548,874 370,730 370,730 386,990 386,990 399,000 411,000 423,000 436,000
Snow & Ice Response 38,209 28,643 15,850 15,850 15,850 15,850 16,000 16,000 16,000 16,000
Road & Street Preservation 982,697 969,480 1,029,882 1,029,882 1,067,464 1,067,464 1,099,000 1,132,000 1,166,000 1,201,000
Transfer Out - Fund 001 General Admin Support 28,360 28,360 - - - - - - - -
Contribution to Fleet & Equipment Reserves 100 100 - - - - - - - -
Subtotal Operating Expenditures 2,110,188$ 2,066,337$ 1,819,386$ 1,819,386$ 1,779,960$ 1,779,960$ 1,833,000$ 1,888,000$ 1,944,000$ 2,002,000$
OPERATING INCOME (LOSS) (1,190,400)$ (1,127,620)$ (953,186)$ (938,786)$ (914,260)$ (910,960)$ (964,400)$ (1,019,400)$ (1,075,400)$ (1,133,400)$
OTHER FINANCING SOURCES:
Donations/Contributions - 4,146 - - - - - - - -
Proceeds from Sale of Assets/Capital Lease 93,944 (2,096) 10,000 - 10,000 - - - - -
Judgments, Settlements/Miscellaneous 14,341 16,205 11,000 1,000 11,000 1,000 - - - -
Transfer In From General Fund 1,029,780 1,038,675 962,186 967,786 908,260 924,960 979,400 1,034,400 1,090,400 1,148,400
Transfer in From Fund 001 General - Impact of CIP Projects - - - - - - - - - -
Transfer In - Fund 102 Street Capital 56,000 - - - - - - - - -
Subtotal Other Financing Sources 1,194,066$ 1,056,931$ 983,186$ 968,786$ 929,260$ 925,960$ 979,400$ 1,034,400$ 1,090,400$ 1,148,400$
OTHER FINANCING USES:
Grants/Other 76,589 12,280 15,000 15,000 - - - - - -
Construction - Traffic Control - - 15,000 15,000 15,000 15,000 15,000 15,000 15,000 15,000
Subtotal Other Financing Uses 76,589$ 12,280$ 30,000$ 30,000$ 15,000$ 15,000$ 15,000$ 15,000$ 15,000$ 15,000$
Total Revenues and Other Sources 2,113,854$ 1,995,648$ 1,849,386$ 1,849,386$ 1,794,960$ 1,794,960$ 1,848,000$ 1,903,000$ 1,959,000$ 2,017,000$
Total Expenditures and other Uses 2,186,777$ 2,078,617$ 1,849,386$ 1,849,386$ 1,794,960$ 1,794,960$ 1,848,000$ 1,903,000$ 1,959,000$ 2,017,000$
Beginning Fund Balance: 155,892$ 82,969$ (0)$ -$ (0)$ -$ -$ -$ -$ -$
Ending Fund Balance: 82,969$ (0)$ (0)$ -$ -$ -$ -$ -$ -$ -$
58
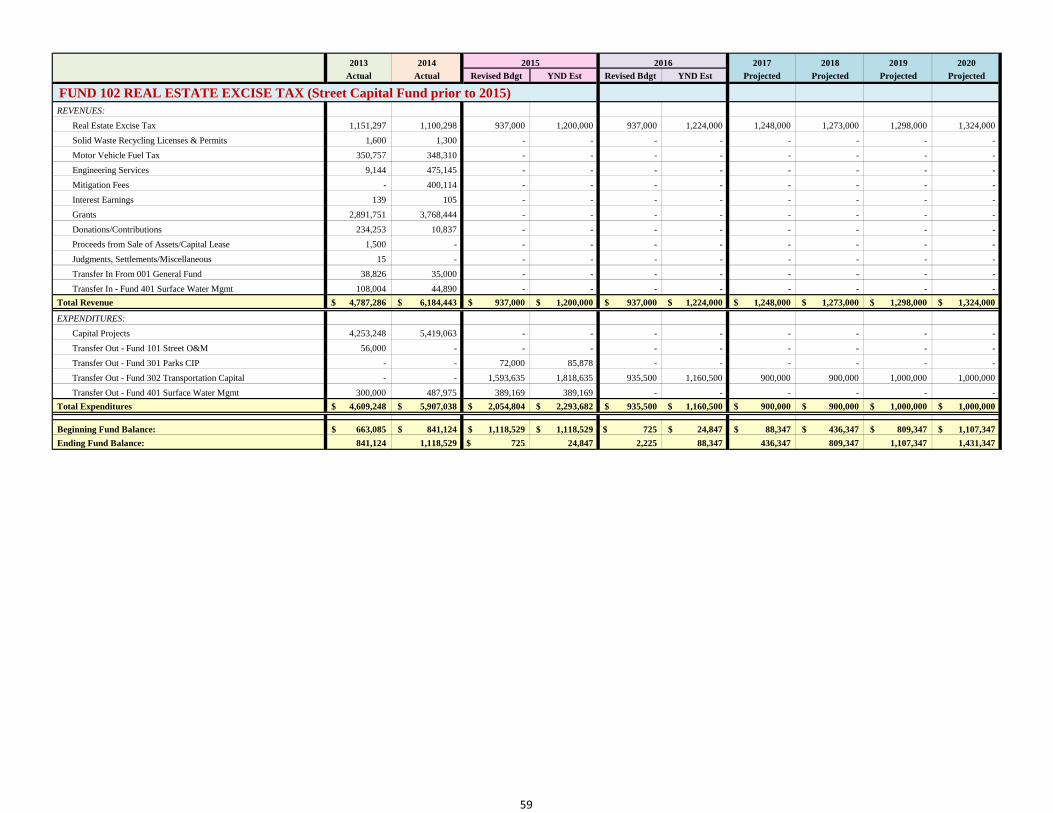
2013 2014 2015 2016 2017 2018 2019 2020
Actual Actual Revised Bdgt YND Est Revised Bdgt YND Est Projected Projected Projected Projected
FUND 102 REAL ESTATE EXCISE TAX (Street Capital Fund prior to 2015)REVENUES:
Real Estate Excise Tax 1,151,297 1,100,298 937,000 1,200,000 937,000 1,224,000 1,248,000 1,273,000 1,298,000 1,324,000
Solid Waste Recycling Licenses & Permits 1,600 1,300 - - - - - - - -
Motor Vehicle Fuel Tax 350,757 348,310 - - - - - - - -
Engineering Services 9,144 475,145 - - - - - - - -
Mitigation Fees - 400,114 - - - - - - - -
Interest Earnings 139 105 - - - - - - - -
Grants 2,891,751 3,768,444 - - - - - - - -
Donations/Contributions 234,253 10,837 - - - - - - - -
Proceeds from Sale of Assets/Capital Lease 1,500 - - - - - - - - -
Judgments, Settlements/Miscellaneous 15 - - - - - - - - -
Transfer In From 001 General Fund 38,826 35,000 - - - - - - - -
Transfer In - Fund 401 Surface Water Mgmt 108,004 44,890 - - - - - - - -
Total Revenue 4,787,286$ 6,184,443$ 937,000$ 1,200,000$ 937,000$ 1,224,000$ 1,248,000$ 1,273,000$ 1,298,000$ 1,324,000$
EXPENDITURES:
Capital Projects 4,253,248 5,419,063 - - - - - - - -
Transfer Out - Fund 101 Street O&M 56,000 - - - - - - - - -
Transfer Out - Fund 301 Parks CIP - - 72,000 85,878 - - - - - -
Transfer Out - Fund 302 Transportation Capital - - 1,593,635 1,818,635 935,500 1,160,500 900,000 900,000 1,000,000 1,000,000
Transfer Out - Fund 401 Surface Water Mgmt 300,000 487,975 389,169 389,169 - - - - - -
Total Expenditures 4,609,248$ 5,907,038$ 2,054,804$ 2,293,682$ 935,500$ 1,160,500$ 900,000$ 900,000$ 1,000,000$ 1,000,000$
Beginning Fund Balance: 663,085$ 841,124$ 1,118,529$ 1,118,529$ 725$ 24,847$ 88,347$ 436,347$ 809,347$ 1,107,347$
Ending Fund Balance: 841,124 1,118,529 725$ 24,847 2,225 88,347 436,347 809,347 1,107,347 1,431,347
59
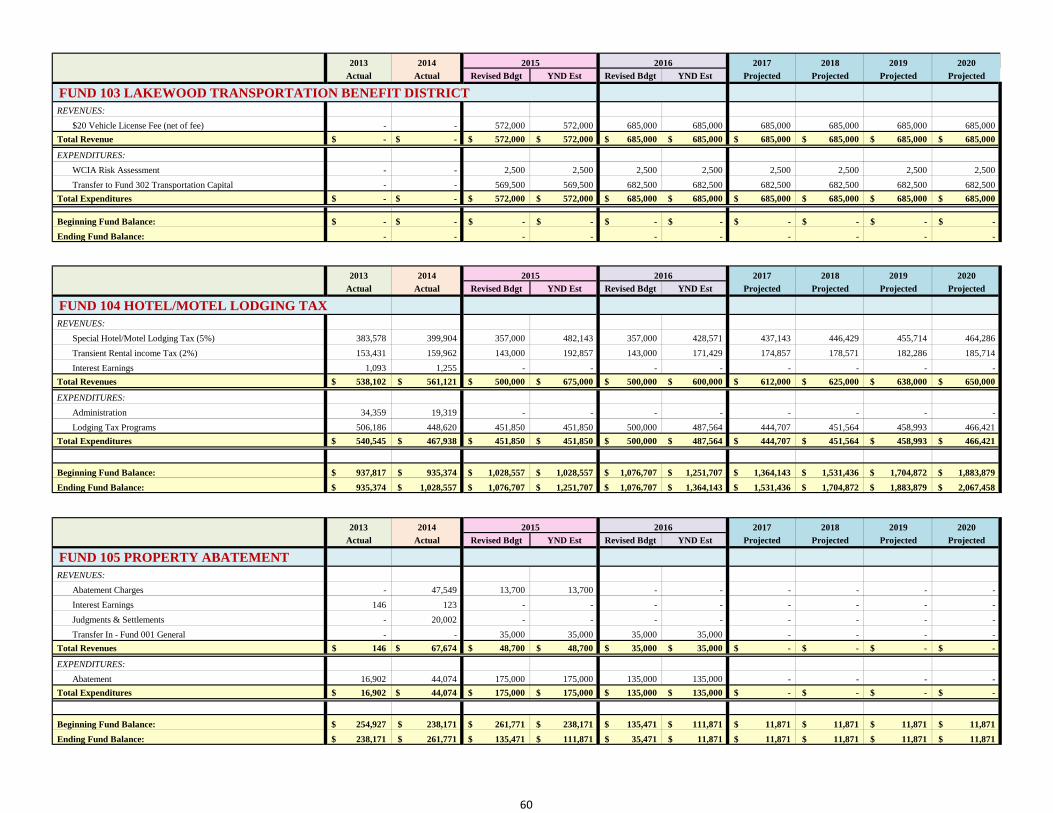
2013 2014 2015 2016 2017 2018 2019 2020
Actual Actual Revised Bdgt YND Est Revised Bdgt YND Est Projected Projected Projected Projected
FUND 103 LAKEWOOD TRANSPORTATION BENEFIT DISTRICTREVENUES:
$20 Vehicle License Fee (net of fee) - - 572,000 572,000 685,000 685,000 685,000 685,000 685,000 685,000
Total Revenue -$ -$ 572,000$ 572,000$ 685,000$ 685,000$ 685,000$ 685,000$ 685,000$ 685,000$
EXPENDITURES:
WCIA Risk Assessment - - 2,500 2,500 2,500 2,500 2,500 2,500 2,500 2,500
Transfer to Fund 302 Transportation Capital - - 569,500 569,500 682,500 682,500 682,500 682,500 682,500 682,500
Total Expenditures -$ -$ 572,000$ 572,000$ 685,000$ 685,000$ 685,000$ 685,000$ 685,000$ 685,000$
Beginning Fund Balance: -$ -$ -$ -$ -$ -$ -$ -$ -$ -$
Ending Fund Balance: - - - - - - - - - -
2013 2014 2015 2016 2017 2018 2019 2020
Actual Actual Revised Bdgt YND Est Revised Bdgt YND Est Projected Projected Projected Projected
FUND 104 HOTEL/MOTEL LODGING TAXREVENUES:
Special Hotel/Motel Lodging Tax (5%) 383,578 399,904 357,000 482,143 357,000 428,571 437,143 446,429 455,714 464,286
Transient Rental income Tax (2%) 153,431 159,962 143,000 192,857 143,000 171,429 174,857 178,571 182,286 185,714
Interest Earnings 1,093 1,255 - - - - - - - -
Total Revenues 538,102$ 561,121$ 500,000$ 675,000$ 500,000$ 600,000$ 612,000$ 625,000$ 638,000$ 650,000$
EXPENDITURES:
Administration 34,359 19,319 - - - - - - - -
Lodging Tax Programs 506,186 448,620 451,850 451,850 500,000 487,564 444,707 451,564 458,993 466,421
Total Expenditures 540,545$ 467,938$ 451,850$ 451,850$ 500,000$ 487,564$ 444,707$ 451,564$ 458,993$ 466,421$
Beginning Fund Balance: 937,817$ 935,374$ 1,028,557$ 1,028,557$ 1,076,707$ 1,251,707$ 1,364,143$ 1,531,436$ 1,704,872$ 1,883,879$
Ending Fund Balance: 935,374$ 1,028,557$ 1,076,707$ 1,251,707$ 1,076,707$ 1,364,143$ 1,531,436$ 1,704,872$ 1,883,879$ 2,067,458$
2013 2014 2015 2016 2017 2018 2019 2020
Actual Actual Revised Bdgt YND Est Revised Bdgt YND Est Projected Projected Projected Projected
FUND 105 PROPERTY ABATEMENTREVENUES:
Abatement Charges - 47,549 13,700 13,700 - - - - - -
Interest Earnings 146 123 - - - - - - - -
Judgments & Settlements - 20,002 - - - - - - - -
Transfer In - Fund 001 General - - 35,000 35,000 35,000 35,000 - - - -
Total Revenues 146$ 67,674$ 48,700$ 48,700$ 35,000$ 35,000$ -$ -$ -$ -$
EXPENDITURES:
Abatement 16,902 44,074 175,000 175,000 135,000 135,000 - - - -
Total Expenditures 16,902$ 44,074$ 175,000$ 175,000$ 135,000$ 135,000$ -$ -$ -$ -$
Beginning Fund Balance: 254,927$ 238,171$ 261,771$ 238,171$ 135,471$ 111,871$ 11,871$ 11,871$ 11,871$ 11,871$
Ending Fund Balance: 238,171$ 261,771$ 135,471$ 111,871$ 35,471$ 11,871$ 11,871$ 11,871$ 11,871$ 11,871$
60
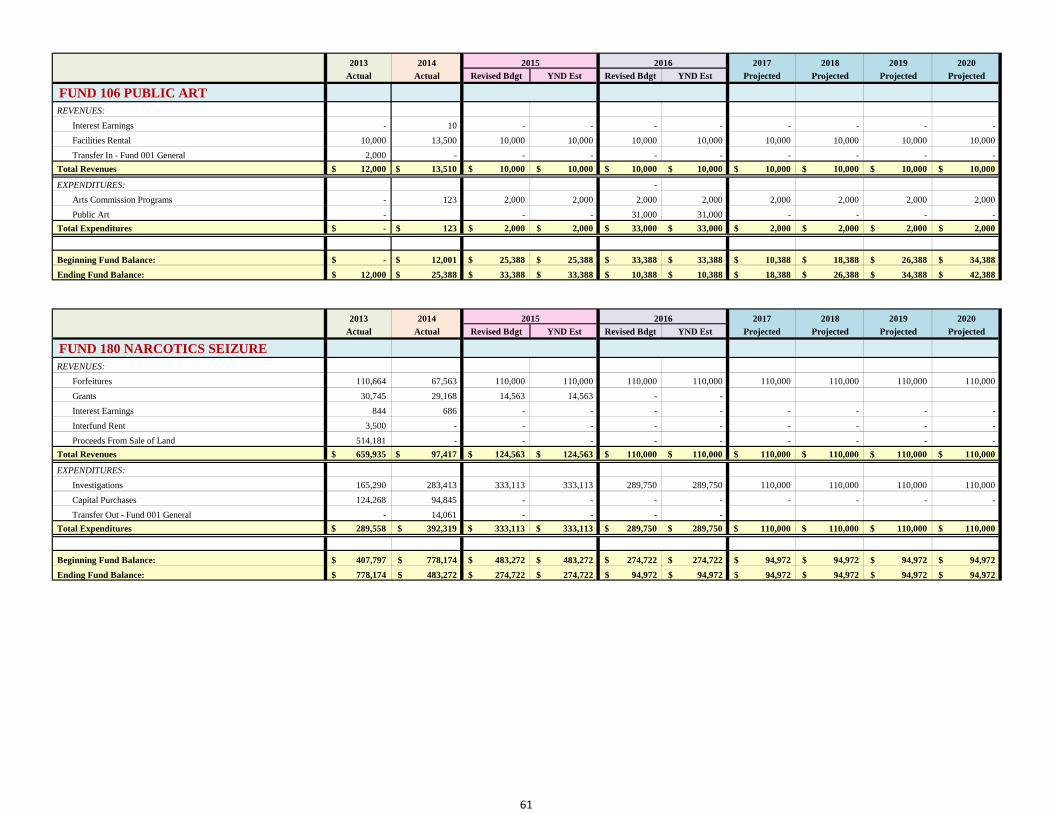
2013 2014 2015 2016 2017 2018 2019 2020
Actual Actual Revised Bdgt YND Est Revised Bdgt YND Est Projected Projected Projected Projected
FUND 106 PUBLIC ARTREVENUES:
Interest Earnings - 10 - - - - - - - -
Facilities Rental 10,000 13,500 10,000 10,000 10,000 10,000 10,000 10,000 10,000 10,000
Transfer In - Fund 001 General 2,000 - - - - - - - - -
Total Revenues 12,000$ 13,510$ 10,000$ 10,000$ 10,000$ 10,000$ 10,000$ 10,000$ 10,000$ 10,000$
EXPENDITURES: -
Arts Commission Programs - 123 2,000 2,000 2,000 2,000 2,000 2,000 2,000 2,000
Public Art - - - 31,000 31,000 - - - -
Total Expenditures -$ 123$ 2,000$ 2,000$ 33,000$ 33,000$ 2,000$ 2,000$ 2,000$ 2,000$
Beginning Fund Balance: -$ 12,001$ 25,388$ 25,388$ 33,388$ 33,388$ 10,388$ 18,388$ 26,388$ 34,388$
Ending Fund Balance: 12,000$ 25,388$ 33,388$ 33,388$ 10,388$ 10,388$ 18,388$ 26,388$ 34,388$ 42,388$
2013 2014 2015 2016 2017 2018 2019 2020
Actual Actual Revised Bdgt YND Est Revised Bdgt YND Est Projected Projected Projected Projected
FUND 180 NARCOTICS SEIZUREREVENUES:
Forfeitures 110,664 67,563 110,000 110,000 110,000 110,000 110,000 110,000 110,000 110,000
Grants 30,745 29,168 14,563 14,563 - -
Interest Earnings 844 686 - - - - - - - -
Interfund Rent 3,500 - - - - - - - - -
Proceeds From Sale of Land 514,181 - - - - - - - - -
Total Revenues 659,935$ 97,417$ 124,563$ 124,563$ 110,000$ 110,000$ 110,000$ 110,000$ 110,000$ 110,000$
EXPENDITURES:
Investigations 165,290 283,413 333,113 333,113 289,750 289,750 110,000 110,000 110,000 110,000
Capital Purchases 124,268 94,845 - - - - - - - -
Transfer Out - Fund 001 General - 14,061 - - - -
Total Expenditures 289,558$ 392,319$ 333,113$ 333,113$ 289,750$ 289,750$ 110,000$ 110,000$ 110,000$ 110,000$
Beginning Fund Balance: 407,797$ 778,174$ 483,272$ 483,272$ 274,722$ 274,722$ 94,972$ 94,972$ 94,972$ 94,972$
Ending Fund Balance: 778,174$ 483,272$ 274,722$ 274,722$ 94,972$ 94,972$ 94,972$ 94,972$ 94,972$ 94,972$
61
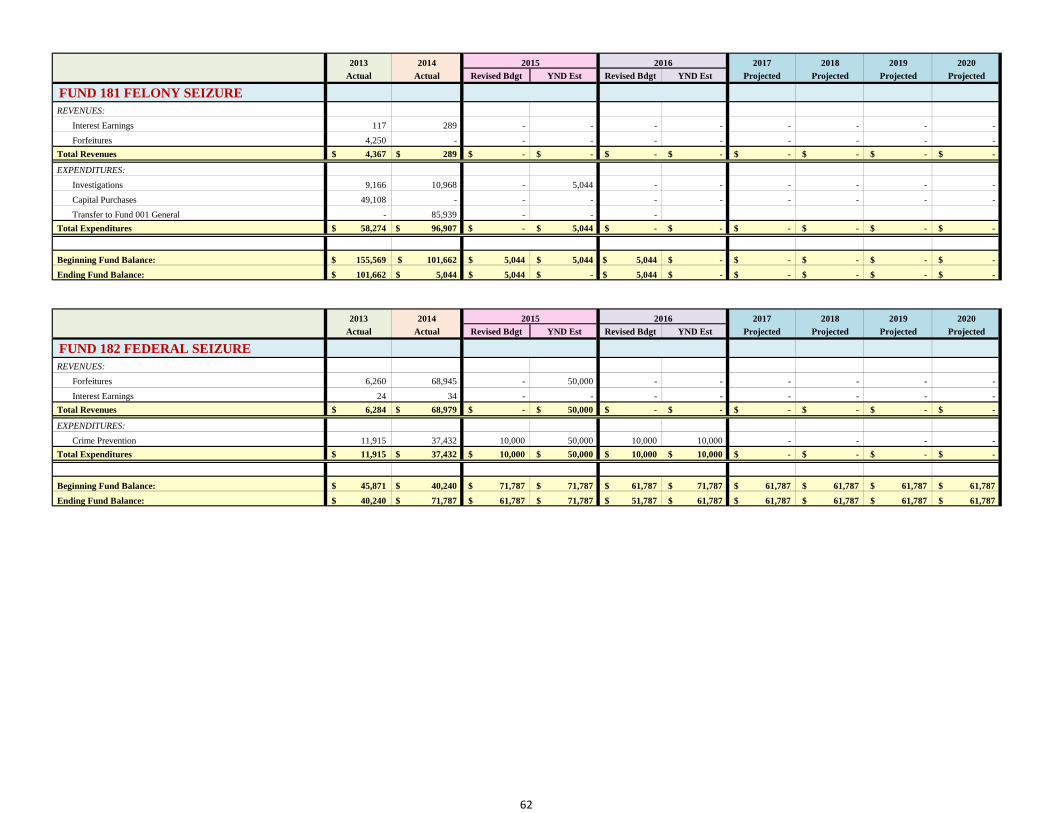
2013 2014 2015 2016 2017 2018 2019 2020
Actual Actual Revised Bdgt YND Est Revised Bdgt YND Est Projected Projected Projected Projected
FUND 181 FELONY SEIZUREREVENUES:
Interest Earnings 117 289 - - - - - - - -
Forfeitures 4,250 - - - - - - - - -
Total Revenues 4,367$ 289$ -$ -$ -$ -$ -$ -$ -$ -$
EXPENDITURES:
Investigations 9,166 10,968 - 5,044 - - - - - -
Capital Purchases 49,108 - - - - - - - - -
Transfer to Fund 001 General - 85,939 - - -
Total Expenditures 58,274$ 96,907$ -$ 5,044$ -$ -$ -$ -$ -$ -$
Beginning Fund Balance: 155,569$ 101,662$ 5,044$ 5,044$ 5,044$ -$ -$ -$ -$ -$
Ending Fund Balance: 101,662$ 5,044$ 5,044$ -$ 5,044$ -$ -$ -$ -$ -$
2013 2014 2015 2016 2017 2018 2019 2020
Actual Actual Revised Bdgt YND Est Revised Bdgt YND Est Projected Projected Projected Projected
FUND 182 FEDERAL SEIZUREREVENUES:
Forfeitures 6,260 68,945 - 50,000 - - - - - -
Interest Earnings 24 34 - - - - - - - -
Total Revenues 6,284$ 68,979$ -$ 50,000$ -$ -$ -$ -$ -$ -$
EXPENDITURES:
Crime Prevention 11,915 37,432 10,000 50,000 10,000 10,000 - - - -
Total Expenditures 11,915$ 37,432$ 10,000$ 50,000$ 10,000$ 10,000$ -$ -$ -$ -$
Beginning Fund Balance: 45,871$ 40,240$ 71,787$ 71,787$ 61,787$ 71,787$ 61,787$ 61,787$ 61,787$ 61,787$
Ending Fund Balance: 40,240$ 71,787$ 61,787$ 71,787$ 51,787$ 61,787$ 61,787$ 61,787$ 61,787$ 61,787$
62
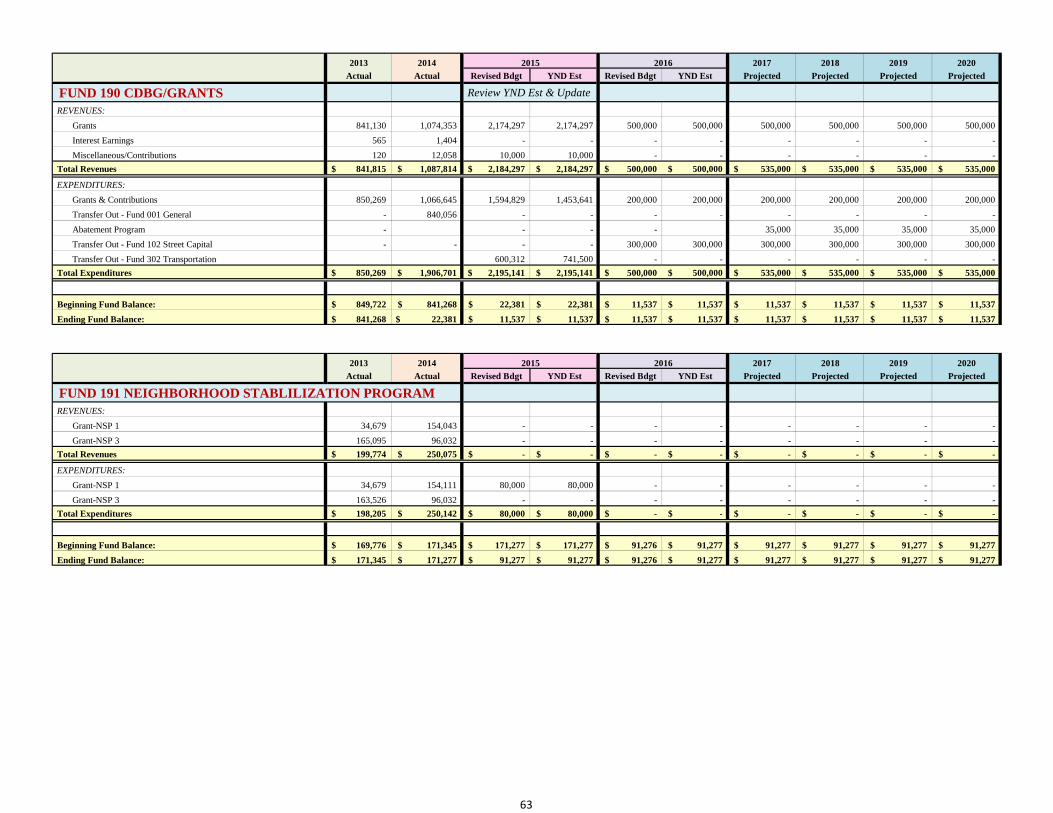
2013 2014 2015 2016 2017 2018 2019 2020
Actual Actual Revised Bdgt YND Est Revised Bdgt YND Est Projected Projected Projected Projected
FUND 190 CDBG/GRANTS Review YND Est & Update
REVENUES:
Grants 841,130 1,074,353 2,174,297 2,174,297 500,000 500,000 500,000 500,000 500,000 500,000
Interest Earnings 565 1,404 - - - - - - - -
Miscellaneous/Contributions 120 12,058 10,000 10,000 - - - - - -
Total Revenues 841,815$ 1,087,814$ 2,184,297$ 2,184,297$ 500,000$ 500,000$ 535,000$ 535,000$ 535,000$ 535,000$
EXPENDITURES:
Grants & Contributions 850,269 1,066,645 1,594,829 1,453,641 200,000 200,000 200,000 200,000 200,000 200,000
Transfer Out - Fund 001 General - 840,056 - - - - - - - -
Abatement Program - - - - 35,000 35,000 35,000 35,000
Transfer Out - Fund 102 Street Capital - - - - 300,000 300,000 300,000 300,000 300,000 300,000
Transfer Out - Fund 302 Transportation 600,312 741,500 - - - - - -
Total Expenditures 850,269$ 1,906,701$ 2,195,141$ 2,195,141$ 500,000$ 500,000$ 535,000$ 535,000$ 535,000$ 535,000$
Beginning Fund Balance: 849,722$ 841,268$ 22,381$ 22,381$ 11,537$ 11,537$ 11,537$ 11,537$ 11,537$ 11,537$
Ending Fund Balance: 841,268$ 22,381$ 11,537$ 11,537$ 11,537$ 11,537$ 11,537$ 11,537$ 11,537$ 11,537$
2013 2014 2015 2016 2017 2018 2019 2020
Actual Actual Revised Bdgt YND Est Revised Bdgt YND Est Projected Projected Projected Projected
FUND 191 NEIGHBORHOOD STABLILIZATION PROGRAMREVENUES:
Grant-NSP 1 34,679 154,043 - - - - - - - -
Grant-NSP 3 165,095 96,032 - - - - - - - -
Total Revenues 199,774$ 250,075$ -$ -$ -$ -$ -$ -$ -$ -$
EXPENDITURES:
Grant-NSP 1 34,679 154,111 80,000 80,000 - - - - - -
Grant-NSP 3 163,526 96,032 - - - - - - - -
Total Expenditures 198,205$ 250,142$ 80,000$ 80,000$ -$ -$ -$ -$ -$ -$
Beginning Fund Balance: 169,776$ 171,345$ 171,277$ 171,277$ 91,276$ 91,277$ 91,277$ 91,277$ 91,277$ 91,277$
Ending Fund Balance: 171,345$ 171,277$ 91,277$ 91,277$ 91,276$ 91,277$ 91,277$ 91,277$ 91,277$ 91,277$
63

2013 2014 2015 2016 2017 2018 2019 2020
Actual Actual Revised Bdgt YND Est Revised Bdgt YND Est Projected Projected Projected Projected
FUND 192 OFFICE OF ECONOMIC ADJUSTMENT/SSMCPREVENUES:
Grants 189,961 281,466 - - - - - - - -
Partner Participation 30,000 133,250 339,596 339,596 129,500 129,500 129,500 129,500 129,500 129,500
Transfer In From Fund 001 General - 50,000 50,000 50,000 50,000 50,000 50,000 50,000 50,000 50,000
Total Revenues 219,961$ 464,716$ 389,596$ 389,596$ 179,500$ 179,500$ 179,500$ 179,500$ 179,500$ 179,500$
EXPENDITURES:
OEA/SSMCP 223,826 408,649 400,209 400,209 179,500 179,500 179,500 179,500 179,500 179,500
Total Expenditures 223,826$ 408,649$ 400,209$ 400,209$ 179,500$ 179,500$ 179,500$ 179,500$ 179,500$ 179,500$
Beginning Fund Balance: 32,517$ 28,652$ 84,719$ 84,719$ 74,106$ 74,106$ 74,106$ 74,106$ 74,106$ 74,106$
Ending Fund Balance: 28,652$ 84,719$ 74,106$ 74,106$ 74,106$ 74,106$ 74,106$ 74,106$ 74,106$ 74,106$
2013 2014 2015 2016 2017 2018 2019 2020
Actual Actual Revised Bdgt YND Est Revised Bdgt YND Est Projected Projected Projected Projected
FUND 195 PUBLIC SAFETY GRANTSREVENUES:
Grants 384,752 175,919 177,067 177,067 - - - - - -
Transfer In - Fund 001 General 2,353 10,848 - - - - - - - -
Total Revenues 387,105$ 186,767$ 177,067$ 177,067$ -$ -$ -$ -$ -$ -$
EXPENDITURES:
Grants 389,399 186,551 177,283 177,283 - - - - - -
Total Expenditures 389,399$ 186,551$ 177,283$ 177,283$ -$ -$ -$ -$ -$ -$
Beginning Fund Balance: 2,294$ -$ 216$ 216$ -$ -$ -$ -$ -$ -$
Ending Fund Balance: -$ 216$ 0$ -$ -$ -$ -$ -$ -$ -$
2013 2014 2015 2016 2017 2018 2019 2020
Actual Actual Revised Bdgt YND Est Revised Bdgt YND Est Projected Projected Projected Projected
FUND 201 GENERAL OBLIGATION BOND DEBT SERVICEREVENUES:
Transfer-In From Fund 001 General - 287,758 340,659 340,659 444,808 444,808 440,623 441,188 441,313 439,763
Total Revenues -$ 287,758$ 340,659$ 340,659$ 444,808$ 444,808$ 440,623$ 441,188$ 441,313$ 439,763$
EXPENDITURES:
Principal & Interest - 59th Street - 77,000 77,000 77,000 77,000 77,000 77,000 77,000 77,000 77,000
Principal & Interest - Police Station - 210,758 212,183 212,183 213,158 213,158 208,598 209,038 209,288 208,113
Principal & Interest - LOCAL LED Streetlight - - 51,476 51,476 154,650 154,650 155,025 155,150 155,025 154,650
Total Expenditures -$ 287,758$ 340,659$ 340,659$ 444,808$ 444,808$ 440,623$ 441,188$ 441,313$ 439,763$
Beginning Fund Balance: -$ -$ -$ -$ -$ -$ -$ -$ -$ -$
Ending Fund Balance: -$ -$ -$ -$ -$ -$ -$ -$ -$ -$
64
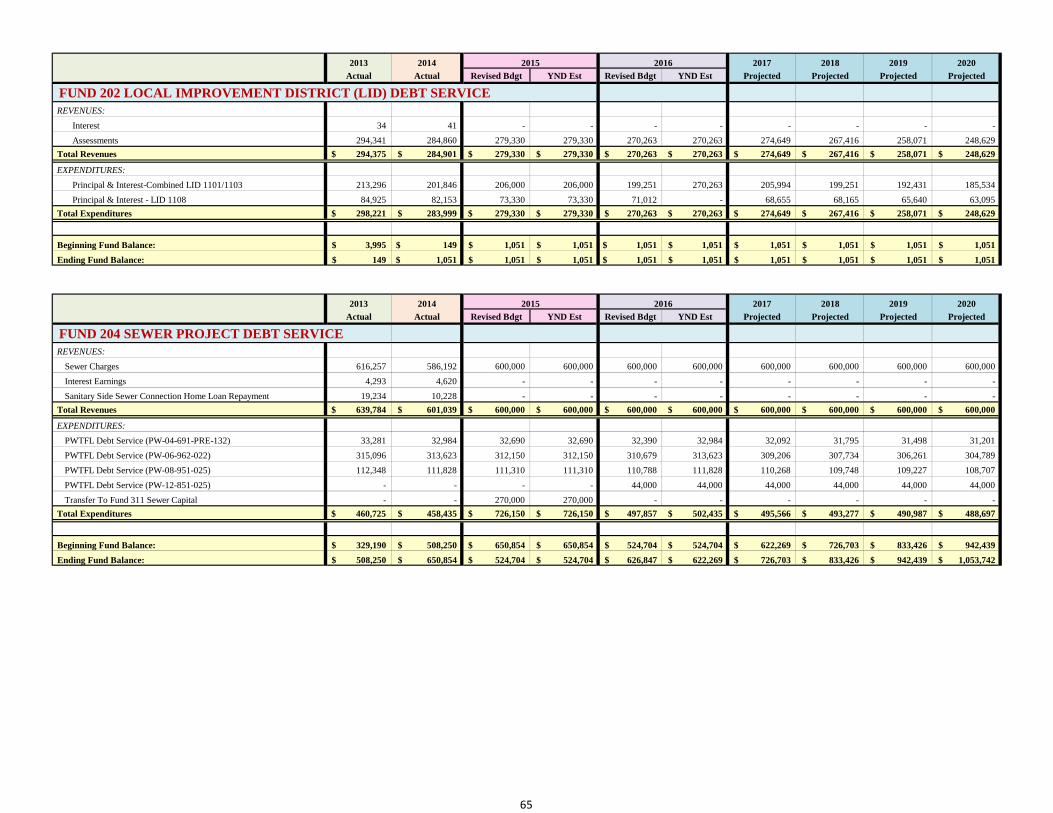
2013 2014 2015 2016 2017 2018 2019 2020
Actual Actual Revised Bdgt YND Est Revised Bdgt YND Est Projected Projected Projected Projected
FUND 202 LOCAL IMPROVEMENT DISTRICT (LID) DEBT SERVICEREVENUES:
Interest 34 41 - - - - - - - -
Assessments 294,341 284,860 279,330 279,330 270,263 270,263 274,649 267,416 258,071 248,629
Total Revenues 294,375$ 284,901$ 279,330$ 279,330$ 270,263$ 270,263$ 274,649$ 267,416$ 258,071$ 248,629$
EXPENDITURES:
Principal & Interest-Combined LID 1101/1103 213,296 201,846 206,000 206,000 199,251 270,263 205,994 199,251 192,431 185,534
Principal & Interest - LID 1108 84,925 82,153 73,330 73,330 71,012 - 68,655 68,165 65,640 63,095
Total Expenditures 298,221$ 283,999$ 279,330$ 279,330$ 270,263$ 270,263$ 274,649$ 267,416$ 258,071$ 248,629$
Beginning Fund Balance: 3,995$ 149$ 1,051$ 1,051$ 1,051$ 1,051$ 1,051$ 1,051$ 1,051$ 1,051$
Ending Fund Balance: 149$ 1,051$ 1,051$ 1,051$ 1,051$ 1,051$ 1,051$ 1,051$ 1,051$ 1,051$
2013 2014 2015 2016 2017 2018 2019 2020
Actual Actual Revised Bdgt YND Est Revised Bdgt YND Est Projected Projected Projected Projected
FUND 204 SEWER PROJECT DEBT SERVICEREVENUES:
Sewer Charges 616,257 586,192 600,000 600,000 600,000 600,000 600,000 600,000 600,000 600,000
Interest Earnings 4,293 4,620 - - - - - - - -
Sanitary Side Sewer Connection Home Loan Repayment 19,234 10,228 - - - - - - - -
Total Revenues 639,784$ 601,039$ 600,000$ 600,000$ 600,000$ 600,000$ 600,000$ 600,000$ 600,000$ 600,000$
EXPENDITURES:
PWTFL Debt Service (PW-04-691-PRE-132) 33,281 32,984 32,690 32,690 32,390 32,984 32,092 31,795 31,498 31,201
PWTFL Debt Service (PW-06-962-022) 315,096 313,623 312,150 312,150 310,679 313,623 309,206 307,734 306,261 304,789
PWTFL Debt Service (PW-08-951-025) 112,348 111,828 111,310 111,310 110,788 111,828 110,268 109,748 109,227 108,707
PWTFL Debt Service (PW-12-851-025) - - - - 44,000 44,000 44,000 44,000 44,000 44,000
Transfer To Fund 311 Sewer Capital - - 270,000 270,000 - - - - - -
Total Expenditures 460,725$ 458,435$ 726,150$ 726,150$ 497,857$ 502,435$ 495,566$ 493,277$ 490,987$ 488,697$
Beginning Fund Balance: 329,190$ 508,250$ 650,854$ 650,854$ 524,704$ 524,704$ 622,269$ 726,703$ 833,426$ 942,439$
Ending Fund Balance: 508,250$ 650,854$ 524,704$ 524,704$ 626,847$ 622,269$ 726,703$ 833,426$ 942,439$ 1,053,742$
65
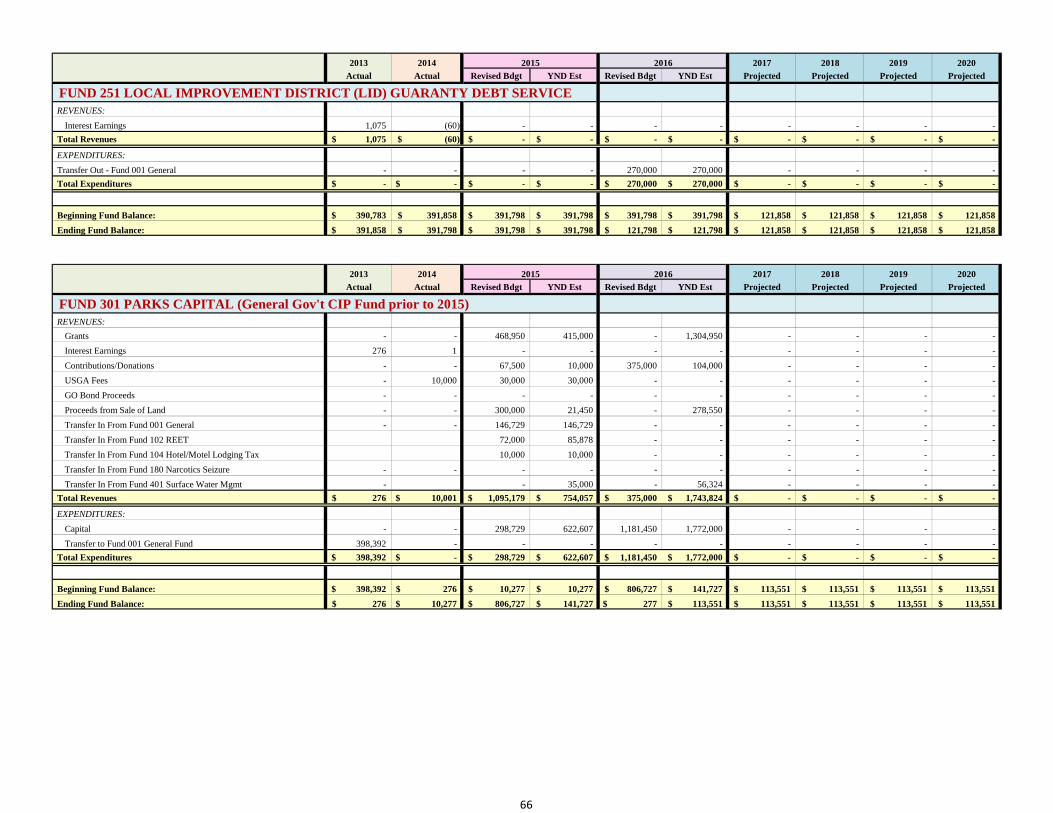
2013 2014 2015 2016 2017 2018 2019 2020
Actual Actual Revised Bdgt YND Est Revised Bdgt YND Est Projected Projected Projected Projected
FUND 251 LOCAL IMPROVEMENT DISTRICT (LID) GUARANTY DEBT SERVICEREVENUES:
Interest Earnings 1,075 (60) - - - - - - - -
Total Revenues 1,075$ (60)$ -$ -$ -$ -$ -$ -$ -$ -$
EXPENDITURES:
Transfer Out - Fund 001 General - - - - 270,000 270,000 - - - -
Total Expenditures -$ -$ -$ -$ 270,000$ 270,000$ -$ -$ -$ -$
Beginning Fund Balance: 390,783$ 391,858$ 391,798$ 391,798$ 391,798$ 391,798$ 121,858$ 121,858$ 121,858$ 121,858$
Ending Fund Balance: 391,858$ 391,798$ 391,798$ 391,798$ 121,798$ 121,798$ 121,858$ 121,858$ 121,858$ 121,858$
2013 2014 2015 2016 2017 2018 2019 2020
Actual Actual Revised Bdgt YND Est Revised Bdgt YND Est Projected Projected Projected Projected
FUND 301 PARKS CAPITAL (General Gov't CIP Fund prior to 2015) REVENUES:
Grants - - 468,950 415,000 - 1,304,950 - - - -
Interest Earnings 276 1 - - - - - - - -
Contributions/Donations - - 67,500 10,000 375,000 104,000 - - - -
USGA Fees - 10,000 30,000 30,000 - - - - - -
GO Bond Proceeds - - - - - - - - - -
Proceeds from Sale of Land - - 300,000 21,450 - 278,550 - - - -
Transfer In From Fund 001 General - - 146,729 146,729 - - - - - -
Transfer In From Fund 102 REET 72,000 85,878 - - - - - -
Transfer In From Fund 104 Hotel/Motel Lodging Tax 10,000 10,000 - - - - - -
Transfer In From Fund 180 Narcotics Seizure - - - - - - - - - -
Transfer In From Fund 401 Surface Water Mgmt - - 35,000 - 56,324 - - - -
Total Revenues 276$ 10,001$ 1,095,179$ 754,057$ 375,000$ 1,743,824$ -$ -$ -$ -$
EXPENDITURES:
Capital - - 298,729 622,607 1,181,450 1,772,000 - - - -
Transfer to Fund 001 General Fund 398,392 - - - - - - - - -
Total Expenditures 398,392$ -$ 298,729$ 622,607$ 1,181,450$ 1,772,000$ -$ -$ -$ -$
Beginning Fund Balance: 398,392$ 276$ 10,277$ 10,277$ 806,727$ 141,727$ 113,551$ 113,551$ 113,551$ 113,551$
Ending Fund Balance: 276$ 10,277$ 806,727$ 141,727$ 277$ 113,551$ 113,551$ 113,551$ 113,551$ 113,551$
66

2013 2014 2015 2016 2017 2018 2019 2020
Actual Actual Revised Bdgt YND Est Revised Bdgt YND Est Projected Projected Projected Projected
FUND 302 TRANSPORATION CAPITAL PROJECTREVENUES:
Motor Vehicle Excise Tax - - 340,000 340,000 340,000 340,000 340,000 340,000 340,000 340,000
Grants - - 23,637,462 8,535,750 - 14,373,899 3,309,850 2,320,000 455,000 580,000
Contributions from Utilities/Developers/Partners - - 1,638,264 705,809 - 1,011,000 200,000 20,000 6,000 -
Miscellaneous/Interest Earnings/Utility Rebate - - 217,640 217,640 - - - - - -
Donations/Contibutions/Mitigation Fees - - - 1,712 - - - - - -
LOCAL Financing - - 1,654,448 1,654,448 - - - - - -
Proceeds from Sale of Asset/Street Vacation - - - 155,000 - - - - - -
Transfer In - Fund 001 General - - 689,500 689,500 310,500 310,500 748,500 357,500 403,500 395,500
Transfer In - Fund 102 REET - - 1,593,635 1,818,635 935,500 1,160,500 900,000 900,000 1,000,000 1,000,000
Transfer In - Fund 103 TBD - - 569,500 569,500 682,500 682,500 682,500 682,500 682,500 682,500
Transfer In - Fund 190 CDBG - - 600,312 158,812 - 685,000 175,000 661,000 - 239,000
Transfer In - Fund 401 SWM - - 2,161,329 930,117 - 1,416,329 262,650 150,000 - -
Total Revenues -$ -$ 33,102,090$ 15,776,923$ 2,268,500$ 19,979,728$ 6,618,500$ 5,431,000$ 2,887,000$ 3,237,000$
EXPENDITURES:
Capital Projects - From "Funded" List - - 32,730,961 14,829,654 2,284,000 20,729,624 6,613,500 5,426,000 2,882,000 3,232,000
Total Expenditures -$ -$ 32,730,961$ 14,829,654$ 2,284,000$ 20,729,624$ 6,613,500$ 5,426,000$ 2,882,000$ 3,232,000$
Beginning Fund Balance: -$ -$ -$ -$ 371,129$ 947,269$ 197,373$ 202,373$ 207,373$ 212,373$
Ending Fund Balance: -$ -$ 371,129$ 947,269$ 355,629$ 197,373$ 202,373$ 207,373$ 212,373$ 217,373$
Reserved for Paths & Trails (MVET Requirement) -$ -$ 10,045$ 10,045$ 15,045$ 15,045$ 20,045$ 25,045$ 29,045$ 34,045$
Reserved for Mitigation Projects (Mitigation Requirement) -$ -$ 311,084$ 305,736$ 311,084$ 179,746$ 179,746$ 179,746$ 179,746$ 179,746$
Unreserved -$ -$ 50,000$ 631,488$ 29,500$ 2,582$ 2,582$ 2,582$ 3,582$ 3,582$
67
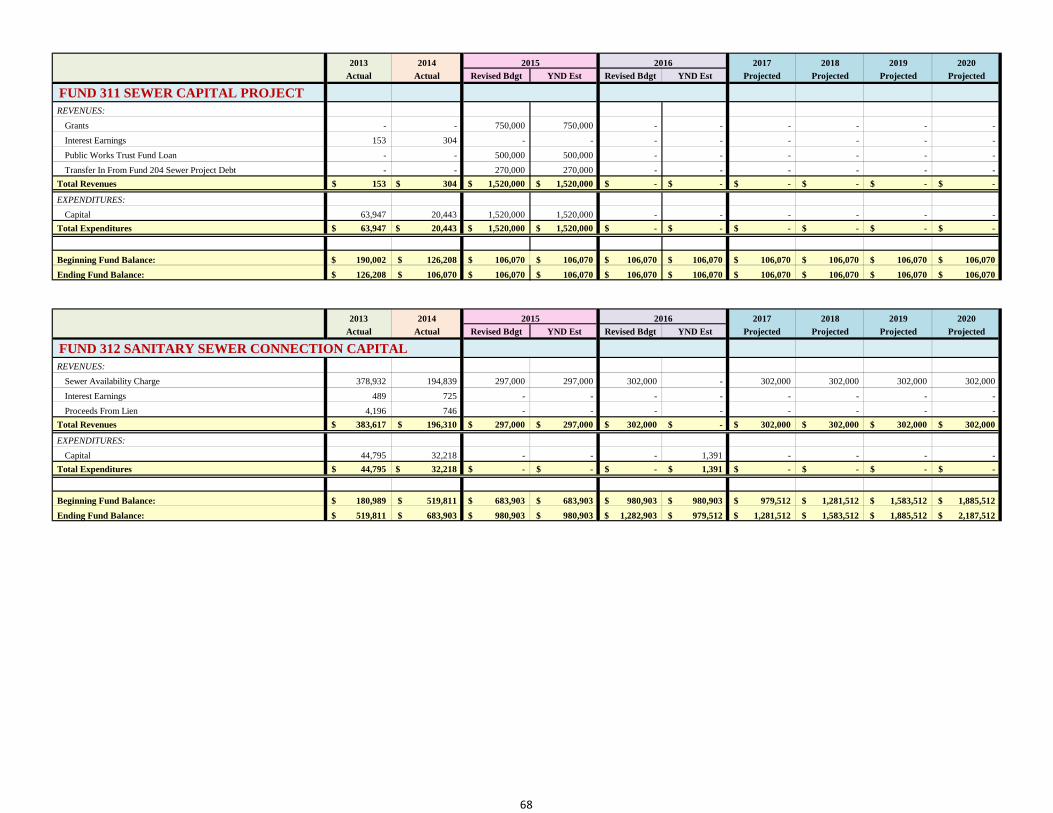
2013 2014 2015 2016 2017 2018 2019 2020
Actual Actual Revised Bdgt YND Est Revised Bdgt YND Est Projected Projected Projected Projected
FUND 311 SEWER CAPITAL PROJECTREVENUES:
Grants - - 750,000 750,000 - - - - - -
Interest Earnings 153 304 - - - - - - - -
Public Works Trust Fund Loan - - 500,000 500,000 - - - - - -
Transfer In From Fund 204 Sewer Project Debt - - 270,000 270,000 - - - - - -
Total Revenues 153$ 304$ 1,520,000$ 1,520,000$ -$ -$ -$ -$ -$ -$
EXPENDITURES:
Capital 63,947 20,443 1,520,000 1,520,000 - - - - - -
Total Expenditures 63,947$ 20,443$ 1,520,000$ 1,520,000$ -$ -$ -$ -$ -$ -$
Beginning Fund Balance: 190,002$ 126,208$ 106,070$ 106,070$ 106,070$ 106,070$ 106,070$ 106,070$ 106,070$ 106,070$
Ending Fund Balance: 126,208$ 106,070$ 106,070$ 106,070$ 106,070$ 106,070$ 106,070$ 106,070$ 106,070$ 106,070$
2013 2014 2015 2016 2017 2018 2019 2020
Actual Actual Revised Bdgt YND Est Revised Bdgt YND Est Projected Projected Projected Projected
FUND 312 SANITARY SEWER CONNECTION CAPITAL REVENUES:
Sewer Availability Charge 378,932 194,839 297,000 297,000 302,000 - 302,000 302,000 302,000 302,000
Interest Earnings 489 725 - - - - - - - -
Proceeds From Lien 4,196 746 - - - - - - - -
Total Revenues 383,617$ 196,310$ 297,000$ 297,000$ 302,000$ -$ 302,000$ 302,000$ 302,000$ 302,000$
EXPENDITURES:
Capital 44,795 32,218 - - - 1,391 - - - -
Total Expenditures 44,795$ 32,218$ -$ -$ -$ 1,391$ -$ -$ -$ -$
Beginning Fund Balance: 180,989$ 519,811$ 683,903$ 683,903$ 980,903$ 980,903$ 979,512$ 1,281,512$ 1,583,512$ 1,885,512$
Ending Fund Balance: 519,811$ 683,903$ 980,903$ 980,903$ 1,282,903$ 979,512$ 1,281,512$ 1,583,512$ 1,885,512$ 2,187,512$
68
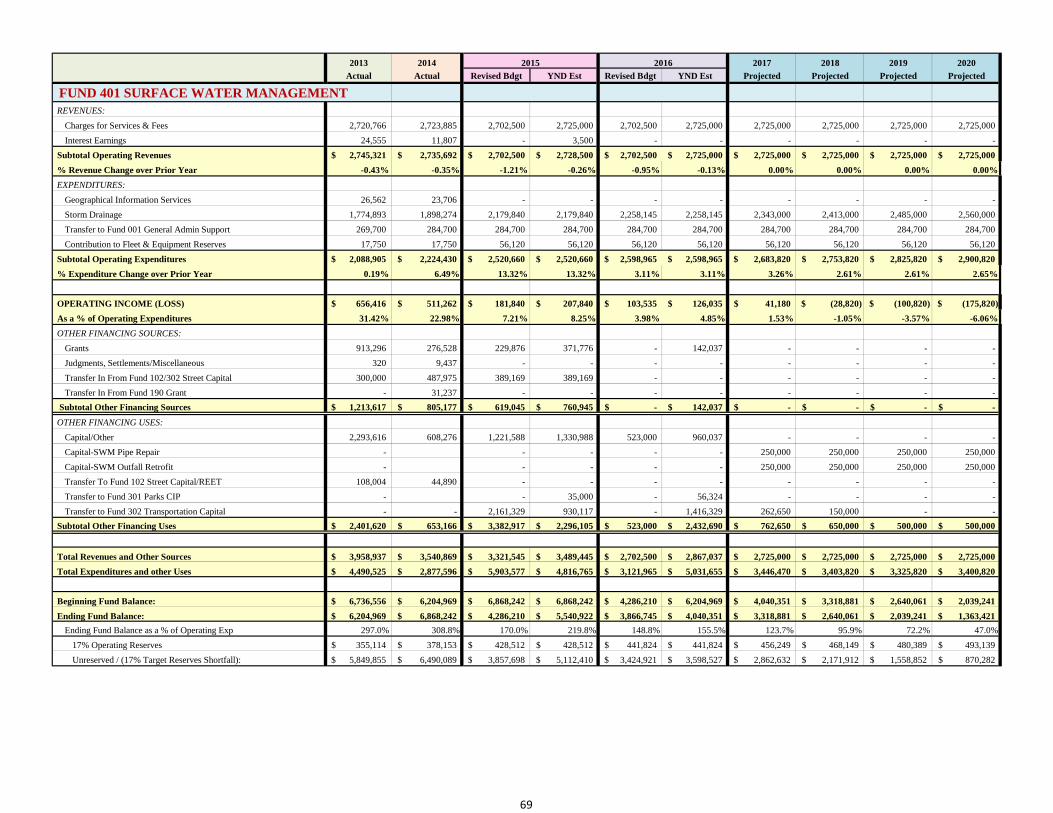
2013 2014 2015 2016 2017 2018 2019 2020
Actual Actual Revised Bdgt YND Est Revised Bdgt YND Est Projected Projected Projected Projected
FUND 401 SURFACE WATER MANAGEMENTREVENUES:
Charges for Services & Fees 2,720,766 2,723,885 2,702,500 2,725,000 2,702,500 2,725,000 2,725,000 2,725,000 2,725,000 2,725,000
Interest Earnings 24,555 11,807 - 3,500 - - - - - -
Subtotal Operating Revenues 2,745,321$ 2,735,692$ 2,702,500$ 2,728,500$ 2,702,500$ 2,725,000$ 2,725,000$ 2,725,000$ 2,725,000$ 2,725,000$
% Revenue Change over Prior Year -0.43% -0.35% -1.21% -0.26% -0.95% -0.13% 0.00% 0.00% 0.00% 0.00%
EXPENDITURES:
Geographical Information Services 26,562 23,706 - - - - - - - -
Storm Drainage 1,774,893 1,898,274 2,179,840 2,179,840 2,258,145 2,258,145 2,343,000 2,413,000 2,485,000 2,560,000
Transfer to Fund 001 General Admin Support 269,700 284,700 284,700 284,700 284,700 284,700 284,700 284,700 284,700 284,700
Contribution to Fleet & Equipment Reserves 17,750 17,750 56,120 56,120 56,120 56,120 56,120 56,120 56,120 56,120
Subtotal Operating Expenditures 2,088,905$ 2,224,430$ 2,520,660$ 2,520,660$ 2,598,965$ 2,598,965$ 2,683,820$ 2,753,820$ 2,825,820$ 2,900,820$
% Expenditure Change over Prior Year 0.19% 6.49% 13.32% 13.32% 3.11% 3.11% 3.26% 2.61% 2.61% 2.65%
OPERATING INCOME (LOSS) 656,416$ 511,262$ 181,840$ 207,840$ 103,535$ 126,035$ 41,180$ (28,820)$ (100,820)$ (175,820)$
As a % of Operating Expenditures 31.42% 22.98% 7.21% 8.25% 3.98% 4.85% 1.53% -1.05% -3.57% -6.06%
OTHER FINANCING SOURCES:
Grants 913,296 276,528 229,876 371,776 - 142,037 - - - -
Judgments, Settlements/Miscellaneous 320 9,437 - - - - - - - -
Transfer In From Fund 102/302 Street Capital 300,000 487,975 389,169 389,169 - - - - - -
Transfer In From Fund 190 Grant - 31,237 - - - - - - - -
Subtotal Other Financing Sources 1,213,617$ 805,177$ 619,045$ 760,945$ -$ 142,037$ -$ -$ -$ -$
OTHER FINANCING USES:
Capital/Other 2,293,616 608,276 1,221,588 1,330,988 523,000 960,037 - - - -
Capital-SWM Pipe Repair - - - - - 250,000 250,000 250,000 250,000
Capital-SWM Outfall Retrofit - - - - - 250,000 250,000 250,000 250,000
Transfer To Fund 102 Street Capital/REET 108,004 44,890 - - - - - - - -
Transfer to Fund 301 Parks CIP - - 35,000 - 56,324 - - - -
Transfer to Fund 302 Transportation Capital - - 2,161,329 930,117 - 1,416,329 262,650 150,000 - -
Subtotal Other Financing Uses 2,401,620$ 653,166$ 3,382,917$ 2,296,105$ 523,000$ 2,432,690$ 762,650$ 650,000$ 500,000$ 500,000$
Total Revenues and Other Sources 3,958,937$ 3,540,869$ 3,321,545$ 3,489,445$ 2,702,500$ 2,867,037$ 2,725,000$ 2,725,000$ 2,725,000$ 2,725,000$
Total Expenditures and other Uses 4,490,525$ 2,877,596$ 5,903,577$ 4,816,765$ 3,121,965$ 5,031,655$ 3,446,470$ 3,403,820$ 3,325,820$ 3,400,820$
Beginning Fund Balance: 6,736,556$ 6,204,969$ 6,868,242$ 6,868,242$ 4,286,210$ 6,204,969$ 4,040,351$ 3,318,881$ 2,640,061$ 2,039,241$
Ending Fund Balance: 6,204,969$ 6,868,242$ 4,286,210$ 5,540,922$ 3,866,745$ 4,040,351$ 3,318,881$ 2,640,061$ 2,039,241$ 1,363,421$
Ending Fund Balance as a % of Operating Exp 297.0% 308.8% 170.0% 219.8% 148.8% 155.5% 123.7% 95.9% 72.2% 47.0%
17% Operating Reserves 355,114$ 378,153$ 428,512$ 428,512$ 441,824$ 441,824$ 456,249$ 468,149$ 480,389$ 493,139$
Unreserved / (17% Target Reserves Shortfall): 5,849,855$ 6,490,089$ 3,857,698$ 5,112,410$ 3,424,921$ 3,598,527$ 2,862,632$ 2,171,912$ 1,558,852$ 870,282$
69
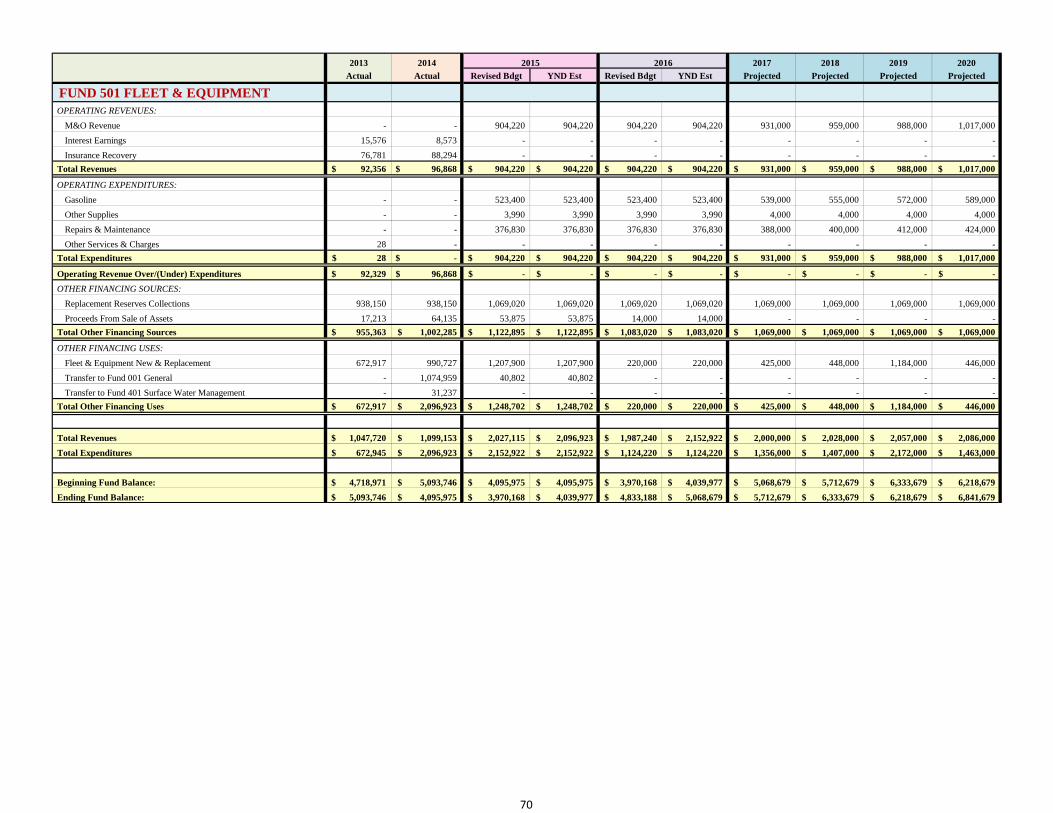
2013 2014 2015 2016 2017 2018 2019 2020
Actual Actual Revised Bdgt YND Est Revised Bdgt YND Est Projected Projected Projected Projected
FUND 501 FLEET & EQUIPMENTOPERATING REVENUES:
M&O Revenue - - 904,220 904,220 904,220 904,220 931,000 959,000 988,000 1,017,000
Interest Earnings 15,576 8,573 - - - - - - - -
Insurance Recovery 76,781 88,294 - - - - - - - -
Total Revenues 92,356$ 96,868$ 904,220$ 904,220$ 904,220$ 904,220$ 931,000$ 959,000$ 988,000$ 1,017,000$
OPERATING EXPENDITURES:
Gasoline - - 523,400 523,400 523,400 523,400 539,000 555,000 572,000 589,000
Other Supplies - - 3,990 3,990 3,990 3,990 4,000 4,000 4,000 4,000
Repairs & Maintenance - - 376,830 376,830 376,830 376,830 388,000 400,000 412,000 424,000
Other Services & Charges 28 - - - - - - - - -
Total Expenditures 28$ -$ 904,220$ 904,220$ 904,220$ 904,220$ 931,000$ 959,000$ 988,000$ 1,017,000$
Operating Revenue Over/(Under) Expenditures 92,329$ 96,868$ -$ -$ -$ -$ -$ -$ -$ -$
OTHER FINANCING SOURCES:
Replacement Reserves Collections 938,150 938,150 1,069,020 1,069,020 1,069,020 1,069,020 1,069,000 1,069,000 1,069,000 1,069,000
Proceeds From Sale of Assets 17,213 64,135 53,875 53,875 14,000 14,000 - - - -
Total Other Financing Sources 955,363$ 1,002,285$ 1,122,895$ 1,122,895$ 1,083,020$ 1,083,020$ 1,069,000$ 1,069,000$ 1,069,000$ 1,069,000$
OTHER FINANCING USES:
Fleet & Equipment New & Replacement 672,917 990,727 1,207,900 1,207,900 220,000 220,000 425,000 448,000 1,184,000 446,000
Transfer to Fund 001 General - 1,074,959 40,802 40,802 - - - - - -
Transfer to Fund 401 Surface Water Management - 31,237 - - - - - - - -
Total Other Financing Uses 672,917$ 2,096,923$ 1,248,702$ 1,248,702$ 220,000$ 220,000$ 425,000$ 448,000$ 1,184,000$ 446,000$
Total Revenues 1,047,720$ 1,099,153$ 2,027,115$ 2,096,923$ 1,987,240$ 2,152,922$ 2,000,000$ 2,028,000$ 2,057,000$ 2,086,000$
Total Expenditures 672,945$ 2,096,923$ 2,152,922$ 2,152,922$ 1,124,220$ 1,124,220$ 1,356,000$ 1,407,000$ 2,172,000$ 1,463,000$
Beginning Fund Balance: 4,718,971$ 5,093,746$ 4,095,975$ 4,095,975$ 3,970,168$ 4,039,977$ 5,068,679$ 5,712,679$ 6,333,679$ 6,218,679$
Ending Fund Balance: 5,093,746$ 4,095,975$ 3,970,168$ 4,039,977$ 4,833,188$ 5,068,679$ 5,712,679$ 6,333,679$ 6,218,679$ 6,841,679$
70

2013 2014 2015 2016 2017 2018 2019 2020
Actual Actual Revised Bdgt YND Est Revised Bdgt YND Est Projected Projected Projected Projected
FUND 502 PROPERTY MANAGEMENT (City Hall Services Fund prior to 2015)OPERATING REVENUES:
M&O Revenue - - 742,080 742,080 749,800 749,800 773,000 797,000 821,000 846,000
Interest Earnings 722 703 - - - - - - - -
Total Opeating Revenues 722$ 703$ 742,080$ 742,080$ 749,800$ 749,800$ 773,000$ 797,000$ 821,000$ 846,000$
OPERATING EXPENDITURES:
City Hall Facility - - 338,070 338,070 342,500 342,500 353,000 364,000 375,000 386,000
Police Station - - 226,020 226,020 228,770 228,770 236,000 243,000 250,000 258,000
Parking Facilities/Light Rail - - 177,990 177,990 178,530 178,530 184,000 190,000 196,000 202,000
Total Operating Expenditures -$ -$ 742,080$ 742,080$ 749,800$ 749,800$ 773,000$ 797,000$ 821,000$ 846,000$
Operating Revenue Over/(Under) Expenditures 722$ 703$ -$ -$ -$ -$ -$ -$ -$ -$
OTHER FINANCING SOURCES:
Replacement Reserve Collections - - - - - - 100,000 100,000 100,000 100,000
Total Other Financing Sources -$ -$ -$ -$ -$ -$ 100,000$ 100,000$ 100,000$ 100,000$
OTHER FINANCING USES:
City Hall/Total: - 7,389 167,000 217,000 - - 20,000 125,000 50,000 -
Space Planning/Reconfiguration - 7,389 - 50,000 - - - - - -
HVAC & Security System - 72,000 72,000 - - - - - -
Slurry Seal & Restripe - 45,000 45,000 - - - - - -
HVAC for Computer Room - 20,000 20,000 - - - - - -
Server Room Sprinkler System - 30,000 30,000 - - - - - -
Boiler Replacement - - - - - 20,000 - - -
Public Area Carpet Replacement - - - - - - - 50,000 -
Exterior Beam Painting - - - - - - 75,000 - -
Chiller/Fan Replacement - - - - - - 50,000 - -
Police Station/Total: - - - - - - 5,000 - 135,000 30,000
Capital-Restripe Parking Lot - - - - - 5,000 - - -
Capital-Parking Lot Gate Rebuild - - - - - - - - 30,000
Capital-Shooting Range Equipment - - - - - - - 135,000 -
Sounder Station/Total: - - - - - - - 25,000 - -
Capital-Restripe Parking Lot - - - - - - 25,000 - -
Parks O&M Facility/Total: - - - - 50,000 50,000 32,000 - - -
Capital-HVAC System Replacement - - - - - 12,000 - - -
Capital-Pave Shop Parking Lot - - - 50,000 50,000 - - - -
Capital-LED Lighting - - - - - 10,000 - - -
Capital-Fuel Storage Shed - - - - - 10,000 - - -
Public Works O&M Facility/Total: - - - - - - 30,000 - - -
HVAC Replacement - - - - - 30,000 - - -
General Capital Replacement/Maintenance - 5,780 5,780 - - 100,000 100,000 100,000 100,000
Capital Projects - Police Station Gate - - 5,780 5,780 - - - - - -
Total Other Financing Uses -$ 7,389$ 172,780$ 222,780$ 50,000$ 50,000$ 187,000$ 225,000$ 285,000$ 130,000$
Total Revenues 722$ 703$ 742,080$ 742,080$ 749,800$ 749,800$ 873,000$ 897,000$ 921,000$ 946,000$
Total Expenditures -$ 7,389$ 914,860$ 964,860$ 799,800$ 799,800$ 960,000$ 1,022,000$ 1,106,000$ 976,000$
Beginning Fund Balance: 452,120$ 452,842$ 446,156$ 446,156$ 273,376$ 223,376$ 173,376$ 86,376$ (38,624)$ (223,624)$
Ending Fund Balance: 452,842$ 446,156$ 273,376$ 223,376$ 223,376$ 173,376$ 86,376$ (38,624)$ (223,624)$ (253,624)$
71
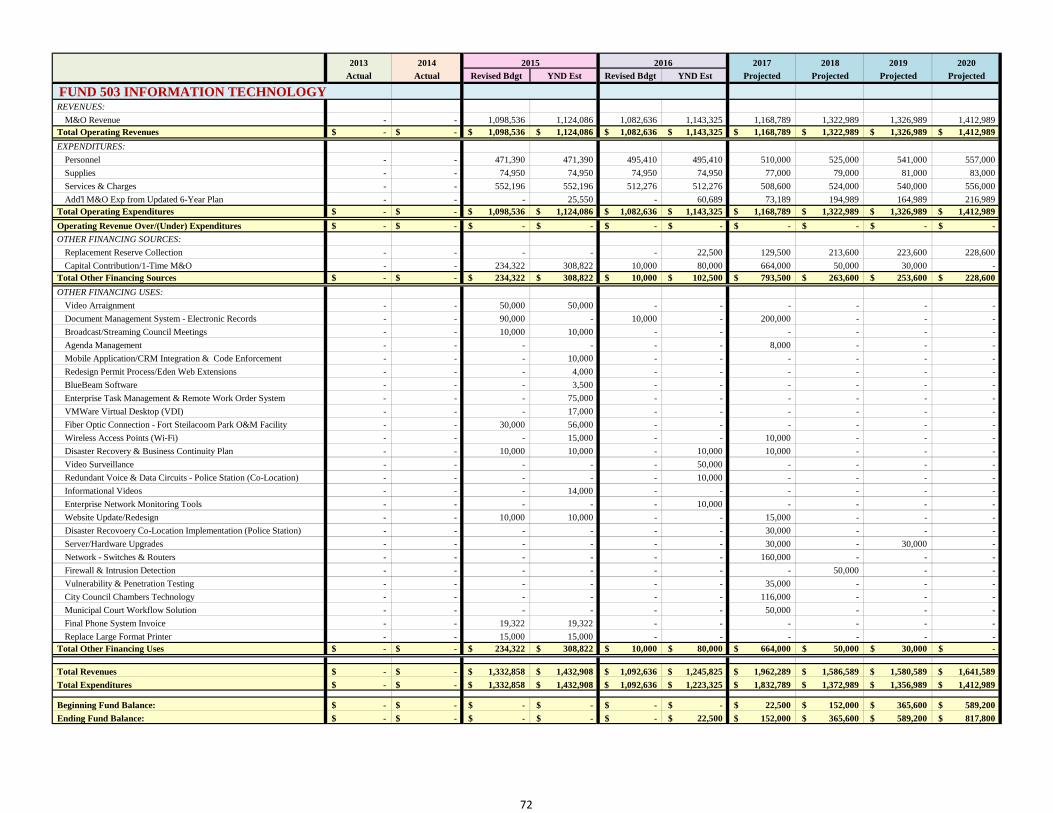
2013 2014 2015 2016 2017 2018 2019 2020
Actual Actual Revised Bdgt YND Est Revised Bdgt YND Est Projected Projected Projected Projected
FUND 503 INFORMATION TECHNOLOGYREVENUES:
M&O Revenue - - 1,098,536 1,124,086 1,082,636 1,143,325 1,168,789 1,322,989 1,326,989 1,412,989 Total Operating Revenues -$ -$ 1,098,536$ 1,124,086$ 1,082,636$ 1,143,325$ 1,168,789$ 1,322,989$ 1,326,989$ 1,412,989$
EXPENDITURES:
Personnel - - 471,390 471,390 495,410 495,410 510,000 525,000 541,000 557,000
Supplies - - 74,950 74,950 74,950 74,950 77,000 79,000 81,000 83,000
Services & Charges - - 552,196 552,196 512,276 512,276 508,600 524,000 540,000 556,000
Add'l M&O Exp from Updated 6-Year Plan - - - 25,550 - 60,689 73,189 194,989 164,989 216,989 Total Operating Expenditures -$ -$ 1,098,536$ 1,124,086$ 1,082,636$ 1,143,325$ 1,168,789$ 1,322,989$ 1,326,989$ 1,412,989$
Operating Revenue Over/(Under) Expenditures -$ -$ -$ -$ -$ -$ -$ -$ -$ -$
OTHER FINANCING SOURCES:
Replacement Reserve Collection - - - - - 22,500 129,500 213,600 223,600 228,600
Capital Contribution/1-Time M&O - - 234,322 308,822 10,000 80,000 664,000 50,000 30,000 - Total Other Financing Sources -$ -$ 234,322$ 308,822$ 10,000$ 102,500$ 793,500$ 263,600$ 253,600$ 228,600$
OTHER FINANCING USES:
Video Arraignment - - 50,000 50,000 - - - - - -
Document Management System - Electronic Records - - 90,000 - 10,000 - 200,000 - - -
Broadcast/Streaming Council Meetings - - 10,000 10,000 - - - - - -
Agenda Management - - - - - - 8,000 - - -
Mobile Application/CRM Integration & Code Enforcement - - - 10,000 - - - - - -
Redesign Permit Process/Eden Web Extensions - - - 4,000 - - - - - -
BlueBeam Software - - - 3,500 - - - - - -
Enterprise Task Management & Remote Work Order System - - - 75,000 - - - - - -
VMWare Virtual Desktop (VDI) - - - 17,000 - - - - - -
Fiber Optic Connection - Fort Steilacoom Park O&M Facility - - 30,000 56,000 - - - - - -
Wireless Access Points (Wi-Fi) - - - 15,000 - - 10,000 - - -
Disaster Recovery & Business Continuity Plan - - 10,000 10,000 - 10,000 10,000 - - -
Video Surveillance - - - - - 50,000 - - - -
Redundant Voice & Data Circuits - Police Station (Co-Location) - - - - - 10,000 - - - -
Informational Videos - - - 14,000 - - - - - -
Enterprise Network Monitoring Tools - - - - - 10,000 - - - -
Website Update/Redesign - - 10,000 10,000 - - 15,000 - - -
Disaster Recovoery Co-Location Implementation (Police Station) - - - - - - 30,000 - - -
Server/Hardware Upgrades - - - - - - 30,000 - 30,000 -
Network - Switches & Routers - - - - - - 160,000 - - -
Firewall & Intrusion Detection - - - - - - - 50,000 - -
Vulnerability & Penetration Testing - - - - - - 35,000 - - -
City Council Chambers Technology - - - - - - 116,000 - - -
Municipal Court Workflow Solution - - - - - - 50,000 - - -
Final Phone System Invoice - - 19,322 19,322 - - - - - -
Replace Large Format Printer - - 15,000 15,000 - - - - - - Total Other Financing Uses -$ -$ 234,322$ 308,822$ 10,000$ 80,000$ 664,000$ 50,000$ 30,000$ -$
Total Revenues -$ -$ 1,332,858$ 1,432,908$ 1,092,636$ 1,245,825$ 1,962,289$ 1,586,589$ 1,580,589$ 1,641,589$
Total Expenditures -$ -$ 1,332,858$ 1,432,908$ 1,092,636$ 1,223,325$ 1,832,789$ 1,372,989$ 1,356,989$ 1,412,989$
Beginning Fund Balance: -$ -$ -$ -$ -$ -$ 22,500$ 152,000$ 365,600$ 589,200$
Ending Fund Balance: -$ -$ -$ -$ -$ 22,500$ 152,000$ 365,600$ 589,200$ 817,800$
72
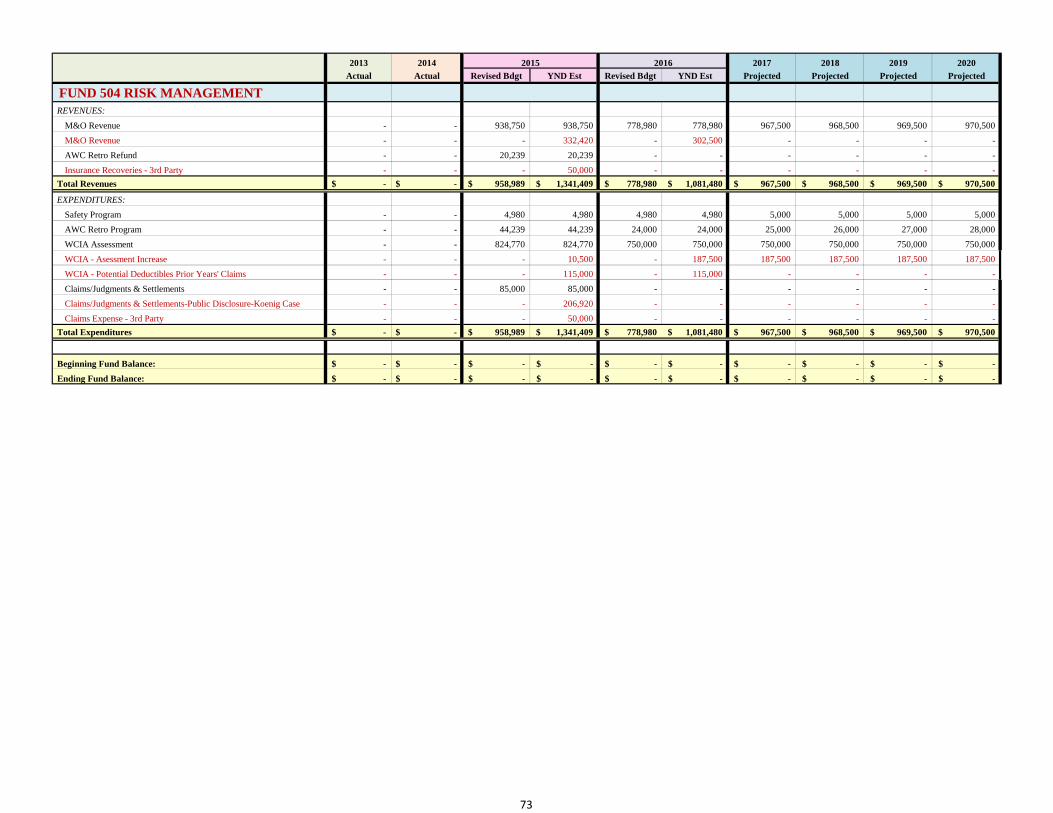
2013 2014 2015 2016 2017 2018 2019 2020
Actual Actual Revised Bdgt YND Est Revised Bdgt YND Est Projected Projected Projected Projected
FUND 504 RISK MANAGEMENTREVENUES:
M&O Revenue - - 938,750 938,750 778,980 778,980 967,500 968,500 969,500 970,500
M&O Revenue - - - 332,420 - 302,500 - - - -
AWC Retro Refund - - 20,239 20,239 - - - - - -
Insurance Recoveries - 3rd Party - - - 50,000 - - - - - -
Total Revenues -$ -$ 958,989$ 1,341,409$ 778,980$ 1,081,480$ 967,500$ 968,500$ 969,500$ 970,500$
EXPENDITURES:
Safety Program - - 4,980 4,980 4,980 4,980 5,000 5,000 5,000 5,000
AWC Retro Program - - 44,239 44,239 24,000 24,000 25,000 26,000 27,000 28,000
WCIA Assessment - - 824,770 824,770 750,000 750,000 750,000 750,000 750,000 750,000
WCIA - Asessment Increase - - - 10,500 - 187,500 187,500 187,500 187,500 187,500
WCIA - Potential Deductibles Prior Years' Claims - - - 115,000 - 115,000 - - - -
Claims/Judgments & Settlements - - 85,000 85,000 - - - - - -
Claims/Judgments & Settlements-Public Disclosure-Koenig Case - - - 206,920 - - - - - -
Claims Expense - 3rd Party - - - 50,000 - - - - - -
Total Expenditures -$ -$ 958,989$ 1,341,409$ 778,980$ 1,081,480$ 967,500$ 968,500$ 969,500$ 970,500$
Beginning Fund Balance: -$ -$ -$ -$ -$ -$ -$ -$ -$ -$
Ending Fund Balance: -$ -$ -$ -$ -$ -$ -$ -$ -$ -$
73
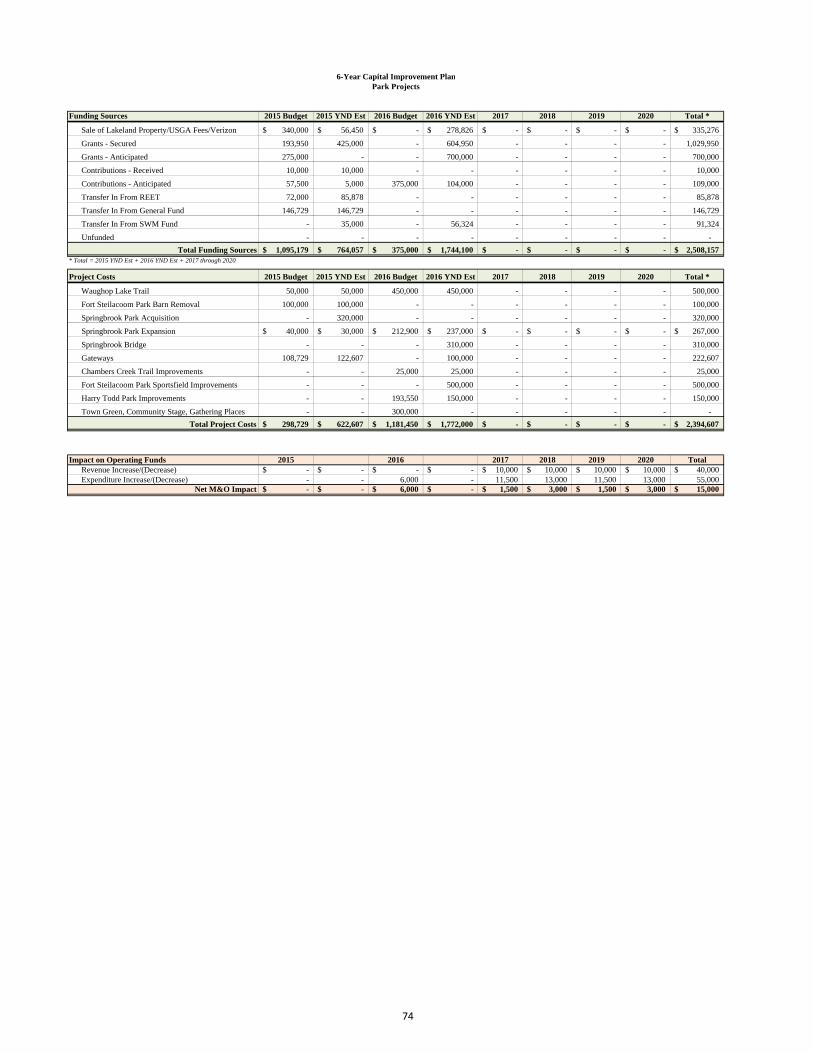
6-Year Capital Improvement PlanPark Projects
Funding Sources 2015 Budget 2015 YND Est 2016 Budget 2016 YND Est 2017 2018 2019 2020 Total *
Sale of Lakeland Property/USGA Fees/Verizon 340,000$ 56,450$ -$ 278,826$ -$ -$ -$ -$ 335,276$
Grants - Secured 193,950 425,000 - 604,950 - - - - 1,029,950
Grants - Anticipated 275,000 - - 700,000 - - - - 700,000
Contributions - Received 10,000 10,000 - - - - - - 10,000
Contributions - Anticipated 57,500 5,000 375,000 104,000 - - - - 109,000
Transfer In From REET 72,000 85,878 - - - - - - 85,878
Transfer In From General Fund 146,729 146,729 - - - - - - 146,729
Transfer In From SWM Fund - 35,000 - 56,324 - - - - 91,324
Unfunded - - - - - - - - -
Total Funding Sources 1,095,179$ 764,057$ 375,000$ 1,744,100$ -$ -$ -$ -$ 2,508,157$ * Total = 2015 YND Est + 2016 YND Est + 2017 through 2020
Project Costs 2015 Budget 2015 YND Est 2016 Budget 2016 YND Est 2017 2018 2019 2020 Total *
Waughop Lake Trail 50,000 50,000 450,000 450,000 - - - - 500,000
Fort Steilacoom Park Barn Removal 100,000 100,000 - - - - - - 100,000
Springbrook Park Acquisition - 320,000 - - - - - - 320,000
Springbrook Park Expansion 40,000$ 30,000$ 212,900$ 237,000$ -$ -$ -$ -$ 267,000$
Springbrook Bridge - - - 310,000 - - - - 310,000
Gateways 108,729 122,607 - 100,000 - - - - 222,607
Chambers Creek Trail Improvements - - 25,000 25,000 - - - - 25,000
Fort Steilacoom Park Sportsfield Improvements - - - 500,000 - - - - 500,000
Harry Todd Park Improvements - - 193,550 150,000 - - - - 150,000
Town Green, Community Stage, Gathering Places - - 300,000 - - - - - -
Total Project Costs 298,729$ 622,607$ 1,181,450$ 1,772,000$ -$ -$ -$ -$ 2,394,607$
Impact on Operating Funds 2015 2016 2017 2018 2019 2020 TotalRevenue Increase/(Decrease) -$ -$ -$ -$ 10,000$ 10,000$ 10,000$ 10,000$ 40,000$ Expenditure Increase/(Decrease) - - 6,000 - 11,500 13,000 11,500 13,000 55,000
Net M&O Impact -$ -$ 6,000$ -$ 1,500$ 3,000$ 1,500$ 3,000$ 15,000$
74

6-Year Capital Improvement PlanPark Projects
Project Number:Project Name: Waughop Lake Trail
Project Account: 301.0002.11
Council Priority:Planning Area: 5
Project Description & Justification:
Operational Impact:
Funding Sources 2015 Budget 2015 YND Est 2016 Budget 2016 YND Est 2017 2018 2019 2020 Total *Sale of Lakeland Property/USGA Fees 100,000$ 35,000$ -$ 15,000$ -$ -$ -$ -$ 50,000$ Grants - Secured - - - 250,000 - - - - 250,000 Grants - Anticipated 275,000 - - 100,000 - - - - 100,000 Mitigation Fees - Received - - - - - - - - - Mitigation Fees - Anticipated - - - - - - - - - Contributions - Received - - - - - - - - - Contributions - Anticipated 50,000 - 75,000 100,000 - - - - 100,000 Transfer In From General Fund - - - - - - - - - Transfer In From SWM Fund - - - - - - - - Unfunded - - - - - - - -
Total Funding Sources 425,000$ 35,000$ 75,000$ 465,000$ -$ -$ -$ -$ 500,000$ * Total = 2015 YND Est + 2016 YND Est + 2017 through 2020
Project Costs 2015 Budget 2015 YND Est 2016 Budget 2016 YND Est 2017 2018 2019 2020 Total *Property Acquisition -$ -$ -$ -$ -$ -$ -$ -$ -$ A & E / permitting Consultant Services 50,000 50,000 25,000 25,000 - - - - 75,000 Construction - - 425,000 425,000 - - - - 425,000 Inspection - - - - - - - - - Project Management - - - - - - - - - Permitting - - - - - - - - - Contingency - - - - - - - - -
Total Project Costs 50,000$ 50,000$ 450,000$ 450,000$ -$ -$ -$ -$ 500,000$
Impact on Operating Funds 2015 2016 2017 2018 2019 2020 Total *Revenue Increase/(Decrease) -$ -$ -$ -$ -$ -$ -$ Expenditure Increase/(Decrease) - 1,000 1,000 1,000 1,000 1,000 5,000
Net M&O Impact -$ 1,000$ 1,000$ 1,000$ 1,000$ 1,000$ 5,000$
The renovation of the trail around Waughop Lake at Fort Steilacoom Park. Approximately 950,000 people visit the park each year for active and passive recreation opportunities. Visitors from every demographic category walk, run or bike on the paved path around the lake. The lake trail, that was an actual road until it was closed in the 70's, is a link to cross country courses, 5 K races and walk-a-thon events. Families visit and picnic near the lake and others use the lake for model boat racing and fishing. Improving the lake trail and surrounding area is the highest priority development project in the City's 20 year strategic plan and improving the lake trail is the number one project in our six-year Capital Improvement Plan. Improvements would include creating a mile long asphalt perimeter path around the lake, drainage, benches, picnic shelter and other site amenities, interpretive signage, ADA parking and habitat enhancements (remove dead and invasive vegetation, add grass and native vegetation). It supports goals # 1, 4, 5 and 6 in our Legacy Plan
The improvements should not greatly impact current operations since this is a repair and maintenance project. Adding picnic shelters and other site amenities will impact current operations.
75

6-Year Capital Improvement PlanPark Projects
Project Number: Fort Steilacoom Park Barn RemovalProject Name:
Project Account: 301.xxxx.11
Project Description & Justification:
Operational Impact:
Funding Sources 2015 Budget 2015 YND Est 2016 Budget 2016 YND Est 2017 2018 2019 2020 Total *Sale of Lakeland Property/USGA Fees -$ -$ -$ -$ -$ -$ -$ -$ -$ Grants - Secured - - - - - - - - - Grants - Anticipated - - - - - - - - - Mitigation Fees - Received - - - - - - - - - Mitigation Fees - Anticipated - - - - - - - - - Contributions - Received - - - - - - - - - Contributions - Anticipated - - - - - - - - - Transfer In From REET 72,000 72,000 - - - - - - 72,000 Transfer In From General Fund 28,000 28,000 - - - - - - 28,000 Transfer In From SWM Fund - - - - - - - - - Unfunded - - - - - - - - -
Total Funding Sources 100,000$ 100,000$ -$ -$ -$ -$ -$ -$ 100,000$ * Total = 2015 YND Est + 2016 YND Est + 2017 through 2020
Project Costs 2015 Budget 2015 YND Est 2016 Budget 2016 YND Est 2017 2018 2019 2020 Total *Property Acquisition -$ -$ -$ -$ -$ -$ -$ -$ -$ Consultant Services 10,000 10,000 - - - - - - 10,000 Construction 90,000 90,000 - - - - - 90,000 Inspection - - - - - - - - - Project Management - - - - - - - - - Equipment Acquisition - - - - - - - - - Contingency - - - - - - - - -
Total Project Costs 100,000$ 100,000$ -$ -$ -$ -$ -$ -$ 100,000$
Impact on Operating Funds 2015 2016 2017 2018 2019 2020 Total *Revenue Increase/(Decrease) -$ -$ -$ -$ -$ -$ -$ Expenditure Increase/(Decrease) - - - - - - -
Net M&O Impact -$ -$ -$ -$ -$ -$ -$
Fort Steilacoom Park, a 350 acre site, is owned by the State of Washington and leased by the City of Lakewood for public education and recreation purposes. In February, 2014, following a snow storm and during an overnight windstorm, an empty barn at the park collapsed. City appropriated funds to test and remove the construction debris. Testing showed high levels of lead (over four times the allowable amount) so the material is now considered to be hazardous waste.
76
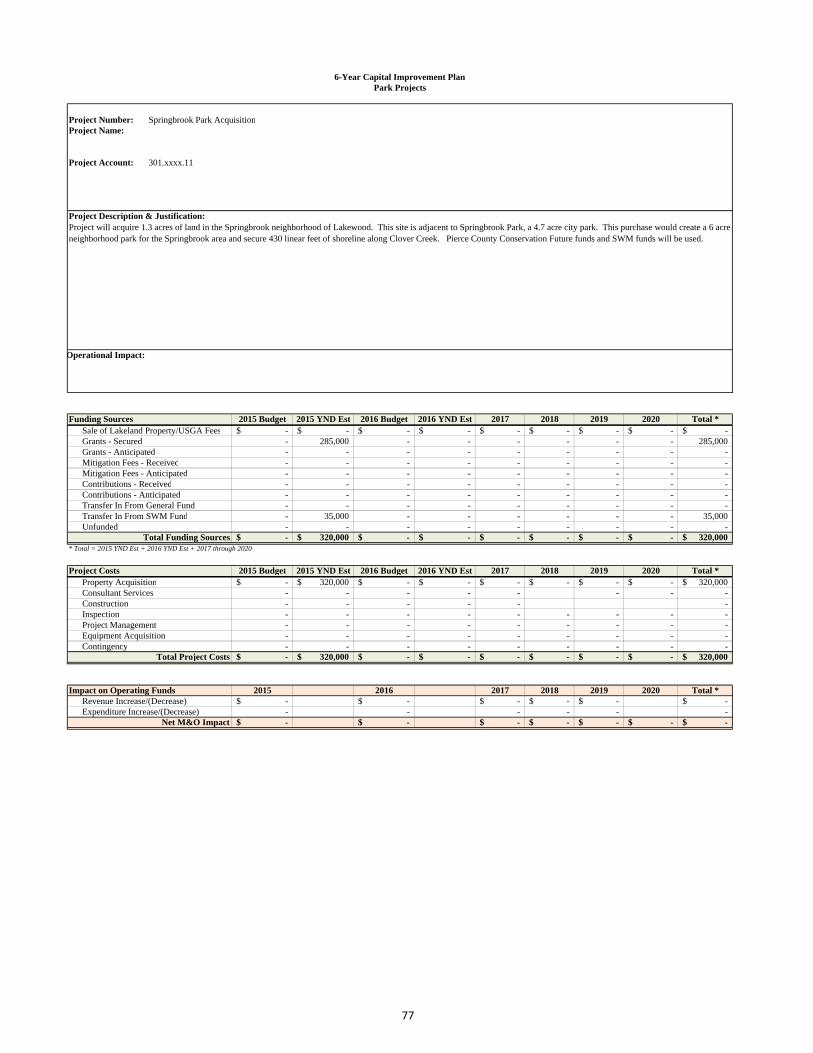
6-Year Capital Improvement PlanPark Projects
Project Number: Springbrook Park AcquisitionProject Name:
Project Account: 301.xxxx.11
Council Priority:Planning Area:
Project Description & Justification:
Operational Impact:
Funding Sources 2015 Budget 2015 YND Est 2016 Budget 2016 YND Est 2017 2018 2019 2020 Total *Sale of Lakeland Property/USGA Fees -$ -$ -$ -$ -$ -$ -$ -$ -$ Grants - Secured - 285,000 - - - - - - 285,000 Grants - Anticipated - - - - - - - - - Mitigation Fees - Received - - - - - - - - - Mitigation Fees - Anticipated - - - - - - - - - Contributions - Received - - - - - - - - - Contributions - Anticipated - - - - - - - - - Transfer In From General Fund - - - - - - - - - Transfer In From SWM Fund - 35,000 - - - - - - 35,000 Unfunded - - - - - - - - -
Total Funding Sources -$ 320,000$ -$ -$ -$ -$ -$ -$ 320,000$ * Total = 2015 YND Est + 2016 YND Est + 2017 through 2020
Project Costs 2015 Budget 2015 YND Est 2016 Budget 2016 YND Est 2017 2018 2019 2020 Total *Property Acquisition -$ 320,000$ -$ -$ -$ -$ -$ -$ 320,000$ Consultant Services - - - - - - - - Construction - - - - - - Inspection - - - - - - - - - Project Management - - - - - - - - - Equipment Acquisition - - - - - - - - - Contingency - - - - - - - - -
Total Project Costs -$ 320,000$ -$ -$ -$ -$ -$ -$ 320,000$
Impact on Operating Funds 2015 2016 2017 2018 2019 2020 Total *Revenue Increase/(Decrease) -$ -$ -$ -$ -$ -$ Expenditure Increase/(Decrease) - - - - - -
Net M&O Impact -$ -$ -$ -$ -$ -$ -$
Project will acquire 1.3 acres of land in the Springbrook neighborhood of Lakewood. This site is adjacent to Springbrook Park, a 4.7 acre city park. This purchase would create a 6 acre neighborhood park for the Springbrook area and secure 430 linear feet of shoreline along Clover Creek. Pierce County Conservation Future funds and SWM funds will be used.
77

6-Year Capital Improvement PlanPark Projects
Project Number:Project Name: Springbrook Park
Project Account: 301.0001.11
Planning Area:
Project Description & Justification:
Operational Impact:
Funding Sources 2015 Budget 2015 YND Est 2016 Budget 2016 YND Est 2017 2018 2019 2020 Total *Sale of Lakeland Prop/USGA Fees/Other 21,450$ 21,450$ -$ 276$ -$ -$ -$ -$ 21,726$ Grants - Secured 193,950 130,000 - 63,950 - - - - 193,950 Grants - Anticipated - - - - - - - - Mitigation Fees - Received - - - - - - - - - Mitigation Fees - Anticipated - - - - - - - - - Contributions - Received - - - - - - - - Contributions - Anticipated 7,500 5,000 - 4,000 - - - - 9,000 Transfer In From REET - - - - - - - - - Transfer In From General Fund 30,000 30,000 - - - - - - 30,000 Transfer In From SWM Fund - - - 12,324 - - - - 12,324 Unfunded - - - - - - - - -
Total Funding Sources 252,900$ 186,450$ -$ 80,550$ -$ -$ -$ -$ 267,000$ * Total = 2015 YND Est + 2016 YND Est + 2017 through 2020
Project Costs 2015 Budget 2015 YND Est 2016 Budget 2016 YND Est 2017 2018 2019 2020 Total *Property Acquisition -$ -$ -$ -$ -$ -$ -$ -$ -$ Consultant Services 10,000 10,000 - - - - - - 10,000 Construction 30,000 20,000 202,900 227,000 - - - - 247,000 Inspection - - - - - - - - - Project Management - - 10,000 10,000 - - - - 10,000 Equipment Acquisition - - - - - - - - - Contingency - - - - - - - - -
Total Project Costs 40,000$ 30,000$ 212,900$ 237,000$ -$ -$ -$ -$ 267,000$
Impact on Operating Funds 2015 2016 2017 2018 2019 2020 Total *Revenue Increase/(Decrease) -$ -$ -$ -$ -$ -$ -$ Expenditure Increase/(Decrease) - 5,000 10,500 10,500 10,500 10,500 47,000
Net M&O Impact -$ 5,000$ 10,500$ 10,500$ 10,500$ 10,500$ 47,000$
This development project which includes purchase of 1.2 acres of land which is adjacent to Springbrook Park. This land is the missing link between two City properties and will allow future access to the property across Clover Creek. The land is fenced off from the park site and has a house and detached garage which will be removed. Site improvements would include removal of old structures and fencing and we would add pathways around the property and connect to park trials, interpretive signage, new all abilities play equipment, family picnic area, site amenities, a community garden and open space areas. Springbrook is one of the most economically challenged areas and is primarily rental property with high transiency. Community engagement and involvement are the necessary first steps for the residents to feel ownership of their neighborhood and to improve conditions in Springbrook. It supports goals # 1, 2 5 and 6 in our Legacy Plan. The City will receive credit for the $135,000 purchase and $30,000 of the project costs (demo) was included in 2015 budget
After improvements are made, it will take more time to maintain this site and support a community garden. Hopefully vandalism in this area will decrease.
78
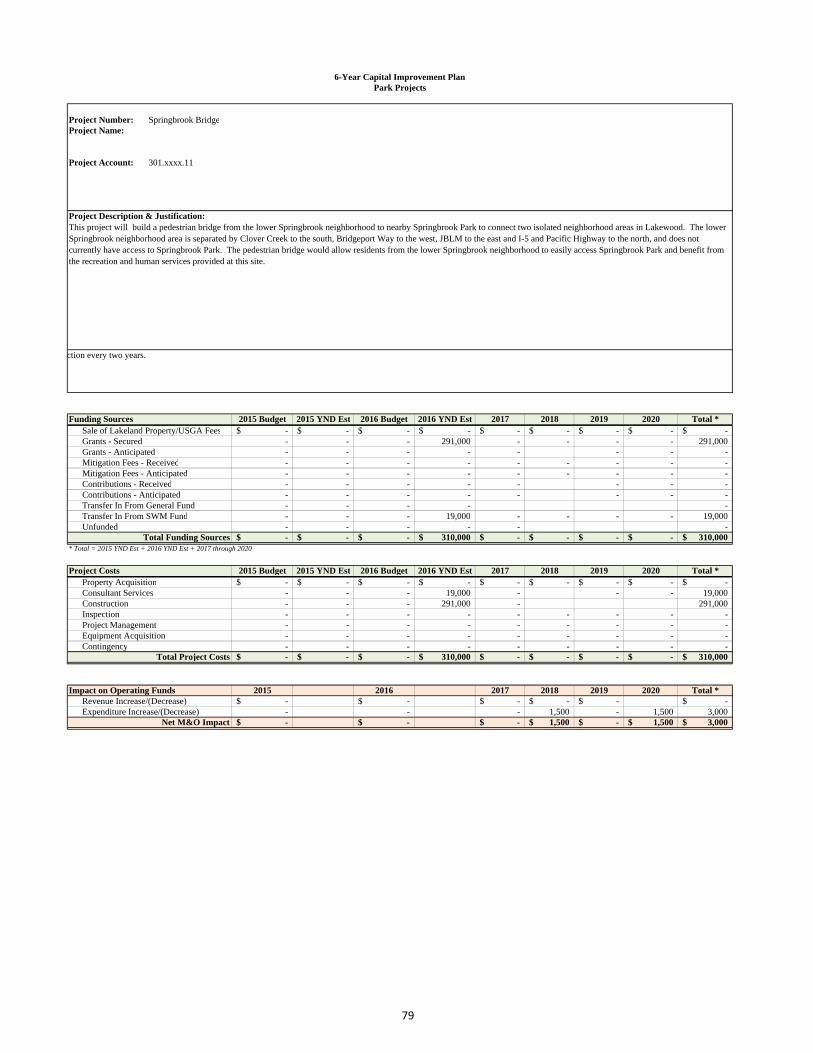
6-Year Capital Improvement PlanPark Projects
Project Number: Springbrook BridgeProject Name:
Project Account: 301.xxxx.11
Council Priority:Planning Area:
Project Description & Justification:
ction every two years.
Funding Sources 2015 Budget 2015 YND Est 2016 Budget 2016 YND Est 2017 2018 2019 2020 Total *Sale of Lakeland Property/USGA Fees -$ -$ -$ -$ -$ -$ -$ -$ -$ Grants - Secured - - - 291,000 - - - - 291,000 Grants - Anticipated - - - - - - - - Mitigation Fees - Received - - - - - - - - - Mitigation Fees - Anticipated - - - - - - - - - Contributions - Received - - - - - - - - Contributions - Anticipated - - - - - - - - Transfer In From General Fund - - - - - Transfer In From SWM Fund - - - 19,000 - - - - 19,000 Unfunded - - - - - -
Total Funding Sources -$ -$ -$ 310,000$ -$ -$ -$ -$ 310,000$ * Total = 2015 YND Est + 2016 YND Est + 2017 through 2020
Project Costs 2015 Budget 2015 YND Est 2016 Budget 2016 YND Est 2017 2018 2019 2020 Total *Property Acquisition -$ -$ -$ -$ -$ -$ -$ -$ -$ Consultant Services - - - 19,000 - - - 19,000 Construction - - - 291,000 - 291,000 Inspection - - - - - - - - - Project Management - - - - - - - - - Equipment Acquisition - - - - - - - - - Contingency - - - - - - - - -
Total Project Costs -$ -$ -$ 310,000$ -$ -$ -$ -$ 310,000$
Impact on Operating Funds 2015 2016 2017 2018 2019 2020 Total *Revenue Increase/(Decrease) -$ -$ -$ -$ -$ -$ Expenditure Increase/(Decrease) - - - 1,500 - 1,500 3,000
Net M&O Impact -$ -$ -$ 1,500$ -$ 1,500$ 3,000$
This project will build a pedestrian bridge from the lower Springbrook neighborhood to nearby Springbrook Park to connect two isolated neighborhood areas in Lakewood. The lower Springbrook neighborhood area is separated by Clover Creek to the south, Bridgeport Way to the west, JBLM to the east and I-5 and Pacific Highway to the north, and does not currently have access to Springbrook Park. The pedestrian bridge would allow residents from the lower Springbrook neighborhood to easily access Springbrook Park and benefit from the recreation and human services provided at this site.
79

6-Year Capital Improvement PlanPark Projects
Project Number: Gateways Project Name:
Project Account: 301.xxxx.11
Council Priority:Planning Area:
Project Description & Justification:
Operational Impact: To be determined
Funding Sources 2015 Budget 2015 YND Est 2016 Budget 2016 YND Est 2017 2018 2019 2020 Total *Sale of Lakeland Property/USGA Fees -$ -$ -$ -$ -$ -$ -$ -$ Grants - Secured 10,000 10,000 - - - - - - 10,000 Grants - Anticipated - - - 100,000 - - - - 100,000 Mitigation Fees - Received - - - - - - - - - Mitigation Fees - Anticipated - - - - - - - - - Contributions - Received 10,000 10,000 - - - - - - 10,000 Contributions - Anticipated - - - - - - - - - Transfer In From REET - 13,878 - - 13,878 Transfer In From General Fund 88,729 88,729 - - 88,729 Transfer In From SWM Fund - - - - - - - - - Unfunded - - - - -
Total Funding Sources 108,729$ 122,607$ -$ 100,000$ -$ -$ -$ -$ 222,607$ * Total = 2015 YND Est + 2016 YND Est + 2017 through 2020
Project Costs 2015 Budget 2015 YND Est 2016 Budget 2016 YND Est 2017 2018 2019 2020 Total *Property Acquisition -$ -$ -$ -$ -$ -$ -$ -$ -$ Consultant Services - - - - - - - - Construction 108,729 122,607 - 100,000 - - - - 222,607 Inspection - - - - - - - - - Project Management - - - - - - - - - Equipment Acquisition - - - - - - - - - Contingency - - - - - - - - -
Total Project Costs 108,729$ 122,607$ -$ 100,000$ -$ -$ -$ -$ 222,607$
Impact on Operating Funds 2015 2016 2017 2018 2019 2020 Total *Revenue Increase/(Decrease) -$ -$ -$ Expenditure Increase/(Decrease) - - -
Net M&O Impact -$ -$ -$ -$ -$ -$ -$
We are proposing to continue the work started in 2015 to improve Lakewood Gateways. We plan to improve two or more gateway areas each year. First Impressions matter! There are 14 different ways to access and enter the Lakewood community and each of the access points (gateways) are different and leave a different impact and impression with those who pass by to visit, shop, or play. second (1/10) to form an impression. We may have 3-7 seconds to capture that first impression. Based on the current conditions, Lakewood visitors may be developing a negative impression of our community when they pass by certain areas. A 17 member community planning team developed a gateway vision and preliminary design to be used in various ways at our 14 gateway areas.
80
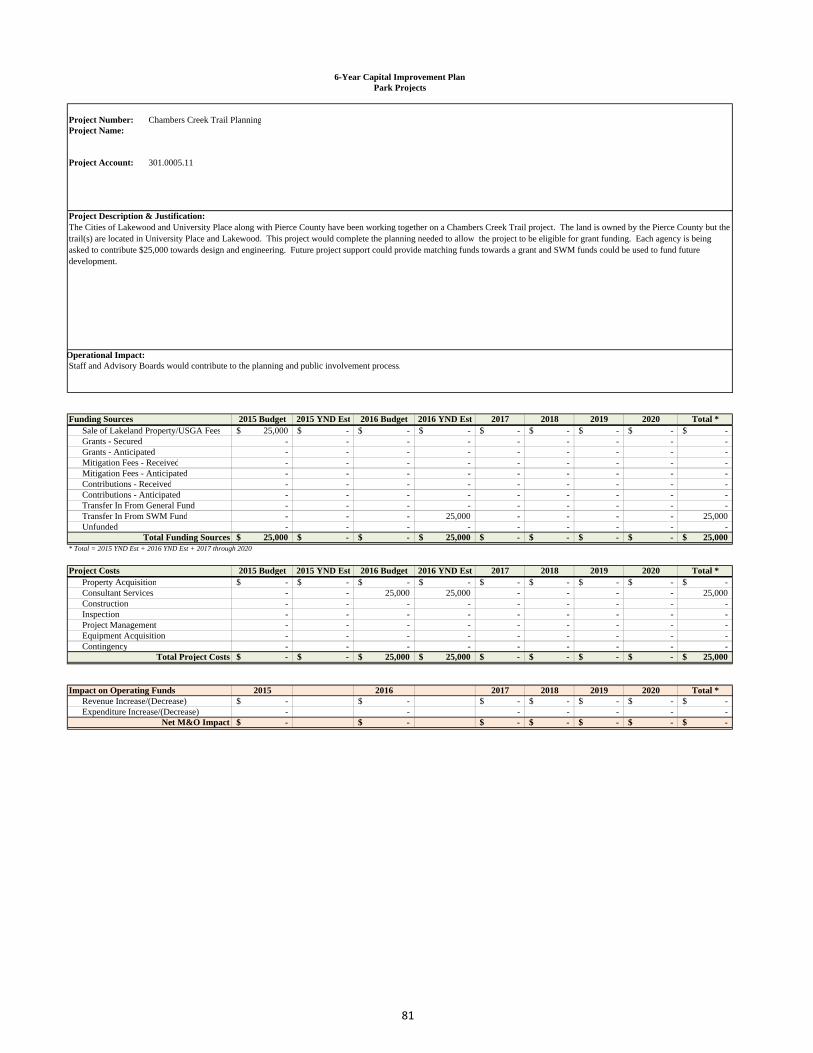
6-Year Capital Improvement PlanPark Projects
Project Number: Chambers Creek Trail PlanningProject Name:
Project Account: 301.0005.11
Project Description & Justification:
Operational Impact:Staff and Advisory Boards would contribute to the planning and public involvement process.
Funding Sources 2015 Budget 2015 YND Est 2016 Budget 2016 YND Est 2017 2018 2019 2020 Total *Sale of Lakeland Property/USGA Fees 25,000$ -$ -$ -$ -$ -$ -$ -$ -$ Grants - Secured - - - - - - - - - Grants - Anticipated - - - - - - - - - Mitigation Fees - Received - - - - - - - - - Mitigation Fees - Anticipated - - - - - - - - - Contributions - Received - - - - - - - - - Contributions - Anticipated - - - - - - - - - Transfer In From General Fund - - - - - - - - - Transfer In From SWM Fund - - - 25,000 - - - - 25,000 Unfunded - - - - - - - - -
Total Funding Sources 25,000$ -$ -$ 25,000$ -$ -$ -$ -$ 25,000$ * Total = 2015 YND Est + 2016 YND Est + 2017 through 2020
Project Costs 2015 Budget 2015 YND Est 2016 Budget 2016 YND Est 2017 2018 2019 2020 Total *Property Acquisition -$ -$ -$ -$ -$ -$ -$ -$ -$ Consultant Services - - 25,000 25,000 - - - - 25,000 Construction - - - - - - - - - Inspection - - - - - - - - - Project Management - - - - - - - - - Equipment Acquisition - - - - - - - - - Contingency - - - - - - - - -
Total Project Costs -$ -$ 25,000$ 25,000$ -$ -$ -$ -$ 25,000$
Impact on Operating Funds 2015 2016 2017 2018 2019 2020 Total *Revenue Increase/(Decrease) -$ -$ -$ -$ -$ -$ -$ Expenditure Increase/(Decrease) - - - - - - -
Net M&O Impact -$ -$ -$ -$ -$ -$ -$
The Cities of Lakewood and University Place along with Pierce County have been working together on a Chambers Creek Trail project. The land is owned by the Pierce County but the trail(s) are located in University Place and Lakewood. This project would complete the planning needed to allow the project to be eligible for grant funding. Each agency is being asked to contribute $25,000 towards design and engineering. Future project support could provide matching funds towards a grant and SWM funds could be used to fund future development.
81
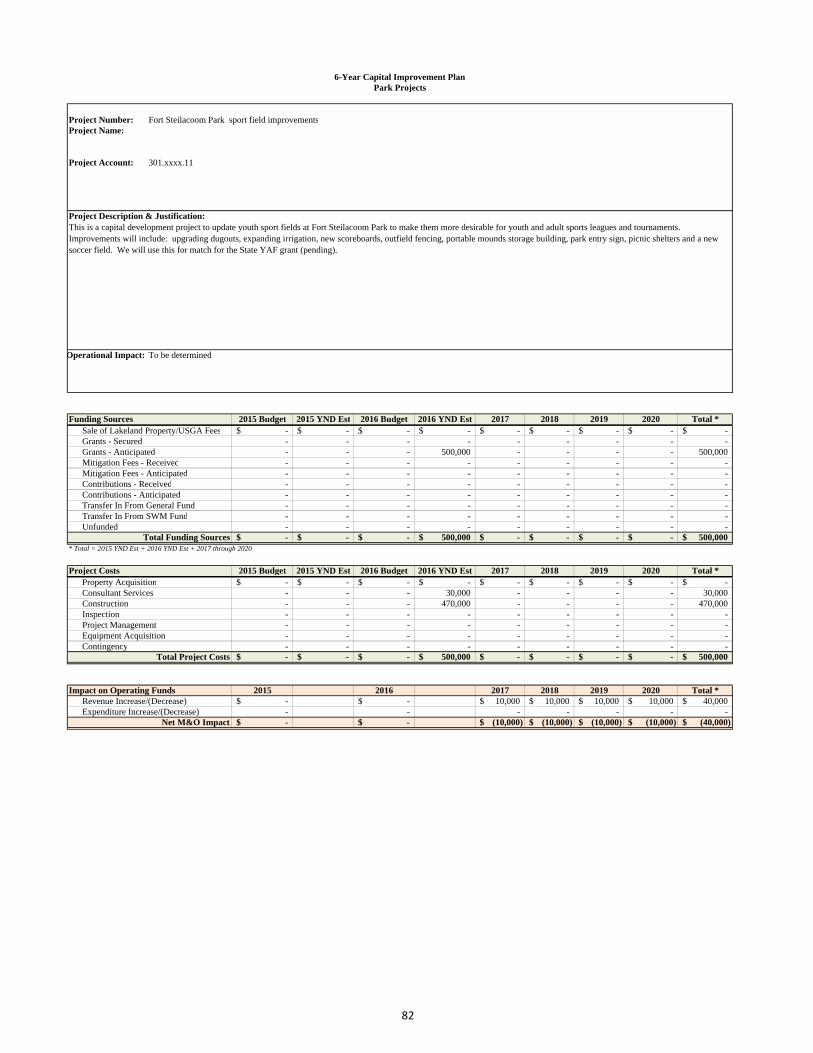
6-Year Capital Improvement PlanPark Projects
Project Number: Fort Steilacoom Park sport field improvementsProject Name:
Project Account: 301.xxxx.11
Council Priority:Planning Area:
Project Description & Justification:
Operational Impact: To be determined
Funding Sources 2015 Budget 2015 YND Est 2016 Budget 2016 YND Est 2017 2018 2019 2020 Total *Sale of Lakeland Property/USGA Fees -$ -$ -$ -$ -$ -$ -$ -$ -$ Grants - Secured - - - - - - - - - Grants - Anticipated - - - 500,000 - - - - 500,000 Mitigation Fees - Received - - - - - - - - - Mitigation Fees - Anticipated - - - - - - - - - Contributions - Received - - - - - - - - - Contributions - Anticipated - - - - - - - - - Transfer In From General Fund - - - - - - - - - Transfer In From SWM Fund - - - - - - - - - Unfunded - - - - - - - - -
Total Funding Sources -$ -$ -$ 500,000$ -$ -$ -$ -$ 500,000$ * Total = 2015 YND Est + 2016 YND Est + 2017 through 2020
Project Costs 2015 Budget 2015 YND Est 2016 Budget 2016 YND Est 2017 2018 2019 2020 Total *Property Acquisition -$ -$ -$ -$ -$ -$ -$ -$ -$ Consultant Services - - - 30,000 - - - - 30,000 Construction - - - 470,000 - - - - 470,000 Inspection - - - - - - - - - Project Management - - - - - - - - - Equipment Acquisition - - - - - - - - - Contingency - - - - - - - - -
Total Project Costs -$ -$ -$ 500,000$ -$ -$ -$ -$ 500,000$
Impact on Operating Funds 2015 2016 2017 2018 2019 2020 Total *Revenue Increase/(Decrease) -$ -$ 10,000$ 10,000$ 10,000$ 10,000$ 40,000$ Expenditure Increase/(Decrease) - - - - - - -
Net M&O Impact -$ -$ (10,000)$ (10,000)$ (10,000)$ (10,000)$ (40,000)$
This is a capital development project to update youth sport fields at Fort Steilacoom Park to make them more desirable for youth and adult sports leagues and tournaments. Improvements will include: upgrading dugouts, expanding irrigation, new scoreboards, outfield fencing, portable mounds storage building, park entry sign, picnic shelters and a new soccer field. We will use this for match for the State YAF grant (pending).
82
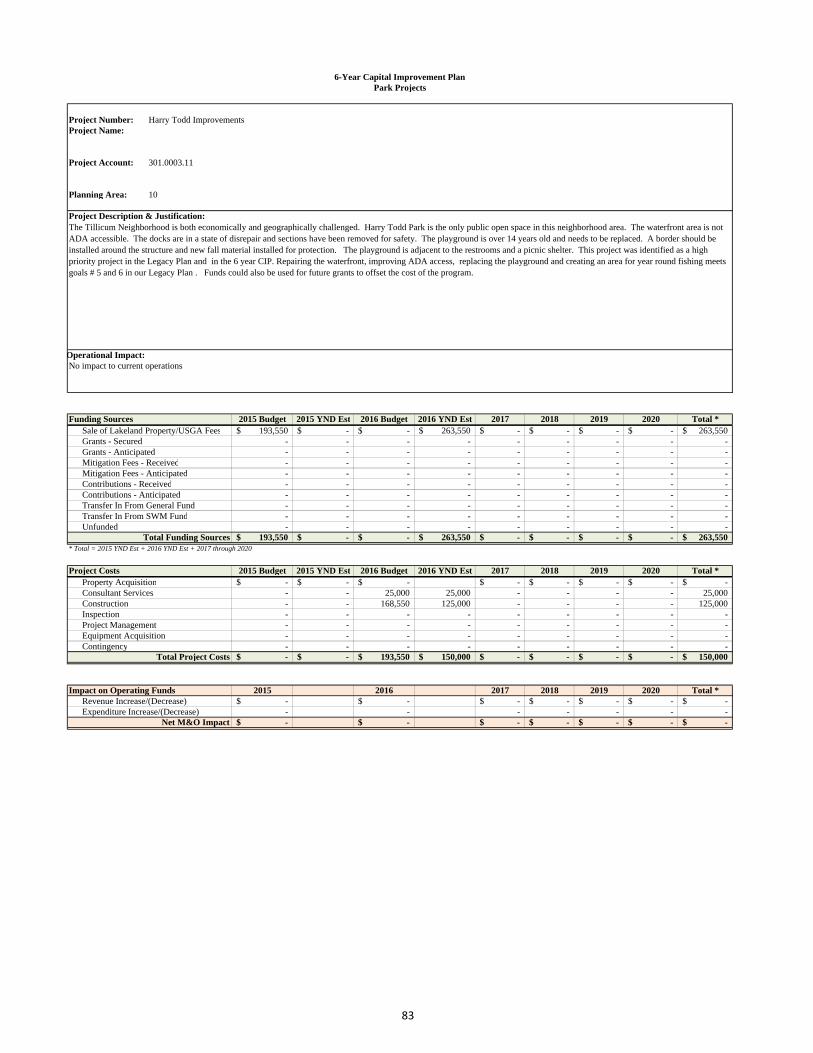
6-Year Capital Improvement PlanPark Projects
Project Number: Harry Todd Improvements Project Name:
Project Account: 301.0003.11
Planning Area: 10
Project Description & Justification:
Operational Impact:No impact to current operations
Funding Sources 2015 Budget 2015 YND Est 2016 Budget 2016 YND Est 2017 2018 2019 2020 Total *Sale of Lakeland Property/USGA Fees 193,550$ -$ -$ 263,550$ -$ -$ -$ -$ 263,550$ Grants - Secured - - - - - - - - - Grants - Anticipated - - - - - - - - - Mitigation Fees - Received - - - - - - - - - Mitigation Fees - Anticipated - - - - - - - - - Contributions - Received - - - - - - - - - Contributions - Anticipated - - - - - - - - - Transfer In From General Fund - - - - - - - - - Transfer In From SWM Fund - - - - - - - - - Unfunded - - - - - - - - -
Total Funding Sources 193,550$ -$ -$ 263,550$ -$ -$ -$ -$ 263,550$ * Total = 2015 YND Est + 2016 YND Est + 2017 through 2020
Project Costs 2015 Budget 2015 YND Est 2016 Budget 2016 YND Est 2017 2018 2019 2020 Total *Property Acquisition -$ -$ -$ -$ -$ -$ -$ -$ Consultant Services - - 25,000 25,000 - - - - 25,000 Construction - - 168,550 125,000 - - - - 125,000 Inspection - - - - - - - - - Project Management - - - - - - - - - Equipment Acquisition - - - - - - - - - Contingency - - - - - - - - -
Total Project Costs -$ -$ 193,550$ 150,000$ -$ -$ -$ -$ 150,000$
Impact on Operating Funds 2015 2016 2017 2018 2019 2020 Total *Revenue Increase/(Decrease) -$ -$ -$ -$ -$ -$ -$ Expenditure Increase/(Decrease) - - - - - - -
Net M&O Impact -$ -$ -$ -$ -$ -$ -$
The Tillicum Neighborhood is both economically and geographically challenged. Harry Todd Park is the only public open space in this neighborhood area. The waterfront area is not ADA accessible. The docks are in a state of disrepair and sections have been removed for safety. The playground is over 14 years old and needs to be replaced. A border should be installed around the structure and new fall material installed for protection. The playground is adjacent to the restrooms and a picnic shelter. This project was identified as a high priority project in the Legacy Plan and in the 6 year CIP. Repairing the waterfront, improving ADA access, replacing the playground and creating an area for year round fishing meets goals # 5 and 6 in our Legacy Plan . Funds could also be used for future grants to offset the cost of the program.
83
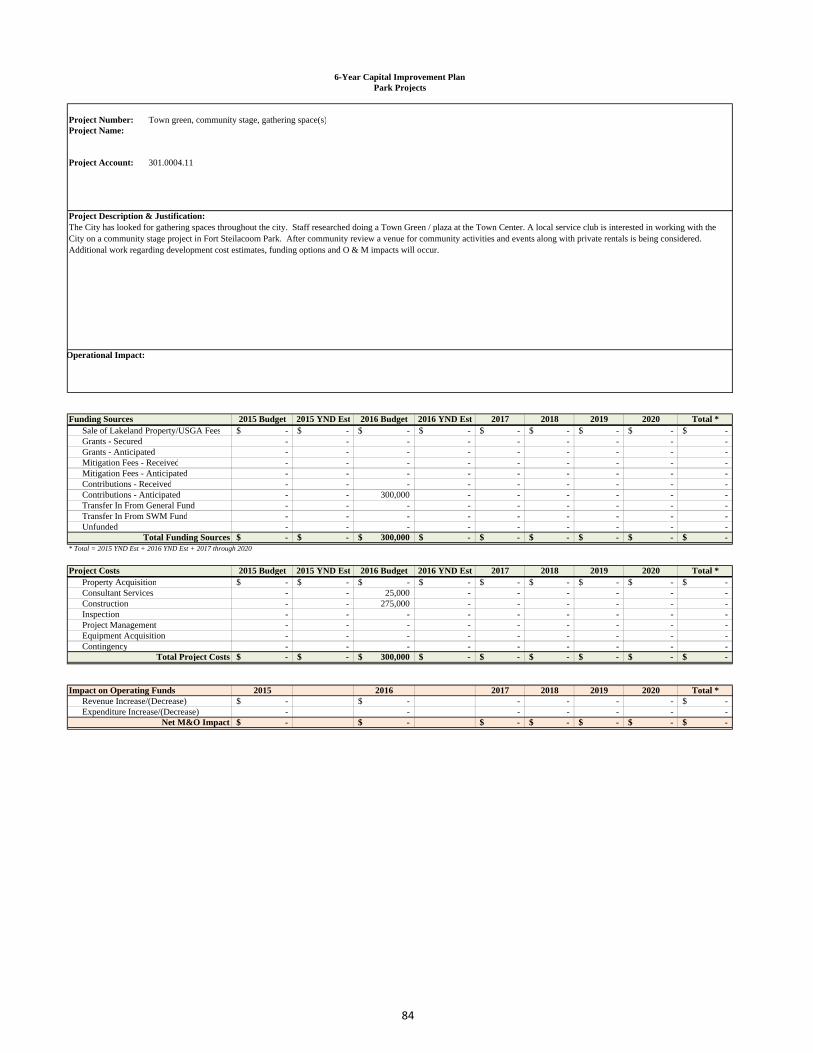
6-Year Capital Improvement PlanPark Projects
Project Number: Town green, community stage, gathering space(s)Project Name:
Project Account: 301.0004.11
Project Description & Justification:
Operational Impact:
Funding Sources 2015 Budget 2015 YND Est 2016 Budget 2016 YND Est 2017 2018 2019 2020 Total *Sale of Lakeland Property/USGA Fees -$ -$ -$ -$ -$ -$ -$ -$ -$ Grants - Secured - - - - - - - - - Grants - Anticipated - - - - - - - - - Mitigation Fees - Received - - - - - - - - - Mitigation Fees - Anticipated - - - - - - - - - Contributions - Received - - - - - - - - - Contributions - Anticipated - - 300,000 - - - - - - Transfer In From General Fund - - - - - - - - - Transfer In From SWM Fund - - - - - - - - - Unfunded - - - - - - - - -
Total Funding Sources -$ -$ 300,000$ -$ -$ -$ -$ -$ -$ * Total = 2015 YND Est + 2016 YND Est + 2017 through 2020
Project Costs 2015 Budget 2015 YND Est 2016 Budget 2016 YND Est 2017 2018 2019 2020 Total *Property Acquisition -$ -$ -$ -$ -$ -$ -$ -$ -$ Consultant Services - - 25,000 - - - - - - Construction - - 275,000 - - - - - - Inspection - - - - - - - - - Project Management - - - - - - - - - Equipment Acquisition - - - - - - - - - Contingency - - - - - - - - -
Total Project Costs -$ -$ 300,000$ -$ -$ -$ -$ -$ -$
Impact on Operating Funds 2015 2016 2017 2018 2019 2020 Total *Revenue Increase/(Decrease) -$ -$ - - - - -$ Expenditure Increase/(Decrease) - - - - - - -
Net M&O Impact -$ -$ -$ -$ -$ -$ -$
The City has looked for gathering spaces throughout the city. Staff researched doing a Town Green / plaza at the Town Center. A local service club is interested in working with the City on a community stage project in Fort Steilacoom Park. After community review a venue for community activities and events along with private rentals is being considered. Additional work regarding development cost estimates, funding options and O & M impacts will occur.
84
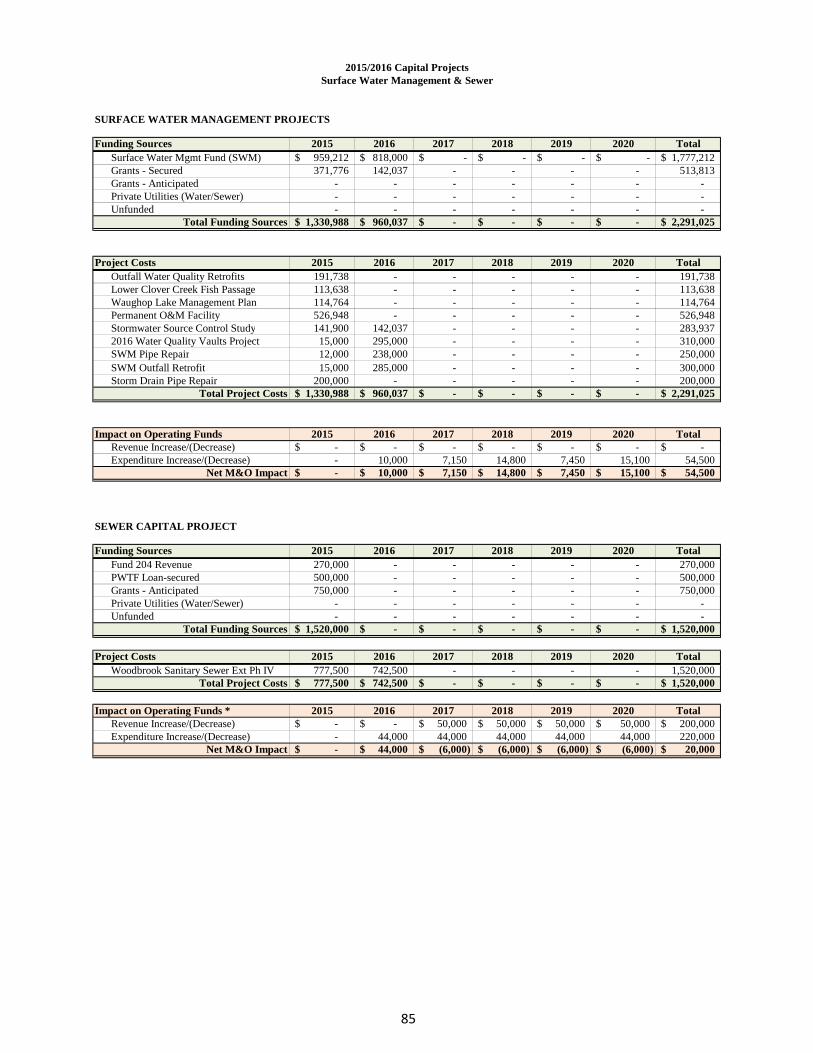
2015/2016 Capital ProjectsSurface Water Management & Sewer
SURFACE WATER MANAGEMENT PROJECTS
Funding Sources 2015 2016 2017 2018 2019 2020 TotalSurface Water Mgmt Fund (SWM) 959,212$ 818,000$ -$ -$ -$ -$ 1,777,212$ Grants - Secured 371,776 142,037 - - - - 513,813 Grants - Anticipated - - - - - - - Private Utilities (Water/Sewer) - - - - - - - Unfunded - - - - - - -
Total Funding Sources 1,330,988$ 960,037$ -$ -$ -$ -$ 2,291,025$
Project Costs 2015 2016 2017 2018 2019 2020 TotalOutfall Water Quality Retrofits 191,738 - - - - - 191,738 Lower Clover Creek Fish Passage 113,638 - - - - - 113,638 Waughop Lake Management Plan 114,764 - - - - - 114,764 Permanent O&M Facility 526,948 - - - - - 526,948 Stormwater Source Control Study 141,900 142,037 - - - - 283,937 2016 Water Quality Vaults Project 15,000 295,000 - - - - 310,000 SWM Pipe Repair 12,000 238,000 - - - - 250,000 SWM Outfall Retrofit 15,000 285,000 - - - - 300,000 Storm Drain Pipe Repair 200,000 - - - - - 200,000
Total Project Costs 1,330,988$ 960,037$ -$ -$ -$ -$ 2,291,025$
Impact on Operating Funds 2015 2016 2017 2018 2019 2020 TotalRevenue Increase/(Decrease) -$ -$ -$ -$ -$ -$ -$ Expenditure Increase/(Decrease) - 10,000 7,150 14,800 7,450 15,100 54,500
Net M&O Impact -$ 10,000$ 7,150$ 14,800$ 7,450$ 15,100$ 54,500$
SEWER CAPITAL PROJECT
Funding Sources 2015 2016 2017 2018 2019 2020 TotalFund 204 Revenue 270,000 - - - - - 270,000 PWTF Loan-secured 500,000 - - - - - 500,000 Grants - Anticipated 750,000 - - - - - 750,000 Private Utilities (Water/Sewer) - - - - - - - Unfunded - - - - - - -
Total Funding Sources 1,520,000$ -$ -$ -$ -$ -$ 1,520,000$
Project Costs 2015 2016 2017 2018 2019 2020 TotalWoodbrook Sanitary Sewer Ext Ph IV 777,500 742,500 - - - - 1,520,000
Total Project Costs 777,500$ 742,500$ -$ -$ -$ -$ 1,520,000$
Impact on Operating Funds * 2015 2016 2017 2018 2019 2020 TotalRevenue Increase/(Decrease) -$ -$ 50,000$ 50,000$ 50,000$ 50,000$ 200,000$ Expenditure Increase/(Decrease) - 44,000 44,000 44,000 44,000 44,000 220,000
Net M&O Impact -$ 44,000$ (6,000)$ (6,000)$ (6,000)$ (6,000)$ 20,000$
85

2015/2016 Capital ProjectsSurface Water Management
Project Account #: 401.0001Project Name: Outfall Water Quality Retrofits
Eden Account #: 401.0001.41
Council Priority:Planning Area:
Project Description & Justification:
Operational Impact:The impact will be the new vaults will need inspected annually and cleaned as needed. Some of the vaults are new. Others are replacing existing catch basins. There will be an overall increase in operational costs as estimated below since there are additional structures and larger replacement structures that will need inspection and cleaning.
Funding Sources 2015 2016 2017 2018 2019 2020 TotalSurface Water Mgmt Fund (SWM) 47,935$ -$ -$ -$ -$ -$ 47,935$ Grants - Secured 143,803 - - - - - 143,803 Grants - Anticipated - - - - - - - Private Utilities (Water/Sewer) - - - - - - - Unfunded - - - - - - -
Total Funding Sources 191,738$ -$ -$ -$ -$ -$ 191,738$
Project Costs 2015 2016 2017 2018 2019 2020 TotalDesign & Construction Mgmt. 8,500 - - - - - 8,500 Construction 183,238 - - - - - 183,238
Total Project Costs 191,738$ -$ -$ -$ -$ -$ 191,738$
Impact on Operating Funds 2015 2016 2017 2018 2019 2020 TotalRevenue Increase/(Decrease) -$ -$ -$ -$ -$ -$ -$ Expenditure Increase/(Decrease) - 5,000 1,500 5,000 1,500 5,000 18,000
Net M&O Impact -$ 5,000$ 1,500$ 5,000$ 1,500$ 5,000$ 18,000$
This project will retrofit several stormwater outfalls that currently discharge untreated stormwater into various creeks and lakes in Lakewood. Depending on the location, the project will install water quality treatment structures upstream of outfalls; or remove outfalls; or reduce the amount of runoff reaching outfalls; or combinations of the above.
86
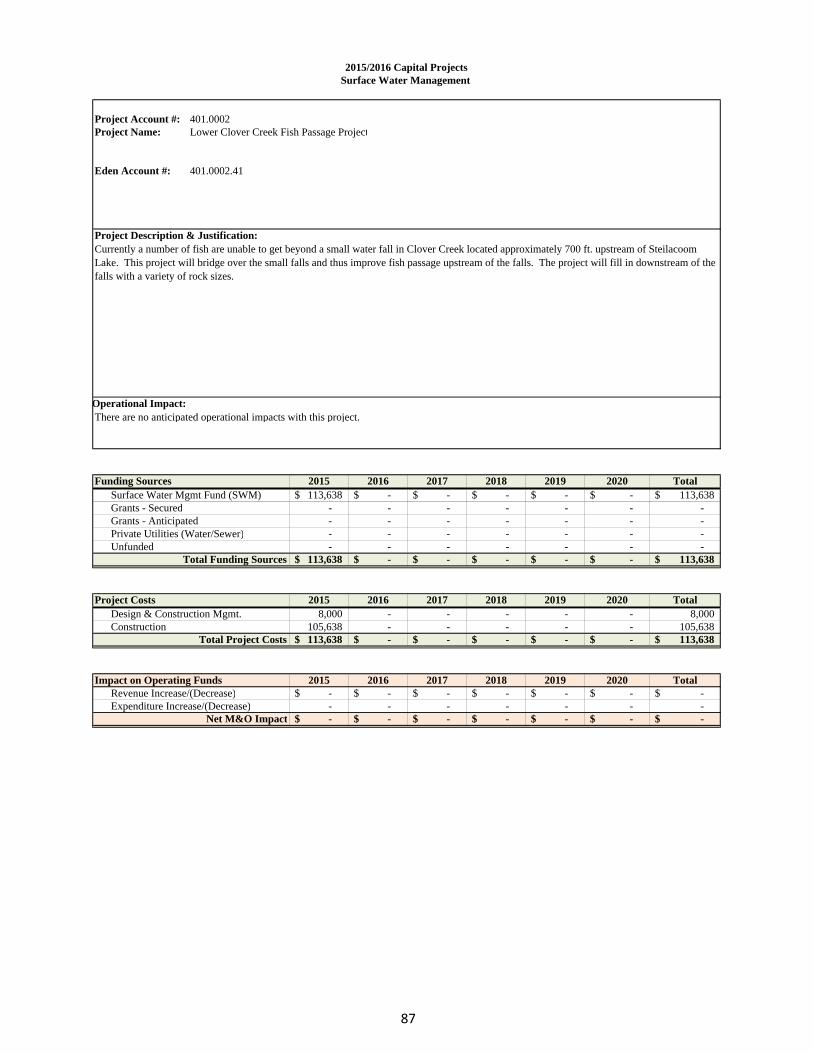
2015/2016 Capital ProjectsSurface Water Management
Project Account #: 401.0002Project Name: Lower Clover Creek Fish Passage Project
Eden Account #: 401.0002.41
Council Priority:Planning Area:
Project Description & Justification:
Operational Impact:There are no anticipated operational impacts with this project.
Funding Sources 2015 2016 2017 2018 2019 2020 TotalSurface Water Mgmt Fund (SWM) 113,638$ -$ -$ -$ -$ -$ 113,638$ Grants - Secured - - - - - - - Grants - Anticipated - - - - - - - Private Utilities (Water/Sewer) - - - - - - - Unfunded - - - - - - -
Total Funding Sources 113,638$ -$ -$ -$ -$ -$ 113,638$
Project Costs 2015 2016 2017 2018 2019 2020 TotalDesign & Construction Mgmt. 8,000 - - - - - 8,000 Construction 105,638 - - - - - 105,638
Total Project Costs 113,638$ -$ -$ -$ -$ -$ 113,638$
Impact on Operating Funds 2015 2016 2017 2018 2019 2020 TotalRevenue Increase/(Decrease) -$ -$ -$ -$ -$ -$ -$ Expenditure Increase/(Decrease) - - - - - - -
Net M&O Impact -$ -$ -$ -$ -$ -$ -$
Currently a number of fish are unable to get beyond a small water fall in Clover Creek located approximately 700 ft. upstream of Steilacoom Lake. This project will bridge over the small falls and thus improve fish passage upstream of the falls. The project will fill in downstream of the falls with a variety of rock sizes.
87
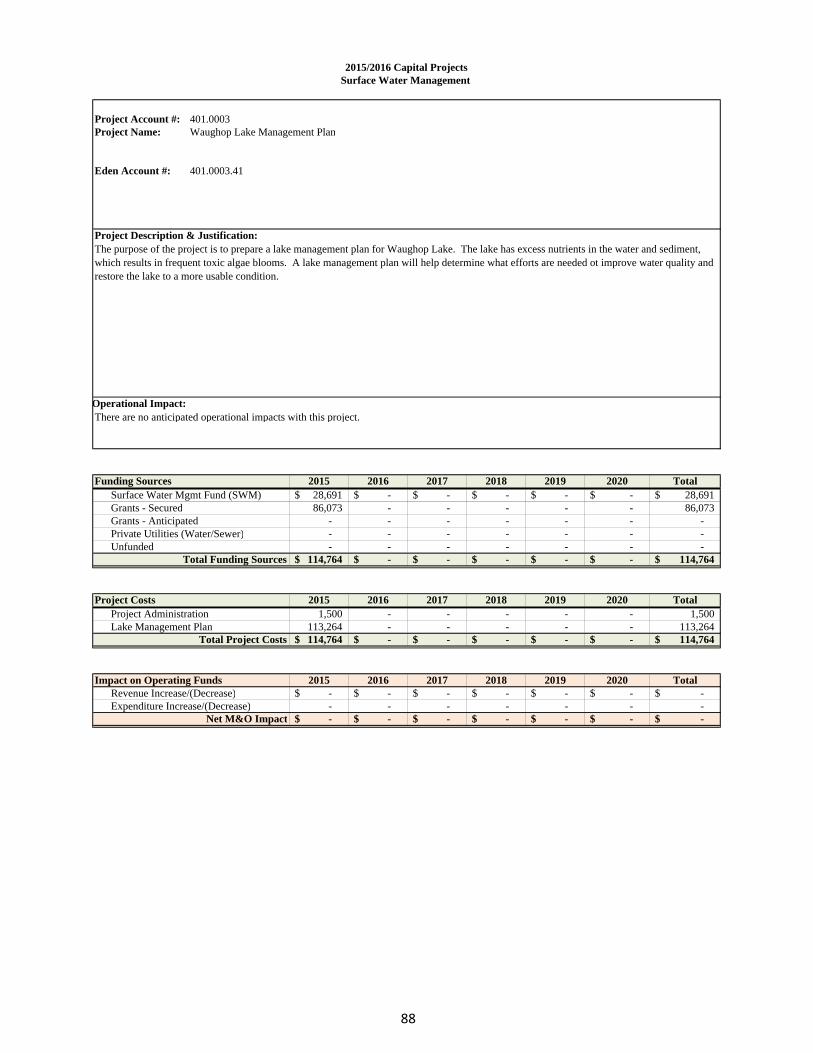
2015/2016 Capital ProjectsSurface Water Management
Project Account #: 401.0003Project Name: Waughop Lake Management Plan
Eden Account #: 401.0003.41
Council Priority:Planning Area:
Project Description & Justification:
Operational Impact:There are no anticipated operational impacts with this project.
Funding Sources 2015 2016 2017 2018 2019 2020 TotalSurface Water Mgmt Fund (SWM) 28,691$ -$ -$ -$ -$ -$ 28,691$ Grants - Secured 86,073 - - - - - 86,073 Grants - Anticipated - - - - - - - Private Utilities (Water/Sewer) - - - - - - - Unfunded - - - - - - -
Total Funding Sources 114,764$ -$ -$ -$ -$ -$ 114,764$
Project Costs 2015 2016 2017 2018 2019 2020 TotalProject Administration 1,500 - - - - - 1,500 Lake Management Plan 113,264 - - - - - 113,264
Total Project Costs 114,764$ -$ -$ -$ -$ -$ 114,764$
Impact on Operating Funds 2015 2016 2017 2018 2019 2020 TotalRevenue Increase/(Decrease) -$ -$ -$ -$ -$ -$ -$ Expenditure Increase/(Decrease) - - - - - - -
Net M&O Impact -$ -$ -$ -$ -$ -$ -$
The purpose of the project is to prepare a lake management plan for Waughop Lake. The lake has excess nutrients in the water and sediment, which results in frequent toxic algae blooms. A lake management plan will help determine what efforts are needed ot improve water quality and restore the lake to a more usable condition.
88

2015/2016 Capital ProjectsSurface Water Management
Project Account #: 401.0004Project Name: Permanent O&M Facility (Shop)
Eden Account #: 401.0004.41
Council Priority:Planning Area:
Project Description & Justification:
Operational Impact:There will be financial impacts to operate the new building (sewer, power, and water costs) as well as future costs for repairs, improvements, etc. No cost is shown below until funding sources are identified.
Funding Sources 2015 2016 2017 2018 2019 2020 TotalSurface Water Mgmt Fund (SWM) 526,948$ -$ -$ -$ -$ -$ 526,948$ Grants - Secured - - - - - - - Grants - Anticipated - - - - - - - Private Utilities (Water/Sewer) - - - - - - - Unfunded - - - - - - -
Total Funding Sources 526,948$ -$ -$ -$ -$ -$ 526,948$
Project Costs 2015 2016 2017 2018 2019 2020 TotalDesign & Construction Mgmt. 90,000 - - - - - 90,000 Construction 436,948 - - - - - 436,948
Total Project Costs 526,948$ -$ -$ -$ -$ -$ 526,948$
Impact on Operating Funds 2015 2016 2017 2018 2019 2020 TotalRevenue Increase/(Decrease) -$ -$ -$ -$ -$ -$ -$ Expenditure Increase/(Decrease) - - - - - - -
Net M&O Impact -$ -$ -$ -$ -$ -$ -$
This project will construct a 4,977 sq. ft. prefabricated metal building at 9420 Front St. S in Lakewood. The building will be used as a shop for the Operations and Maintenance division of the City. The shop will have 4 indoor bays, an outdoor covered wash bay, storage areas, a restroom, and heating and ventilation.
89
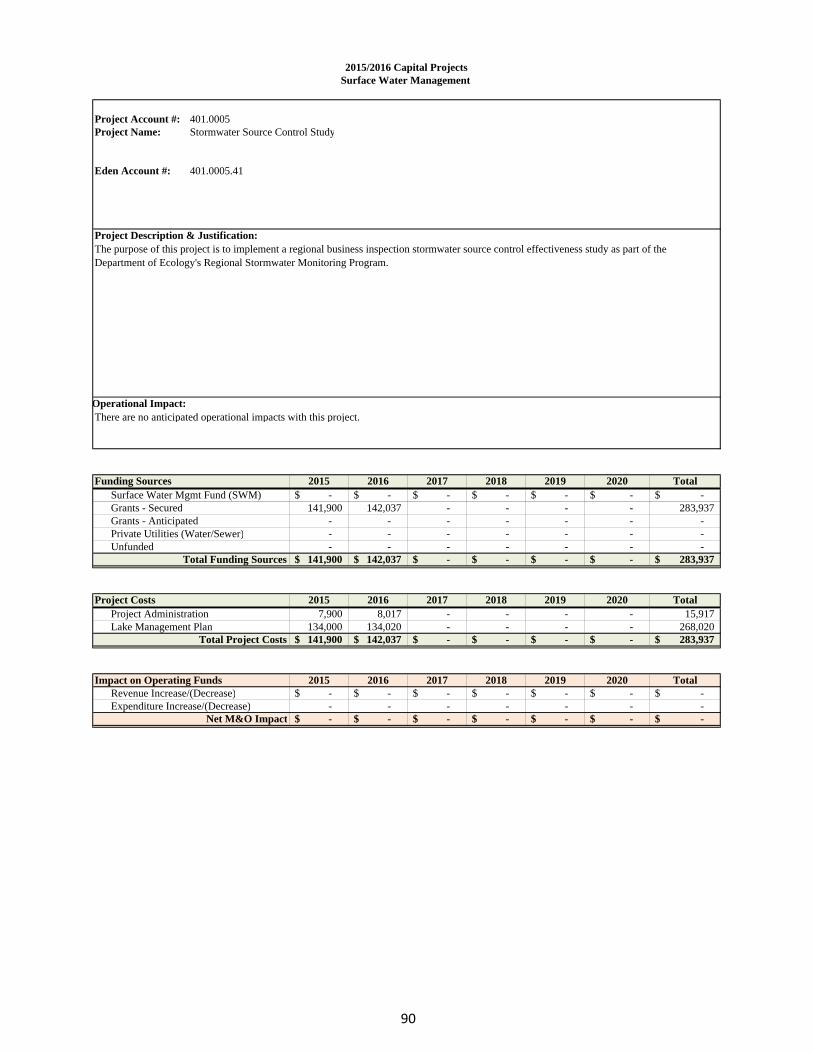
2015/2016 Capital ProjectsSurface Water Management
Project Account #: 401.0005Project Name: Stormwater Source Control Study
Eden Account #: 401.0005.41
Council Priority:Planning Area:
Project Description & Justification:
Operational Impact:There are no anticipated operational impacts with this project.
Funding Sources 2015 2016 2017 2018 2019 2020 TotalSurface Water Mgmt Fund (SWM) -$ -$ -$ -$ -$ -$ -$ Grants - Secured 141,900 142,037 - - - - 283,937 Grants - Anticipated - - - - - - - Private Utilities (Water/Sewer) - - - - - - - Unfunded - - - - - - -
Total Funding Sources 141,900$ 142,037$ -$ -$ -$ -$ 283,937$
Project Costs 2015 2016 2017 2018 2019 2020 TotalProject Administration 7,900 8,017 - - - - 15,917 Lake Management Plan 134,000 134,020 - - - - 268,020
Total Project Costs 141,900$ 142,037$ -$ -$ -$ -$ 283,937$
Impact on Operating Funds 2015 2016 2017 2018 2019 2020 TotalRevenue Increase/(Decrease) -$ -$ -$ -$ -$ -$ -$ Expenditure Increase/(Decrease) - - - - - - -
Net M&O Impact -$ -$ -$ -$ -$ -$ -$
The purpose of this project is to implement a regional business inspection stormwater source control effectiveness study as part of the Department of Ecology's Regional Stormwater Monitoring Program.
90

2015/2016 Capital ProjectsSurface Water Management
Project Account #: 401.0006Project Name: 2016 Water Quality Vaults Project
Eden Account #: 401.0006.41
Council Priority:Planning Area:
Project Description & Justification:
Operational Impact:The impact will be the new vault will need inspected annually and cleaned as needed. There will be an overall increase in operational costs as estimated below since the new structure will need inspected and cleaned.
Funding Sources 2015 2016 2017 2018 2019 2020 TotalSurface Water Mgmt Fund (SWM) 15,000$ 295,000$ -$ -$ -$ -$ 310,000$ Grants - Secured - - - - - - - Grants - Anticipated - - - - - - - Private Utilities (Water/Sewer) - - - - - - - Unfunded - - - - - - -
Total Funding Sources 15,000$ 295,000$ -$ -$ -$ -$ 310,000$
Project Costs 2015 2016 2017 2018 2019 2020 TotalDesign & Construction Mgmt. 15,000 25,000 - - - - 40,000 Construction - 270,000 - - - - 270,000
Total Project Costs 15,000$ 295,000$ -$ -$ -$ -$ 310,000$
Impact on Operating Funds 2015 2016 2017 2018 2019 2020 TotalRevenue Increase/(Decrease) -$ -$ -$ -$ -$ -$ -$ Expenditure Increase/(Decrease) - 5,000 5,150 5,300 5,450 5,600 26,500
Net M&O Impact -$ 5,000$ 5,150$ 5,300$ 5,450$ 5,600$ 26,500$
This project will retrofit existing stormwater conveyance systems that currently discharge untreated stormwater into Flett Creek, Ponce de Leon Creek and Seeley Lake. The project will install water quality treatment structures into existing stormwater conveyance systems upstream of existing outfalls. The treatment structures are designed to remove oil and sediment from the stormwater thus improving water quality before discharging to the creeks and lake.
91
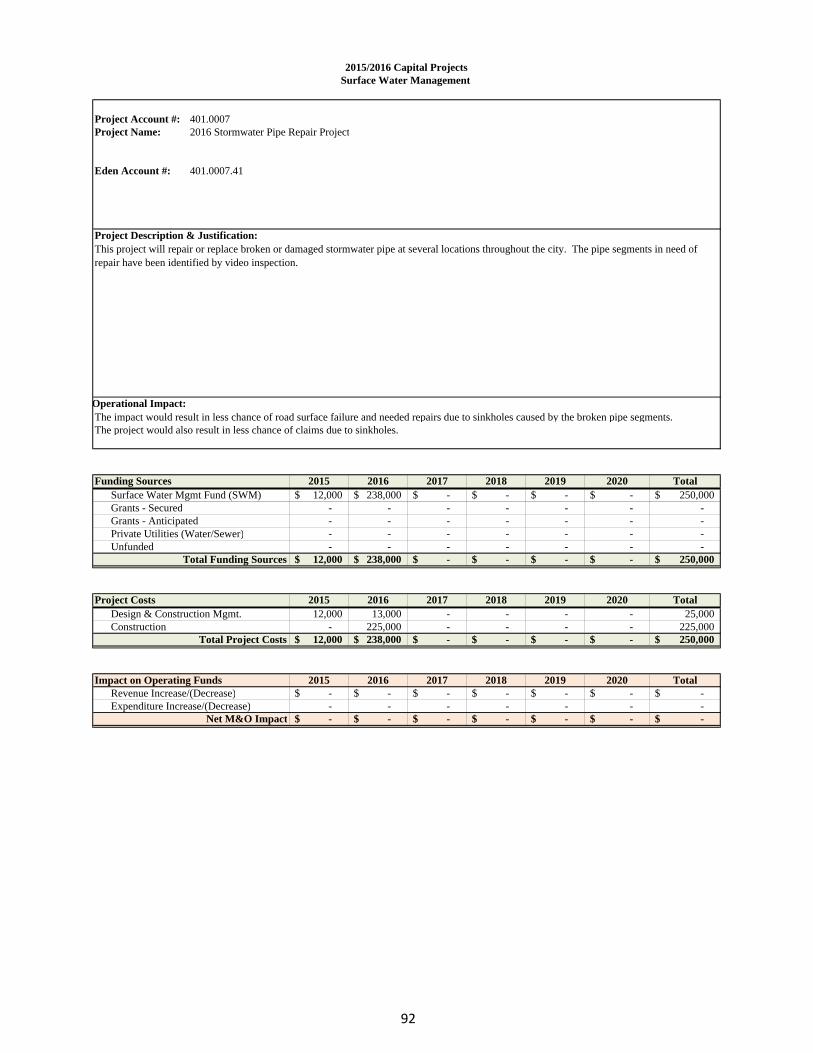
2015/2016 Capital ProjectsSurface Water Management
Project Account #: 401.0007Project Name: 2016 Stormwater Pipe Repair Project
Eden Account #: 401.0007.41
Council Priority:Planning Area:
Project Description & Justification:
Operational Impact:The impact would result in less chance of road surface failure and needed repairs due to sinkholes caused by the broken pipe segments. The project would also result in less chance of claims due to sinkholes.
Funding Sources 2015 2016 2017 2018 2019 2020 TotalSurface Water Mgmt Fund (SWM) 12,000$ 238,000$ -$ -$ -$ -$ 250,000$ Grants - Secured - - - - - - - Grants - Anticipated - - - - - - - Private Utilities (Water/Sewer) - - - - - - - Unfunded - - - - - - -
Total Funding Sources 12,000$ 238,000$ -$ -$ -$ -$ 250,000$
Project Costs 2015 2016 2017 2018 2019 2020 TotalDesign & Construction Mgmt. 12,000 13,000 - - - - 25,000 Construction - 225,000 - - - - 225,000
Total Project Costs 12,000$ 238,000$ -$ -$ -$ -$ 250,000$
Impact on Operating Funds 2015 2016 2017 2018 2019 2020 TotalRevenue Increase/(Decrease) -$ -$ -$ -$ -$ -$ -$ Expenditure Increase/(Decrease) - - - - - - -
Net M&O Impact -$ -$ -$ -$ -$ -$ -$
This project will repair or replace broken or damaged stormwater pipe at several locations throughout the city. The pipe segments in need of repair have been identified by video inspection.
92

2015/2016 Capital ProjectsSurface Water Management
Project Account #: 401.0008Project Name: 2016 Stormwater Outfall Retrofit Project
Eden Account #: 401.0008.41
Council Priority:Planning Area:
Project Description & Justification:
Operational Impact:The impact would result in 9 small vaults to be inspected annually and cleaned as needed.
Funding Sources 2015 2016 2017 2018 2019 2020 TotalSurface Water Mgmt Fund (SWM) 15,000$ 285,000$ -$ -$ -$ -$ 300,000$ Grants - Secured - - - - - - - Grants - Anticipated - - - - - - - Private Utilities (Water/Sewer) - - - - - - - Unfunded - - - - - - -
Total Funding Sources 15,000$ 285,000$ -$ -$ -$ -$ 300,000$
Project Costs 2015 2016 2017 2018 2019 2020 TotalDesign & Construction Mgmt. 15,000 15,000 - - - - 30,000 Construction - 270,000 - - - - 270,000
Total Project Costs 15,000$ 285,000$ -$ -$ -$ -$ 300,000$
Impact on Operating Funds 2015 2016 2017 2018 2019 2020 TotalRevenue Increase/(Decrease) -$ -$ -$ -$ -$ -$ -$ Expenditure Increase/(Decrease) - 500 4,500 500 4,500 10,000
Net M&O Impact -$ -$ 500$ 4,500$ 500$ 4,500$ 10,000$
This project will install water quality vaults near the ends of pipes that discharge stormwater to Lakewood area water bodies. The vaults are designed to remove pollutants before they enter creeks or lakes. 9 stormwater pipes that discharge into Lake Louise, Carp Lake, and Flett Creek will be retrofitted.
93

2015/2016 Capital ProjectsSurface Water Management
Project Account #: 401.0009Project Name: Storm Drain Pipe Repair Project
Eden Account #: 401.0009.41
Council Priority:Planning Area:
Project Description & Justification:
Operational Impact:Replacing the deteriorated pipes now will enhance the longevity of the new pavement by eliminating the chance that a pipe could fail and lead to a sink hole in the road.
Funding Sources 2015 2016 2017 2018 2019 2020 TotalSurface Water Mgmt Fund (SWM) 200,000$ -$ -$ -$ -$ -$ 200,000$ Grants - Secured - - - - - - - Grants - Anticipated - - - - - - - Private Utilities (Water/Sewer) - - - - - - - Unfunded - - - - - - -
Total Funding Sources 200,000$ -$ -$ -$ -$ -$ 200,000$
Project Costs 2015 2016 2017 2018 2019 2020 TotalDesign & Construction Mgmt. 5,000 - - - - - 5,000 Construction 195,000 - - - - - 195,000
Total Project Costs 200,000$ -$ -$ -$ -$ -$ 200,000$
Impact on Operating Funds 2015 2016 2017 2018 2019 2020 TotalRevenue Increase/(Decrease) -$ -$ -$ -$ -$ -$ -$ Expenditure Increase/(Decrease) - - - - - -
Net M&O Impact -$ -$ -$ -$ -$ -$ -$
This project will replace approximately 660 feet of deteriorated storm drain pipes located under Bridgeport Way and Steilacoom Blvd. The work is being done prior to these roads are overlayed with new pavement this summer.
94

2015/2016 Capital ProjectsSewer
Project Account #: 311.0001Project Name: Woodbrook Sanitary Sewer Extension Phase II
Eden Account #: 311.0001.21
Council Priority: Council goals 3 & 4Planning Area:
Project Description & Justification:
Operational Impact:Once the sanitary sewer lines are constructed the system will be turned over the Pierce county for operation and maintenance. Prior to properties connection up to the sewer system they will be subject to the City's sewer availability charges.
Funding Sources 2015 2016 2017 2018 2019 2020 TotalFund 204 Revenue 270,000$ -$ -$ -$ -$ -$ 270,000$ PWTF Loan-secured 250,000 250,000 - - - - 500,000 Grants - Anticipated 257,500 492,500 - - - - 750,000 Private Utilities (Water/Sewer) - - - - - - - Unfunded - - - - - - -
Total Funding Sources 777,500$ 742,500$ -$ -$ -$ -$ 1,520,000$
Project Costs 2015 2016 2017 2018 2019 2020 TotalEngineering 35,000 - - - - - 35,000 Construction 662,500 662,500 - - - - 1,325,000 Construction Engineering 80,000 80,000 - - - - 160,000
Total Project Costs 777,500$ 742,500$ -$ -$ -$ -$ 1,520,000$
Impact on Operating Funds * 2015 2016 2017 2018 2019 2020 TotalRevenue Increase/(Decrease) -$ -$ 50,000$ 50,000$ 50,000$ 50,000$ 200,000$ Expenditure Increase/(Decrease) - 44,000 44,000 44,000 44,000 44,000 220,000
Net M&O Impact -$ 44,000$ (6,000)$ (6,000)$ (6,000)$ (6,000)$ 20,000$ * Revenue increase is Fund 312 sewer availability fee and the expenditure increase is Fund 2014 loan repayment.
The project would extend the existing sanitary sewer system which presently lies within 146th St and stops 300 ft short of Woodbrook Dr. The Project will extend the sewer line to Woodbrook Dr and then on Woodbrook Dr from 146th St to 150th St and then on 150th St westerly 800 feet from the Woodbrook Intersection. In addition the project will extend sidesewer stubs to all properties fronting on the new sewer line. Lastly as with the prior city sewer construciton work within the Woodbrook area the streets and the storm drainage along the route will be totally reconstructed. Upon completion of this sewer project the industrial zoned properties (120 acres) within the Woodbrook area will have sanitary sewer service available them at their street frontage.
95

6-Year Capital Improvement PlanTransportation Projects - FUNDED
Years 2015 - 2020371,129$ (15,500)$ 5,000$ 5,000$ 5,000$ 5,000$ 217,373$
Funding Sources 2015 Budget 2015 YND Est 2016 2016 YND Est 2017 2018 2019 2020 Total * Motor Vehicle Fuel Tax (MVET) 340,000$ 340,000$ 340,000$ 340,000$ 340,000$ 340,000$ 340,000$ 340,000$ 2,040,000$ Real Estate Excise Tax (REET) 1,393,635 1,618,635 735,500 960,500 700,000 700,000 800,000 800,000 5,579,135 Surface Water Mgmt Fund (SWM) 2,161,329 930,117 - 1,416,329 262,650 150,000 - - 2,759,096 Grants - Secured 19,445,291 7,785,750 - 14,168,899 1,439,850 - - - 23,394,499 Grants - Anticipated 4,192,171 750,000 - 205,000 1,870,000 2,320,000 455,000 580,000 6,180,000 Dev Contrib/Mitig/Street Vac/Rebate 1,855,904 1,080,162 - 1,011,000 200,000 20,000 6,000 - 2,317,162 LOCAL Financing 1,654,448 1,654,448 - - - - - - 1,654,448 Gen Govt - General Fund 689,500 689,500 310,500 310,500 748,500 357,500 403,500 395,500 2,905,000 Gen Govt - Additional REET 200,000 200,000 200,000 200,000 200,000 200,000 200,000 200,000 1,200,000 Gen Govt - CDBG Fund 600,312 158,812 - 685,000 175,000 661,000 - 239,000 1,918,812 Vehicle Licensing Fee (VLF) 569,500 569,500 682,500 682,500 682,500 682,500 682,500 682,500 3,982,000
Total Funding Sources 33,102,090$ 15,776,924$ 2,268,500$ 19,979,728$ 6,618,500$ 5,431,000$ 2,887,000$ 3,237,000$ 53,930,152$ * Total includes 2015 YND Est + 2016 YND Est + 2017 thru 2020
Project Costs 2015 2015 YND Est 2016 2016 YND Est 2017 2018 2019 2020 Total*Pavement Preservation - Current Projects: 1,500,000$ 1,615,000$ 315,000$ 335,000$ 330,000$ 1,454,000$ 360,000$ 360,000$ 4,454,000$
1 Bridgeport Way - Pac Hwy to 112th St 400,000 410,000 - - - - - - 410,000
2 Steilacoom Blvd - Lakewood Dr. to W. of South Tacoma Way
800,000 805,000 - - - - - - 805,000
3 Pacific Highway - 108th to SR512 - - - - - 595,000 - - 595,000 4 100th - Lakeview to So. Tacoma Way - - - - - 529,000 - - 529,000 xx Chip Seal Program - Local Access Roads 300,000 400,000 315,000 335,000 330,000 330,000 360,000 360,000 2,115,000
Pavement Preservation - New Projects 1,275,000$ 585,200$ 945,000$ 1,680,000$ 1,210,000$ 1,157,000$ 815,000$ 1,320,000$ 6,767,200$ 5 Lakewood Dr-100th to Steilacoom Blvd - 27,000 945,000 970,000 - - - - 997,000 6 Lakewood Dr-Flett Creek to N. City Limits - - - - 1,210,000 - - - 1,210,000
7 Main Street - GLD to 108th Street 300,000 245,500 - - - - - - 245,500 8 59th - Main Street to 100th - - - - - 496,000 - - 496,000 9 59th - 100th to Bridgeport 250,000 292,700 - - - - - - 292,700 10 108th - Bridgeport to Pac Hwy - - - - - 661,000 - - 661,000 11 108th - Main Street to Bridgeport 725,000 20,000 - 710,000 - - - - 730,000 12 Custer - Steilacoom to John Dower - - - - - - 540,000 - 540,000 13 88th - Steilacoom to Custer - - - - - - 275,000 - 275,000 14 100th - 59th to Lakeview - - - - - - - 1,320,000 1,320,000
Street & Sidewalk - Current Projects: 10,855,351$ 3,355,000$ 300,000$ 8,933,039$ -$ -$ -$ -$ 12,288,039$ 17 South Tacoma Way (SR512 to 96th)
Total project does not include $460K for design & ROW in 2013/14.
4,200,000 385,000 200,000 3,880,000 - - - - 4,265,000
19 Madigan Access Project 5,135,351 2,800,000 - 3,423,039 - - - - 6,223,039 20 So. Tac Way - Steilacoom to 88th
Total project does not include $100K for design in 2013/2014.
1,520,000 170,000 100,000 1,630,000 - - - - 1,800,000
Street & Sidewalk - Grant Opportunity: 7,549,470$ 490,434$ -$ 5,790,000$ 3,817,500$ 1,870,000$ 540,000$ 780,000$ 13,287,934$ 31 112/111th - Bridgeport to Kendrick 258,001 35,000 - 60,000 1,980,000 - - - 2,075,000 32 Bridgeport Way - JBLM to I-5 3,750,000 90,434 - 3,670,000 - - - - 3,760,434 33 Gravelly Lake Drive - 100th to BPW 1,893,969 310,000 - 1,920,000 - - - - 2,230,000
Roadway Improvements-40th & 96th 842,500 15,000 - 50,000 777,500 - - - 842,500 xx Safety Projects - Various - - - - - 330,000 360,000 360,000 1,050,000 xx Safety Projects - Military & 112th 805,000 40,000 - 90,000 675,000 - - - 805,000 xx Safe Routes to Schools, Pedestrian & - - - - 385,000 1,540,000 180,000 420,000 2,525,000
Subtotal 21,179,821$ 6,045,634$ 1,560,000$ 16,738,039$ 5,357,500$ 4,481,000$ 1,715,000$ 2,460,000$ 36,797,173$ Other Pavement Preservation Current Projects:
New LED Streetlights 120,000 75,000 185,000 185,000 160,000 165,000 170,000 175,000 930,000 Signal Projects - - 330,000 - 360,000 - 690,000 Minor Capital Projects 50,000 85,000 50,000 85,000 50,000 50,000 50,000 50,000 370,000 Neighborhood Traffic Safety Program 25,000 25,000 25,000 25,000 25,000 25,000 25,000 25,000 150,000 Personnel (~4 FTEs), Engineer, Prof Svcs 450,000 491,000 464,000 474,000 478,000 492,000 507,000 522,000 2,964,000
New Projects Added: - Steilacoom Blvd Safety-WSH to Lakeview 2,351,667 150,000 - 2,530,000 - - - - 2,680,000
Lakewood Traffic Signal Phase V 520,000 257,415 - 262,585 - - - - 520,000 Steilacoom Blvd. Farwest to Phillips 942,000 100,000 - 430,000 213,000 213,000 55,000 - 1,011,000
Projects from Carry Forward Budget Adj: - - - - - - - - 100th & Lakewood Drive 20,000 20,000 - - - - - - 20,000 LED Streetlight Retrofits 2,372,088 2,372,088 - - - - - - 2,372,088 Traffic Signal Upgrade Phase IV 703,000 757,000 - - - - - - 757,000 San Francisco-BPW to Addison (CDBG) 158,812 187,000 - - - - - - 187,000 Custer/John Dower 95,636 81,018 - - - - - - 81,018 Portland Ave Traffic Calming (Camp Murray Mitigation)
- 15,000 - - - - - - 15,000
Bridgeport Way - 83rd to 75th 3,734,747 4,160,000 - - - - - - 4,160,000 City-Wide Safety Improvements 8,190 8,500 - - - - - - 8,500
Total Uses 32,730,961$ 14,829,655$ 2,284,000$ 20,729,624$ 6,613,500$ 5,426,000$ 2,882,000$ 3,232,000$ 53,712,779$ * Total includes 2015 YND Est + 2016 YND Est + 2017 thru 2020
2015 Budget 2015 YND Est 2016 2016 YND Est 2017 2018 2019 2020 Total * Beginning Fund Balance -$ -$ 371,129$ 947,269$ 197,373$ 202,373$ 207,373$ 212,373$ -$ Ending Fund Balance 371,129$ 947,269$ 355,629$ 197,373$ 202,373$ 207,373$ 212,373$ 217,373$ 217,373$ Composition of Ending Fund Balance: Reserved for Paths & Trails (MVET Requirement 10,045$ 10,045$ 15,045$ 15,045$ 20,045$ 25,045$ 29,045$ 34,045$ 34,045$ Reserved for Mitigation Funded Projects 311,084$ 305,736$ 311,084$ 179,746$ 179,746$ 179,746$ 179,746$ 179,746$ 179,746$ Unreserved 50,000$ 631,488$ 29,500$ 2,582$ 2,582$ 2,582$ 3,582$ 3,582$ 3,582$
96
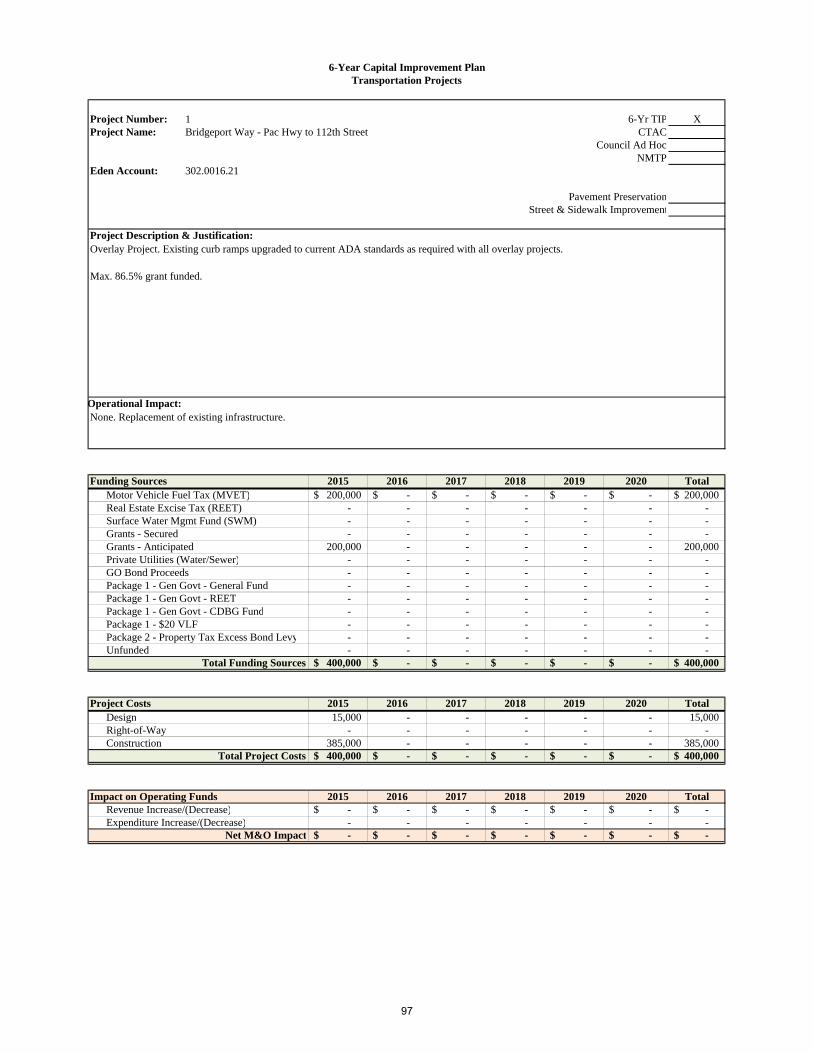
6-Year Capital Improvement PlanTransportation Projects
Project Number: 1 6-Yr TIP XProject Name: Bridgeport Way - Pac Hwy to 112th Street CTAC
Council Ad HocNMTP
Eden Account: 302.0016.21
Council Priority: Pavement PreservationPlanning Area: Street & Sidewalk Improvement
Project Description & Justification:
Operational Impact:
Funding Sources 2015 2016 2017 2018 2019 2020 TotalMotor Vehicle Fuel Tax (MVET) 200,000$ -$ -$ -$ -$ -$ 200,000$ Real Estate Excise Tax (REET) - - - - - - - Surface Water Mgmt Fund (SWM) - - - - - - - Grants - Secured - - - - - - - Grants - Anticipated 200,000 - - - - - 200,000 Private Utilities (Water/Sewer) - - - - - - - GO Bond Proceeds - - - - - - - Package 1 - Gen Govt - General Fund - - - - - - - Package 1 - Gen Govt - REET - - - - - - - Package 1 - Gen Govt - CDBG Fund - - - - - - - Package 1 - $20 VLF - - - - - - - Package 2 - Property Tax Excess Bond Levy - - - - - - - Unfunded - - - - - - -
Total Funding Sources 400,000$ -$ -$ -$ -$ -$ 400,000$
Project Costs 2015 2016 2017 2018 2019 2020 TotalDesign 15,000 - - - - - 15,000 Right-of-Way - - - - - - - Construction 385,000 - - - - - 385,000
Total Project Costs 400,000$ -$ -$ -$ -$ -$ 400,000$
Impact on Operating Funds 2015 2016 2017 2018 2019 2020 TotalRevenue Increase/(Decrease) -$ -$ -$ -$ -$ -$ -$ Expenditure Increase/(Decrease) - - - - - - -
Net M&O Impact -$ -$ -$ -$ -$ -$ -$
Overlay Project. Existing curb ramps upgraded to current ADA standards as required with all overlay projects.
Max. 86.5% grant funded.
None. Replacement of existing infrastructure.
97
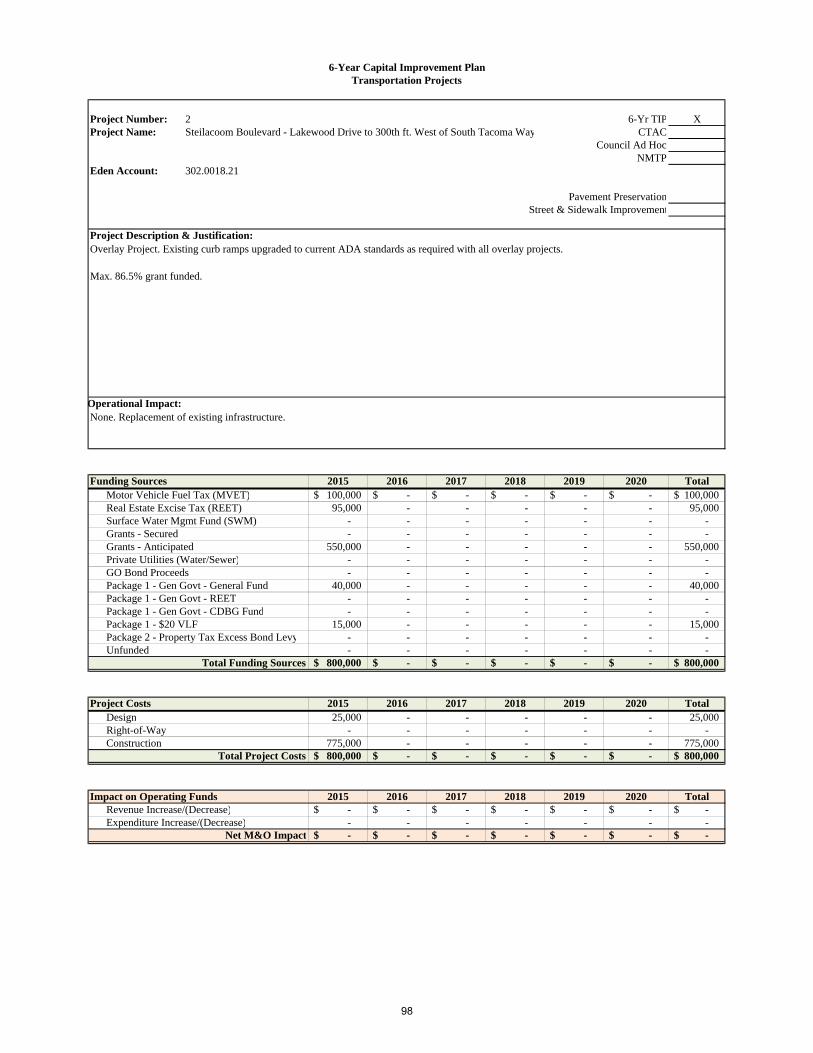
6-Year Capital Improvement PlanTransportation Projects
Project Number: 2 6-Yr TIP XProject Name: Steilacoom Boulevard - Lakewood Drive to 300th ft. West of South Tacoma Way CTAC
Council Ad HocNMTP
Eden Account: 302.0018.21
Council Priority: Pavement PreservationPlanning Area: Street & Sidewalk Improvement
Project Description & Justification:
Operational Impact:
Funding Sources 2015 2016 2017 2018 2019 2020 TotalMotor Vehicle Fuel Tax (MVET) 100,000$ -$ -$ -$ -$ -$ 100,000$ Real Estate Excise Tax (REET) 95,000 - - - - - 95,000 Surface Water Mgmt Fund (SWM) - - - - - - - Grants - Secured - - - - - - - Grants - Anticipated 550,000 - - - - - 550,000 Private Utilities (Water/Sewer) - - - - - - - GO Bond Proceeds - - - - - - - Package 1 - Gen Govt - General Fund 40,000 - - - - - 40,000 Package 1 - Gen Govt - REET - - - - - - - Package 1 - Gen Govt - CDBG Fund - - - - - - - Package 1 - $20 VLF 15,000 - - - - - 15,000 Package 2 - Property Tax Excess Bond Levy - - - - - - - Unfunded - - - - - - -
Total Funding Sources 800,000$ -$ -$ -$ -$ -$ 800,000$
Project Costs 2015 2016 2017 2018 2019 2020 TotalDesign 25,000 - - - - - 25,000 Right-of-Way - - - - - - - Construction 775,000 - - - - - 775,000
Total Project Costs 800,000$ -$ -$ -$ -$ -$ 800,000$
Impact on Operating Funds 2015 2016 2017 2018 2019 2020 TotalRevenue Increase/(Decrease) -$ -$ -$ -$ -$ -$ -$ Expenditure Increase/(Decrease) - - - - - - -
Net M&O Impact -$ -$ -$ -$ -$ -$ -$
Overlay Project. Existing curb ramps upgraded to current ADA standards as required with all overlay projects.
Max. 86.5% grant funded.
None. Replacement of existing infrastructure.
98
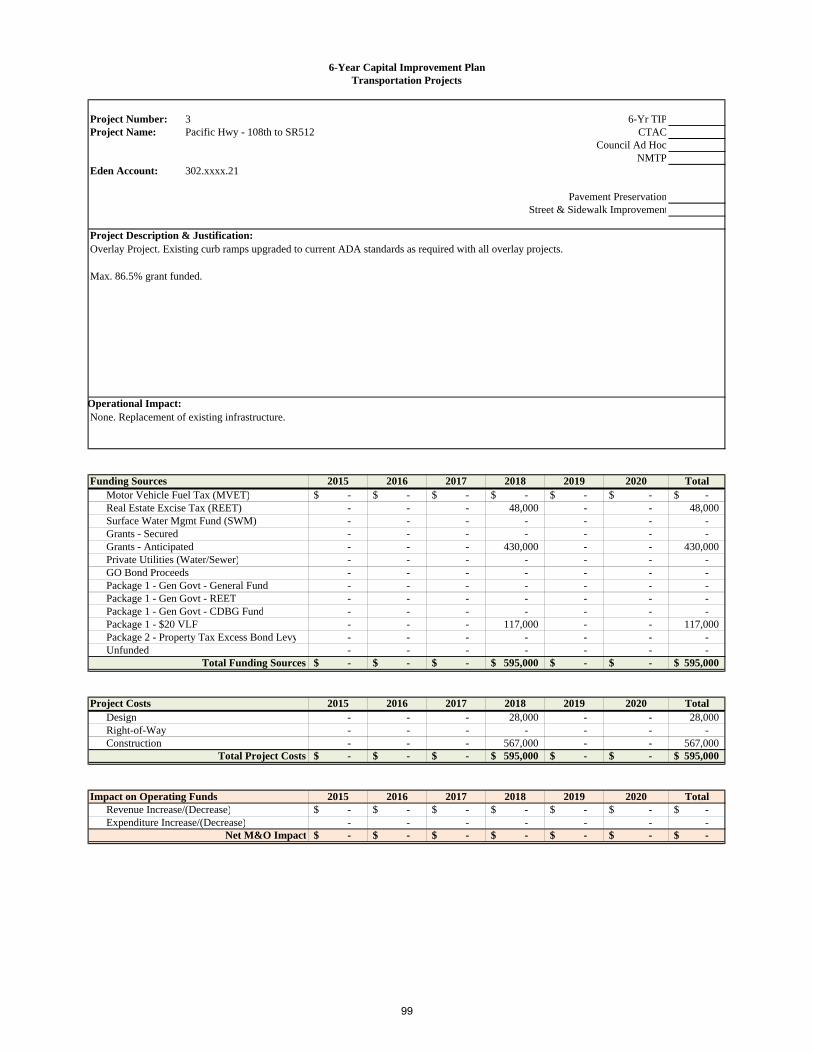
6-Year Capital Improvement PlanTransportation Projects
Project Number: 3 6-Yr TIPProject Name: Pacific Hwy - 108th to SR512 CTAC
Council Ad HocNMTP
Eden Account: 302.xxxx.21
Council Priority: Pavement PreservationPlanning Area: Street & Sidewalk Improvement
Project Description & Justification:
Operational Impact:
Funding Sources 2015 2016 2017 2018 2019 2020 TotalMotor Vehicle Fuel Tax (MVET) -$ -$ -$ -$ -$ -$ -$ Real Estate Excise Tax (REET) - - - 48,000 - - 48,000 Surface Water Mgmt Fund (SWM) - - - - - - - Grants - Secured - - - - - - - Grants - Anticipated - - - 430,000 - - 430,000 Private Utilities (Water/Sewer) - - - - - - - GO Bond Proceeds - - - - - - - Package 1 - Gen Govt - General Fund - - - - - - - Package 1 - Gen Govt - REET - - - - - - - Package 1 - Gen Govt - CDBG Fund - - - - - - - Package 1 - $20 VLF - - - 117,000 - - 117,000 Package 2 - Property Tax Excess Bond Levy - - - - - - - Unfunded - - - - - - -
Total Funding Sources -$ -$ -$ 595,000$ -$ -$ 595,000$
Project Costs 2015 2016 2017 2018 2019 2020 TotalDesign - - - 28,000 - - 28,000 Right-of-Way - - - - - - - Construction - - - 567,000 - - 567,000
Total Project Costs -$ -$ -$ 595,000$ -$ -$ 595,000$
Impact on Operating Funds 2015 2016 2017 2018 2019 2020 TotalRevenue Increase/(Decrease) -$ -$ -$ -$ -$ -$ -$ Expenditure Increase/(Decrease) - - - - - - -
Net M&O Impact -$ -$ -$ -$ -$ -$ -$
Overlay Project. Existing curb ramps upgraded to current ADA standards as required with all overlay projects.
Max. 86.5% grant funded.
None. Replacement of existing infrastructure.
99

6-Year Capital Improvement PlanTransportation Projects
Project Number: 4 6-Yr TIPProject Name: 100th - Lakeview to South Tacoma Way CTAC
Council Ad HocNMTP
Eden Account: 302.xxxx.21
Council Priority: Pavement PreservationPlanning Area: Street & Sidewalk Improvement
Project Description & Justification:
Operational Impact:
Funding Sources 2015 2016 2017 2018 2019 2020 TotalMotor Vehicle Fuel Tax (MVET) -$ -$ -$ -$ -$ -$ -$ Real Estate Excise Tax (REET) - - - 160,000 - - 160,000 Surface Water Mgmt Fund (SWM) - - - - - - - Grants - Secured - - - - - - - Grants - Anticipated - - - 320,000 - - 320,000 Private Utilities (Water/Sewer) - - - - - - - GO Bond Proceeds - - - - - - - Package 1 - Gen Govt - General Fund - - - - - - - Package 1 - Gen Govt - REET - - - - - - - Package 1 - Gen Govt - CDBG Fund - - - - - - - Package 1 - $20 VLF - - - 49,000 - - 49,000 Package 2 - Property Tax Excess Bond Levy - - - - - - - Unfunded - - - - - - -
Total Funding Sources -$ -$ -$ 529,000$ -$ -$ 529,000$
Project Costs 2015 2016 2017 2018 2019 2020 TotalDesign - - - 28,000 - - 28,000 Right-of-Way - - - - - - - Construction - - - 501,000 - - 501,000
Total Project Costs -$ -$ -$ 529,000$ -$ -$ 529,000$
Impact on Operating Funds 2015 2016 2017 2018 2019 2020 TotalRevenue Increase/(Decrease) -$ -$ -$ -$ -$ -$ -$ Expenditure Increase/(Decrease) - - - - - - -
Net M&O Impact -$ -$ -$ -$ -$ -$ -$
Overlay Project. Existing curb ramps upgraded to current ADA standards as required with all overlay projects.
Max. 86.5% grant funded.
None. Replacement of existing infrastructure.
100
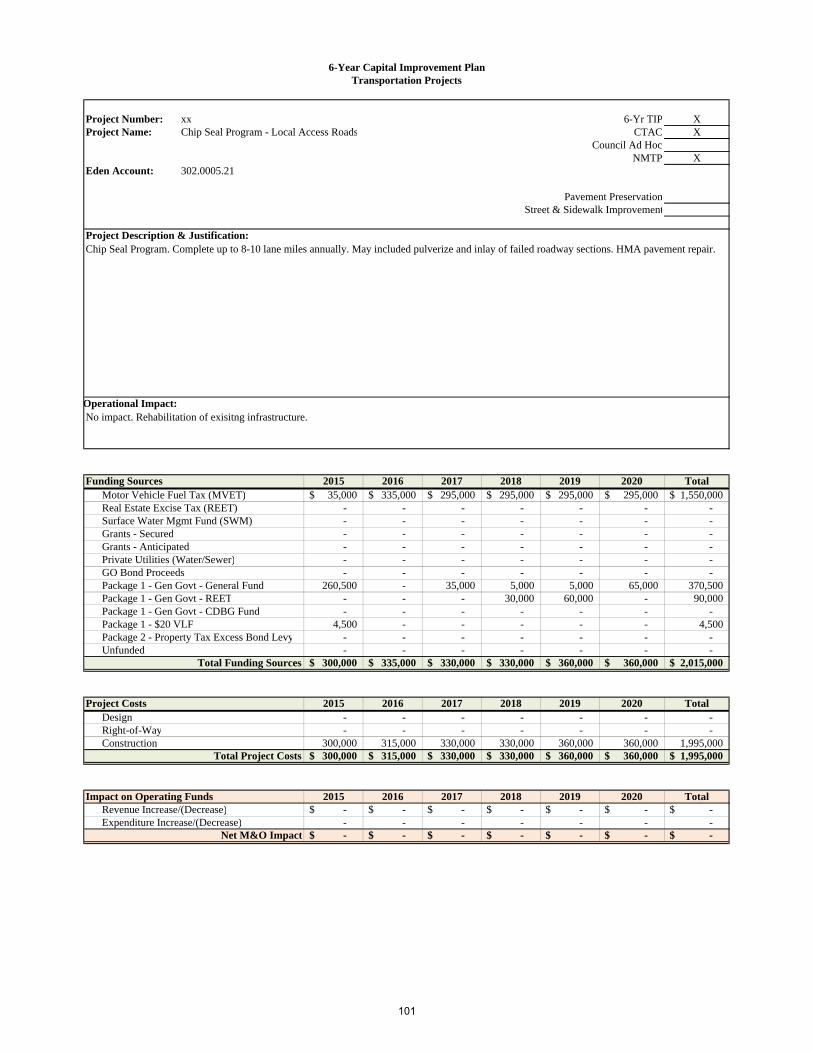
6-Year Capital Improvement PlanTransportation Projects
Project Number: xx 6-Yr TIP XProject Name: Chip Seal Program - Local Access Roads CTAC X
Council Ad HocNMTP X
Eden Account: 302.0005.21
Council Priority: Pavement PreservationPlanning Area: Street & Sidewalk Improvement
Project Description & Justification:
Operational Impact:
Funding Sources 2015 2016 2017 2018 2019 2020 TotalMotor Vehicle Fuel Tax (MVET) 35,000$ 335,000$ 295,000$ 295,000$ 295,000$ 295,000$ 1,550,000$ Real Estate Excise Tax (REET) - - - - - - - Surface Water Mgmt Fund (SWM) - - - - - - - Grants - Secured - - - - - - - Grants - Anticipated - - - - - - - Private Utilities (Water/Sewer) - - - - - - - GO Bond Proceeds - - - - - - - Package 1 - Gen Govt - General Fund 260,500 - 35,000 5,000 5,000 65,000 370,500 Package 1 - Gen Govt - REET - - - 30,000 60,000 - 90,000 Package 1 - Gen Govt - CDBG Fund - - - - - - - Package 1 - $20 VLF 4,500 - - - - - 4,500 Package 2 - Property Tax Excess Bond Levy - - - - - - - Unfunded - - - - - - -
Total Funding Sources 300,000$ 335,000$ 330,000$ 330,000$ 360,000$ 360,000$ 2,015,000$
Project Costs 2015 2016 2017 2018 2019 2020 TotalDesign - - - - - - - Right-of-Way - - - - - - - Construction 300,000 315,000 330,000 330,000 360,000 360,000 1,995,000
Total Project Costs 300,000$ 315,000$ 330,000$ 330,000$ 360,000$ 360,000$ 1,995,000$
Impact on Operating Funds 2015 2016 2017 2018 2019 2020 TotalRevenue Increase/(Decrease) -$ -$ -$ -$ -$ -$ -$ Expenditure Increase/(Decrease) - - - - - - -
Net M&O Impact -$ -$ -$ -$ -$ -$ -$
Chip Seal Program. Complete up to 8-10 lane miles annually. May included pulverize and inlay of failed roadway sections. HMA pavement repair.
No impact. Rehabilitation of exisitng infrastructure.
101

6-Year Capital Improvement PlanTransportation Projects
Project Number: 5 6-Yr TIP XProject Name: Lakewood Drive - 100th to Steilacoom Blvd CTAC
Council Ad HocNMTP
Eden Account: 302.0017.21
Council Priority: Pavement PreservationPlanning Area: Street & Sidewalk Improvement
Project Description & Justification:
Operational Impact:
Funding Sources 2015 2016 2017 2018 2019 2020 TotalMotor Vehicle Fuel Tax (MVET) -$ -$ -$ -$ -$ -$ -$ Real Estate Excise Tax (REET) - 200,000 - - - - 200,000 Surface Water Mgmt Fund (SWM) - - - - - - - Grants - Secured - - - - - - - Grants - Anticipated - - - - - - - Private Utilities (Water/Sewer) - - - - - - - GO Bond Proceeds - - - - - - - Package 1 - Gen Govt - General Fund - 27,500 - - - - 27,500 Package 1 - Gen Govt - REET - - - - - - - Package 1 - Gen Govt - CDBG Fund - - - - - - - Package 1 - $20 VLF - 682,500 - - - - 682,500 Package 2 - Property Tax Excess Bond Levy - - - - - - - Unfunded - - - - - - -
Total Funding Sources -$ 910,000$ -$ -$ -$ -$ 910,000$
Project Costs 2015 2016 2017 2018 2019 2020 TotalDesign - 26,000 - - - - 26,000 Right-of-Way - - - - - - - Construction - 919,000 - - - - 919,000
Total Project Costs -$ 945,000$ -$ -$ -$ -$ 945,000$
Impact on Operating Funds 2015 2016 2017 2018 2019 2020 TotalRevenue Increase/(Decrease) -$ -$ -$ -$ -$ -$ -$ Expenditure Increase/(Decrease) - - - - - - -
Net M&O Impact -$ -$ -$ -$ -$ -$ -$
Reconstruction / Overlay Project. Existing curb ramps upgraded to current ADA standards as required with all overlay projects.
None. Replacement of existing infrastructure.
102
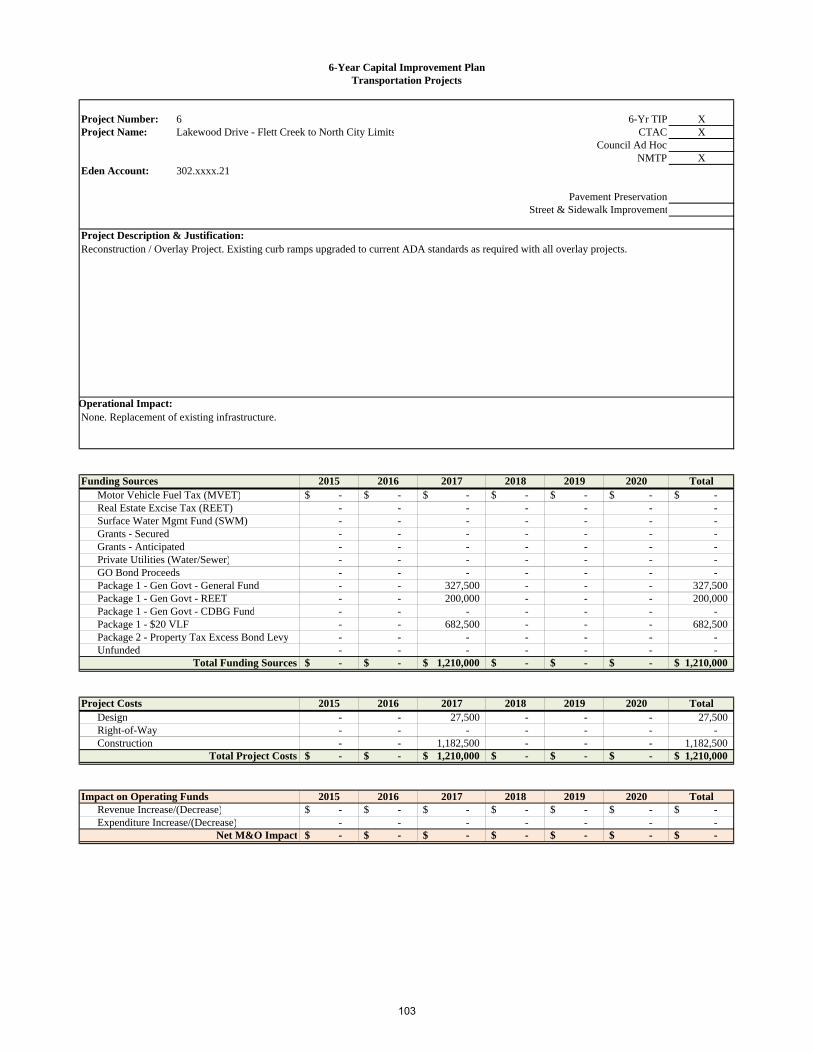
6-Year Capital Improvement PlanTransportation Projects
Project Number: 6 6-Yr TIP XProject Name: Lakewood Drive - Flett Creek to North City Limits CTAC X
Council Ad HocNMTP X
Eden Account: 302.xxxx.21
Council Priority: Pavement PreservationPlanning Area: Street & Sidewalk Improvement
Project Description & Justification:
Operational Impact:
Funding Sources 2015 2016 2017 2018 2019 2020 TotalMotor Vehicle Fuel Tax (MVET) -$ -$ -$ -$ -$ -$ -$ Real Estate Excise Tax (REET) - - - - - - - Surface Water Mgmt Fund (SWM) - - - - - - - Grants - Secured - - - - - - - Grants - Anticipated - - - - - - - Private Utilities (Water/Sewer) - - - - - - - GO Bond Proceeds - - - - - - - Package 1 - Gen Govt - General Fund - - 327,500 - - - 327,500 Package 1 - Gen Govt - REET - - 200,000 - - - 200,000 Package 1 - Gen Govt - CDBG Fund - - - - - - - Package 1 - $20 VLF - - 682,500 - - - 682,500 Package 2 - Property Tax Excess Bond Levy - - - - - - - Unfunded - - - - - - -
Total Funding Sources -$ -$ 1,210,000$ -$ -$ -$ 1,210,000$
Project Costs 2015 2016 2017 2018 2019 2020 TotalDesign - - 27,500 - - - 27,500 Right-of-Way - - - - - - - Construction - - 1,182,500 - - - 1,182,500
Total Project Costs -$ -$ 1,210,000$ -$ -$ -$ 1,210,000$
Impact on Operating Funds 2015 2016 2017 2018 2019 2020 TotalRevenue Increase/(Decrease) -$ -$ -$ -$ -$ -$ -$ Expenditure Increase/(Decrease) - - - - - - -
Net M&O Impact -$ -$ -$ -$ -$ -$ -$
Reconstruction / Overlay Project. Existing curb ramps upgraded to current ADA standards as required with all overlay projects.
None. Replacement of existing infrastructure.
103
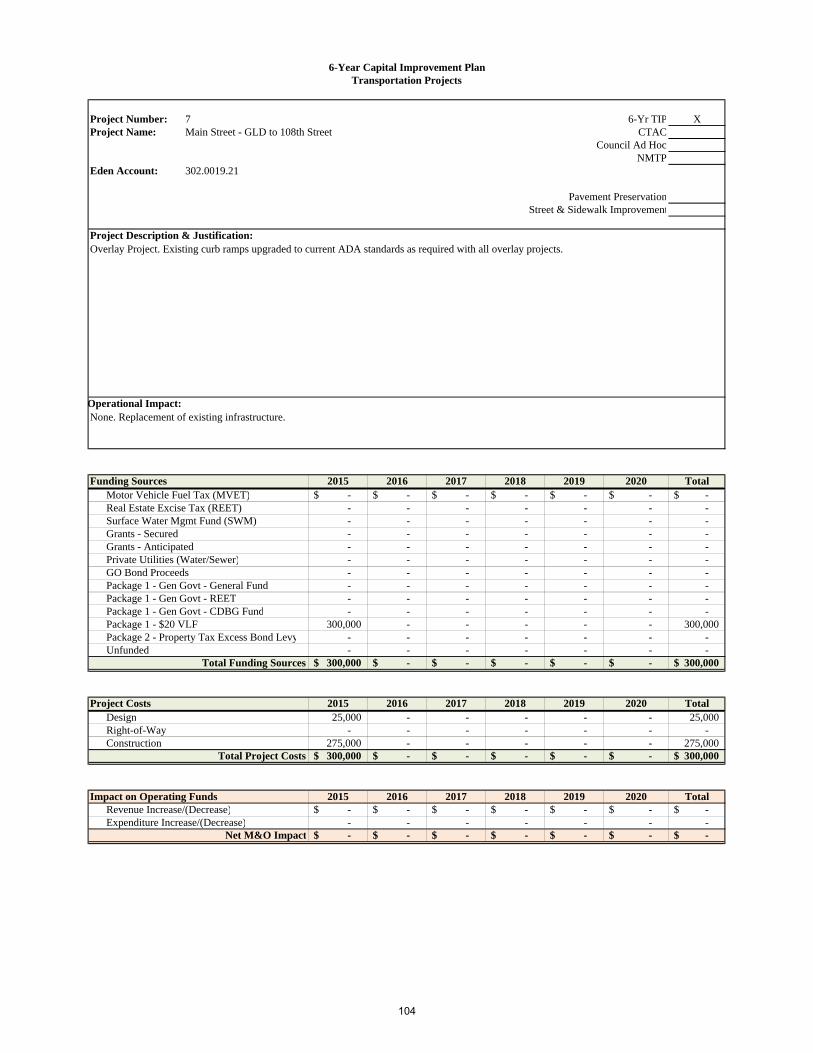
6-Year Capital Improvement PlanTransportation Projects
Project Number: 7 6-Yr TIP XProject Name: Main Street - GLD to 108th Street CTAC
Council Ad HocNMTP
Eden Account: 302.0019.21
Council Priority: Pavement PreservationPlanning Area: Street & Sidewalk Improvement
Project Description & Justification:
Operational Impact:
Funding Sources 2015 2016 2017 2018 2019 2020 TotalMotor Vehicle Fuel Tax (MVET) -$ -$ -$ -$ -$ -$ -$ Real Estate Excise Tax (REET) - - - - - - - Surface Water Mgmt Fund (SWM) - - - - - - - Grants - Secured - - - - - - - Grants - Anticipated - - - - - - - Private Utilities (Water/Sewer) - - - - - - - GO Bond Proceeds - - - - - - - Package 1 - Gen Govt - General Fund - - - - - - - Package 1 - Gen Govt - REET - - - - - - - Package 1 - Gen Govt - CDBG Fund - - - - - - - Package 1 - $20 VLF 300,000 - - - - - 300,000 Package 2 - Property Tax Excess Bond Levy - - - - - - - Unfunded - - - - - - -
Total Funding Sources 300,000$ -$ -$ -$ -$ -$ 300,000$
Project Costs 2015 2016 2017 2018 2019 2020 TotalDesign 25,000 - - - - - 25,000 Right-of-Way - - - - - - - Construction 275,000 - - - - - 275,000
Total Project Costs 300,000$ -$ -$ -$ -$ -$ 300,000$
Impact on Operating Funds 2015 2016 2017 2018 2019 2020 TotalRevenue Increase/(Decrease) -$ -$ -$ -$ -$ -$ -$ Expenditure Increase/(Decrease) - - - - - - -
Net M&O Impact -$ -$ -$ -$ -$ -$ -$
Overlay Project. Existing curb ramps upgraded to current ADA standards as required with all overlay projects.
None. Replacement of existing infrastructure.
104
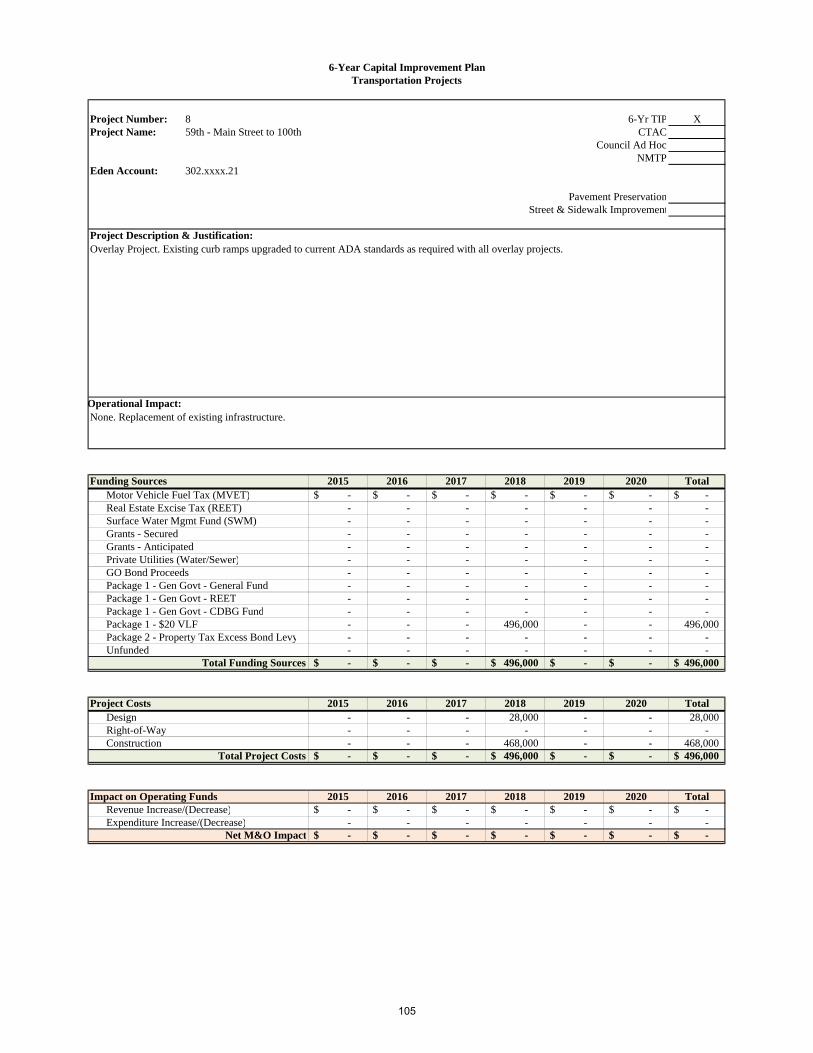
6-Year Capital Improvement PlanTransportation Projects
Project Number: 8 6-Yr TIP XProject Name: 59th - Main Street to 100th CTAC
Council Ad HocNMTP
Eden Account: 302.xxxx.21
Council Priority: Pavement PreservationPlanning Area: Street & Sidewalk Improvement
Project Description & Justification:
Operational Impact:
Funding Sources 2015 2016 2017 2018 2019 2020 TotalMotor Vehicle Fuel Tax (MVET) -$ -$ -$ -$ -$ -$ -$ Real Estate Excise Tax (REET) - - - - - - - Surface Water Mgmt Fund (SWM) - - - - - - - Grants - Secured - - - - - - - Grants - Anticipated - - - - - - - Private Utilities (Water/Sewer) - - - - - - - GO Bond Proceeds - - - - - - - Package 1 - Gen Govt - General Fund - - - - - - - Package 1 - Gen Govt - REET - - - - - - - Package 1 - Gen Govt - CDBG Fund - - - - - - - Package 1 - $20 VLF - - - 496,000 - - 496,000 Package 2 - Property Tax Excess Bond Levy - - - - - - - Unfunded - - - - - - -
Total Funding Sources -$ -$ -$ 496,000$ -$ -$ 496,000$
Project Costs 2015 2016 2017 2018 2019 2020 TotalDesign - - - 28,000 - - 28,000 Right-of-Way - - - - - - - Construction - - - 468,000 - - 468,000
Total Project Costs -$ -$ -$ 496,000$ -$ -$ 496,000$
Impact on Operating Funds 2015 2016 2017 2018 2019 2020 TotalRevenue Increase/(Decrease) -$ -$ -$ -$ -$ -$ -$ Expenditure Increase/(Decrease) - - - - - - -
Net M&O Impact -$ -$ -$ -$ -$ -$ -$
Overlay Project. Existing curb ramps upgraded to current ADA standards as required with all overlay projects.
None. Replacement of existing infrastructure.
105
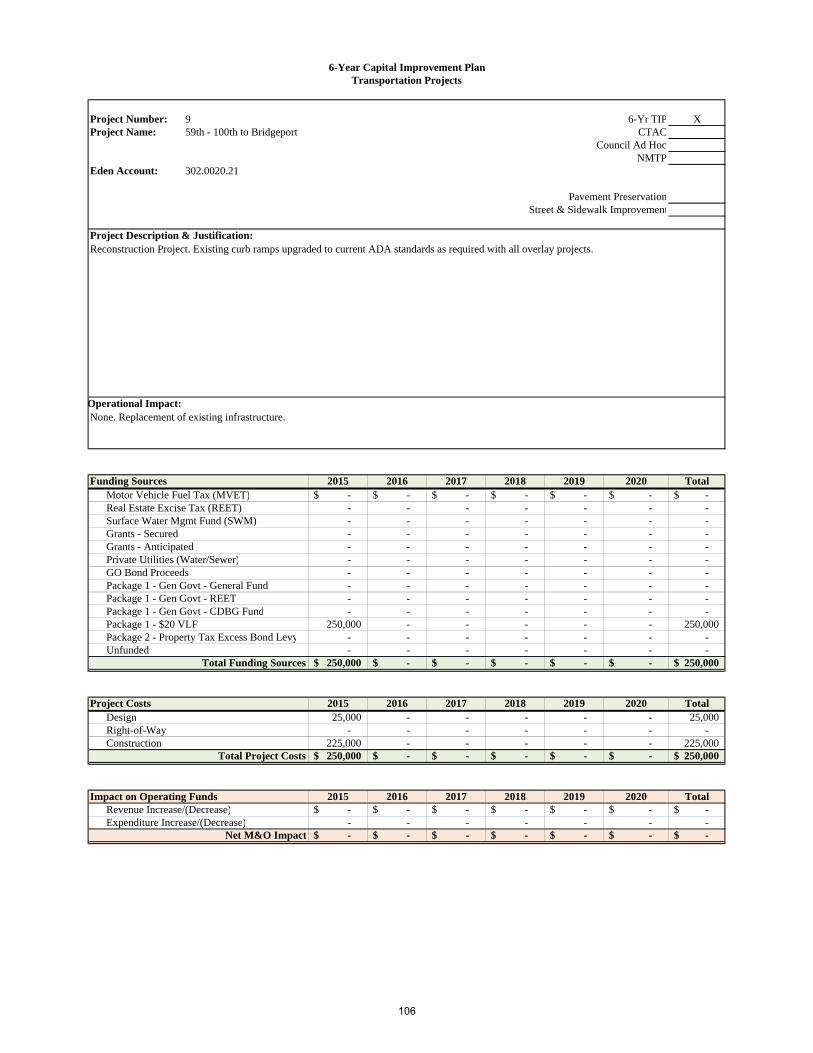
6-Year Capital Improvement PlanTransportation Projects
Project Number: 9 6-Yr TIP XProject Name: 59th - 100th to Bridgeport CTAC
Council Ad HocNMTP
Eden Account: 302.0020.21
Council Priority: Pavement PreservationPlanning Area: Street & Sidewalk Improvement
Project Description & Justification:
Operational Impact:
Funding Sources 2015 2016 2017 2018 2019 2020 TotalMotor Vehicle Fuel Tax (MVET) -$ -$ -$ -$ -$ -$ -$ Real Estate Excise Tax (REET) - - - - - - - Surface Water Mgmt Fund (SWM) - - - - - - - Grants - Secured - - - - - - - Grants - Anticipated - - - - - - - Private Utilities (Water/Sewer) - - - - - - - GO Bond Proceeds - - - - - - - Package 1 - Gen Govt - General Fund - - - - - - - Package 1 - Gen Govt - REET - - - - - - - Package 1 - Gen Govt - CDBG Fund - - - - - - - Package 1 - $20 VLF 250,000 - - - - - 250,000 Package 2 - Property Tax Excess Bond Levy - - - - - - - Unfunded - - - - - - -
Total Funding Sources 250,000$ -$ -$ -$ -$ -$ 250,000$
Project Costs 2015 2016 2017 2018 2019 2020 TotalDesign 25,000 - - - - - 25,000 Right-of-Way - - - - - - - Construction 225,000 - - - - - 225,000
Total Project Costs 250,000$ -$ -$ -$ -$ -$ 250,000$
Impact on Operating Funds 2015 2016 2017 2018 2019 2020 TotalRevenue Increase/(Decrease) -$ -$ -$ -$ -$ -$ -$ Expenditure Increase/(Decrease) - - - - - - -
Net M&O Impact -$ -$ -$ -$ -$ -$ -$
Reconstruction Project. Existing curb ramps upgraded to current ADA standards as required with all overlay projects.
None. Replacement of existing infrastructure.
106

6-Year Capital Improvement PlanTransportation Projects
Project Number: 10 6-Yr TIPProject Name: 108th - Bridgeport to Pac Hwy CTAC
Council Ad HocNMTP
Eden Account: 302.xxxx.21
Council Priority: Pavement PreservationPlanning Area: Street & Sidewalk Improvement
Project Description & Justification:
Operational Impact:
Funding Sources 2015 2016 2017 2018 2019 2020 TotalMotor Vehicle Fuel Tax (MVET) -$ -$ -$ -$ -$ -$ -$ Real Estate Excise Tax (REET) - - - - - - - Surface Water Mgmt Fund (SWM) - - - - - - - Grants - Secured - - - - - - - Grants - Anticipated - - - - - - - Private Utilities (Water/Sewer) - - - - - - - GO Bond Proceeds - - - - - - - Package 1 - Gen Govt - General Fund - - - - - - - Package 1 - Gen Govt - REET - - - - - - - Package 1 - Gen Govt - CDBG Fund - - - 661,000 - - 661,000 Package 1 - $20 VLF - - - - - - Package 2 - Property Tax Excess Bond Levy - - - - - - Unfunded - - - - - - -
Total Funding Sources -$ -$ -$ 661,000$ -$ -$ 661,000$
Project Costs 2015 2016 2017 2018 2019 2020 TotalDesign - - - 28,000 - - 28,000 Right-of-Way - - - - - - - Construction - - - 633,000 - - 633,000
Total Project Costs -$ -$ -$ 661,000$ -$ -$ 661,000$
Impact on Operating Funds 2015 2016 2017 2018 2019 2020 TotalRevenue Increase/(Decrease) -$ -$ -$ -$ -$ -$ -$ Expenditure Increase/(Decrease) - - - - - - -
Net M&O Impact -$ -$ -$ -$ -$ -$ -$
Reconstruction / Overlay Project. Existing curb ramps upgraded to current ADA standards as required with all overlay projects.
This project ($661,000) would be funded via a 108 CDBG loan paid back via the CDBG $300,000 annual commitment over the years 2018, 2019 and 2020.
None. Replacement of existing infrastructure.
107
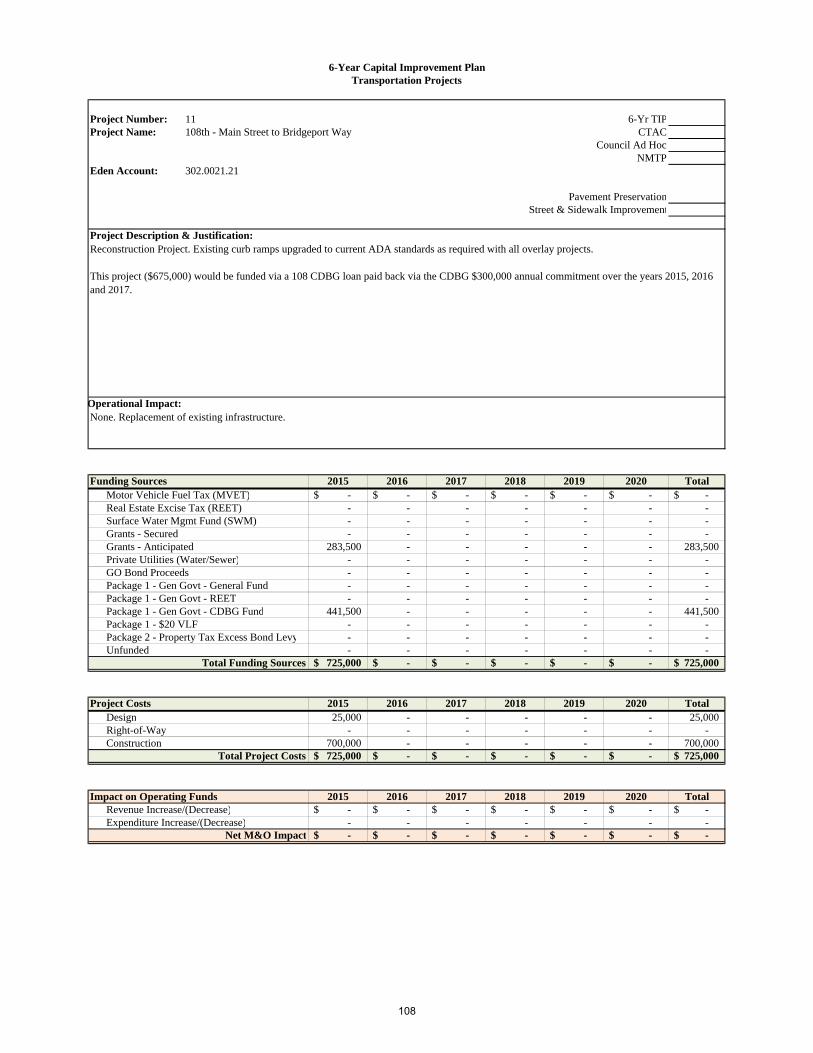
6-Year Capital Improvement PlanTransportation Projects
Project Number: 11 6-Yr TIPProject Name: 108th - Main Street to Bridgeport Way CTAC
Council Ad HocNMTP
Eden Account: 302.0021.21
Council Priority: Pavement PreservationPlanning Area: Street & Sidewalk Improvement
Project Description & Justification:
Operational Impact:
Funding Sources 2015 2016 2017 2018 2019 2020 TotalMotor Vehicle Fuel Tax (MVET) -$ -$ -$ -$ -$ -$ -$ Real Estate Excise Tax (REET) - - - - - - - Surface Water Mgmt Fund (SWM) - - - - - - - Grants - Secured - - - - - - - Grants - Anticipated 283,500 - - - - - 283,500 Private Utilities (Water/Sewer) - - - - - - - GO Bond Proceeds - - - - - - - Package 1 - Gen Govt - General Fund - - - - - - - Package 1 - Gen Govt - REET - - - - - - - Package 1 - Gen Govt - CDBG Fund 441,500 - - - - - 441,500 Package 1 - $20 VLF - - - - - - - Package 2 - Property Tax Excess Bond Levy - - - - - - - Unfunded - - - - - - -
Total Funding Sources 725,000$ -$ -$ -$ -$ -$ 725,000$
Project Costs 2015 2016 2017 2018 2019 2020 TotalDesign 25,000 - - - - - 25,000 Right-of-Way - - - - - - - Construction 700,000 - - - - - 700,000
Total Project Costs 725,000$ -$ -$ -$ -$ -$ 725,000$
Impact on Operating Funds 2015 2016 2017 2018 2019 2020 TotalRevenue Increase/(Decrease) -$ -$ -$ -$ -$ -$ -$ Expenditure Increase/(Decrease) - - - - - - -
Net M&O Impact -$ -$ -$ -$ -$ -$ -$
Reconstruction Project. Existing curb ramps upgraded to current ADA standards as required with all overlay projects.
This project ($675,000) would be funded via a 108 CDBG loan paid back via the CDBG $300,000 annual commitment over the years 2015, 2016 and 2017.
None. Replacement of existing infrastructure.
108
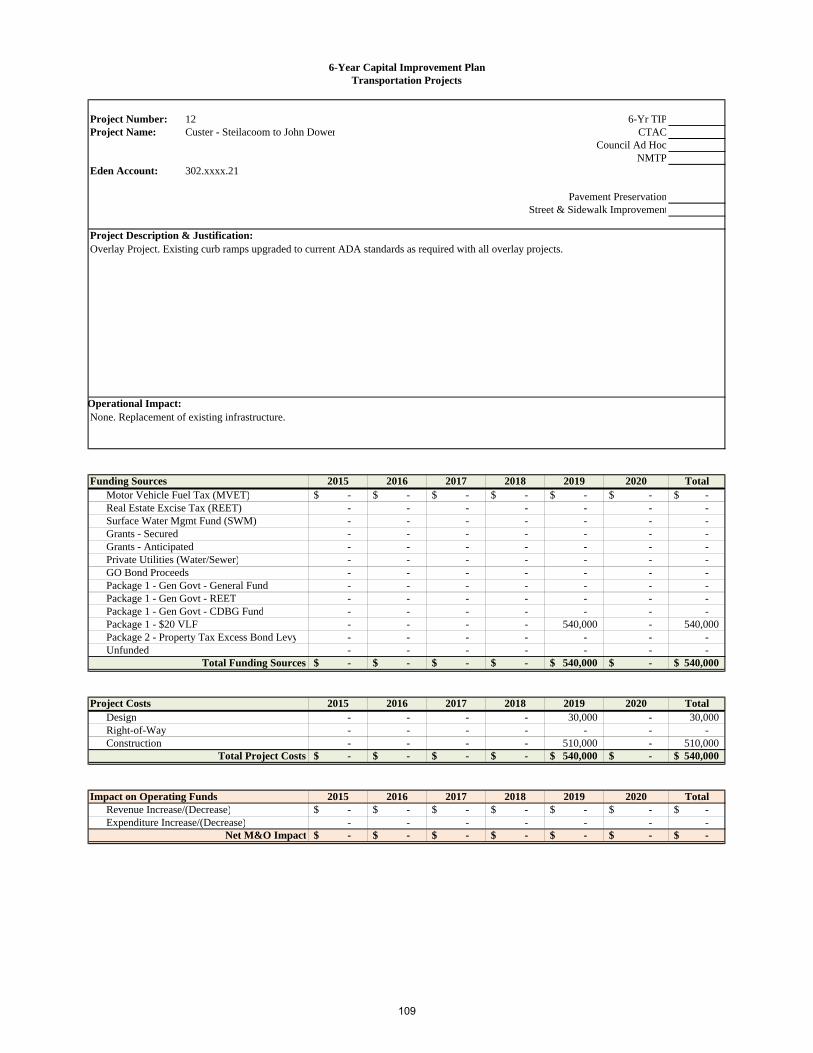
6-Year Capital Improvement PlanTransportation Projects
Project Number: 12 6-Yr TIPProject Name: Custer - Steilacoom to John Dower CTAC
Council Ad HocNMTP
Eden Account: 302.xxxx.21
Council Priority: Pavement PreservationPlanning Area: Street & Sidewalk Improvement
Project Description & Justification:
Operational Impact:
Funding Sources 2015 2016 2017 2018 2019 2020 TotalMotor Vehicle Fuel Tax (MVET) -$ -$ -$ -$ -$ -$ -$ Real Estate Excise Tax (REET) - - - - - - - Surface Water Mgmt Fund (SWM) - - - - - - - Grants - Secured - - - - - - - Grants - Anticipated - - - - - - - Private Utilities (Water/Sewer) - - - - - - - GO Bond Proceeds - - - - - - - Package 1 - Gen Govt - General Fund - - - - - - - Package 1 - Gen Govt - REET - - - - - - - Package 1 - Gen Govt - CDBG Fund - - - - - - - Package 1 - $20 VLF - - - - 540,000 - 540,000 Package 2 - Property Tax Excess Bond Levy - - - - - - - Unfunded - - - - - - -
Total Funding Sources -$ -$ -$ -$ 540,000$ -$ 540,000$
Project Costs 2015 2016 2017 2018 2019 2020 TotalDesign - - - - 30,000 - 30,000 Right-of-Way - - - - - - - Construction - - - - 510,000 - 510,000
Total Project Costs -$ -$ -$ -$ 540,000$ -$ 540,000$
Impact on Operating Funds 2015 2016 2017 2018 2019 2020 TotalRevenue Increase/(Decrease) -$ -$ -$ -$ -$ -$ -$ Expenditure Increase/(Decrease) - - - - - - -
Net M&O Impact -$ -$ -$ -$ -$ -$ -$
Overlay Project. Existing curb ramps upgraded to current ADA standards as required with all overlay projects.
None. Replacement of existing infrastructure.
109

6-Year Capital Improvement PlanTransportation Projects
Project Number: 13 6-Yr TIPProject Name: 88th -Steilacoom to Custer CTAC
Council Ad HocNMTP
Eden Account: 302.xxxx.21
Council Priority: Pavement PreservationPlanning Area: Street & Sidewalk Improvement
Project Description & Justification:
Operational Impact:
Funding Sources 2015 2016 2017 2018 2019 2020 TotalMotor Vehicle Fuel Tax (MVET) -$ -$ -$ -$ -$ -$ -$ Real Estate Excise Tax (REET) - - - - - - - Surface Water Mgmt Fund (SWM) - - - - - - - Grants - Secured - - - - - - - Grants - Anticipated - - - - - - - Private Utilities (Water/Sewer) - - - - - - - GO Bond Proceeds - - - - - - - Package 1 - Gen Govt - General Fund - - - - - - - Package 1 - Gen Govt - REET - - - - 132,500 - 132,500 Package 1 - Gen Govt - CDBG Fund - - - - - - - Package 1 - $20 VLF - - - - 142,500 - 142,500 Package 2 - Property Tax Excess Bond Levy - - - - - - - Unfunded - - - - - - -
Total Funding Sources -$ -$ -$ -$ 275,000$ -$ 275,000$
Project Costs 2015 2016 2017 2018 2019 2020 TotalDesign - - - - 27,500 - 27,500 Right-of-Way - - - - - - - Construction - - - - 247,500 - 247,500
Total Project Costs -$ -$ -$ -$ 275,000$ -$ 275,000$
Impact on Operating Funds 2015 2016 2017 2018 2019 2020 TotalRevenue Increase/(Decrease) -$ -$ -$ -$ -$ -$ -$ Expenditure Increase/(Decrease) - - - - - - -
Net M&O Impact -$ -$ -$ -$ -$ -$ -$
Overlay Project. Existing curb ramps upgraded to current ADA standards as required with all overlay projects.
None. Replacement of existing infrastructure.
110
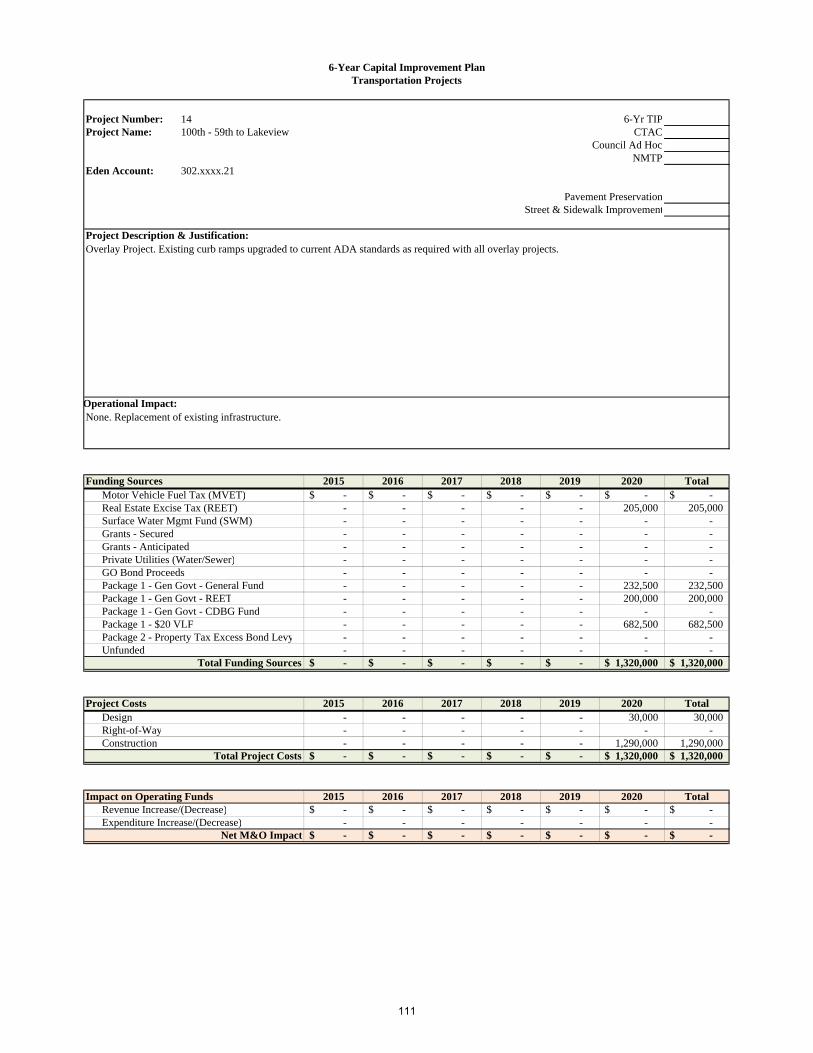
6-Year Capital Improvement PlanTransportation Projects
Project Number: 14 6-Yr TIPProject Name: 100th - 59th to Lakeview CTAC
Council Ad HocNMTP
Eden Account: 302.xxxx.21
Council Priority: Pavement PreservationPlanning Area: Street & Sidewalk Improvement
Project Description & Justification:
Operational Impact:
Funding Sources 2015 2016 2017 2018 2019 2020 TotalMotor Vehicle Fuel Tax (MVET) -$ -$ -$ -$ -$ -$ -$ Real Estate Excise Tax (REET) - - - - - 205,000 205,000 Surface Water Mgmt Fund (SWM) - - - - - - - Grants - Secured - - - - - - - Grants - Anticipated - - - - - - - Private Utilities (Water/Sewer) - - - - - - - GO Bond Proceeds - - - - - - - Package 1 - Gen Govt - General Fund - - - - - 232,500 232,500 Package 1 - Gen Govt - REET - - - - - 200,000 200,000 Package 1 - Gen Govt - CDBG Fund - - - - - - - Package 1 - $20 VLF - - - - - 682,500 682,500 Package 2 - Property Tax Excess Bond Levy - - - - - - - Unfunded - - - - - - -
Total Funding Sources -$ -$ -$ -$ -$ 1,320,000$ 1,320,000$
Project Costs 2015 2016 2017 2018 2019 2020 TotalDesign - - - - - 30,000 30,000 Right-of-Way - - - - - - - Construction - - - - - 1,290,000 1,290,000
Total Project Costs -$ -$ -$ -$ -$ 1,320,000$ 1,320,000$
Impact on Operating Funds 2015 2016 2017 2018 2019 2020 TotalRevenue Increase/(Decrease) -$ -$ -$ -$ -$ -$ -$ Expenditure Increase/(Decrease) - - - - - - -
Net M&O Impact -$ -$ -$ -$ -$ -$ -$
Overlay Project. Existing curb ramps upgraded to current ADA standards as required with all overlay projects.
None. Replacement of existing infrastructure.
111
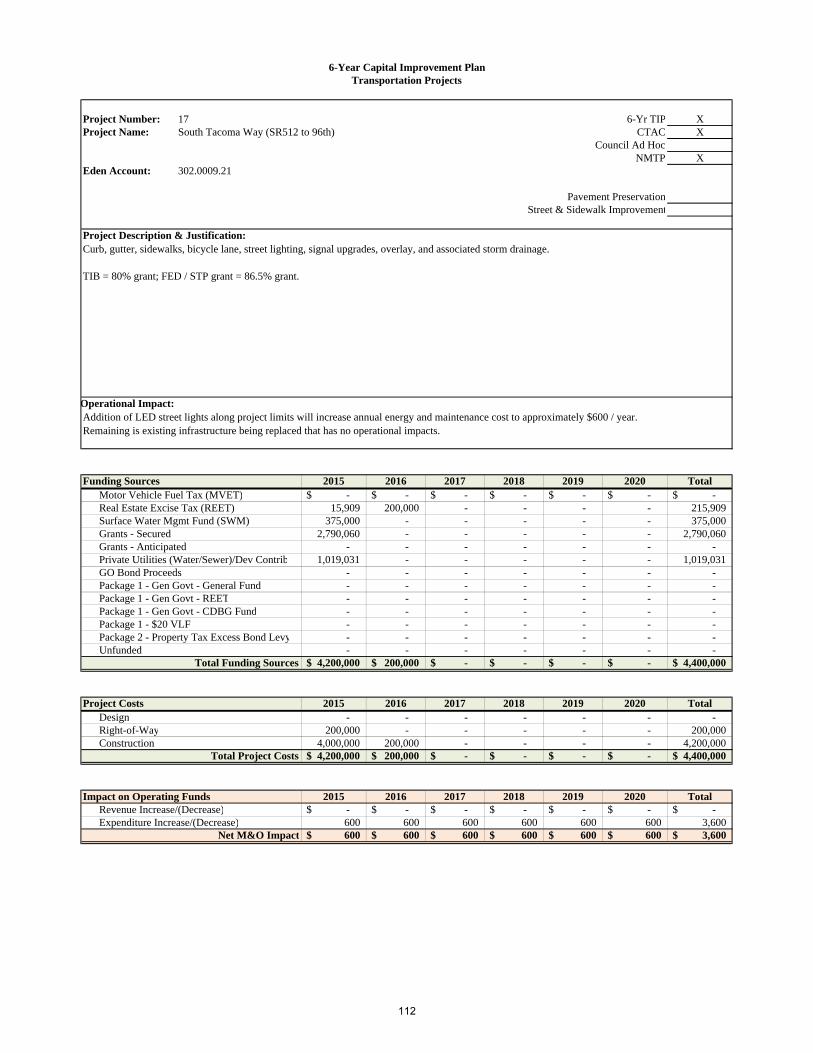
6-Year Capital Improvement PlanTransportation Projects
Project Number: 17 6-Yr TIP XProject Name: South Tacoma Way (SR512 to 96th) CTAC X
Council Ad HocNMTP X
Eden Account: 302.0009.21
Council Priority: Pavement PreservationPlanning Area: Street & Sidewalk Improvement
Project Description & Justification:
Operational Impact:
Funding Sources 2015 2016 2017 2018 2019 2020 TotalMotor Vehicle Fuel Tax (MVET) -$ -$ -$ -$ -$ -$ -$ Real Estate Excise Tax (REET) 15,909 200,000 - - - - 215,909 Surface Water Mgmt Fund (SWM) 375,000 - - - - - 375,000 Grants - Secured 2,790,060 - - - - - 2,790,060 Grants - Anticipated - - - - - - - Private Utilities (Water/Sewer)/Dev Contrib 1,019,031 - - - - - 1,019,031 GO Bond Proceeds - - - - - - - Package 1 - Gen Govt - General Fund - - - - - - - Package 1 - Gen Govt - REET - - - - - - - Package 1 - Gen Govt - CDBG Fund - - - - - - - Package 1 - $20 VLF - - - - - - - Package 2 - Property Tax Excess Bond Levy - - - - - - - Unfunded - - - - - - -
Total Funding Sources 4,200,000$ 200,000$ -$ -$ -$ -$ 4,400,000$
Project Costs 2015 2016 2017 2018 2019 2020 TotalDesign - - - - - - - Right-of-Way 200,000 - - - - - 200,000 Construction 4,000,000 200,000 - - - - 4,200,000
Total Project Costs 4,200,000$ 200,000$ -$ -$ -$ -$ 4,400,000$
Impact on Operating Funds 2015 2016 2017 2018 2019 2020 TotalRevenue Increase/(Decrease) -$ -$ -$ -$ -$ -$ -$ Expenditure Increase/(Decrease) 600 600 600 600 600 600 3,600
Net M&O Impact 600$ 600$ 600$ 600$ 600$ 600$ 3,600$
Curb, gutter, sidewalks, bicycle lane, street lighting, signal upgrades, overlay, and associated storm drainage.
TIB = 80% grant; FED / STP grant = 86.5% grant.
Addition of LED street lights along project limits will increase annual energy and maintenance cost to approximately $600 / year.Remaining is existing infrastructure being replaced that has no operational impacts.
112
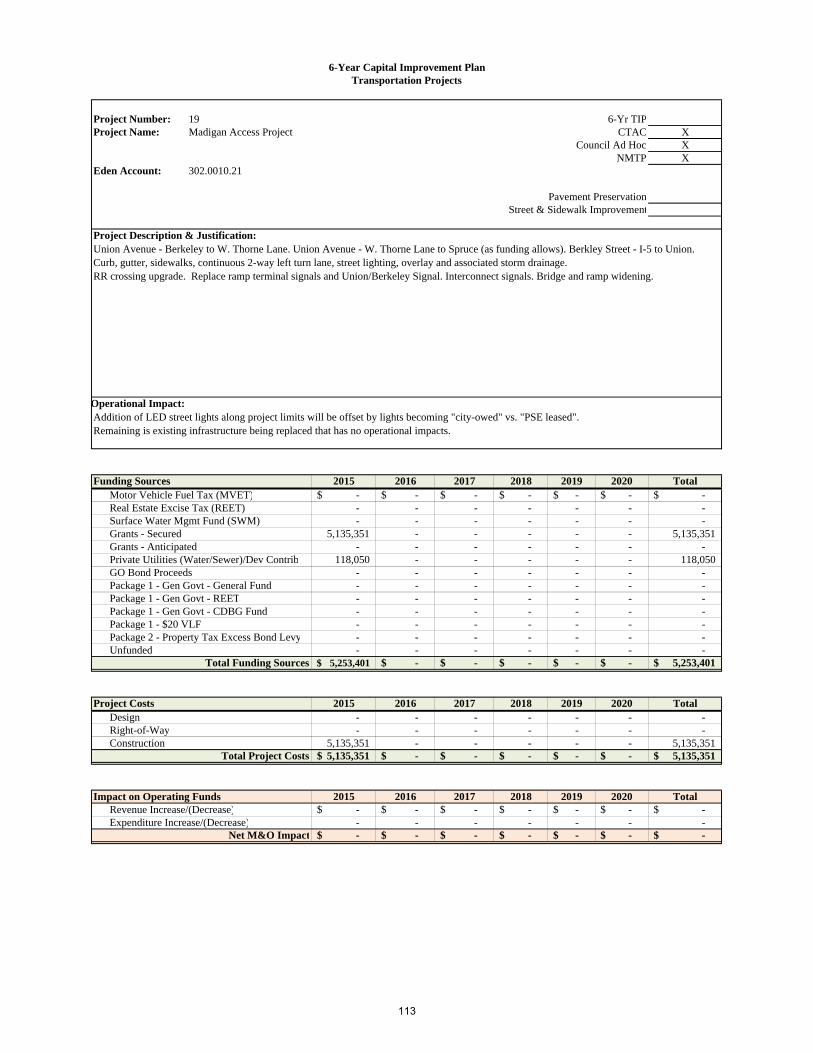
6-Year Capital Improvement PlanTransportation Projects
Project Number: 19 6-Yr TIPProject Name: Madigan Access Project CTAC X
Council Ad Hoc XNMTP X
Eden Account: 302.0010.21
Council Priority: Pavement PreservationPlanning Area: Street & Sidewalk Improvement
Project Description & Justification:
Operational Impact:
Funding Sources 2015 2016 2017 2018 2019 2020 TotalMotor Vehicle Fuel Tax (MVET) -$ -$ -$ -$ -$ -$ -$ Real Estate Excise Tax (REET) - - - - - - - Surface Water Mgmt Fund (SWM) - - - - - - - Grants - Secured 5,135,351 - - - - - 5,135,351 Grants - Anticipated - - - - - - - Private Utilities (Water/Sewer)/Dev Contrib 118,050 - - - - - 118,050 GO Bond Proceeds - - - - - - - Package 1 - Gen Govt - General Fund - - - - - - - Package 1 - Gen Govt - REET - - - - - - - Package 1 - Gen Govt - CDBG Fund - - - - - - - Package 1 - $20 VLF - - - - - - - Package 2 - Property Tax Excess Bond Levy - - - - - - - Unfunded - - - - - - -
Total Funding Sources 5,253,401$ -$ -$ -$ -$ -$ 5,253,401$
Project Costs 2015 2016 2017 2018 2019 2020 TotalDesign - - - - - - - Right-of-Way - - - - - - - Construction 5,135,351 - - - - - 5,135,351
Total Project Costs 5,135,351$ -$ -$ -$ -$ -$ 5,135,351$
Impact on Operating Funds 2015 2016 2017 2018 2019 2020 TotalRevenue Increase/(Decrease) -$ -$ -$ -$ -$ -$ -$ Expenditure Increase/(Decrease) - - - - - - -
Net M&O Impact -$ -$ -$ -$ -$ -$ -$
Union Avenue - Berkeley to W. Thorne Lane. Union Avenue - W. Thorne Lane to Spruce (as funding allows). Berkley Street - I-5 to Union.Curb, gutter, sidewalks, continuous 2-way left turn lane, street lighting, overlay and associated storm drainage.RR crossing upgrade. Replace ramp terminal signals and Union/Berkeley Signal. Interconnect signals. Bridge and ramp widening.
Addition of LED street lights along project limits will be offset by lights becoming "city-owed" vs. "PSE leased". Remaining is existing infrastructure being replaced that has no operational impacts.
113

6-Year Capital Improvement PlanTransportation Projects
Project Number: 20 6-Yr TIP XProject Name: South Tacoma Way - Steilacoom to 88th CTAC
Council Ad HocNMTP
Eden Account: 302.0014.21
Council Priority: Pavement PreservationPlanning Area: Street & Sidewalk Improvement
Project Description & Justification:
Operational Impact:No impacts - replacement of existing infrastructure
Funding Sources 2015 2016 2017 2018 2019 2020 TotalMotor Vehicle Fuel Tax (MVET) -$ -$ -$ -$ -$ -$ -$ Real Estate Excise Tax (REET) 80,727 100,000 - - - - 180,727 Surface Water Mgmt Fund (SWM) 100,000 - - - - 100,000 Grants - Secured 1,194,273 - - - - 1,194,273 Grants - Anticipated 80,000 - - - - - 80,000 Private Utilities (Water/Sewer) - - - - - - - GO Bond Proceeds - - - - - - Package 1 - Gen Govt - General Fund 65,000 - - - - - 65,000 Package 1 - Gen Govt - REET - - - - - - - Package 1 - Gen Govt - CDBG Fund - - - - - - - Package 1 - $20 VLF - - - - - - - Package 2 - Property Tax Excess Bond Levy - - - - - - - Unfunded - - - - - - -
Total Funding Sources 1,520,000$ 100,000$ -$ -$ -$ -$ 1,620,000$
Project Costs 2015 2016 2017 2018 2019 2020 TotalDesign 260,000 - - - - - 260,000 Right-of-Way 100,000 - - - - - 100,000 Construction 1,160,000 100,000 - - - - 1,260,000
Total Project Costs 1,520,000$ 100,000$ -$ -$ -$ -$ 1,620,000$
Impact on Operating Funds 2015 2016 2017 2018 2019 2020 TotalRevenue Increase/(Decrease) -$ -$ -$ -$ -$ -$ -$ Expenditure Increase/(Decrease) - - - - - - -
Net M&O Impact -$ -$ -$ -$ -$ -$ -$
Road widening, curb gutter, sidewalks (both sides), access management, associated storm drainage, signal replacmenet, HMA Overlay.
TIB Grant: 80%
114
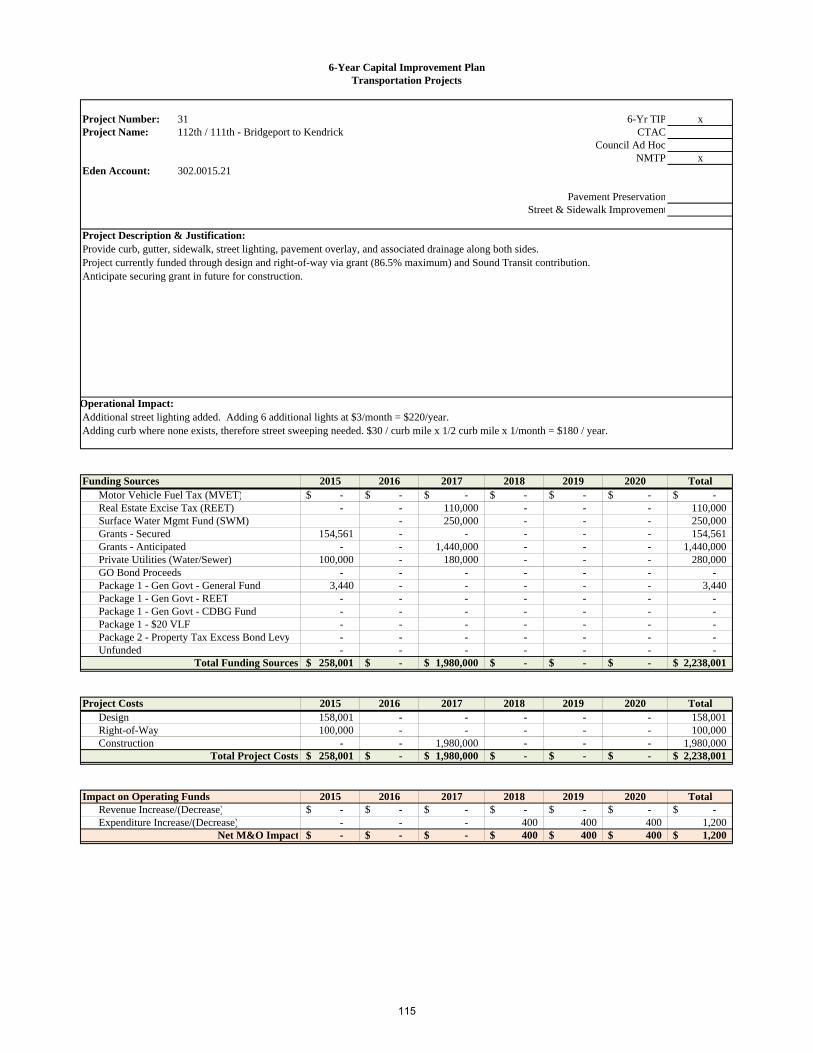
6-Year Capital Improvement PlanTransportation Projects
Project Number: 31 6-Yr TIP xProject Name: 112th / 111th - Bridgeport to Kendrick CTAC
Council Ad HocNMTP x
Eden Account: 302.0015.21
Council Priority: Pavement PreservationPlanning Area: Street & Sidewalk Improvement
Project Description & Justification:
Operational Impact:
Funding Sources 2015 2016 2017 2018 2019 2020 TotalMotor Vehicle Fuel Tax (MVET) -$ -$ -$ -$ -$ -$ -$ Real Estate Excise Tax (REET) - - 110,000 - - - 110,000 Surface Water Mgmt Fund (SWM) - 250,000 - - - 250,000 Grants - Secured 154,561 - - - - - 154,561 Grants - Anticipated - - 1,440,000 - - - 1,440,000 Private Utilities (Water/Sewer) 100,000 - 180,000 - - - 280,000 GO Bond Proceeds - - - - - - - Package 1 - Gen Govt - General Fund 3,440 - - - - - 3,440 Package 1 - Gen Govt - REET - - - - - - - Package 1 - Gen Govt - CDBG Fund - - - - - - - Package 1 - $20 VLF - - - - - - - Package 2 - Property Tax Excess Bond Levy - - - - - - - Unfunded - - - - - - -
Total Funding Sources 258,001$ -$ 1,980,000$ -$ -$ -$ 2,238,001$
Project Costs 2015 2016 2017 2018 2019 2020 TotalDesign 158,001 - - - - - 158,001 Right-of-Way 100,000 - - - - - 100,000 Construction - - 1,980,000 - - - 1,980,000
Total Project Costs 258,001$ -$ 1,980,000$ -$ -$ -$ 2,238,001$
Impact on Operating Funds 2015 2016 2017 2018 2019 2020 TotalRevenue Increase/(Decrease) -$ -$ -$ -$ -$ -$ -$ Expenditure Increase/(Decrease) - - - 400 400 400 1,200
Net M&O Impact -$ -$ -$ 400$ 400$ 400$ 1,200$
Provide curb, gutter, sidewalk, street lighting, pavement overlay, and associated drainage along both sides.Project currently funded through design and right-of-way via grant (86.5% maximum) and Sound Transit contribution.Anticipate securing grant in future for construction.
Additional street lighting added. Adding 6 additional lights at $3/month = $220/year.Adding curb where none exists, therefore street sweeping needed. $30 / curb mile x 1/2 curb mile x 1/month = $180 / year.
115

6-Year Capital Improvement PlanTransportation Projects
Project Number: 32 6-Yr TIP xProject Name: Bridgeport Way - JBLM to I-5 CTAC
Council Ad HocNMTP x
Eden Account: 302.0013.21
Council Priority: Pavement PreservationPlanning Area: Street & Sidewalk Improvement
Project Description & Justification:
Operational Impact:
Funding Sources 2015 2016 2017 2018 2019 2020 TotalMotor Vehicle Fuel Tax (MVET) -$ -$ -$ -$ -$ -$ -$ Real Estate Excise Tax (REET) - - - - - - - Surface Water Mgmt Fund (SWM) 486,329 - - - - - 486,329 Grants - Secured - - - - - - - Grants - Anticipated 3,078,671 - - - - - 3,078,671 Private Developer 185,000 - - - - - 185,000 GO Bond Proceeds - - - - - - - Package 1 - Gen Govt - General Fund - - - - - - - Package 1 - Gen Govt - REET - - - - - - - Package 1 - Gen Govt - CDBG Fund - - - - - - - Package 1 - $20 VLF - - - - - - - Package 2 - Property Tax Excess Bond Levy - - - - - - - Unfunded - - - - - - -
Total Funding Sources 3,750,000$ -$ -$ -$ -$ -$ 3,750,000$
Project Costs 2015 2016 2017 2018 2019 2020 TotalDesign 250,000 - - - - - 250,000 Right-of-Way - - - - - - - Construction 3,500,000 - - - - - 3,500,000
Total Project Costs 3,750,000$ -$ -$ -$ -$ -$ 3,750,000$
Impact on Operating Funds 2015 2016 2017 2018 2019 2020 TotalRevenue Increase/(Decrease) -$ -$ -$ -$ -$ -$ -$ Expenditure Increase/(Decrease) - 900 900 900 900 900 4,500
Net M&O Impact -$ 900$ 900$ 900$ 900$ 900$ 4,500$
Curb, gutter, sidewalks, bike lanes, street lighting, pavement reconstruction.
Private developer contribution of $185,000 anticipated for construction.
Currently have secured grant for design (in progress in 2014…final in 2015). New grant award for construction.
Max 86.5% grant match.
Additional street lighting added. Adding 15 additional lights at $3/month = $540/year.Adding curb where none exists, therefore street sweeping needed. $30 / curb mile x 1 curb mile x 1/month = $360 / year.
116
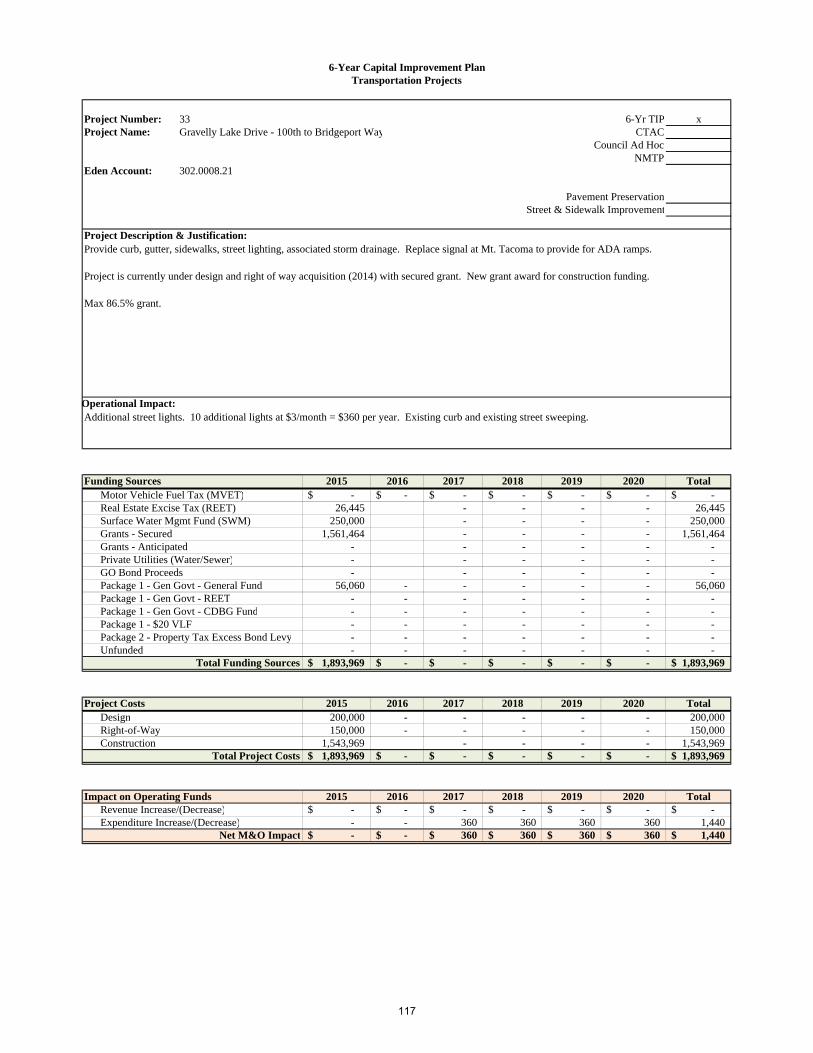
6-Year Capital Improvement PlanTransportation Projects
Project Number: 33 6-Yr TIP xProject Name: Gravelly Lake Drive - 100th to Bridgeport Way CTAC
Council Ad HocNMTP
Eden Account: 302.0008.21
Council Priority: Pavement PreservationPlanning Area: Street & Sidewalk Improvement
Project Description & Justification:
Operational Impact:
Funding Sources 2015 2016 2017 2018 2019 2020 TotalMotor Vehicle Fuel Tax (MVET) -$ -$ -$ -$ -$ -$ -$ Real Estate Excise Tax (REET) 26,445 - - - - 26,445 Surface Water Mgmt Fund (SWM) 250,000 - - - - 250,000 Grants - Secured 1,561,464 - - - - 1,561,464 Grants - Anticipated - - - - - - Private Utilities (Water/Sewer) - - - - - - GO Bond Proceeds - - - - - - Package 1 - Gen Govt - General Fund 56,060 - - - - - 56,060 Package 1 - Gen Govt - REET - - - - - - - Package 1 - Gen Govt - CDBG Fund - - - - - - - Package 1 - $20 VLF - - - - - - - Package 2 - Property Tax Excess Bond Levy - - - - - - - Unfunded - - - - - - -
Total Funding Sources 1,893,969$ -$ -$ -$ -$ -$ 1,893,969$
Project Costs 2015 2016 2017 2018 2019 2020 TotalDesign 200,000 - - - - - 200,000 Right-of-Way 150,000 - - - - - 150,000 Construction 1,543,969 - - - - 1,543,969
Total Project Costs 1,893,969$ -$ -$ -$ -$ -$ 1,893,969$
Impact on Operating Funds 2015 2016 2017 2018 2019 2020 TotalRevenue Increase/(Decrease) -$ -$ -$ -$ -$ -$ -$ Expenditure Increase/(Decrease) - - 360 360 360 360 1,440
Net M&O Impact -$ -$ 360$ 360$ 360$ 360$ 1,440$
Provide curb, gutter, sidewalks, street lighting, associated storm drainage. Replace signal at Mt. Tacoma to provide for ADA ramps.
Project is currently under design and right of way acquisition (2014) with secured grant. New grant award for construction funding.
Max 86.5% grant.
Additional street lights. 10 additional lights at $3/month = $360 per year. Existing curb and existing street sweeping.
117
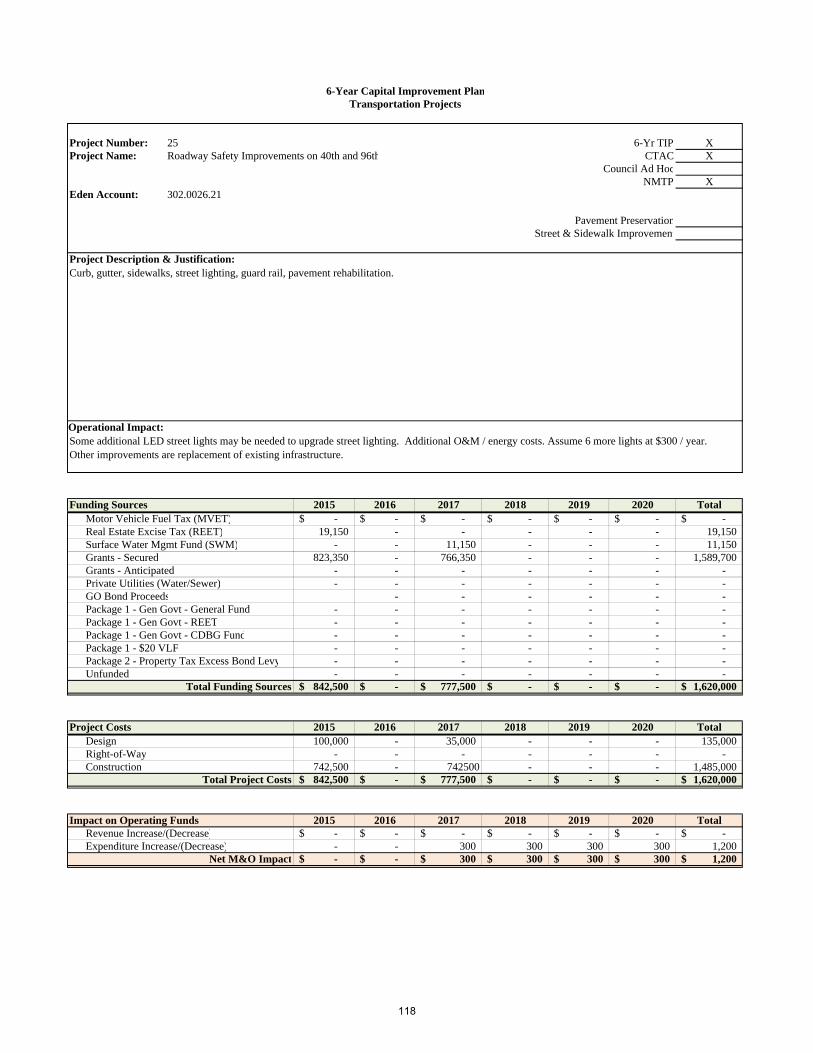
6-Year Capital Improvement PlanTransportation Projects
Project Number: 25 6-Yr TIP XProject Name: Roadway Safety Improvements on 40th and 96th CTAC X
Council Ad HocNMTP X
Eden Account: 302.0026.21
Council Priority: Pavement PreservationPlanning Area: Street & Sidewalk Improvement
Project Description & Justification:
Operational Impact:
Funding Sources 2015 2016 2017 2018 2019 2020 TotalMotor Vehicle Fuel Tax (MVET) -$ -$ -$ -$ -$ -$ -$ Real Estate Excise Tax (REET) 19,150 - - - - - 19,150 Surface Water Mgmt Fund (SWM) - - 11,150 - - - 11,150 Grants - Secured 823,350 - 766,350 - - - 1,589,700 Grants - Anticipated - - - - - - - Private Utilities (Water/Sewer) - - - - - - - GO Bond Proceeds - - - - - - Package 1 - Gen Govt - General Fund - - - - - - - Package 1 - Gen Govt - REET - - - - - - - Package 1 - Gen Govt - CDBG Fund - - - - - - - Package 1 - $20 VLF - - - - - - - Package 2 - Property Tax Excess Bond Levy - - - - - - - Unfunded - - - - - - -
Total Funding Sources 842,500$ -$ 777,500$ -$ -$ -$ 1,620,000$
Project Costs 2015 2016 2017 2018 2019 2020 TotalDesign 100,000 - 35,000 - - - 135,000 Right-of-Way - - - - - - - Construction 742,500 - 742500 - - - 1,485,000
Total Project Costs 842,500$ -$ 777,500$ -$ -$ -$ 1,620,000$
Impact on Operating Funds 2015 2016 2017 2018 2019 2020 TotalRevenue Increase/(Decrease) -$ -$ -$ -$ -$ -$ -$ Expenditure Increase/(Decrease) - - 300 300 300 300 1,200
Net M&O Impact -$ -$ 300$ 300$ 300$ 300$ 1,200$
Curb, gutter, sidewalks, street lighting, guard rail, pavement rehabilitation.
Some additional LED street lights may be needed to upgrade street lighting. Additional O&M / energy costs. Assume 6 more lights at $300 / year.Other improvements are replacement of existing infrastructure.
118
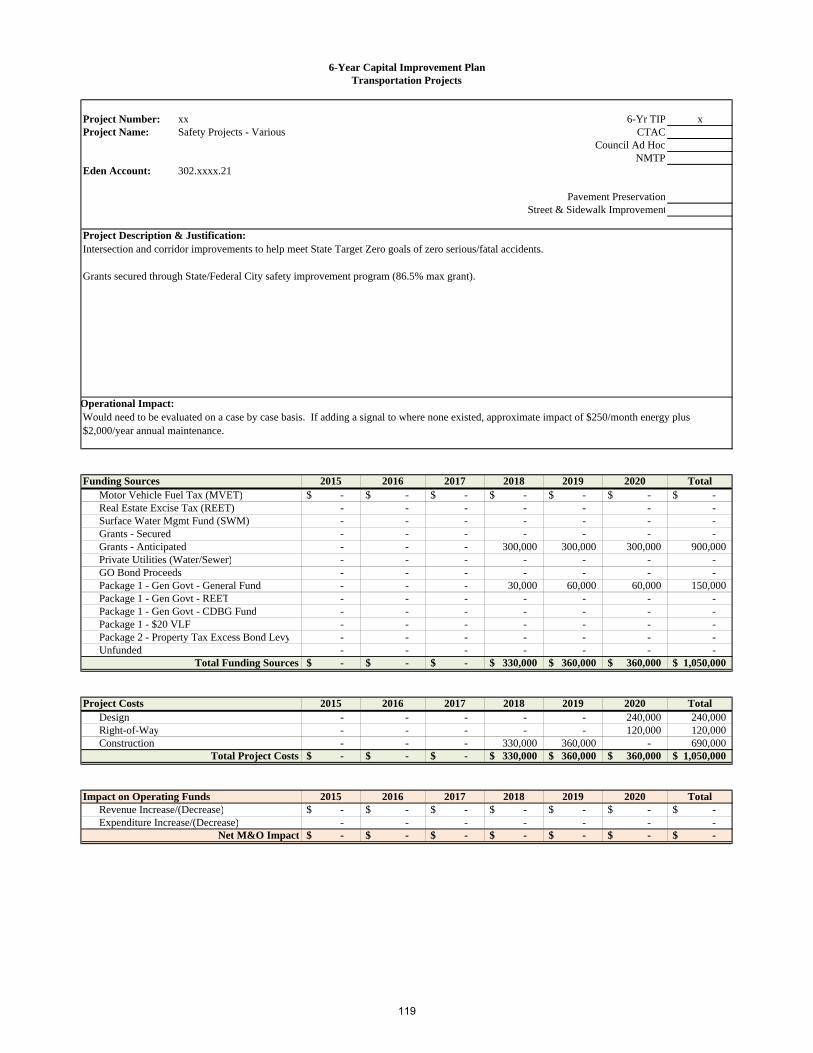
6-Year Capital Improvement PlanTransportation Projects
Project Number: xx 6-Yr TIP xProject Name: Safety Projects - Various CTAC
Council Ad HocNMTP
Eden Account: 302.xxxx.21
Council Priority: Pavement PreservationPlanning Area: Street & Sidewalk Improvement
Project Description & Justification:
Operational Impact:
Funding Sources 2015 2016 2017 2018 2019 2020 TotalMotor Vehicle Fuel Tax (MVET) -$ -$ -$ -$ -$ -$ -$ Real Estate Excise Tax (REET) - - - - - - - Surface Water Mgmt Fund (SWM) - - - - - - - Grants - Secured - - - - - - - Grants - Anticipated - - - 300,000 300,000 300,000 900,000 Private Utilities (Water/Sewer) - - - - - - - GO Bond Proceeds - - - - - - - Package 1 - Gen Govt - General Fund - - - 30,000 60,000 60,000 150,000 Package 1 - Gen Govt - REET - - - - - - - Package 1 - Gen Govt - CDBG Fund - - - - - - - Package 1 - $20 VLF - - - - - - - Package 2 - Property Tax Excess Bond Levy - - - - - - - Unfunded - - - - - - -
Total Funding Sources -$ -$ -$ 330,000$ 360,000$ 360,000$ 1,050,000$
Project Costs 2015 2016 2017 2018 2019 2020 TotalDesign - - - - - 240,000 240,000 Right-of-Way - - - - - 120,000 120,000 Construction - - - 330,000 360,000 - 690,000
Total Project Costs -$ -$ -$ 330,000$ 360,000$ 360,000$ 1,050,000$
Impact on Operating Funds 2015 2016 2017 2018 2019 2020 TotalRevenue Increase/(Decrease) -$ -$ -$ -$ -$ -$ -$ Expenditure Increase/(Decrease) - - - - - - -
Net M&O Impact -$ -$ -$ -$ -$ -$ -$
Intersection and corridor improvements to help meet State Target Zero goals of zero serious/fatal accidents.
Grants secured through State/Federal City safety improvement program (86.5% max grant).
Would need to be evaluated on a case by case basis. If adding a signal to where none existed, approximate impact of $250/month energy plus $2,000/year annual maintenance.
119
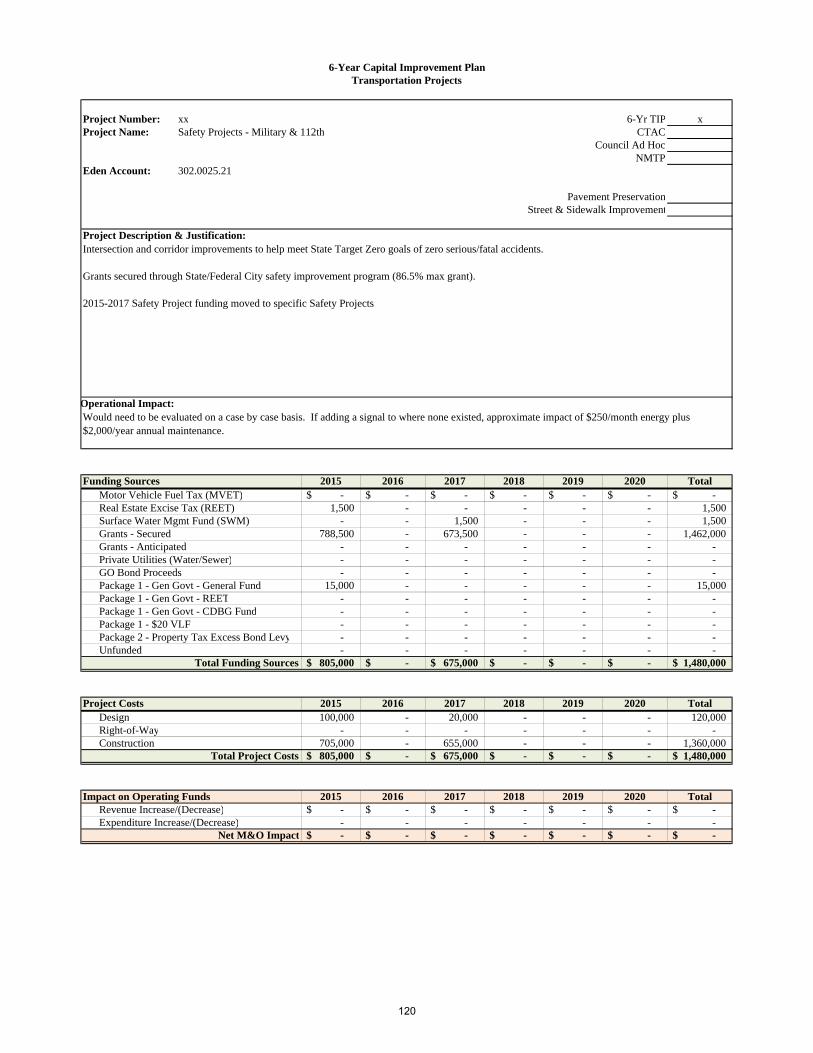
6-Year Capital Improvement PlanTransportation Projects
Project Number: xx 6-Yr TIP xProject Name: Safety Projects - Military & 112th CTAC
Council Ad HocNMTP
Eden Account: 302.0025.21
Council Priority: Pavement PreservationPlanning Area: Street & Sidewalk Improvement
Project Description & Justification:
Operational Impact:
Funding Sources 2015 2016 2017 2018 2019 2020 TotalMotor Vehicle Fuel Tax (MVET) -$ -$ -$ -$ -$ -$ -$ Real Estate Excise Tax (REET) 1,500 - - - - - 1,500 Surface Water Mgmt Fund (SWM) - - 1,500 - - - 1,500 Grants - Secured 788,500 - 673,500 - - - 1,462,000 Grants - Anticipated - - - - - - - Private Utilities (Water/Sewer) - - - - - - - GO Bond Proceeds - - - - - - - Package 1 - Gen Govt - General Fund 15,000 - - - - - 15,000 Package 1 - Gen Govt - REET - - - - - - - Package 1 - Gen Govt - CDBG Fund - - - - - - - Package 1 - $20 VLF - - - - - - - Package 2 - Property Tax Excess Bond Levy - - - - - - - Unfunded - - - - - - -
Total Funding Sources 805,000$ -$ 675,000$ -$ -$ -$ 1,480,000$
Project Costs 2015 2016 2017 2018 2019 2020 TotalDesign 100,000 - 20,000 - - - 120,000 Right-of-Way - - - - - - - Construction 705,000 - 655,000 - - - 1,360,000
Total Project Costs 805,000$ -$ 675,000$ -$ -$ -$ 1,480,000$
Impact on Operating Funds 2015 2016 2017 2018 2019 2020 TotalRevenue Increase/(Decrease) -$ -$ -$ -$ -$ -$ -$ Expenditure Increase/(Decrease) - - - - - - -
Net M&O Impact -$ -$ -$ -$ -$ -$ -$
Intersection and corridor improvements to help meet State Target Zero goals of zero serious/fatal accidents.
Grants secured through State/Federal City safety improvement program (86.5% max grant).
2015-2017 Safety Project funding moved to specific Safety Projects
Would need to be evaluated on a case by case basis. If adding a signal to where none existed, approximate impact of $250/month energy plus $2,000/year annual maintenance.
120

6-Year Capital Improvement PlanTransportation Projects
Project Number: xx 6-Yr TIP xProject Name: Safe Routes to Schools / Bike / Ped - Various CTAC
Council Ad HocNMTP x
Eden Account: 302.0027.21
Council Priority: Pavement PreservationPlanning Area: Street & Sidewalk Improvement
Project Description & Justification:
Operational Impact:
Funding Sources 2015 2016 2017 2018 2019 2020 TotalMotor Vehicle Fuel Tax (MVET) -$ -$ -$ -$ -$ -$ -$ Real Estate Excise Tax (REET) - - 70,000 42,000 30,000 70,000 212,000 Surface Water Mgmt Fund (SWM) - - - 150,000 - - 150,000 Grants - Secured - - - - - - - Grants - Anticipated - - 280,000 1,120,000 120,000 280,000 1,800,000 Private Utilities (Water/Sewer) - - - - - - - GO Bond Proceeds - - - - - - - Package 1 - Gen Govt - General Fund 35,000 228,000 30,000 6,000 299,000 Package 1 - Gen Govt - REET - - - - - - - Package 1 - Gen Govt - CDBG Fund - - - - - 64,000 64,000 Package 1 - $20 VLF - - - - - - Package 2 - Property Tax Excess Bond LevyUnfunded - - - - - - -
Total Funding Sources -$ -$ 385,000$ 1,540,000$ 180,000$ 420,000$ 2,525,000$
Project Costs 2015 2016 2017 2018 2019 2020 TotalDesign - - 55,000 - 180,000 60,000 295,000 Right-of-Way - - 330,000 - - 360,000 690,000 Construction - - - 1,540,000 - - 1,540,000
Total Project Costs -$ -$ 385,000$ 1,540,000$ 180,000$ 420,000$ 2,525,000$
Impact on Operating Funds 2015 2016 2017 2018 2019 2020 TotalRevenue Increase/(Decrease) -$ -$ -$ -$ -$ -$ -$ Expenditure Increase/(Decrease) - - - - - - -
Net M&O Impact -$ -$ -$ -$ -$ -$ -$
Provide / improve sidewalk and bicycle facilities related to "Safe Routes to Schools" and "Pedestrian / Bicycle Safety" (and other) grant programs. Approximately 80% grant.
This is a place holder for potential grant award. Will need to be updated to reflect actual grant scope and budget.
The 2020 project is proposed to be funded by $64,000 of CDBG funds, which comes from a portion of the remaining balance of 2020 CDBG Funds after allocation of $661,000 to Project 10 108th - Bridgeport to Pacific Highway.
Would need to be evaluated on a case by case basis. Additional O&M costs include: street lighting, signs, pavement markings, signals, and street sweeping.
121
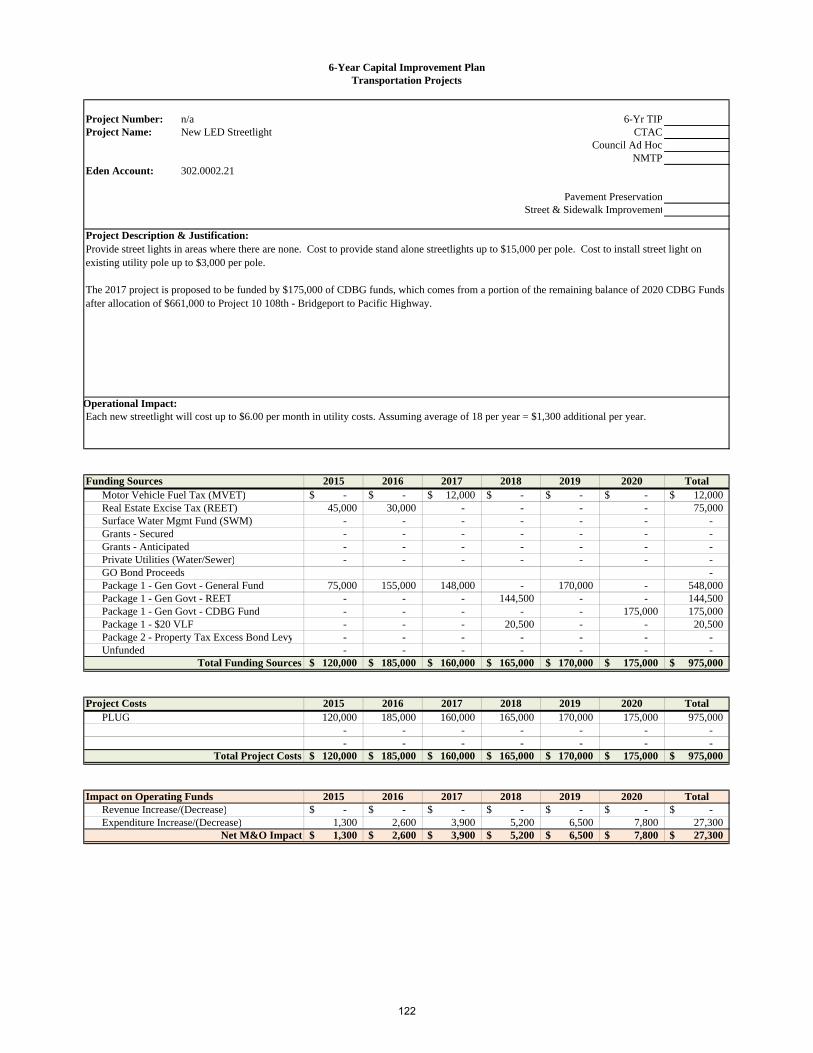
6-Year Capital Improvement PlanTransportation Projects
Project Number: n/a 6-Yr TIPProject Name: New LED Streetlight CTAC
Council Ad HocNMTP
Eden Account: 302.0002.21
Council Priority: Pavement PreservationPlanning Area: Street & Sidewalk Improvement
Project Description & Justification:
Operational Impact:Each new streetlight will cost up to $6.00 per month in utility costs. Assuming average of 18 per year = $1,300 additional per year.
Funding Sources 2015 2016 2017 2018 2019 2020 TotalMotor Vehicle Fuel Tax (MVET) -$ -$ 12,000$ -$ -$ -$ 12,000$ Real Estate Excise Tax (REET) 45,000 30,000 - - - - 75,000 Surface Water Mgmt Fund (SWM) - - - - - - - Grants - Secured - - - - - - - Grants - Anticipated - - - - - - - Private Utilities (Water/Sewer) - - - - - - - GO Bond Proceeds - Package 1 - Gen Govt - General Fund 75,000 155,000 148,000 - 170,000 - 548,000 Package 1 - Gen Govt - REET - - - 144,500 - - 144,500 Package 1 - Gen Govt - CDBG Fund - - - - - 175,000 175,000 Package 1 - $20 VLF - - - 20,500 - - 20,500 Package 2 - Property Tax Excess Bond Levy - - - - - - - Unfunded - - - - - - -
Total Funding Sources 120,000$ 185,000$ 160,000$ 165,000$ 170,000$ 175,000$ 975,000$
Project Costs 2015 2016 2017 2018 2019 2020 TotalPLUG 120,000 185,000 160,000 165,000 170,000 175,000 975,000
- - - - - - - - - - - - - -
Total Project Costs 120,000$ 185,000$ 160,000$ 165,000$ 170,000$ 175,000$ 975,000$
Impact on Operating Funds 2015 2016 2017 2018 2019 2020 TotalRevenue Increase/(Decrease) -$ -$ -$ -$ -$ -$ -$ Expenditure Increase/(Decrease) 1,300 2,600 3,900 5,200 6,500 7,800 27,300
Net M&O Impact 1,300$ 2,600$ 3,900$ 5,200$ 6,500$ 7,800$ 27,300$
Provide street lights in areas where there are none. Cost to provide stand alone streetlights up to $15,000 per pole. Cost to install street light on existing utility pole up to $3,000 per pole.
The 2017 project is proposed to be funded by $175,000 of CDBG funds, which comes from a portion of the remaining balance of 2020 CDBG Funds after allocation of $661,000 to Project 10 108th - Bridgeport to Pacific Highway.
122

6-Year Capital Improvement PlanTransportation Projects
Project Number: n/a 6-Yr TIPProject Name: Signal Projects CTAC
Council Ad HocNMTP
Eden Account: 302.xxxx.21
Council Priority: Pavement PreservationPlanning Area: Street & Sidewalk Improvement
Project Description & Justification:
Operational Impact:
Funding Sources 2015 2016 2017 2018 2019 2020 TotalMotor Vehicle Fuel Tax (MVET) -$ -$ -$ -$ -$ -$ -$ Real Estate Excise Tax (REET) - - - - 300,000 - 300,000 Surface Water Mgmt Fund (SWM) - - - - - - - Grants - Secured - - - - - - - Grants - Anticipated - - - - - - - Private Utilities (Water/Sewer) - - - - - - - GO Bond ProceedsPackage 1 - Gen Govt - General Fund - - 155,000 - 60,000 - 215,000 Package 1 - Gen Govt - REETPackage 1 - Gen Govt - CDBG Fund - - 175,000 - - - 175,000 Package 1 - $20 VLF - - - - - - - Package 2 - Property Tax Excess Bond Levy - - - - - - - Unfunded - - - - - - -
Total Funding Sources -$ -$ 330,000$ -$ 360,000$ -$ 690,000$
Project Costs 2015 2016 2017 2018 2019 2020 TotalPLUG - - 330,000 - 360,000 - 690,000
- - - - - - - - - - - - - -
Total Project Costs -$ -$ 330,000$ -$ 360,000$ -$ 690,000$
Impact on Operating Funds 2015 2016 2017 2018 2019 2020 TotalRevenue Increase/(Decrease) -$ -$ -$ -$ -$ -$ -$ Expenditure Increase/(Decrease) - - - - - - -
Net M&O Impact -$ -$ -$ -$ -$ -$ -$
Traffic signal replacement program to replace existing aging traffic signals (30+ years usefull life) that are not replaced in conjuction with other capital improvement projects. Replace a traffic signal every 2 to 3 years.
The 2017 signal project is proposed to be funded by $225,000 of CDBG funds, which comes from the balance of 2017 CDBG Funds after allocation of $675,000 to Project 11 108th - Main Street to Bridgeport.
No operational impact since this is replacement of existing infrastructure.
123
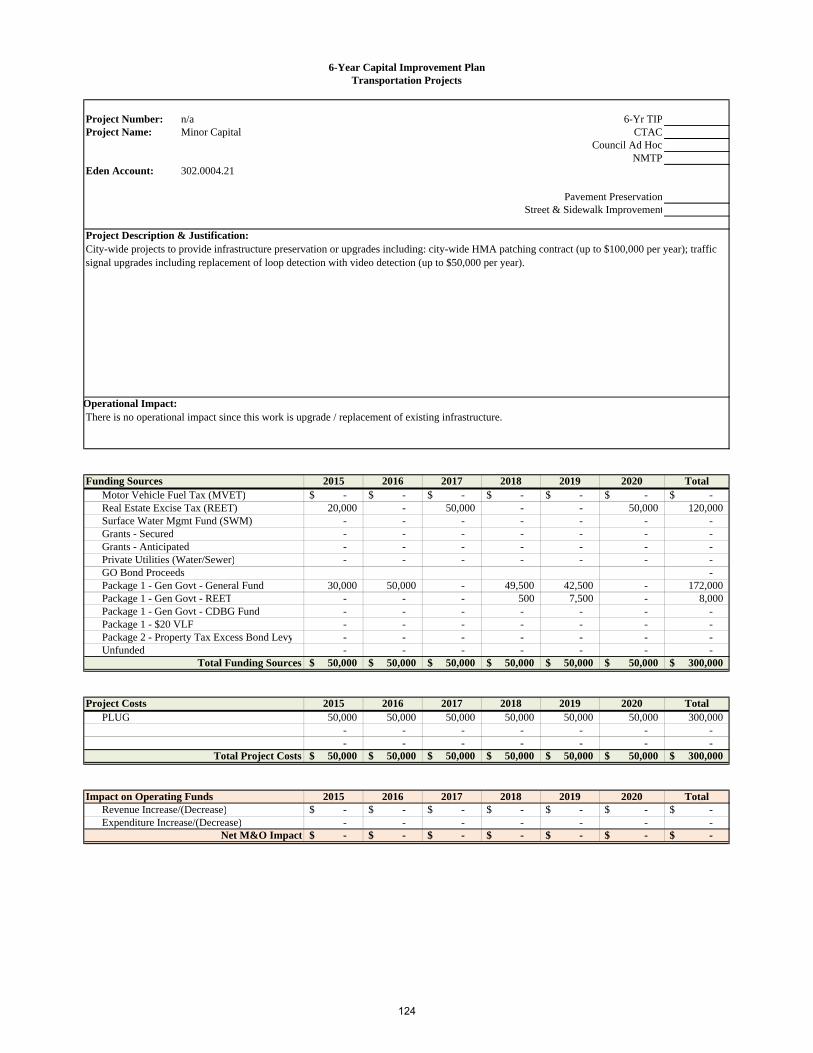
6-Year Capital Improvement PlanTransportation Projects
Project Number: n/a 6-Yr TIPProject Name: Minor Capital CTAC
Council Ad HocNMTP
Eden Account: 302.0004.21
Council Priority: Pavement PreservationPlanning Area: Street & Sidewalk Improvement
Project Description & Justification:
Operational Impact:
Funding Sources 2015 2016 2017 2018 2019 2020 TotalMotor Vehicle Fuel Tax (MVET) -$ -$ -$ -$ -$ -$ -$ Real Estate Excise Tax (REET) 20,000 - 50,000 - - 50,000 120,000 Surface Water Mgmt Fund (SWM) - - - - - - - Grants - Secured - - - - - - - Grants - Anticipated - - - - - - - Private Utilities (Water/Sewer) - - - - - - - GO Bond Proceeds - Package 1 - Gen Govt - General Fund 30,000 50,000 - 49,500 42,500 - 172,000 Package 1 - Gen Govt - REET - - - 500 7,500 - 8,000 Package 1 - Gen Govt - CDBG Fund - - - - - - - Package 1 - $20 VLF - - - - - - - Package 2 - Property Tax Excess Bond Levy - - - - - - - Unfunded - - - - - - -
Total Funding Sources 50,000$ 50,000$ 50,000$ 50,000$ 50,000$ 50,000$ 300,000$
Project Costs 2015 2016 2017 2018 2019 2020 TotalPLUG 50,000 50,000 50,000 50,000 50,000 50,000 300,000
- - - - - - - - - - - - - -
Total Project Costs 50,000$ 50,000$ 50,000$ 50,000$ 50,000$ 50,000$ 300,000$
Impact on Operating Funds 2015 2016 2017 2018 2019 2020 TotalRevenue Increase/(Decrease) -$ -$ -$ -$ -$ -$ -$ Expenditure Increase/(Decrease) - - - - - - -
Net M&O Impact -$ -$ -$ -$ -$ -$ -$
City-wide projects to provide infrastructure preservation or upgrades including: city-wide HMA patching contract (up to $100,000 per year); traffic signal upgrades including replacement of loop detection with video detection (up to $50,000 per year).
There is no operational impact since this work is upgrade / replacement of existing infrastructure.
124
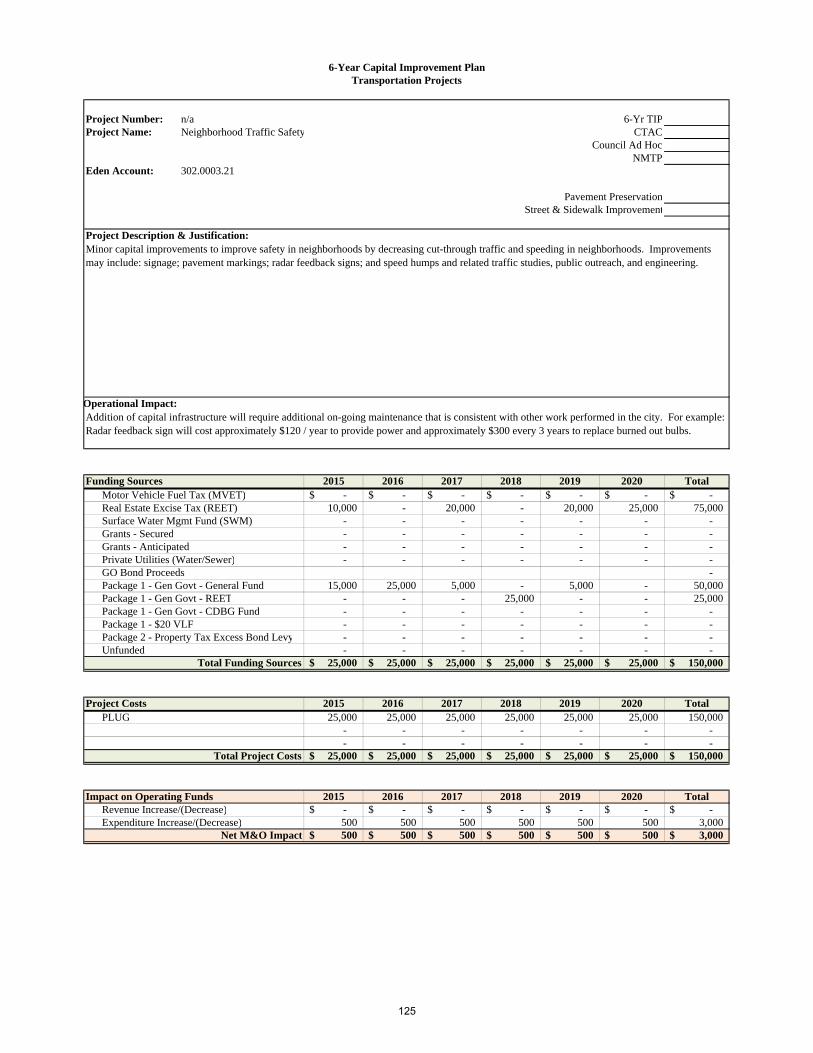
6-Year Capital Improvement PlanTransportation Projects
Project Number: n/a 6-Yr TIPProject Name: Neighborhood Traffic Safety CTAC
Council Ad HocNMTP
Eden Account: 302.0003.21
Council Priority: Pavement PreservationPlanning Area: Street & Sidewalk Improvement
Project Description & Justification:
Operational Impact:
Funding Sources 2015 2016 2017 2018 2019 2020 TotalMotor Vehicle Fuel Tax (MVET) -$ -$ -$ -$ -$ -$ -$ Real Estate Excise Tax (REET) 10,000 - 20,000 - 20,000 25,000 75,000 Surface Water Mgmt Fund (SWM) - - - - - - - Grants - Secured - - - - - - - Grants - Anticipated - - - - - - - Private Utilities (Water/Sewer) - - - - - - - GO Bond Proceeds - Package 1 - Gen Govt - General Fund 15,000 25,000 5,000 - 5,000 - 50,000 Package 1 - Gen Govt - REET - - - 25,000 - - 25,000 Package 1 - Gen Govt - CDBG Fund - - - - - - - Package 1 - $20 VLF - - - - - - - Package 2 - Property Tax Excess Bond Levy - - - - - - - Unfunded - - - - - - -
Total Funding Sources 25,000$ 25,000$ 25,000$ 25,000$ 25,000$ 25,000$ 150,000$
Project Costs 2015 2016 2017 2018 2019 2020 TotalPLUG 25,000 25,000 25,000 25,000 25,000 25,000 150,000
- - - - - - - - - - - - - -
Total Project Costs 25,000$ 25,000$ 25,000$ 25,000$ 25,000$ 25,000$ 150,000$
Impact on Operating Funds 2015 2016 2017 2018 2019 2020 TotalRevenue Increase/(Decrease) -$ -$ -$ -$ -$ -$ -$ Expenditure Increase/(Decrease) 500 500 500 500 500 500 3,000
Net M&O Impact 500$ 500$ 500$ 500$ 500$ 500$ 3,000$
Minor capital improvements to improve safety in neighborhoods by decreasing cut-through traffic and speeding in neighborhoods. Improvements may include: signage; pavement markings; radar feedback signs; and speed humps and related traffic studies, public outreach, and engineering.
Addition of capital infrastructure will require additional on-going maintenance that is consistent with other work performed in the city. For example: Radar feedback sign will cost approximately $120 / year to provide power and approximately $300 every 3 years to replace burned out bulbs.
125
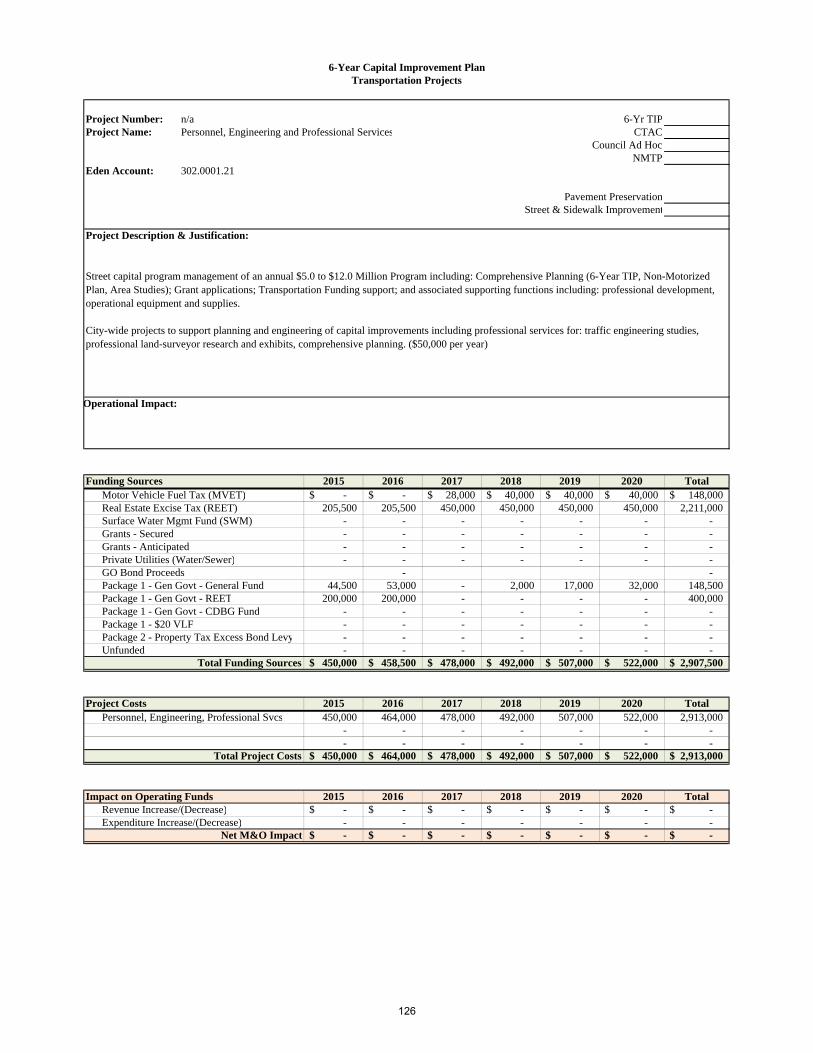
6-Year Capital Improvement PlanTransportation Projects
Project Number: n/a 6-Yr TIPProject Name: Personnel, Engineering and Professional Services CTAC
Council Ad HocNMTP
Eden Account: 302.0001.21
Council Priority: Pavement PreservationPlanning Area: Street & Sidewalk Improvement
Project Description & Justification:
Operational Impact:
Funding Sources 2015 2016 2017 2018 2019 2020 TotalMotor Vehicle Fuel Tax (MVET) -$ -$ 28,000$ 40,000$ 40,000$ 40,000$ 148,000$ Real Estate Excise Tax (REET) 205,500 205,500 450,000 450,000 450,000 450,000 2,211,000 Surface Water Mgmt Fund (SWM) - - - - - - - Grants - Secured - - - - - - - Grants - Anticipated - - - - - - - Private Utilities (Water/Sewer) - - - - - - - GO Bond Proceeds - - Package 1 - Gen Govt - General Fund 44,500 53,000 - 2,000 17,000 32,000 148,500 Package 1 - Gen Govt - REET 200,000 200,000 - - - - 400,000 Package 1 - Gen Govt - CDBG Fund - - - - - - - Package 1 - $20 VLF - - - - - - - Package 2 - Property Tax Excess Bond Levy - - - - - - - Unfunded - - - - - - -
Total Funding Sources 450,000$ 458,500$ 478,000$ 492,000$ 507,000$ 522,000$ 2,907,500$
Project Costs 2015 2016 2017 2018 2019 2020 TotalPersonnel, Engineering, Professional Svcs 450,000 464,000 478,000 492,000 507,000 522,000 2,913,000
- - - - - - - - - - - - - -
Total Project Costs 450,000$ 464,000$ 478,000$ 492,000$ 507,000$ 522,000$ 2,913,000$
Impact on Operating Funds 2015 2016 2017 2018 2019 2020 TotalRevenue Increase/(Decrease) -$ -$ -$ -$ -$ -$ -$ Expenditure Increase/(Decrease) - - - - - - -
Net M&O Impact -$ -$ -$ -$ -$ -$ -$
Street capital program management of an annual $5.0 to $12.0 Million Program including: Comprehensive Planning (6-Year TIP, Non-Motorized Plan, Area Studies); Grant applications; Transportation Funding support; and associated supporting functions including: professional development, operational equipment and supplies.
City-wide projects to support planning and engineering of capital improvements including professional services for: traffic engineering studies, professional land-surveyor research and exhibits, comprehensive planning. ($50,000 per year)
126
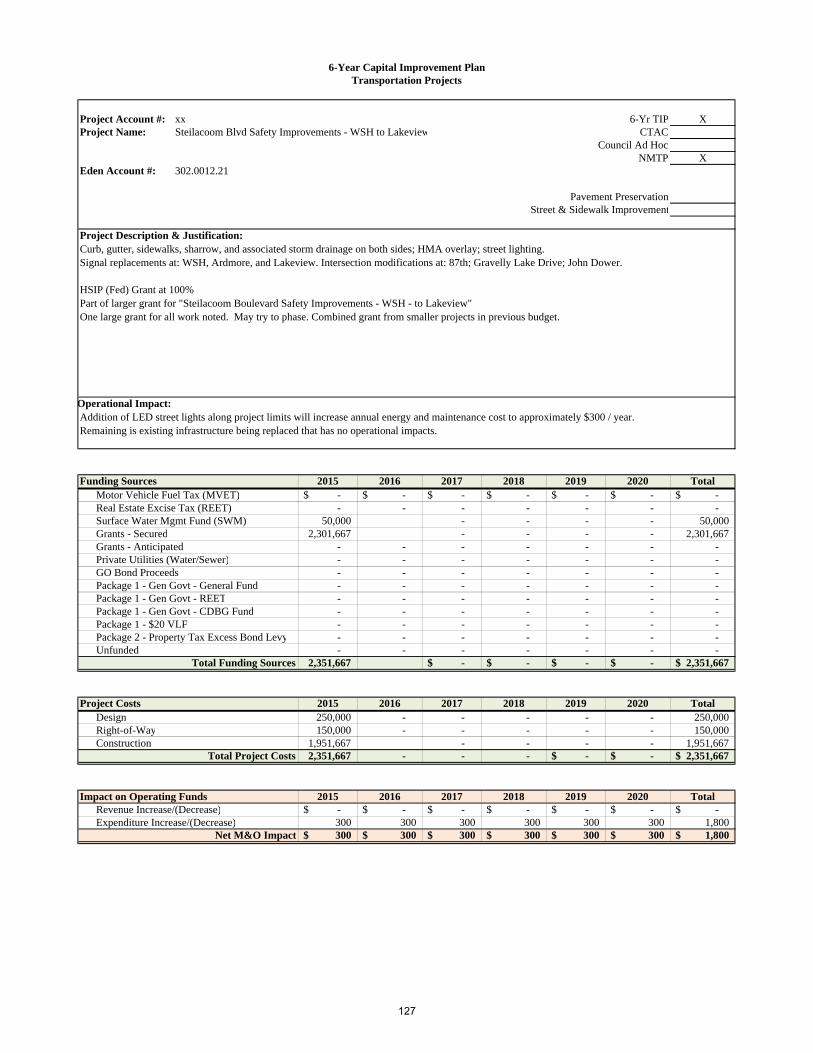
6-Year Capital Improvement PlanTransportation Projects
Project Account #: xx 6-Yr TIP XProject Name: Steilacoom Blvd Safety Improvements - WSH to Lakeview CTAC
Council Ad HocNMTP X
Eden Account #: 302.0012.21
Council Priority: Pavement PreservationPlanning Area: Street & Sidewalk Improvement
Project Description & Justification:
Operational Impact:
Funding Sources 2015 2016 2017 2018 2019 2020 TotalMotor Vehicle Fuel Tax (MVET) -$ -$ -$ -$ -$ -$ -$ Real Estate Excise Tax (REET) - - - - - - - Surface Water Mgmt Fund (SWM) 50,000 - - - - 50,000 Grants - Secured 2,301,667 - - - - 2,301,667 Grants - Anticipated - - - - - - - Private Utilities (Water/Sewer) - - - - - - - GO Bond Proceeds - - - - - - - Package 1 - Gen Govt - General Fund - - - - - - - Package 1 - Gen Govt - REET - - - - - - - Package 1 - Gen Govt - CDBG Fund - - - - - - - Package 1 - $20 VLF - - - - - - - Package 2 - Property Tax Excess Bond Levy - - - - - - - Unfunded - - - - - - -
Total Funding Sources 2,351,667 -$ -$ -$ -$ 2,351,667$
Project Costs 2015 2016 2017 2018 2019 2020 TotalDesign 250,000 - - - - - 250,000 Right-of-Way 150,000 - - - - - 150,000 Construction 1,951,667 - - - - 1,951,667
Total Project Costs 2,351,667 - - - -$ -$ 2,351,667$
Impact on Operating Funds 2015 2016 2017 2018 2019 2020 TotalRevenue Increase/(Decrease) -$ -$ -$ -$ -$ -$ -$ Expenditure Increase/(Decrease) 300 300 300 300 300 300 1,800
Net M&O Impact 300$ 300$ 300$ 300$ 300$ 300$ 1,800$
Curb, gutter, sidewalks, sharrow, and associated storm drainage on both sides; HMA overlay; street lighting.Signal replacements at: WSH, Ardmore, and Lakeview. Intersection modifications at: 87th; Gravelly Lake Drive; John Dower.
HSIP (Fed) Grant at 100%Part of larger grant for "Steilacoom Boulevard Safety Improvements - WSH - to Lakeview"One large grant for all work noted. May try to phase. Combined grant from smaller projects in previous budget.
Addition of LED street lights along project limits will increase annual energy and maintenance cost to approximately $300 / year.Remaining is existing infrastructure being replaced that has no operational impacts.
127
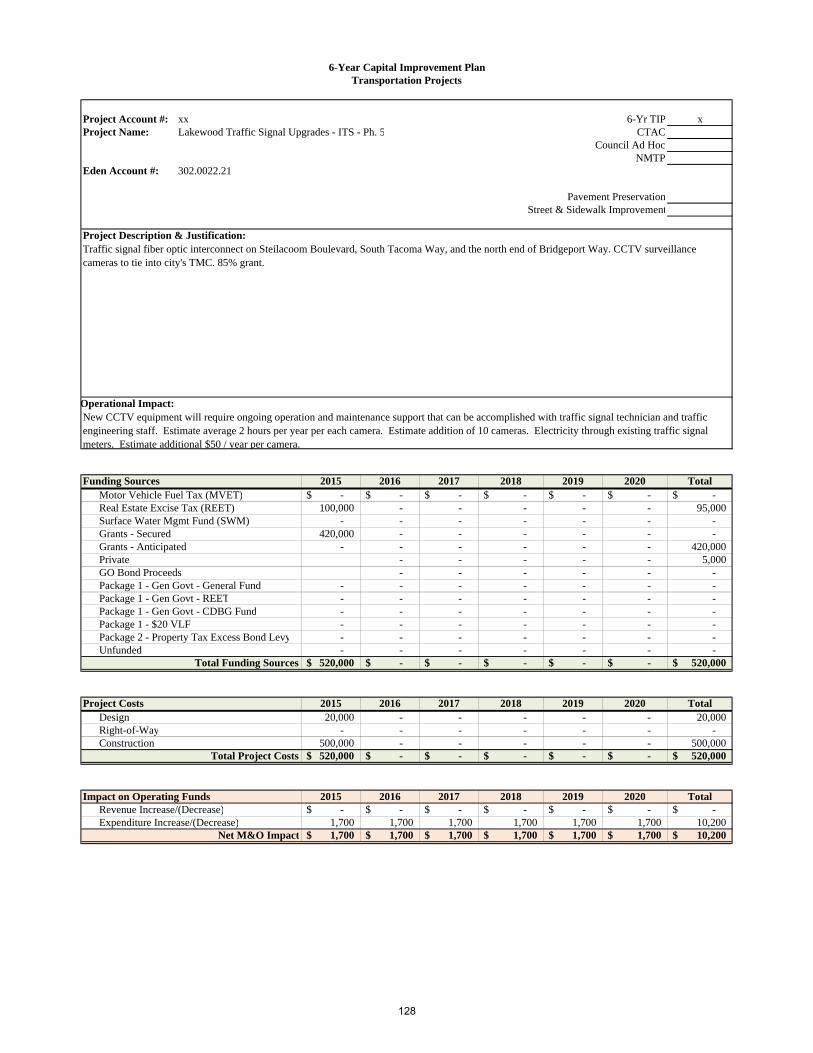
6-Year Capital Improvement PlanTransportation Projects
Project Account #: xx 6-Yr TIP xProject Name: Lakewood Traffic Signal Upgrades - ITS - Ph. 5 CTAC
Council Ad HocNMTP
Eden Account #: 302.0022.21
Council Priority: Pavement PreservationPlanning Area: Street & Sidewalk Improvement
Project Description & Justification:
Operational Impact:
Funding Sources 2015 2016 2017 2018 2019 2020 TotalMotor Vehicle Fuel Tax (MVET) -$ -$ -$ -$ -$ -$ -$ Real Estate Excise Tax (REET) 100,000 - - - - - 95,000 Surface Water Mgmt Fund (SWM) - - - - - - - Grants - Secured 420,000 - - - - - - Grants - Anticipated - - - - - - 420,000 Private - - - - - 5,000 GO Bond Proceeds - - - - - - Package 1 - Gen Govt - General Fund - - - - - - - Package 1 - Gen Govt - REET - - - - - - - Package 1 - Gen Govt - CDBG Fund - - - - - - - Package 1 - $20 VLF - - - - - - - Package 2 - Property Tax Excess Bond Levy - - - - - - - Unfunded - - - - - - -
Total Funding Sources 520,000$ -$ -$ -$ -$ -$ 520,000$
Project Costs 2015 2016 2017 2018 2019 2020 TotalDesign 20,000 - - - - - 20,000 Right-of-Way - - - - - - - Construction 500,000 - - - - - 500,000
Total Project Costs 520,000$ -$ -$ -$ -$ -$ 520,000$
Impact on Operating Funds 2015 2016 2017 2018 2019 2020 TotalRevenue Increase/(Decrease) -$ -$ -$ -$ -$ -$ -$ Expenditure Increase/(Decrease) 1,700 1,700 1,700 1,700 1,700 1,700 10,200
Net M&O Impact 1,700$ 1,700$ 1,700$ 1,700$ 1,700$ 1,700$ 10,200$
Traffic signal fiber optic interconnect on Steilacoom Boulevard, South Tacoma Way, and the north end of Bridgeport Way. CCTV surveillance cameras to tie into city's TMC. 85% grant.
New CCTV equipment will require ongoing operation and maintenance support that can be accomplished with traffic signal technician and traffic engineering staff. Estimate average 2 hours per year per each camera. Estimate addition of 10 cameras. Electricity through existing traffic signal meters. Estimate additional $50 / year per camera.
128
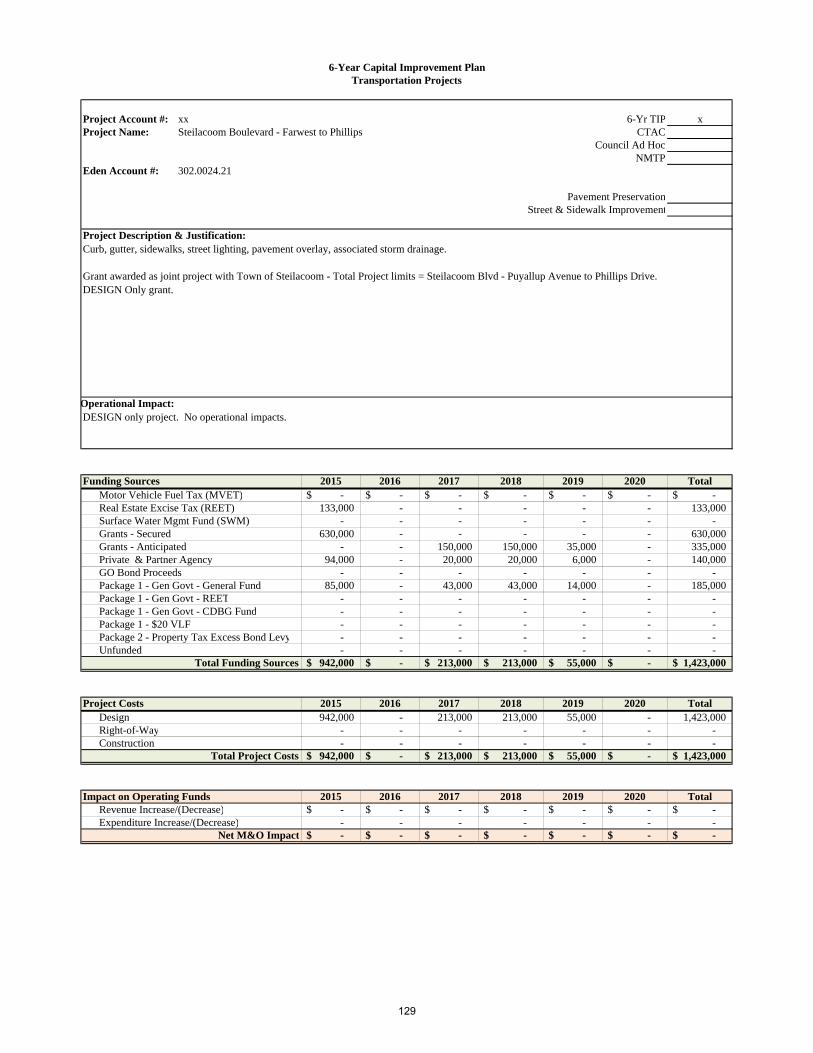
6-Year Capital Improvement PlanTransportation Projects
Project Account #: xx 6-Yr TIP xProject Name: Steilacoom Boulevard - Farwest to Phillips CTAC
Council Ad HocNMTP
Eden Account #: 302.0024.21
Council Priority: Pavement PreservationPlanning Area: Street & Sidewalk Improvement
Project Description & Justification:
Operational Impact:
Funding Sources 2015 2016 2017 2018 2019 2020 TotalMotor Vehicle Fuel Tax (MVET) -$ -$ -$ -$ -$ -$ -$ Real Estate Excise Tax (REET) 133,000 - - - - - 133,000 Surface Water Mgmt Fund (SWM) - - - - - - - Grants - Secured 630,000 - - - - - 630,000 Grants - Anticipated - - 150,000 150,000 35,000 - 335,000 Private & Partner Agency 94,000 - 20,000 20,000 6,000 - 140,000 GO Bond Proceeds - - - - - - - Package 1 - Gen Govt - General Fund 85,000 - 43,000 43,000 14,000 - 185,000 Package 1 - Gen Govt - REET - - - - - - - Package 1 - Gen Govt - CDBG Fund - - - - - - - Package 1 - $20 VLF - - - - - - - Package 2 - Property Tax Excess Bond Levy - - - - - - - Unfunded - - - - - - -
Total Funding Sources 942,000$ -$ 213,000$ 213,000$ 55,000$ -$ 1,423,000$
Project Costs 2015 2016 2017 2018 2019 2020 TotalDesign 942,000 - 213,000 213,000 55,000 - 1,423,000 Right-of-Way - - - - - - - Construction - - - - - - -
Total Project Costs 942,000$ -$ 213,000$ 213,000$ 55,000$ -$ 1,423,000$
Impact on Operating Funds 2015 2016 2017 2018 2019 2020 TotalRevenue Increase/(Decrease) -$ -$ -$ -$ -$ -$ -$ Expenditure Increase/(Decrease) - - - - - - -
Net M&O Impact -$ -$ -$ -$ -$ -$ -$
Curb, gutter, sidewalks, street lighting, pavement overlay, associated storm drainage.
Grant awarded as joint project with Town of Steilacoom - Total Project limits = Steilacoom Blvd - Puyallup Avenue to Phillips Drive.DESIGN Only grant.
DESIGN only project. No operational impacts.
129
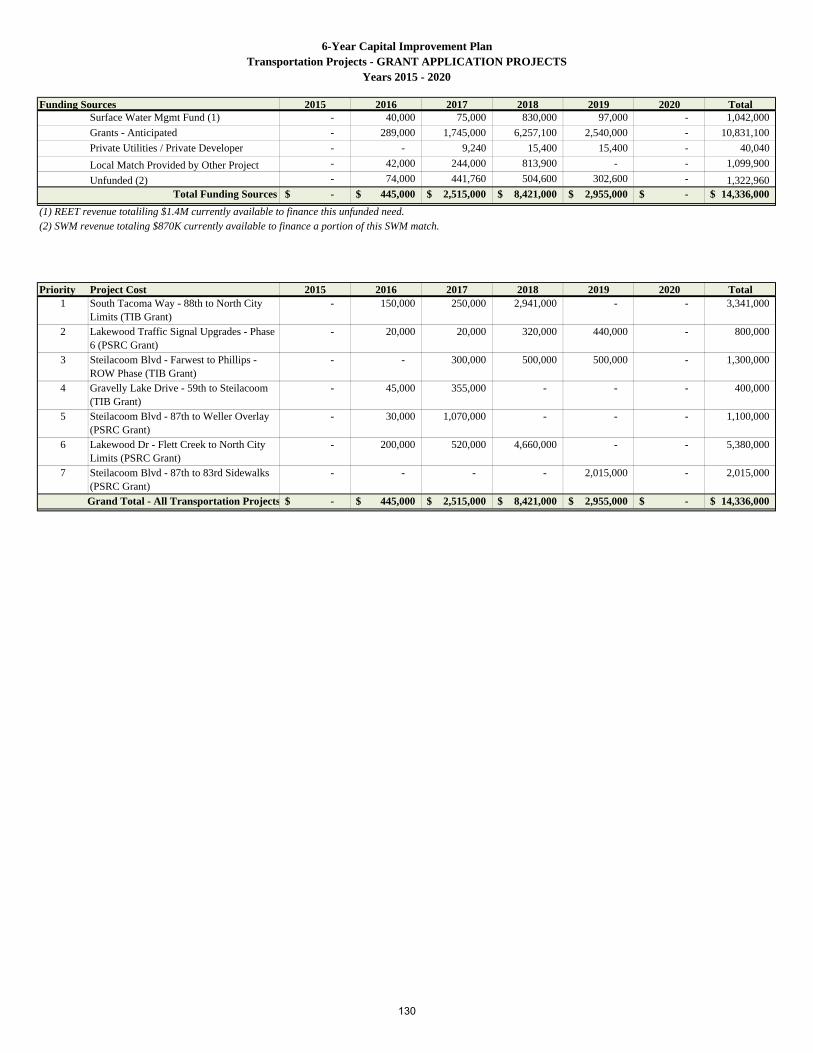
6-Year Capital Improvement PlanTransportation Projects - GRANT APPLICATION PROJECTS
Years 2015 - 2020-$ -$ -$ -$ -$ -$ -$
Funding Sources 2015 2016 2017 2018 2019 2020 TotalSurface Water Mgmt Fund (1) - 40,000 75,000 830,000 97,000 - 1,042,000
Grants - Anticipated - 289,000 1,745,000 6,257,100 2,540,000 - 10,831,100
Private Utilities / Private Developer - - 9,240 15,400 15,400 - 40,040
Local Match Provided by Other Project - 42,000 244,000 813,900 - - 1,099,900
Unfunded (2) - 74,000 441,760 504,600 302,600 - 1,322,960 Total Funding Sources -$ 445,000$ 2,515,000$ 8,421,000$ 2,955,000$ -$ 14,336,000$
(1) REET revenue totaliling $1.4M currently available to finance this unfunded need.(2) SWM revenue totaling $870K currently available to finance a portion of this SWM match.
Priority Project Cost 2015 2016 2017 2018 2019 2020 Total1 South Tacoma Way - 88th to North City
Limits (TIB Grant)- 150,000 250,000 2,941,000 - - 3,341,000
2 Lakewood Traffic Signal Upgrades - Phase 6 (PSRC Grant)
- 20,000 20,000 320,000 440,000 - 800,000
3 Steilacoom Blvd - Farwest to Phillips - ROW Phase (TIB Grant)
- - 300,000 500,000 500,000 - 1,300,000
4 Gravelly Lake Drive - 59th to Steilacoom (TIB Grant)
- 45,000 355,000 - - - 400,000
5 Steilacoom Blvd - 87th to Weller Overlay (PSRC Grant)
- 30,000 1,070,000 - - - 1,100,000
6 Lakewood Dr - Flett Creek to North City Limits (PSRC Grant)
- 200,000 520,000 4,660,000 - - 5,380,000
7 Steilacoom Blvd - 87th to 83rd Sidewalks (PSRC Grant)
- - - - 2,015,000 - 2,015,000
Grand Total - All Transportation Projects -$ 445,000$ 2,515,000$ 8,421,000$ 2,955,000$ -$ 14,336,000$
130
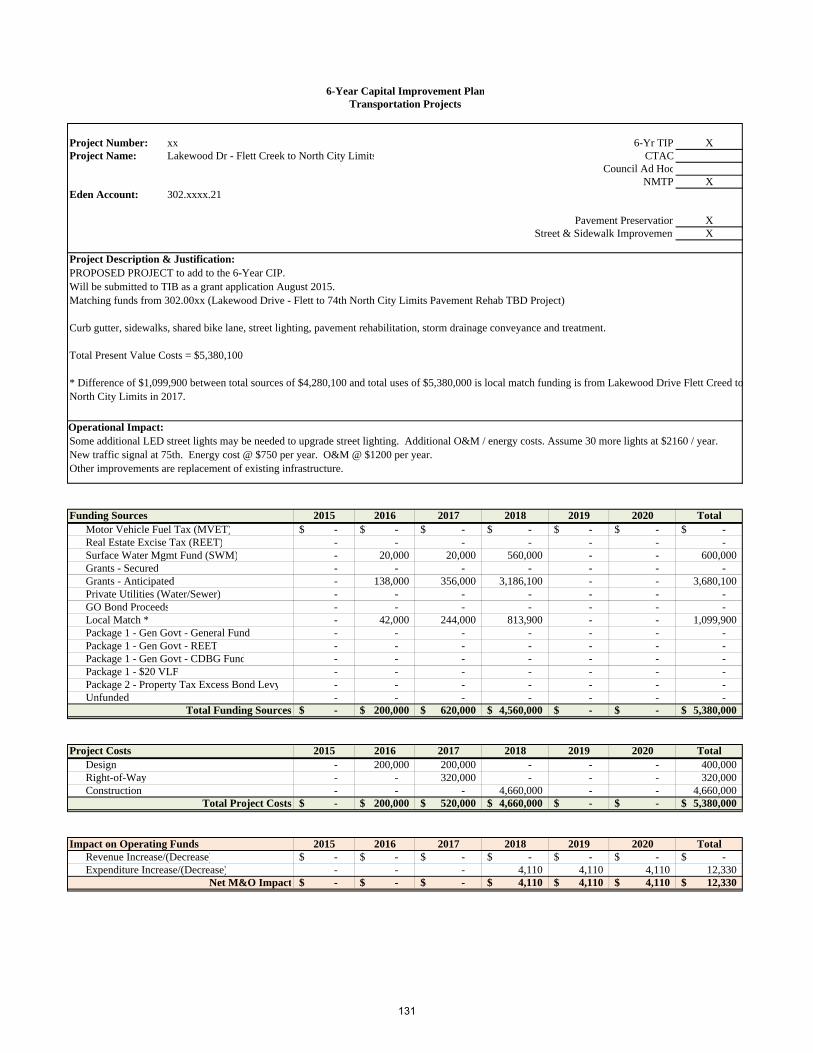
6-Year Capital Improvement PlanTransportation Projects
Project Number: xx 6-Yr TIP XProject Name: Lakewood Dr - Flett Creek to North City Limits CTAC
Council Ad HocNMTP X
Eden Account: 302.xxxx.21
Council Priority: Pavement Preservation XPlanning Area: Street & Sidewalk Improvement X
Project Description & Justification:
Operational Impact:
Funding Sources 2015 2016 2017 2018 2019 2020 TotalMotor Vehicle Fuel Tax (MVET) -$ -$ -$ -$ -$ -$ -$ Real Estate Excise Tax (REET) - - - - - - - Surface Water Mgmt Fund (SWM) - 20,000 20,000 560,000 - - 600,000 Grants - Secured - - - - - - - Grants - Anticipated - 138,000 356,000 3,186,100 - - 3,680,100 Private Utilities (Water/Sewer) - - - - - - - GO Bond Proceeds - - - - - - - Local Match * - 42,000 244,000 813,900 - - 1,099,900 Package 1 - Gen Govt - General Fund - - - - - - - Package 1 - Gen Govt - REET - - - - - - - Package 1 - Gen Govt - CDBG Fund - - - - - - - Package 1 - $20 VLF - - - - - - - Package 2 - Property Tax Excess Bond Levy - - - - - - - Unfunded - - - - - - -
Total Funding Sources -$ 200,000$ 620,000$ 4,560,000$ -$ -$ 5,380,000$
Project Costs 2015 2016 2017 2018 2019 2020 TotalDesign - 200,000 200,000 - - - 400,000 Right-of-Way - - 320,000 - - - 320,000 Construction - - - 4,660,000 - - 4,660,000
Total Project Costs -$ 200,000$ 520,000$ 4,660,000$ -$ -$ 5,380,000$
Impact on Operating Funds 2015 2016 2017 2018 2019 2020 TotalRevenue Increase/(Decrease) -$ -$ -$ -$ -$ -$ -$ Expenditure Increase/(Decrease) - - - 4,110 4,110 4,110 12,330
Net M&O Impact -$ -$ -$ 4,110$ 4,110$ 4,110$ 12,330$
PROPOSED PROJECT to add to the 6-Year CIP.Will be submitted to TIB as a grant application August 2015.Matching funds from 302.00xx (Lakewood Drive - Flett to 74th North City Limits Pavement Rehab TBD Project)
Curb gutter, sidewalks, shared bike lane, street lighting, pavement rehabilitation, storm drainage conveyance and treatment.
Total Present Value Costs = $5,380,100
* Difference of $1,099,900 between total sources of $4,280,100 and total uses of $5,380,000 is local match funding is from Lakewood Drive Flett Creed to North City Limits in 2017.
Some additional LED street lights may be needed to upgrade street lighting. Additional O&M / energy costs. Assume 30 more lights at $2160 / year. New traffic signal at 75th. Energy cost @ $750 per year. O&M @ $1200 per year.Other improvements are replacement of existing infrastructure.
131
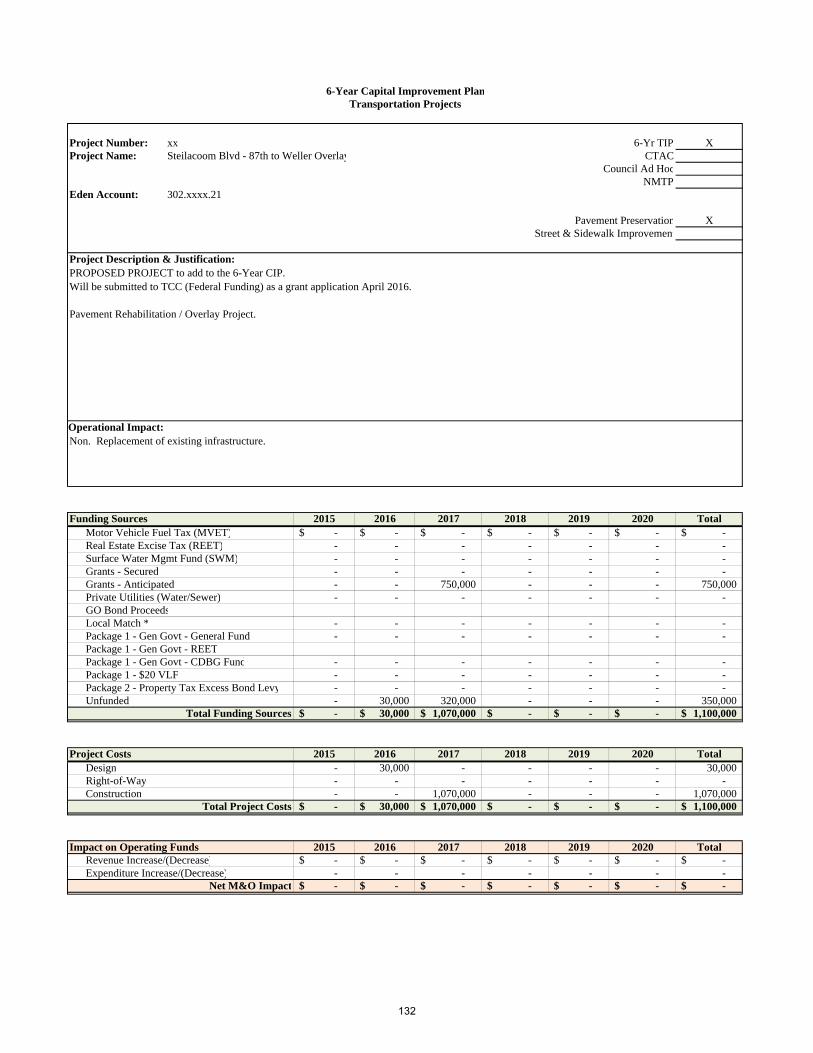
6-Year Capital Improvement PlanTransportation Projects
Project Number: xx 6-Yr TIP XProject Name: Steilacoom Blvd - 87th to Weller Overlay CTAC
Council Ad HocNMTP
Eden Account: 302.xxxx.21
Council Priority: Pavement Preservation XPlanning Area: Street & Sidewalk Improvement
Project Description & Justification:
Operational Impact:
Funding Sources 2015 2016 2017 2018 2019 2020 TotalMotor Vehicle Fuel Tax (MVET) -$ -$ -$ -$ -$ -$ -$ Real Estate Excise Tax (REET) - - - - - - - Surface Water Mgmt Fund (SWM) - - - - - - - Grants - Secured - - - - - - - Grants - Anticipated - - 750,000 - - - 750,000 Private Utilities (Water/Sewer) - - - - - - - GO Bond ProceedsLocal Match * - - - - - - - Package 1 - Gen Govt - General Fund - - - - - - - Package 1 - Gen Govt - REETPackage 1 - Gen Govt - CDBG Fund - - - - - - - Package 1 - $20 VLF - - - - - - - Package 2 - Property Tax Excess Bond Levy - - - - - - - Unfunded - 30,000 320,000 - - - 350,000
Total Funding Sources -$ 30,000$ 1,070,000$ -$ -$ -$ 1,100,000$
Project Costs 2015 2016 2017 2018 2019 2020 TotalDesign - 30,000 - - - - 30,000 Right-of-Way - - - - - - - Construction - - 1,070,000 - - - 1,070,000
Total Project Costs -$ 30,000$ 1,070,000$ -$ -$ -$ 1,100,000$
Impact on Operating Funds 2015 2016 2017 2018 2019 2020 TotalRevenue Increase/(Decrease) -$ -$ -$ -$ -$ -$ -$ Expenditure Increase/(Decrease) - - - - - - -
Net M&O Impact -$ -$ -$ -$ -$ -$ -$
PROPOSED PROJECT to add to the 6-Year CIP.Will be submitted to TCC (Federal Funding) as a grant application April 2016.
Pavement Rehabilitation / Overlay Project.
Non. Replacement of existing infrastructure.
132
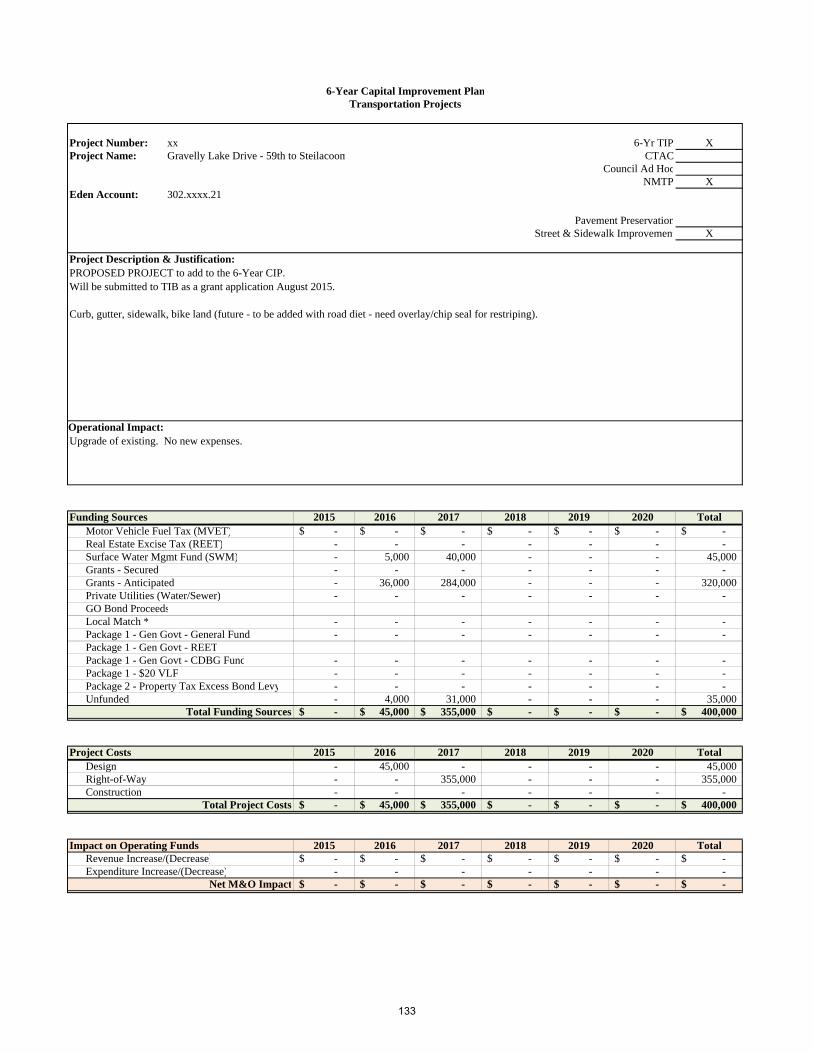
6-Year Capital Improvement PlanTransportation Projects
Project Number: xx 6-Yr TIP XProject Name: Gravelly Lake Drive - 59th to Steilacoom CTAC
Council Ad HocNMTP X
Eden Account: 302.xxxx.21
Council Priority: Pavement PreservationPlanning Area: Street & Sidewalk Improvement X
Project Description & Justification:
Operational Impact:
Funding Sources 2015 2016 2017 2018 2019 2020 TotalMotor Vehicle Fuel Tax (MVET) -$ -$ -$ -$ -$ -$ -$ Real Estate Excise Tax (REET) - - - - - - - Surface Water Mgmt Fund (SWM) - 5,000 40,000 - - - 45,000 Grants - Secured - - - - - - - Grants - Anticipated - 36,000 284,000 - - - 320,000 Private Utilities (Water/Sewer) - - - - - - - GO Bond ProceedsLocal Match * - - - - - - - Package 1 - Gen Govt - General Fund - - - - - - - Package 1 - Gen Govt - REETPackage 1 - Gen Govt - CDBG Fund - - - - - - - Package 1 - $20 VLF - - - - - - - Package 2 - Property Tax Excess Bond Levy - - - - - - - Unfunded - 4,000 31,000 - - - 35,000
Total Funding Sources -$ 45,000$ 355,000$ -$ -$ -$ 400,000$
Project Costs 2015 2016 2017 2018 2019 2020 TotalDesign - 45,000 - - - - 45,000 Right-of-Way - - 355,000 - - - 355,000 Construction - - - - - - -
Total Project Costs -$ 45,000$ 355,000$ -$ -$ -$ 400,000$
Impact on Operating Funds 2015 2016 2017 2018 2019 2020 TotalRevenue Increase/(Decrease) -$ -$ -$ -$ -$ -$ -$ Expenditure Increase/(Decrease) - - - - - - -
Net M&O Impact -$ -$ -$ -$ -$ -$ -$
PROPOSED PROJECT to add to the 6-Year CIP.Will be submitted to TIB as a grant application August 2015.
Curb, gutter, sidewalk, bike land (future - to be added with road diet - need overlay/chip seal for restriping).
Upgrade of existing. No new expenses.
133
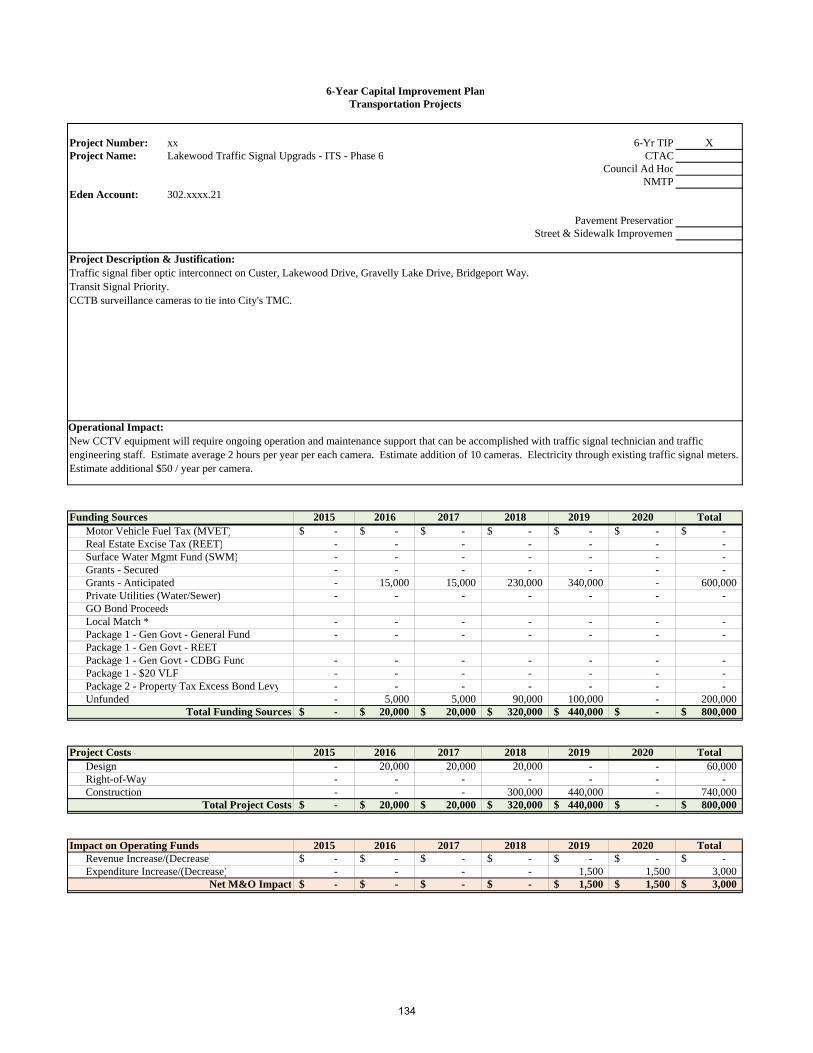
6-Year Capital Improvement PlanTransportation Projects
Project Number: xx 6-Yr TIP XProject Name: Lakewood Traffic Signal Upgrads - ITS - Phase 6 CTAC
Council Ad HocNMTP
Eden Account: 302.xxxx.21
Council Priority: Pavement PreservationPlanning Area: Street & Sidewalk Improvement
Project Description & Justification:
Operational Impact:
Funding Sources 2015 2016 2017 2018 2019 2020 TotalMotor Vehicle Fuel Tax (MVET) -$ -$ -$ -$ -$ -$ -$ Real Estate Excise Tax (REET) - - - - - - - Surface Water Mgmt Fund (SWM) - - - - - - - Grants - Secured - - - - - - - Grants - Anticipated - 15,000 15,000 230,000 340,000 - 600,000 Private Utilities (Water/Sewer) - - - - - - - GO Bond ProceedsLocal Match * - - - - - - - Package 1 - Gen Govt - General Fund - - - - - - - Package 1 - Gen Govt - REETPackage 1 - Gen Govt - CDBG Fund - - - - - - - Package 1 - $20 VLF - - - - - - - Package 2 - Property Tax Excess Bond Levy - - - - - - - Unfunded - 5,000 5,000 90,000 100,000 - 200,000
Total Funding Sources -$ 20,000$ 20,000$ 320,000$ 440,000$ -$ 800,000$
Project Costs 2015 2016 2017 2018 2019 2020 TotalDesign - 20,000 20,000 20,000 - - 60,000 Right-of-Way - - - - - - - Construction - - - 300,000 440,000 - 740,000
Total Project Costs -$ 20,000$ 20,000$ 320,000$ 440,000$ -$ 800,000$
Impact on Operating Funds 2015 2016 2017 2018 2019 2020 TotalRevenue Increase/(Decrease) -$ -$ -$ -$ -$ -$ -$ Expenditure Increase/(Decrease) - - - - 1,500 1,500 3,000
Net M&O Impact -$ -$ -$ -$ 1,500$ 1,500$ 3,000$
Traffic signal fiber optic interconnect on Custer, Lakewood Drive, Gravelly Lake Drive, Bridgeport Way.Transit Signal Priority.CCTB surveillance cameras to tie into City's TMC.
New CCTV equipment will require ongoing operation and maintenance support that can be accomplished with traffic signal technician and traffic engineering staff. Estimate average 2 hours per year per each camera. Estimate addition of 10 cameras. Electricity through existing traffic signal meters. Estimate additional $50 / year per camera.
134
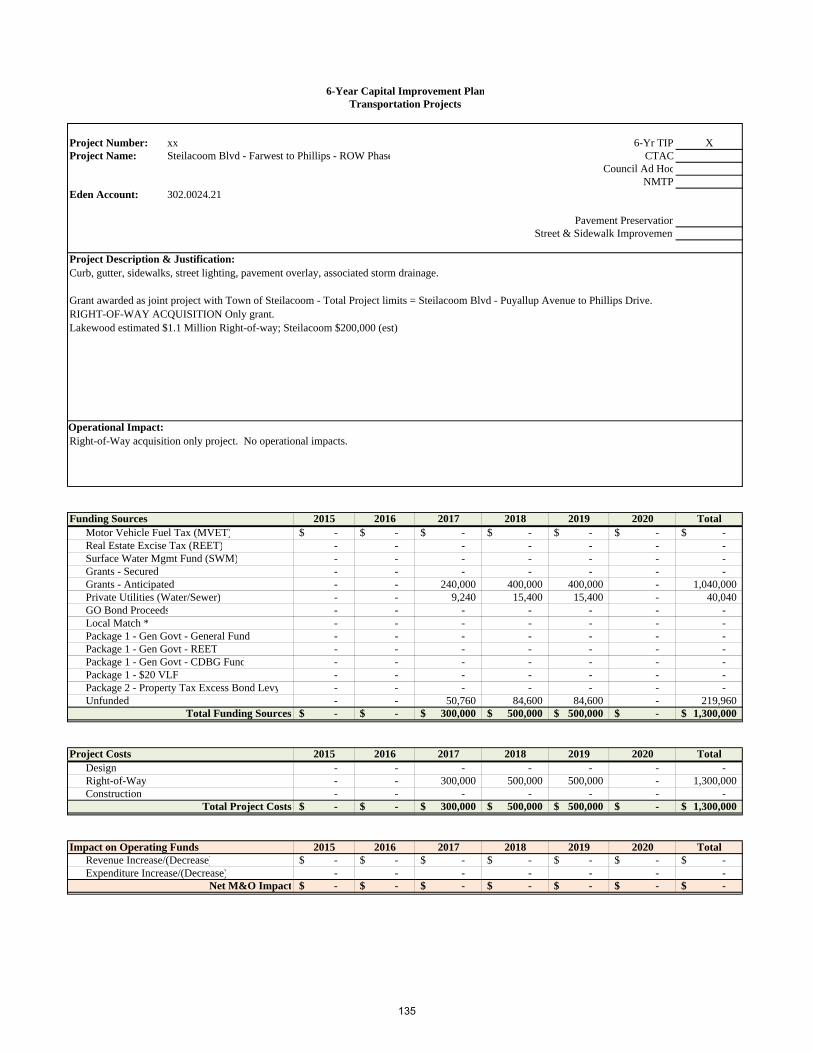
6-Year Capital Improvement PlanTransportation Projects
Project Number: xx 6-Yr TIP XProject Name: Steilacoom Blvd - Farwest to Phillips - ROW Phase CTAC
Council Ad HocNMTP
Eden Account: 302.0024.21
Council Priority: Pavement PreservationPlanning Area: Street & Sidewalk Improvement
Project Description & Justification:
Operational Impact:
Funding Sources 2015 2016 2017 2018 2019 2020 TotalMotor Vehicle Fuel Tax (MVET) -$ -$ -$ -$ -$ -$ -$ Real Estate Excise Tax (REET) - - - - - - - Surface Water Mgmt Fund (SWM) - - - - - - - Grants - Secured - - - - - - - Grants - Anticipated - - 240,000 400,000 400,000 - 1,040,000 Private Utilities (Water/Sewer) - - 9,240 15,400 15,400 - 40,040 GO Bond Proceeds - - - - - - - Local Match * - - - - - - - Package 1 - Gen Govt - General Fund - - - - - - - Package 1 - Gen Govt - REET - - - - - - - Package 1 - Gen Govt - CDBG Fund - - - - - - - Package 1 - $20 VLF - - - - - - - Package 2 - Property Tax Excess Bond Levy - - - - - - - Unfunded - - 50,760 84,600 84,600 - 219,960
Total Funding Sources -$ -$ 300,000$ 500,000$ 500,000$ -$ 1,300,000$
Project Costs 2015 2016 2017 2018 2019 2020 TotalDesign - - - - - - - Right-of-Way - - 300,000 500,000 500,000 - 1,300,000 Construction - - - - - - -
Total Project Costs -$ -$ 300,000$ 500,000$ 500,000$ -$ 1,300,000$
Impact on Operating Funds 2015 2016 2017 2018 2019 2020 TotalRevenue Increase/(Decrease) -$ -$ -$ -$ -$ -$ -$ Expenditure Increase/(Decrease) - - - - - - -
Net M&O Impact -$ -$ -$ -$ -$ -$ -$
Curb, gutter, sidewalks, street lighting, pavement overlay, associated storm drainage.
Grant awarded as joint project with Town of Steilacoom - Total Project limits = Steilacoom Blvd - Puyallup Avenue to Phillips Drive.RIGHT-OF-WAY ACQUISITION Only grant.Lakewood estimated $1.1 Million Right-of-way; Steilacoom $200,000 (est)
Right-of-Way acquisition only project. No operational impacts.
135

6-Year Capital Improvement PlanTransportation Projects
Project Number: 30 6-Yr TIP XProject Name: South Tacoma Way Improvements CTAC X
(88th to North City Limits) Council Ad HocNMTP X
Eden Account: 302.xxxx.21
Council Priority: Pavement PreservationPlanning Area: Street & Sidewalk Improvement
Project Description & Justification:
Operational Impact:
Funding Sources 2015 2016 2017 2018 2019 2020 TotalMotor Vehicle Fuel Tax (MVET) -$ -$ -$ -$ -$ -$ -$ Real Estate Excise Tax (REET) - - - - - - - Surface Water Mgmt Fund (SWM) - 15,000 15,000 270,000 - - 300,000 Grants - Secured - - - - - - - Grants - Anticipated - 100,000 100,000 2,441,000 - - 2,641,000 Private Utilities (Water/Sewer) - - - - - - - GO Bond Proceeds - - - - - - - Local Match * - - - - - - - Package 1 - Gen Govt - General Fund - - - - - - - Package 1 - Gen Govt - REET - - - - - - - Package 1 - Gen Govt - CDBG Fund - - - - - - - Package 1 - $20 VLF - - - - - - - Package 2 - Property Tax Excess Bond Levy - - - - - - - Unfunded - 35,000 35,000 330,000 - - 400,000
Total Funding Sources -$ 150,000$ 150,000$ 3,041,000$ -$ -$ 3,341,000$
Project Costs 2015 2016 2017 2018 2019 2020 TotalDesign - 150,000 150,000 - - - 300,000 Right-of-Way - - 100,000 - - - 100,000 Construction - - - 2,941,000 - - 2,941,000
Total Project Costs -$ 150,000$ 250,000$ 2,941,000$ -$ -$ 3,341,000$
Impact on Operating Funds 2015 2016 2017 2018 2019 2020 TotalRevenue Increase/(Decrease) -$ -$ -$ -$ -$ -$ -$ Expenditure Increase/(Decrease) - - - 1,200 1,200 1,200 3,600
Net M&O Impact -$ -$ -$ 1,200$ 1,200$ 1,200$ 3,600$
Curb, gutter, sidewalks, street lighting, pavement overlay, associated storm drainage.
New street lights - additional for current lighting standards. 16 new lights @ $6 per month per light = approximately $1,200/year.
136
6-Year Capital Improvement PlanTransportation Projects
Project Number: 23 6-Yr TIP XProject Name: Steilacoom Blvd 87th to 83rd Sidewalks CTAC X
(87th to 83rd) Council Ad HocNMTP X
Eden Account: 302.xxxx.21
Council Priority: Pavement PreservationPlanning Area: Street & Sidewalk Improvement
Project Description & Justification:
Operational Impact:
Funding Sources 2015 2016 2017 2018 2019 2020 TotalMotor Vehicle Fuel Tax (MVET) -$ -$ -$ -$ -$ -$ -$ Real Estate Excise Tax (REET) - - - - - - - Surface Water Mgmt Fund (SWM) - - - - 97,000 - 97,000 Grants - Secured - - - - - - - Grants - Anticipated - - - - 1,800,000 - 1,800,000 Private Utilities (Water/Sewer) - - - - - - - GO Bond Proceeds - - - - - - - Package 1 - Gen Govt - General Fund - - - - - - - Package 1 - Gen Govt - REET - - - - - - - Package 1 - Gen Govt - CDBG Fund - - - - - - - Package 1 - $20 VLF - - - - - - - Package 2 - Property Tax Excess Bond Levy - - - - - - - Unfunded - - - - 118,000 - 118,000
Total Funding Sources -$ -$ -$ -$ 2,015,000$ -$ 2,015,000$
Project Costs 2015 2016 2017 2018 2019 2020 TotalDesign - - - - - Right-of-Way - - - - - - Construction - - - 2,015,000 - 2,015,000
Total Project Costs -$ -$ -$ -$ 2,015,000$ -$ 2,015,000$
Impact on Operating Funds 2015 2016 2017 2018 2019 2020 TotalRevenue Increase/(Decrease) -$ -$ -$ -$ -$ -$ -$ Expenditure Increase/(Decrease) - - - 300 300 600
Net M&O Impact -$ -$ -$ -$ 300$ 300$ 600$
Curb, gutter, sidewalks, sharrow, street lighting, signal upgrades, overlay, and associated storm drainage
This project for right-of-way and construction only. Design being completed under separate project.
Propose to apply for PRSC Federal Grant in 2018 following successful PSRC grant for design and separate project for right-of-way.
Some additional LED street lights may be needed to upgrade street lighting. Additional O&M / energy costs. Assume 6 more lights at $300 / year.Other improvements are replacement of existing infrastructure.
137