Embed Size (px)
Citation preview
Journal of Micromechanics and Microengineering
J. Micromech. Microeng. 24 (2014) 065011 (10pp) doi:10.1088/0960-1317/24/6/065011
iGC2: an architecture for micro gaschromatographs utilizing integratedbi-directional pumps and multi-stagepreconcentrators
Yutao Qin and Yogesh B Gianchandani
Center for Wireless Integrated MicroSensing and Systems (WIMS2), University of Michigan, Ann Arbor,MI 48109, USA
E-mail: [email protected] and [email protected]
Received 17 December 2013, revised 27 February 2014Accepted for publication 3 April 2014Published 6 May 2014
AbstractThis paper reports an integrated micro gas chromatography (μGC) architecture which utilizesa bi-directional micropump. Four integral components—the bi-directional Knudsen pump(KP2), a two-stage preconcentrator-focuser (PCF2), a separation column, and a gasdetector—are integrated in a 4.3 cm3 stack, forming a serial flow path. All four componentsare fabricated using the same three-mask process. Compared to the conventional approachused with multi-stage preconcentrators, in which valves are used to reverse flow between thesampling phase and the separation phase, this μGC architecture reduces the overallcomplexity. In this architecture, the vapors being sampled are drawn through the detector andcolumn before reaching the PCF2. The microsystem operation is experimentally validated byquantitative analyses of benzene, toluene, and xylene vapors ranging in concentration from43–1167 mg m−3.
Keywords: quantitative analysis, BTX sensor, Knudsen pump, thermal transpiration,microdischarge
(Some figures may appear in colour only in the online journal)
1. Introduction
Following the pioneering work of Terry et al [1], a varietyof micro gas chromatography (μGC) systems have beenreported over the past three decades. Many μGC systemsinclude microfabricated renditions of three components thatare integral to the system: the preconcentrator, which samplesvapor analytes and provides vapor injection; the column,which separates the vapor analytes; and the gas detector,which quantifies the eluents from the column [2–5]. Thesesystems use external, commercial pumps to provide gas flow.More recent systems utilizing micropumps have also beendemonstrated [6–8]. Some systems use commercial valvesto control fluidic routing; microfabricated valves for μGCsystems are being studied [4].
In the simplest architectures, the preconcentrator, column,detector, and pump are connected in series, and operated withunidirectional flow from the preconcentrator to the columnand then the detector [2, 8]. In others, a valve bypasses thecolumn during vapor sampling to increase the flow rate, butthe flow direction in both sampling and analytical separationremains the same [4, 9]. The bypass-flow architecture canbe further enhanced by using an additional detector in thebypass line, which provides a coarse measurement of the vaporconcentration and informs the system of the optimal samplingtime [9]. In more complex architectures, a number of valves areused to reverse the flow direction in the preconcentrator duringsampling and separation (i.e., bi-directional flow is necessary)[10–12]. As a consequence, during the sampling phase vaporsenter the preconcentrator at the end which will be downstreamduring the analytical separation phase.
0960-1317/14/065011+10$33.00 1 © 2014 IOP Publishing Ltd Printed in the UK

J. Micromech. Microeng. 24 (2014) 065011 Y Qin and Y B Gianchandani
Figure 1. Bi-directional operation of the iGC2 system. During vaporsampling, the KP2 draws vapor analytes through the detector andcolumn, and into the PCF2. The two stages of PCF2 target analyteswith different volatility ranges. The flow is reversed duringanalytical separation.
While bi-directional flow is potentially beneficial for asingle-stage preconcentrator, it is essential for a multi-stage(or multi-bed) one. A multi-stage preconcentrator uses varioustypes of sorbents for analyses of vapor analytes of broadranges of volatilities. The stages, each packed with one typeof sorbent, are connected in series. During the vapor samplingphase, analytes with low volatility are trapped in stages that areupstream in the sampling flow path; these stages are packedwith sorbents of low surface area. Analytes with high volatility,after passing through the upstream stages, are trapped indownstream stages, which are packed with sorbents of highsurface area (figure 1). During the analytical separation phase,the flow direction is reversed, allowing all the trapped analytesto be injected into the separation column [13].
Miniaturization of valves has been a subject of extensiveresearch [14]. Many of the microvalves reported to dateutilize the actuation of a flexible diaphragm to controlflow. This actuation has been performed electrostatically[15], piezoelectrically [16], or thermopneumatically [17]. Amicrovalve targeting μGC integration has been reported [18].However, the use of a deformable diaphragm introducesadditional cost, complexity, and reliability challenges to amulti-component μGC system that is already complex. Thispaper evaluates a valveless μGC architecture, the iGC2, whichis comprised of a bi-directional Knudsen pump (KP2), a two-stage preconcentrator (PCF2), a separation column, and adetector1. Its operation is illustrated in figure 1. During thesampling phase, vapor analytes enter the system, pass throughthe detector and column, and finally settle into the PCF2.During the analytical separation phase, the flow direction isreversed by the KP2; the sampled vapor analytes are thenthermally desorbed from the PCF2, separated in the column,and quantified by the detector.
Valveless bi-directional operation is more amenable toμGC systems than to conventional benchtop GC systems. In
1 Portions of this paper appear in conference abstract form in [19].
Figure 2. Structural concept of the iGC2 system. The KP2, PCF2,column, and detector are stack integrated. Spacers are used toprovide inter-layer flow connection.
contrast to conventional columns, which are usually 10–30 mlong, microcolumns typically have relatively small lengths of0.08–3 m [4, 20, 21]. Qualitatively, the short microcolumnshave small ‘breakthrough’ volumes, i.e., vapors can easilypass through the column and reach the preconcentrator duringsampling. At the end of the sampling period, residual vaporsmay remain in the column. When flow is reversed to initiatethe separation phase, the vapors in the column are purged, butmay contribute to a baseline response upon which the retentionpeaks are superposed. By accommodating these trends intothe quantitative assessment of retention peaks, quantitativeanalyses are not compromised.
The design of the iGC2 system is described in section 2;fabrication is described in section 3; experimental resultsare presented in section 4, followed by the discussion andconclusion in section 5.
2. Design
2.1. Bi-directional Knudsen pump (KP2)
Knudsen pumps are motionless gas pumps that operate onthe principle of thermal transpiration [22, 23]. One type ofKnudsen pump implementation utilizes nanoporous mixedcellulose ester (MCE) membrane(s) (of thickness ≈105 μm,pore diameter ≈25 nm, porosity ≈70%, Millipore, MA) [24].In the presence of a temperature gradient, flow is generatedfrom the cold side to the hot side of the MCE membrane(s).A previously reported bi-directional Knudsen pump usedthermoelectric elements to apply reversible temperaturegradients across the MCE membrane(s) [25]. In the iGC2architecture, however, the KP2 simply utilizes thin-film Jouleheaters on both sides of a membrane stack. During operation,one of the sides is heated while the other is cooled passively(by a heat sink or natural convection).
The KP2 has a stack of four MCE membranes sandwichedby two glass dice on each side, i.e., Side-A and Side-B,(figure 2). Each glass die is ≈500 μm thick. On Side-A, theglass die that is in contact with the MCE membrane stack (i.e.,Die 2a) has a thin-film metal heater and thermistor to controlthe temperature, as well as multiple through-holes to facilitategas flow into and out of the MCE membranes. The other glassdie (i.e., Die 1a) has in-plane grooves that guide gas streamsto a single port, which can be connected to other components
2
J. Micromech. Microeng. 24 (2014) 065011 Y Qin and Y B Gianchandani
or an external test setup. The constituent glass dice on Side-B(i.e., Die 1b and Die 2b) are identical to Die 1a and Die 2a,respectively.
In the iGC2 stack assembly (figure 2), Side-B is attachedto the rest of the stack, whereas Side-A is attached to anexternal heat sink. During analytical separation, Side-B isheated while Side-A is cooled by the heat sink. During vaporsampling, Side-A (and the heat sink) is heated while Side-Bis cooled by natural convection together with the rest of thestack.
2.2. Two-stage preconcentrator (PCF2)
Previously reported microfabricated multi-stage preconcen-trators used multiple chambers, each containing one type ofsorbent [10, 13]. In the iGC2, however, the PCF2 containsonly one chamber designed in the shape of a channel; the twostages are formed by packing different sorbents in sequence.This design mimics its macro-scale counterpart: the multi-bedthermal desorption tube. It can be configured to include morethan two stages without redesign.
The PCF2 consists of a channel (width ≈1 mm, depth≈200 μm) formed by Die 4a and Die 5a (figure 2). Thechannel is packed with four segments of particles in series:glass beads (with diameter 150–180 μm, Sigma Aldrich, WI);Carbograph 2 (with surface area ≈10 m2 g−1, diameter 120–150 μm, Grace Davison Discovery Sciences, IL); Carbopack B(with surface area ≈100 m2 g−1, diameter 112–140 μm, SigmaAldrich, WI); glass beads (with diameter 150–180 μm, SigmaAldrich, WI). The segment of Carbograph 2 is intended to trapvapors of lower volatility (e.g., toluene and xylene), and thesegment of Carbopack B is intended to trap vapors of highervolatility (e.g., benzene). The two segments of glass beads, oneat each end of the PCF2 channel, are used to confine the twosegments of sorbents in the central region of the device, wherethe temperature is the highest during thermal desorption.
The PCF2 has advantages over our prior preconcentratordesign [8] because its narrower channel dimension providesless sensitivity to the non-uniformity of sorbent packing, aswell as higher flow velocity at a given volumetric flow rate. Afuture design can be improved, presumably, by incorporatingthe pillar structures and sorbent loading port [8, 26].
2.3. Column, detector, and the stacked iGC2 system
The iGC2 separation column is a channel (of length ≈25 cmand hydraulic diameter ≈230 μm) coated with a layer of≈0.2 μm thick non-polar polydimethylsiloxane (PDMS orOV-1, Ohio Valley Specialty, OH) that serves as the stationaryphase [8]. The column is formed by Die 4b and Die 6 (figure 2).When passing along the separation column, vapor mixturespartition between the stationary phase material and the carriergas. The non-polar PDMS stationary phase used in this workinteracts with the vapor molecules mainly by van der Waalsforce [27]. Vapor molecules with higher molecular weighttypically have a stronger interaction with the stationary phaseand display a longer retention time. Additionally, thickercoatings of the stationary phase provide a stronger interactionwith the vapor molecules and extend retention times.
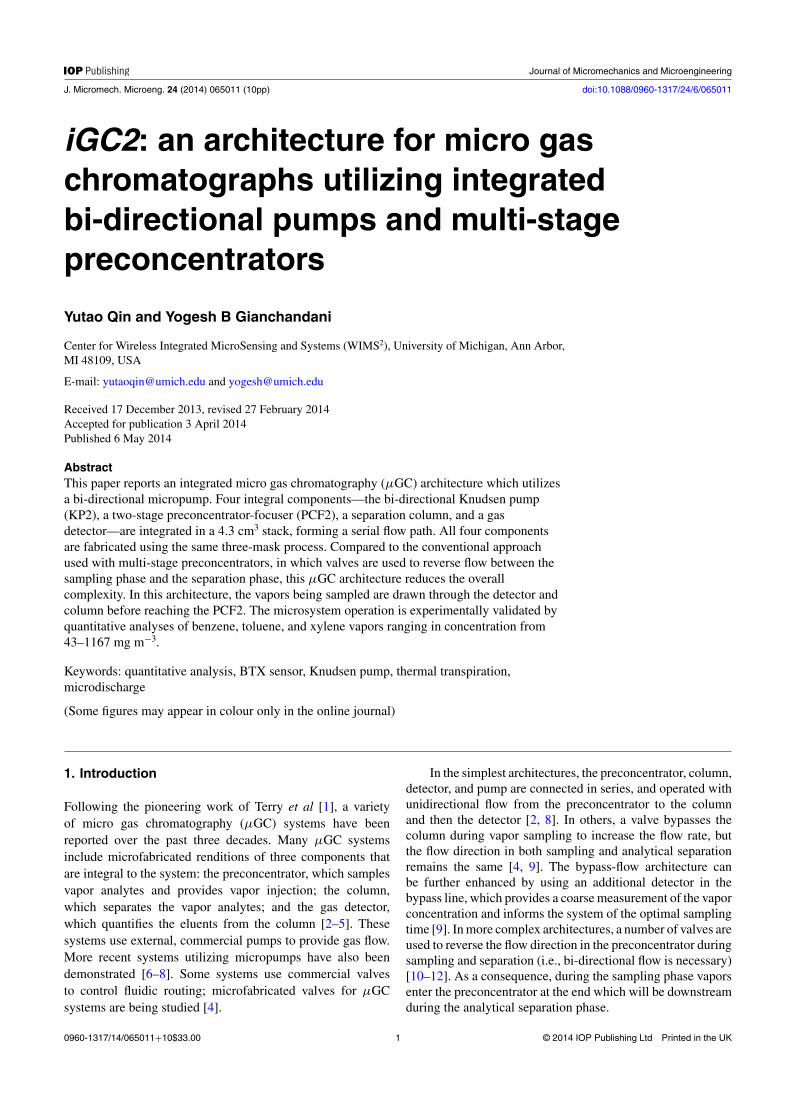
Figure 3. Illustration of the cross-section of the iGC2 system. Thefour components—pump, preconcentrator, separation column, anddetector—form a serial gas flow path, as indicated by the graydashed line.
The gas detector consists of two thin-film metal electrodeson a glass substrate (i.e., Die 6). In this work, the metallayer consists of Ti/Pt of thickness 25/100 nm. The twoelectrodes (i.e., anode and cathode) are spaced 50–200 μmapart. Electrodes of other materials, thickness, and separationcan also be used. The groove in Die 5b forms the detectorchannel that guides gas flow over the electrodes (figure 2).By applying a voltage pulse between the two electrodes, amicrodischarge is generated. The resulting optical intensity atthe line that is specific to the C–H emission can be used toquantify carbon-containing species in the gas flow [8, 28]. Incontrast to the flame ionization detectors (FID) that are oftenused within commercial GC systems, microdischarge-baseddetectors do not require a stored supply of H2 to create theionization, and are more amenable to monolithic integration.
The KP2, PCF2, column, and detector are integratedin the form of a stack (figures 2 and 3), which also usesfourteen 500 μm thick glass spacers (Dice 3a and Dice3b). The spacers provide thermal isolation between adjacentcomponents. Perforations in the spacers allow inter-layer flow.The dashed line in figure 3 indicates the gas flow path of thesystem.
3. Fabrication
The constitutive elements of all four iGC2 components, as wellas the spacers, are fabricated on glass wafers using the samethree-mask lithographic processes. Hence, these elements maybe either fabricated on separate wafers or all on a single wafer.The use of glass as the substrate material has several benefits.It is lower in cost than silicon and ceramic options, and can beeasily micromachined. In addition, the transparent nature of
3

J. Micromech. Microeng. 24 (2014) 065011 Y Qin and Y B Gianchandani
(a) (b)
(c) (d)
Figure 4. Photographs of the iGC2 system. (a) The KP2, (b) thePCF2, (c) the separation column and the discharge-based detector,and (d) the iGC2 system, which has a footprint of 2 × 1.8 cm2 anda volume of 4.3 cm3.
glass permits visual inspection of the interior of the devices,which benefits early stage research and development.
First, a Ti/Pt thin film (of thickness 25/100 nm) isdeposited and patterned to form heaters, thermistors, anddischarge electrodes (using Mask #1). The glass wafer ismicromachined on both sides by sandblasting (Bullen, Inc.,OH) to create fluidic channels and thermal-isolating cutouts(using Mask #2–3).
After wafer dicing, the glass dice are assembled together.The constituent dice of the separation column are spin-coatedwith an SU-8 (MicroChem, MA) layer, which, smoothens thesandblasted surface and also serves as an adhesive betweendice. The column is also coated with the OV-1 stationaryphase using a static coating method, in which an OV-1/pentanesolution is first filled into the column and subsequentlythe pentane is evaporated under vacuum [29]. The resultingthickness of the stationary phase is expected to be in therange of 0.2 μm. The other dice are held in place by a low-viscosity epoxy (Model # Epotek 377, Epoxy Technology, Inc.,MA). The MCE membrane stack of the KP2 is sealed aroundthe perimeter by a viscous epoxy (Model # Stycast2850FT,Henkel, Germany).
The PCF2 is packed with sorbent particles. In thispreliminary PCF2 design, which does not have embeddedfeatures for confining the sorbent particles, a small segment ofcapillary tube (with inner diameter ≈100 μm, length ≈2 mm)is attached to one end of the channel. With a gentle vacuumapplied at this end, the sorbent particles and glass beads aredrawn into the PCF2 channel [26], in sequence, from the otherend, which is later attached to another similar segment ofcapillary tube.
The four components and the spacers are finally integratedinto a stack. Adhesion between the components and spacers isprovided by either an epoxy or a wax bond layer. Photographsof the fabricated components and system are shown in figure 4.
Figure 5. The test setup and steady state performance of the KP2.The data points were obtained by altering the capillary loads andwere linearly fitted to indicate the characteristic lines of the KP2.
The iGC2 system has a footprint of 1.8 × 2.0 cm2 and avolume of 4.3 cm3.
4. Experimental results
In order to characterize their performance, the KP2 and PCF2were separately evaluated without assembly into the full iGC2system. The experimental evaluations focused on the aromatichydrocarbons benzene, toluene, and m-xylene (BTX), whichare typical indoor pollutants.
4.1. KP2
The KP2 was evaluated by measuring its pressure-flowcharacteristics. As indicated in section 2, Side-A of the KP2was attached to an aluminum block that served as a heat sink.In the evaluation of the standalone pumps, Side-B was notattached to the other iGC2 components. As shown in figure 5, acommercial pressure sensor (Model # MPX5010DP, FreescaleSemiconductor, AZ) and a flow meter (Part # FMA-1603A,Omega Engineering, CT) were used to monitor the pressurehead and flow, respectively. Although the former had a ratedmaximum error of ± 500 Pa (including offset variation), theactual error was expected to be much smaller, because it wasused at room temperature within a small pressure range andcorrected for offset. The latter had a rated error of ± 0.02 sccm.Varying flow loads (manifested as capillary tubes with varyinglengths and inner diameters) were used to obtain variouspressure-flow points. The values of the loads were selectedto span a wide range covering the actual load provided by therest of the iGC2 system.
With 1.3 W power applied on Side-B, the pumps typicallyprovided a steady state air flow rate of 0.52 sccm for a pressurehead of 413 Pa; the blocking pressure head, at which the flowwas reduced to zero, was 1254 Pa. This direction of flow isintended for the analytical separation. In the opposite direction,with 3.3 W power applied on Side-A (with the heat sink stillin place, and Side-B cooled only by natural convection), the
4

J. Micromech. Microeng. 24 (2014) 065011 Y Qin and Y B Gianchandani
pump provided a steady state air flow rate of 0.11 sccm againsta pressure head of 87 Pa; the blocking pressure was 259 Pa(figure 5). In general, the relationship between the input powerof the KP2 and the flow rate are approximately linear forintermediate pressure heads.
4.2. PCF2
The PCF2 was characterized for both adsorption and desorp-tion of BTX. The adsorption capability of preconcentrators isoften characterized by the time taken for the vapor analytesflowing through the component to saturate the concentrationmeasured at the exit; this is known as ‘breakthrough’ [13]. Forthe PCF2, the inlet (for vapor sampling) was connected to a2 L dilution bottle (Sigma Aldrich, WI) containing the vaporof benzene, toluene, or m-xylene in N2. The component BTXvapors were individually drawn by a vacuum pump through thePCF2 at flow rates of 0.1, 0.3, and 0.4 sccm. A fixed volume(100 μL) of vapor exiting the PCF2 was periodically routedby a six-port valve to an FID within a commercial GC (Model# Agilent 6890).
In figure 6(a), the BTX concentrations at thepreconcentrator outlet cout are normalized to that at its inletcin; the vapor sampling volume is calculated as the productof sampling flow rate and sampling time. Conventionally,the breakthrough criterion is selected at the point whencout/cin reaches 10% [13]. Using this criterion, the PCF2 in thiseffort had breakthrough volumes of 0.5, 5.4, and 17.6 cm3 forbenzene, toluene, and m-xylene, respectively.
The thermal desorption characteristics of the PCF2 wereevaluated by the desorption peaks observed in chromatograms.The PCF2 was first used to sample an individual analytevapor (i.e., benzene, or toluene, or m-xylene) at 0.1 sccmfor 10 min. Then it was connected upstream of the FIDand downstream of an injection port in a commercial GC(Agilent 6890), which provided a 0.2 sccm N2 flow in theopposing direction, matching the flow to be provided bythe KP2 during the analytical separation phase in the iGC2.Desorption was performed by applying a 10.5 W pulse to theintegrated thin-film heater, which heated the PCF2 to 180 ◦Cin 10 s, immediately followed by a 2.7 W pulse for 5 s, whichmaintained this temperature. This relatively modest heatingrate was selected for superior control and uniformity, whilereducing the likelihood of stress fractures in the device, eventhough sharper desorption peaks are achievable with higherpower.
Typical values of the resulting peak widths measuredat half height (PWHH) were 3.2 s, 4.6 s, and 6.3 s forbenzene, toluene, and m-xylene, respectively (figure 6(b)).Only minimal tailing was observed. Full desorption wasachieved during the first thermal pulse, as verified by a secondthermal pulse that did not provide any additional desorptionpeak.
The preconcentration factors were calculated by thevolume ratios of the vapor sample to the thermal desorption,i.e., the product of the sampling flow rate and the samplingtime divided by the product of the desorption flow rate andthe desorption PWHH [30]. As calculated from figure 6(b),
(a)
(b)
Figure 6. Evaluation of the performance of the PCF2. (a) The outletBTX concentration response (normalized to the inlet concentration)during vapor sampling. (b) BTX desorption peaks with 0.2 sccmN2 flow after sampling 1 cm3 of vapor.
the preconcentration factors for toluene and m-xylene were65 and 48, respectively. The value for benzene cannot beobtained from figure 6(b), because the 1 cm3 sampling volumesubstantially exceeds its breakthrough volume (as illustratedin figure 6(a)). By sampling benzene and toluene with theirbreakthrough volumes, preconcentration factors of 25 and 236were obtained. A preconcentration factor of 143 was obtainedfor m-xylene with a sampling volume of 3 cm3. A thoroughparametric sweep can identify the maximum preconcentrationfactors, but it is beyond the scope of this effort.
4.3. Column and detector
The separation columns were evaluated within an Agilent 6890GC with a vapor injection port located upstream and an FIDlocated downstream [8]. To provide a better demonstration ofthe separation capability of the column, the columns were usedto separate BTX and five interfering alkanes (C5–C9) at roomtemperature, with N2 carrier gas flowing at 0.2 sccm to mimic
5
J. Micromech. Microeng. 24 (2014) 065011 Y Qin and Y B Gianchandani
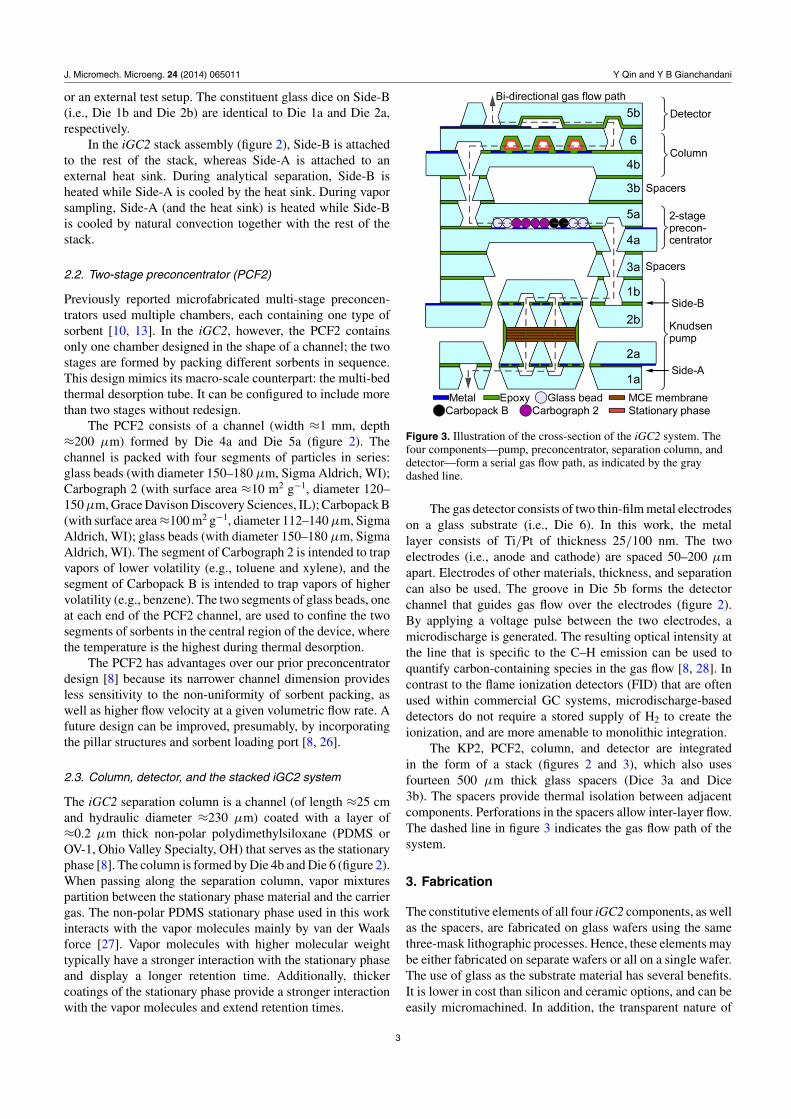
Figure 7. Typical separation of BTX and five alkanes provided bythe column at room temperature. The injector and FID in an Agilent6890 GC were used for testing the column.
the KP2. The eight analytes were separated in less than 2 min(figure 7).
The discharge-based detector was operated with 3–5 msvoltage pulses of 800–1600 V. A handheld spectrometer(Model # USB 2000, Ocean Optics, FL) was used to monitorthe optical emission [8]. As expected, the microdischargeshowed strong optical emissions for N2 within a wavelengthrange of 300–400 nm. The emission intensity at 388 nm, whichis a characteristic line of C–H species, was used to quantifythe BTX vapors eluting the column. To minimize the effectof pulse-to-pulse variation in emission intensity, the emissionpeaks at 388 nm were ratioed to the peaks for the N2 line at337 nm [28]. The detector was operated at 1 Hz (1 pulseddetection per second). With each microdischarge requiring∼10 mJ energy, the average power consumption was in therange of 10 mW, which was negligible compared to the powerconsumption of other iGC2 components (i.e., the KP2 andPCF2). It is notable that such detectors can be operated at evenlower energy levels [31].
4.4. The stacked iGC2 system
The fully assembled iGC2 systems were tested in two differentways. In the first set of experiments, the discharge-baseddetector in the stacked system was not activated. Instead, theFID in an Agilent 6890 GC was used to evaluate the impactof the fluidic architecture upon the output. In the second set ofexperiments, the detector was utilized together with all othercomponents, demonstrating the operation of the full system.
Vapor samples for these tests were prepared byevaporating liquid phase benzene, toluene, and m-xylene (each0.1–2.7 μL) in a 2 L dilution bottle, resulting in vaporconcentrations ranging from 43–1167 mg m−3. The bottle andthe iGC2 system were previously purged using ultra-high-purity N2 to minimize any impurities that might affect theevaluation of the system. With the bottle connected to End-B(figure 1) of the iGC2 system, the KP2 was used to provide
Figure 8. Four consecutive runs of BTX separations provided by afully assembled iGC2 system operated with a commercial FID. Ineach run, the system was used to analyze the same BTX vapor withthe same sampling volume.
a sampling flow of 0.05 sccm for 5–15 min (using 3.3 Winput power), drawing 0.25–0.75 cm3 of the vapor through thedetector and the column into the PCF2. Then the system wasallowed to cool down naturally for ≈10 min.
In the first set of experiments, End-B (figure 1) of theiGC2 system was then connected to the FID, whereas End-A remained open to ambient room air, which served as thecarrier gas. The KP2 was then powered up to 1.3 W to provide0.2 sccm air flow for 20 s before the PCF2 was powered up.This delay ensured a sufficient flow to be established priorto the analytical separation. The eluent from the column wasidentified and quantified by the FID. The tests were repeatedfour times in succession with each BTX vapor sample, usingidentical operating conditions in order to evaluate repeatability.Typical results are shown in figure 8; the repeatability isevident. As expected, the retention peaks of BTX appear assuperposed onto a baseline response. The system operationparameters are summarized in table 1.
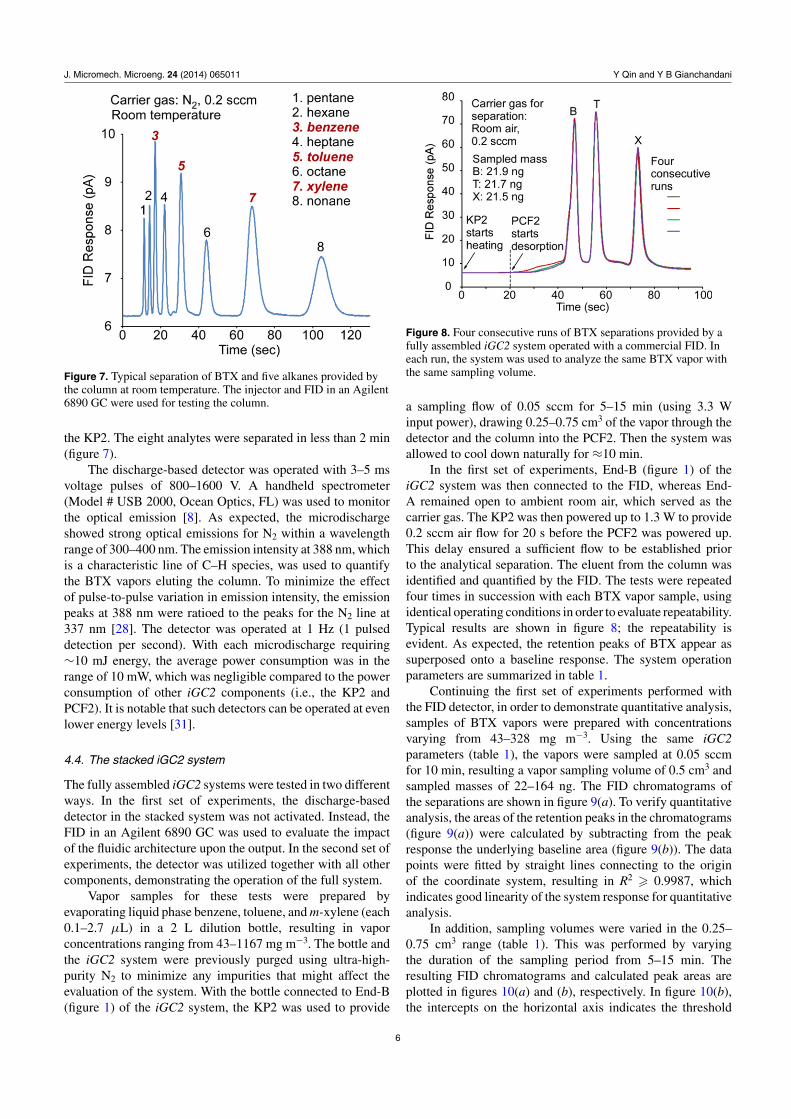
Continuing the first set of experiments performed withthe FID detector, in order to demonstrate quantitative analysis,samples of BTX vapors were prepared with concentrationsvarying from 43–328 mg m−3. Using the same iGC2parameters (table 1), the vapors were sampled at 0.05 sccmfor 10 min, resulting a vapor sampling volume of 0.5 cm3 andsampled masses of 22–164 ng. The FID chromatograms ofthe separations are shown in figure 9(a). To verify quantitativeanalysis, the areas of the retention peaks in the chromatograms(figure 9(a)) were calculated by subtracting from the peakresponse the underlying baseline area (figure 9(b)). The datapoints were fitted by straight lines connecting to the originof the coordinate system, resulting in R2 � 0.9987, whichindicates good linearity of the system response for quantitativeanalysis.
In addition, sampling volumes were varied in the 0.25–0.75 cm3 range (table 1). This was performed by varyingthe duration of the sampling period from 5–15 min. Theresulting FID chromatograms and calculated peak areas areplotted in figures 10(a) and (b), respectively. In figure 10(b),the intercepts on the horizontal axis indicates the threshold
6
J. Micromech. Microeng. 24 (2014) 065011 Y Qin and Y B Gianchandani
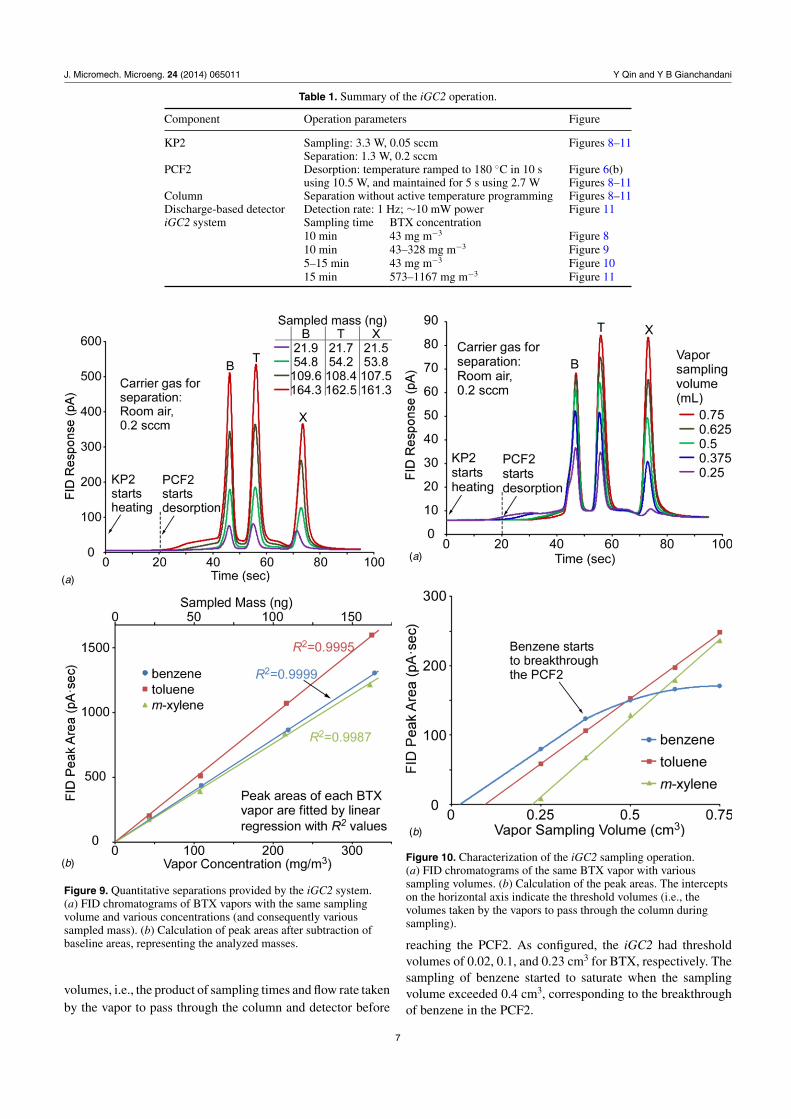
Table 1. Summary of the iGC2 operation.
Component Operation parameters Figure
KP2 Sampling: 3.3 W, 0.05 sccm Figures 8–11Separation: 1.3 W, 0.2 sccm
PCF2 Desorption: temperature ramped to 180 ◦C in 10 s Figure 6(b)using 10.5 W, and maintained for 5 s using 2.7 W Figures 8–11
Column Separation without active temperature programming Figures 8–11Discharge-based detector Detection rate: 1 Hz; ∼10 mW power Figure 11iGC2 system Sampling time BTX concentration
10 min 43 mg m−3 Figure 810 min 43–328 mg m−3 Figure 95–15 min 43 mg m−3 Figure 1015 min 573–1167 mg m−3 Figure 11
(a)
(b)
Figure 9. Quantitative separations provided by the iGC2 system.(a) FID chromatograms of BTX vapors with the same samplingvolume and various concentrations (and consequently varioussampled mass). (b) Calculation of peak areas after subtraction ofbaseline areas, representing the analyzed masses.
volumes, i.e., the product of sampling times and flow rate takenby the vapor to pass through the column and detector before
(a)
(b)
Figure 10. Characterization of the iGC2 sampling operation.(a) FID chromatograms of the same BTX vapor with varioussampling volumes. (b) Calculation of the peak areas. The interceptson the horizontal axis indicate the threshold volumes (i.e., thevolumes taken by the vapors to pass through the column duringsampling).
reaching the PCF2. As configured, the iGC2 had thresholdvolumes of 0.02, 0.1, and 0.23 cm3 for BTX, respectively. Thesampling of benzene started to saturate when the samplingvolume exceeded 0.4 cm3, corresponding to the breakthroughof benzene in the PCF2.
7

J. Micromech. Microeng. 24 (2014) 065011 Y Qin and Y B Gianchandani
(a)
(b)
Figure 11. Full iGC2 system operation with the use of thestack-integrated discharge-based detector. (a) Chromatograms ofBTX vapors with the same sampling volume and variousconcentrations (and consequently various sampled mass).(b) Calculation of peak areas after subtraction of baseline areas,representing the analyzed masses.
In the second set of experiments conducted with fullyassembled iGC2 systems, the sampling procedure remainedthe same as the first set, as did the operating parameters(table 1). Samples of BTX with concentrations of 573–1167 mg m−3 were analyzed. To reduce the noise from spectralemissions of air, N2 was used as the carrier gas by connecting aN2-filled Tedlar R©bag to End-A (figure 1) of the iGC2 system.The resulting emission-intensity chromatograms (figure 11(a))demonstrate separations of BTX with retention times similar tothose shown in figures 8(a), 9(a), and 10(a). However, the peakheights of m-xylene are much smaller than those of toluenein figure 11(a). This is different from the FID chromatogramobtained with the same vapor sampling volume in figure 10(a),where toluene and m-xylene show similar peak heights.Additionally, the baseline fluctuations are not observed in
figure 11(a). The calculated peak areas demonstrate positivecorrelations with sampled vapor concentrations, showingpromise of quantitative analyses (figure 11(b)). However, incontrast to figure 9(b), the peak areas in figure 11(b) are notproportional to the vapor concentrations. This underscoresthe need for establishing the relationship between spectralintensity and vapor concentration for various analytes.
5. Discussion and conclusion
Overall, the experimental results validate the functionalityof a valveless μGC architecture that utilizes a bi-directionalmicropump with a two-stage preconcentrator. Further, theresults are repeatable, and quantitative analysis appearspossible despite the modest flow rates provided by themotionless pump. The facile nature of the fabrication processholds promise for eventually developing a low-cost system.A number of observations can be made about the constitutivecomponents and future work.
In contrast to a previously reported approach ofusing thermoelectric elements to implement a bi-directionalKnudsen pump [25], the direct integration of heaters on bothsides of the thermal transpiration membranes in the KP2compromises flow rate in the sampling period (figure 5) forstructural simplicity. Nevertheless, the small sampling flowrate can be compensated by extending the sampling period.In principle, bi-directional flow can also be achieved by usingtwo opposing uni-directional pumps. In that case, however,each pump would be required to overcome the flow resistanceof the other, which is less efficient than the use of a singlebi-directional pump.
In the analytical separation periods, PCF2 provided 3–6 s-wide desorption peaks under the modest flow rate (≈0.2 sccm)available from KP2. Although the width of these desorptionpeaks may have contributed to the broadening of the retentionpeaks, quantitative analyses are evidently possible, as long asthe retention peaks reach baseline-separation, i.e., a conditionwhere the signal returns to the baseline between consecutivepeaks (as demonstrated in figure 9). The dual-peak shapes ofthe benzene and toluene desorption in figure 6(b) are likelythe result of the two stages within the PCF2 desorbing undera modest heating rate: the stage packed with Carbograph 2desorbs slightly before the stage packed with Carbopack B.
It is notable that the relative heights of retention peaksmeasured by microdischarge-based detection (figure 11(a))are different from those measured by the commercial FID(figure 10(a)). This is likely related to the difference betweenthe two ionization methods that are involved. However, evenwith microdischarge-based detection, the calculated areas ofthe retention peaks are correlated to vapor concentration,demonstrating promise for quantitative analyses. This isencouraging, given the simple and unsealed nature of themicrodischarge-based detector. The use of an N2 carrier gas,and ambient contaminants can, however, increase the spectralnoise [32, 33].
The overall system power consumption can be estimatedfrom table 1. For a vapor sampling time of 10 min andseparation duration of 1.5 min, the average system power
8

J. Micromech. Microeng. 24 (2014) 065011 Y Qin and Y B Gianchandani
consumption is 3.2 W, which is dominated by the KP2operation during the vapor sampling phase. This powerconsumption is higher than those of some of the previouslyreported systems (e.g., 0.7 W in [2], which uses a commercialpump), because of the inefficiency of the KP2 heat sink whendriving flow during vapor sampling. Nevertheless, despitethe relatively high power consumption, the Knudsen pumpis still an attractive candidate for μGC integration, becauseof its compactness, simplicity in fabrication, and ultra-highreliability [24]. Thermal optimization of the system designand overall assembly are expected to reduce the powerconsumption.
A number of improvements can be envisioned for futuredesigns of the iGC2. For example, a longer column canprovide better separation of retention peaks, and heating ofthe column both during sampling and separation is likelyto improve various aspects of the performance. In addition,the use of sorbents with higher surface area within the PCF2would permit analyses of vapors with lower concentrations.All these approaches are intended to analyze more complexvapor mixtures. Nonetheless, a more powerful micro gas pumpmay be required to maintain the gas flow rate in a longercolumn. This can be accomplished by a multi-stage Knudsenpump. The stackable architecture in this work provides asimple and compact integration of the system, as well asthe scalability to longer columns (by stacking multiple shortcolumns). However, it is difficult for the stackable architectureto accommodate a multi-stage Knudsen pump, which requiresmore thermal isolation between multiple heaters and heatsinks. New architectures for multi-stage Knudsen pumps arecurrently under investigation.
The packaging of the system is still under investigation.One possibility is a case with an embedded heat sink,circuit board, and fittings for a mini-spectrometer. The leadtransfer from the components to the circuit board could beaccomplished by using pin assemblies.
Acknowledgments
The study was supported in part by the MicrosystemsTechnology Office of the Defense Advanced Research ProjectsAgency High-Vacuum Program (DARPA Contract #W31P4Q-09-1-0011). Facilities used for this research included theLurie Nanofabrication Facility (LNF) operated by the Solid-State Electronics Laboratory (SSEL) and the Universityof Michigan. The authors thank Professor Ken Wise andMr Robert Gordenker for providing access to test facilities,and Dr Seungdo An for wafer metallization.
References
[1] Terry S C, Jerman J H and Angell J B 1979 A gaschromatographic air analyzer fabricated on a silicon waferIEEE Trans. Electron Devices 26 1880–6
[2] Gordenker R J M and Wise K D 2012 A programmablepalm-size gas analyzer for use in micro autonomoussystems Proc. SPIE 8373 83731O
[3] Zampolli S, Elmi I, Mancarella F, Betti P, Dalcanale E,Cardinali G C and Severi M 2009 Real-time monitoring of
sub-ppb concentrations of aromatic volatiles with aMEMS-enabled miniaturized gas-chromatograph SensorsActuators B 141 322–8
[4] Lewis P R et al 2006 Recent advancements in the gas-phaseMicroChemLab IEEE Sensors J. 6 784–95
[5] Manginell R P, Bauer J M, Moorman M W, Sanchez L J,Anderson J M, Whiting J J, Porter D A, Copic Dand Achyuthan K E 2011 A monolithically-integrated μGCchemical sensor system Sensors 11 6517–32
[6] Kim H, Steinecker W H, Reidy S, Lambertus G R, Astle A A,Najafi K, Zellers E T, Bernal L P, Washabaugh P Dand Wise K D 2007 A micropump-driven high-speedMEMS gas chromatography system IEEE Int. Conf. onSolid-State Sensors, Actuators and Microsystems Conf.(Transducers), (Lyon, France, June 2007) pp 1505–8
[7] Liu J, Gupta N K, Wise K D, Gianchandani Y B and Fan X2011 Demonstration of motionless Knudsen pump basedmicro-gas chromatography featuring micro-fabricatedcolumns and on-column detectors Lab Chip 11 3487–92
[8] Qin Y and Gianchandani Y B 2013 A facile, standardizedfabrication approach and scalable architecture for a microgas chromatography system with integrated pump IEEE Int.Conf. on Solid-State Sensors, Actuators and Microsystems(Transducers), (Barcelona, Spain, June 2013) pp 2755–8
[9] Adkins D R and Lewis P R 2009 Compact low-power gasdetector for chemical alarms SPIE Defense and SecuritySensing Conf. Proc. (Orlando, FL) 7304 73040S
[10] Lu C-J et al 2005 First-generation hybrid MEMS gaschromatograph Lab Chip 5 1123–31
[11] Kim S K, Chang H and Zellers E T 2011 Microfabricated gaschromatograph for the selective determination oftrichloroethylene vapor at sub-parts-per-billionconcentrations in complex mixtures Anal. Chem.83 7198–206
[12] Collin W, Serrano G, Wright L K, Chang H, Nunovero Nand Zellers E T 2013 Fieldable MEMS gas chromatographfor rapid determinations of explosive marker compounds incomplex mixtures IEEE Int. Conf. on Solid-State Sensors,Actuators and Microsystems (Transducers), (Barcelona,Spain, June 2013) pp 2763–6
[13] Tian W-C, Chan H K L, Lu C-J, Pang S W and Zellers ET2005 Multiple-stage microfabricated preconcentrator-focuser for micro gas chromatography systemJ. Microelectromech. Syst. 14 498–507
[14] Oh K W and Ahn C H 2006 A review of microvalvesJ. Micromech. Microeng. 16 13–39
[15] Robertson J K and Wise K D 1998 A low pressuremicromachined flow modulator Sensors Actuators AA71 98–106
[16] Park J M, Evans A T, Rasmussen K, Brosten T R, Nellis G F,Klein S A and Gianchandani Y B 2009 A microvalve withintegrated sensors and customizable normal state forlow-temperature operation J. Microelectromech. Syst.18 868–77
[17] Henning A K et al 1998 Microfluidic MEMS forsemiconductor processing IEEE Trans. Compon. Packag.Manuf. Technol. B 21 329–37
[18] Potkay J A and Wise K D 2012 A hybrid thermopneumaticand electrostatic microvalve with integrated positionsensing Micromachines 3 379–95
[19] Qin Y and Gianchandani Y B 2014 A micro gaschromatograph with integrated bi-directional pump forquantitative analyses IEEE Int. Conf. on Micro ElectroMechanical Systems (MEMS), (San Francisco, Jan. 2014)pp 294–7
[20] Agah M, Potkay J A, Lambertus G, Sacks R and Wise K D2005 High-performance temperature-programmedmicrofabricated gas chromatography columnsJ. Microelectromech. Syst. 14 1039–50
9

J. Micromech. Microeng. 24 (2014) 065011 Y Qin and Y B Gianchandani
[21] Narayanan S, Alfeeli B and Agah M 2012 Two-port staticcoated micro gas chromatography column with anembedded thermal conductivity detector IEEE Sensors J.12 1893–900
[22] Reynolds O 1879 On certain dimensional properties of matterin the gaseous state Phil. Trans. R. Soc. 170 727–845
[23] Knudsen M 1909 Eine Revision der Gleichgewichtsbedingungder Gase. Thermische Molekularstromung Ann. Phys.(Leipzig) 336 205–29 (in German)
[24] Gupta N K and Gianchandani Y B 2011 Thermal transpirationin mixed cellulose ester membranes: enabling miniature,motionless gas pumps Microporous Mesoporous Mater.142 535–41
[25] Pharas K and McNamara S 2010 Knudsen pump drivenby a thermoelectric material J. Micromech. Microeng.20 1–7
[26] Seo J H, Kim S K, Zellers E T and Kurabayashi K 2012Microfabricated passive vapor preconcentrator/injectordesigned for microscale gas chromatography Lab Chip12 717–24
[27] Barry E F 2004 Columns: packed and capillary; columnselection in gas chromatography Modern Practice of Gas
Chromatography ed R L Grob and E F Barry (New York:Wiley) pp 65–191
[28] Mitra B, Levey B and Gianchandani Y B 2008 Hybridarc/glow microdischarges at atmospheric pressure and theiruse in portable systems for liquid and gas sensing IEEETrans. Plasma Sci. 36 1913–24
[29] Reidy S, Lambertus G, Reece J and Sacks R 2006High-performance, static-coated silicon microfabricatedcolumns for gas chromatography Anal. Chem. 78 2623–30
[30] Namiesnik J 1988 Preconcentration of gaseous organicpollutants in the atmosphere Talanta 35 567–87
[31] Mitra B and Gianchandani Y B 2008 The detection ofchemical vapors in air using optical emission spectroscopyof pulsed microdischarges from two- and three- electrodemicrostructures IEEE Sensors J. 8 1445–54
[32] Hoskinson A R, Hopwood J, Bostrom N W, Crank J Aand Harrison C 2011 Low-power microwave-generatedhelium microplasma for molecular and atomic spectrometryJ. Anal. At. Spectrom. 26 1258–64
[33] Wilson C G, Gianchandani Y B, Arslanbekov R R, Kolobov Vand Wendt A E 2003 Profiling and modeling of dc nitrogenmicroplasmas J. Appl. Phys. 94 2845–51
10