Embed Size (px)
Citation preview
204 / 0 / 0
242 / 220 / 219
119 / 147 / 60
23 / 55 / 94
0 / 176 / 240
198 / 217 / 241
255 / 192 / 0
235 / 241 / 222
127 / 127 / 127
242 / 242 / 242
96 / 74 / 123
8 / 0 / 83
73/ 10 / 61
1/210/255
34/21/124
189/21/80
EuroChem FY 2017 IFRS Results Conference Call 8 February 2018
Start time: 10:00 NY / 15:00 London / 16:00 Zug / 18:00 Moscow Dial-in details https://cossprereg.btci.com/prereg/key.process?key=P9DF3TP9P

204 / 0 / 0
242 / 220 / 219
119 / 147 / 60
23 / 55 / 94
0 / 176 / 240
198 / 217 / 241
255 / 192 / 0
235 / 241 / 222
127 / 127 / 127
242 / 242 / 242
96 / 74 / 123
230 / 224 / 236
This presentation has been prepared by EuroChem Group AG (“EuroChem” or the “Company”) for informational purposes, and may include forward-looking statements or projections, These forward-looking statements or projections include matters that are not historical facts or statements and reflect the Company’s intentions, beliefs or current expectations concerning, among other things, the Company’s results of operations, financial condition, liquidity, performance, prospects, growth, strategies, and the industry in which the Company operates, By their nature, forward-looking statements and projections involve risks and uncertainties as they relate and depend on events and circumstances that may or may not occur in the future, The Company therefore cautions you that forward-looking statements and projections are not guarantees of future performance and that the actual results of operations, financial condition and liquidity of the Company and the development of the industry in which the Company operates may differ materially from those made in or suggested by the forward-looking statements or projections contained in this presentation, Factors that could cause the actual results to differ materially from those contained in forward-looking statements or projections in this presentation may include, among other things, general economic conditions in the markets in which the Company operates, the competitive environment in, and risks associated with operating in, such markets, market change in the fertilizer and related industries, as well as many other risks affecting the Company and its operations, In addition, even if the Company’s results of operations, financial condition and liquidity and the development of the industry in which the Company operates are consistent with the forward-looking statements or projections contained in this presentation, those results or developments may not be indicative of results or developments in future periods, The Company does not undertake any obligation to review or confirm expectations or estimates or to update any forward-looking statements or projections to reflect events that occur or circumstances that arise after the date of this presentation,
This document does not constitute or form part of any advertisement of securities, any offer or invitation to sell or issue, or any solicitation of any offer to purchase or subscribe for, any securities of the Company in any jurisdiction, nor shall it or any part of it nor the fact of its presentation, communication or distribution form the basis of, or be relied on in connection with, any contract or investment decision, No reliance may be placed for any purpose whatsoever on the information contained in this document or on assumptions made as to its completeness, No representation or warranty, express or implied, is given by the Company, its subsidiaries or any of their respective advisers, officers, employees or agents, as to the accuracy of the information or opinions or for any loss howsoever arising, directly or indirectly, from any use of this presentation or its contents,
Due to rounding, some totals may not correspond with the sum of the separate figures
Participant Joining Details
UK Freefone 0800 389 7473
UK Direct 01296 480 104
2
https://cossprereg.btci.com/prereg/key.process?key=P9DF3TP9P

EuroChem Group Overview
10 Novomoskovskiy Azot
7 Lifosa 11 BMU
8 Phosphorit Nevinnomysskiy Azot 12
Antwerpen 6
Fertilizer production
1 Global headquarters (Zug)
2 Kovdorskiy GOK
5 EuroChem Fertilizers
Raw material mining
17 Tuapse
16 Murmansk
14 Sillamae
15 Ust-Luga (UC)
Logistics
1
2
5 3
4
10 8
11 6
17
16
15
25
20
26
24
28
18
36
35
23
32
12
7
14
13
13 EuroChem-Migao
19 US
20 Brazil
22 Spain
30 Moldova
31 Belarus
29 Bulgaria
18 Mexico
28 Greece
24 Germany
26 Italy
25 Switzerland
Hungary 27
Sales
3 VolgaKaliy (UC)
4 Usolskiy (UC)
9 Northwest (UC)
19
9
UC = under construction
Vertically integrated global business supporting regional market commitment
23 France
32 Ukraine
Serbia
33 Turkey
34 Russia
35 Singapore
36 China
27 29
30
31
33
34
Romania
Expected 1H 18
21 Argentina
21
22
Own raw materials, production facilities, and logistics assets create unique global offering.
Sales to more than 100 countries supported by EuroChem sales platform
Access to international customers through EuroChem Agro and trade companies
Growing global distribution platform with series of acquisitions over the last 24 months:
• Bentrei (US)
• Tocantins (Brazil)
• Agricola (Bulgaria)
• Hispalense de Liquidos (Spain)
• Emerger Fertilizantes (Argentina)
• New offices/centres in Hungary, Moldova, Russia
Months away from start of commissioning operations of 2 potash projects in Russia (8.3 MMT of KCl per year)
Increasing product offering with innovative solutions
2017 total fertilizer production up 2% y-o-y of 10.6 MMT (2016: 10.4 MMT)
Vertical integration: own raw materials, port terminals, rail stock,
construction/repair works, Europe/CIS/Americas distribution capacity
o 3 Nitrogen plants (2 in Russia, 1 in Belgium) – nutrient capacity of
2.6 MMT of N, increasing to 3.4 in 2018 with launch of new NH3
plant.
o 3 Phosphate plants (2 in Russia and 1 in Lithuania) – nutrient
capacity of 1.27 MMT of P2O5 (phosphoric acid)
o Apatite (Russia) - P2O5-rich (37%-38%) and low-MER(1) content
(0.057) apatite ore (2.8 MMT per year) covers c.75% of own
production needs for all phosphate plants and Antwerp, additional
volumes from Kazakhstan: 600 KMT phosphate flour
o Iron ore as a co-product of apatite mining: up to 5.8 MMT of iron ore
(Fe content 63.5%)
o Logistics assets include transshipment capacity of c.10.2 MMT, of
which c.3.5 MMT in the EU, ~ 6,400 own rail stock/depot
o Sales : global platform anchored on EuroChem Agro and CIS position
with expanding footprint across the Americas
Projects
o Potash (K) : 2 greenfield projects in Russia with targeted capacity of
over 8.3 MMT of KCl per year (5 MMT K2O). First product Q1 2018
o Ammonia – 1 MMT facility in close proximity to Phosphorit
(Russia/Baltic Sea), startup 2018
• Total employees: >25,000
3
(1) Minor element ratio

EuroChem Group Overview
Target raw material self-sufficiency (ammonia, phosphate rock, potash)
Enhance cash cost position and reduce risk/volatility of earnings
Cost leadership through vertical integration
Build leading low-cost potash production
Maximize internal processing of potash for NPK, NK, SOP production
Growth through potash
The proximity to customers in key home markets provided via distribution allows the Group to sell at a premium and exploit seasonality patterns
Obtain valuable market knowledge from direct end-user contact with regards to product quality, R&D, and services
Proximity to Customers
Maximize specialty products and
emphasize the de-
commoditization of the Group’s
fertilizer product portfolio
Expand industrial portfolio
Premium product R&D
Value-added product range
Vertically integrated business model
Ongoing and potential investment projects By-products
Phosphate Potash
3 Nitrogen fertilizer
plants
c.12.9MMT of nitrogen
capacity(3)(4)
3 Phosphates fertilizer
plants
c.4.0 MMT of phosphates capacity(2)(4)
2 potash projects underway in Russia
with a combined targeted capacity
of over 8MMT MOP
Phosphoric acid
Phosphate rock
Nitrogen
Iron ore
Ammonia (NH3)
1mmt pa project
Maritime transhipment facilities in Russia, Estonia, Belgium and c.6k rail cars and 43 locomotives
Sales to more than 100 countries supported by own distribution
Natural gas (access to several
deposits in proximity to Group assets)
Potash ore reserves & resources in excess
of 10 BMT(1)
Ust-Luga
Source: Company data; (1) MI&I resources in accordance with Russian classification system; (2) Phosphate and complex mineral fertilizers; (3) Nitrogen mineral fertilizers and organic synthesis products; (4) The capacity data represents theoretical capacity as certain production units can produce several types of products, for example, certain production units can be configured to produce either DAP or MAP – but not both at the same time. Final production volumes ultimately depend on how the production units are configured
Key strategy pillars
4

Fertilizer Sector Market backdrop
Averages are derived from weekly prices
Nitrogen (US$/tonne)
Phosphates (US$/tonne)
Iron ore (US$/tonne)
Average market prices for key products (US$/tonne)
Key themes: • India / Brazil subsidy
and currency • MEA capacity • Producer discipline
Key themes: • Chinese costs /
exports / capacity rationalization
• New capacity • Indian subsidies • Acreage plans
Key themes: • China steel demand • Global supply
dynamics • CNY movements
2017 Backdrop
Q4-17 Q4-16 Y-o-Y,
chng % 2017 2016
Y-o-Y, chng %
Ammonia
(FOB Yuzhny) $283 $190 +49% $265 $236 +12%
Prilled urea
(FOB Yuzhny) $246 $206 +19% $220 $198 +11%
AN
(FOB Black Sea) $216 $179 +21% $191 $165 +15%
MAP
(FOB Baltic) $360 $320 +13% $348 $338 +3%
MOP
(FOB Baltic, spot) $235 $221 +7% $228 $235 -3%
Iron ore
(63.5% Fe, CFR China) $67 $72 -7% $73 $60 +22%
• More supportive fertilizer pricing backdrop following launch of new
capacity
• Chinese fertilizer production rates decline on rising input costs and
stricter environmental controls – exports significantly lower
year-on-year.
o Urea exports down 47% y-o-y to 4.7 MMT, (2015: 13.7 MMT)
o DAP exports 6% lower y-o-y to 6.4 MMT , (2015: 8 MMT)
o Structural changes in Chinese cash costs (higher domestic
tariffs/prices for electricity, rail/truck transportation, coal)
• Global nutrient demand
• N: slight increase to 106.5 MMT of N
• P: stable at 48.2 MMT P2O5
• K: up 2% to 35.4 MMT K2O
$ 0
$ 100
$ 200
$ 300
$ 400
$ 500
Prilled urea (FOB Yuzhniy) Ammonia (FOB Yuzhniy)
AN (FOB Black Sea) UAN (FOB Black Sea)
$ 200
$ 250
$ 300
$ 350
$ 400
$ 450
$ 500
MAP (FOB Baltic) DAP (FOB Baltic) NPK 16:16:16 (FOB Baltic)
$ 0
$ 40
$ 80
$ 120
Iron ore (CFR China)
5

EuroChem Group Overview
20
16
2
01
7
Completed tender on 2017 LPNs ($426m) and placed $500m Eurobonds issue
Brazil Distribution Acquisition of Fertilizantes Tocantins with blending facilities and established network of 2,000 customers in the North, Northeast and Mid-West of Brazil.
Strategically located in Brazil’s emerging fertile farming regions in the North, Northeast and Mid-West. Blending facilities, market expertise and established network of 2,000 customers. Double digit sales growth for 7 consecutive years.
Distribution Centre in Hungary New center to mainly distribute EuroChem products and specialty fertilizers from Fertilia Ltd., a leading Hungarian producer and distributor.
First Ural-20 mining machine starts at Usolskiy
Selected key events
Acquisition of a minority interest (50%-1 share) in Hispalense de Liquidos
EuroChem sells Severneft-Urengoy
EuroChem Group AG obtains Unsecured $750 Million Facility
EuroChem acquires Argentinian Fertilizer Distributor Emerger Fertilizantes
The acquisition of the privately-owned distributor of premium and standard fertilizers in Argentina will further strengthen EuroChem’s footprint in Latin America which is an important region currently accounting for 11% of the Group’s fertilizer sales. The market for fertilizers in Argentina is expected to increase by 40% to 5.5 MMT in 2020.
In November 2017 the Group divested its Severneft-Urengoy gas operator – future oil & gas focus to center on the exploration and development of gas condensate fields in the Astrakhan and Saratov regions in Russia, and the Kamenkovsky gas field in Kazakhstan.
EuroChem launches new subsidiary in Bulgaria
EuroChem Places US$ 500m Eurobond
Acquisition of a minority interest (50%-1 share) in Hispalense de Liquidos, a family-owned producer of liquid NPK blends located in the south of Spain. The deal gives EuroChem access to additional production capability and technical know-how, enabling the Group to expand the scope of its premium product offering.
EuroChem Usolskiy Potash readies for commissioning of MOP production mill
20
18
Usolskiy beneficiation system filled with ore and brine as of early February. Initial production to begin in the second half of February/early March, with regular production and sustained ramping-up of operations to follow from early May.
6
EuroChem Group Overview
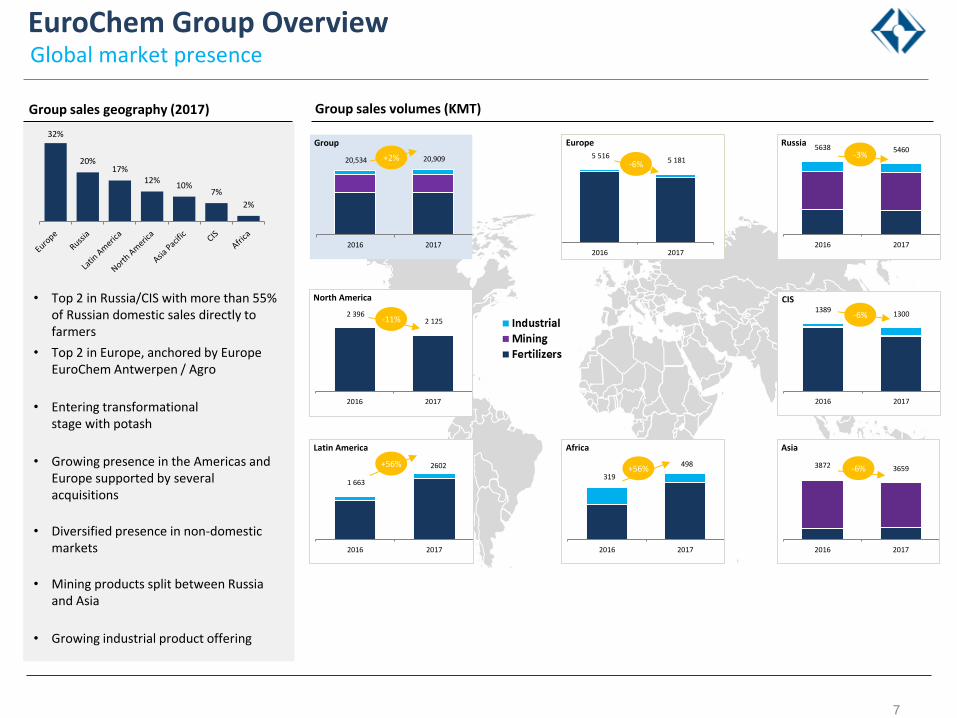
20,534 20,909
2016 2017
Group
• Diversified presence in non-domestic markets
• Top 2 in Russia/CIS with more than 55% of Russian domestic sales directly to farmers
• Top 2 in Europe, anchored by Europe EuroChem Antwerpen / Agro
• Growing presence in the Americas and Europe supported by several acquisitions
Group sales volumes (KMT)
From 2018, added focus on Brazilian market with world’s lowest cost potash
• Entering transformational stage with potash
• Mining products split between Russia and Asia
Group sales geography (2017)
Global market presence
+2%
32%
20% 17%
12% 10%
7%
2%
• Growing industrial product offering
1 663
2016 2017
Latin America
2602 +56%
5 516 5 181
2016 2017
Europe
-6%
2 396 2 125
2016 2017
North America
-11%
319
2016 2017
Africa
498 +56%
5638 5460
2016 2017
Russia
-3%
1389 1300
2016 2017
CIS
-6%
3872 3659
2016 2017
Asia
-6%
7

EuroChem Group Overview
Geography of sales (% of total)
Revenues (US$bn), Gross margin (%) EBITDA (US$m), EBITDA margin (%)
Key ratios (LTM)
(1) Defined as per bank covenants.
Key 2017 figures
12M-16 3M-17 6M-17 9M-17 12M-17
Net debt1 / EBITDA 2.85x 2.82x 2.87x 2.90x 2.88x
Funds from operations / Gross debt1 20% 18% 18% 17% 18%
EBITDA / interest coverage 5.36x 5.00x 4.80x 4.46x 4.43x
Return on capital employed 17% 16% 16% 16% 17%
$402
$210 $234 $286 $349 $241 $254 $286
$1,133 $1,130
32%
21% 22%
27% 26%
23% 22% 22%
26%
23%
EBITDA ($m) EBITDA margin (%)
$1,255 $1,013 $1,054 $1,053
$1,336 $1,061 $1,172 $1,296
$4,375
$4,866
41%
34% 35% 36%
40%
35% 35% 37% 37% 37%
Q1-16 Q2-16 Q3-16 Q4-16 Q1-17 Q2-17 Q3-17 Q4-17 2016 2017
Revenues ($m) Gross margin (%)
44% 31% 34% 35% 35%
25% 33% 32% 36% 32%
16%
18% 20% 21% 19%
24% 19% 17%
18% 20%
6% 15% 12% 8% 10%
9% 12%
9% 10%
10%
20% 18% 11% 10%
14% 15% 8%
11%
15% 12%
4% 11% 13% 15%
12% 15% 16% 22%
11% 17%
7% 5% 10% 10% 6% 8% 8% 7% 8% 7% 2% 1% 1% 2% 3% 3% 3% 1% 1% 2%
Europe Russia Asia Pacific North America Latin America CIS Africa
8

EuroChem Group Overview
$1,133 $1,130
+170
+34
-18
-21
-30
-66 -5
-67
EBITDA12M-16
Salesvolumes and
mix(EuroChem)
Prices (incl.FX)
Other sales(incl. 3rd
partyproducts)
Variableproduction
costs
Fixed costs(excl. effectsof FX rates)
Effects of FXrates on
fixed costs
FX gain/lossfrom
operations
EBITDA12M-17
Other
items
net*
Rouble appreciation overshadowing stronger product pricing environment
EBITDA development
Product 2017 2016 Y-o-Y,
chng %
Ammonia
(FOB Yuzhny) $265 $236 +12%
Prilled urea
(FOB Yuzhny) $220 $198 +11%
AN
(FOB Black Sea) $191 $165 +15%
MAP
(FOB Baltic) $348 $338 +3%
Iron ore
(CFR China) $73 $60 +22%
• EBITDA remained in line y-o-y at $1,130m
• Despite higher prices, profitability adversely affected by impact of rouble appreciation and one off items.
Selected sales volumes (KMT)
2017 2016 Y-o-Y,
chng % 2017 2016
Y-o-Y, chng %
Fertilizer products 13,470 13,415 +0% 9,678 10,022 -3%
Feed phosphates 348 300 +16% 336 289 +16%
Mining products 5,927 6,029 -2% 5,916 6,022 -2%
Industrial products 1,512 1,494 +1% 1,512 1,494 +1%
EuroChem products only
EBITDA, $m
40
45
50
55
60
65
70
75
80
85
90
Jan-16 Apr-16 Jul-16 Oct-16 Jan-17 Apr-17 Jul-17 Oct-17 Jan-18
RUB/USD Exchange rate
* Other items (net) mainly comprised of bad debt provisions of $14.3m, VolgaKaliy write-off of $5.7m, iron ore swap losses of $3.9m, and Murmansk Port disposal effect of $23m.
9
EuroChem Group Overview
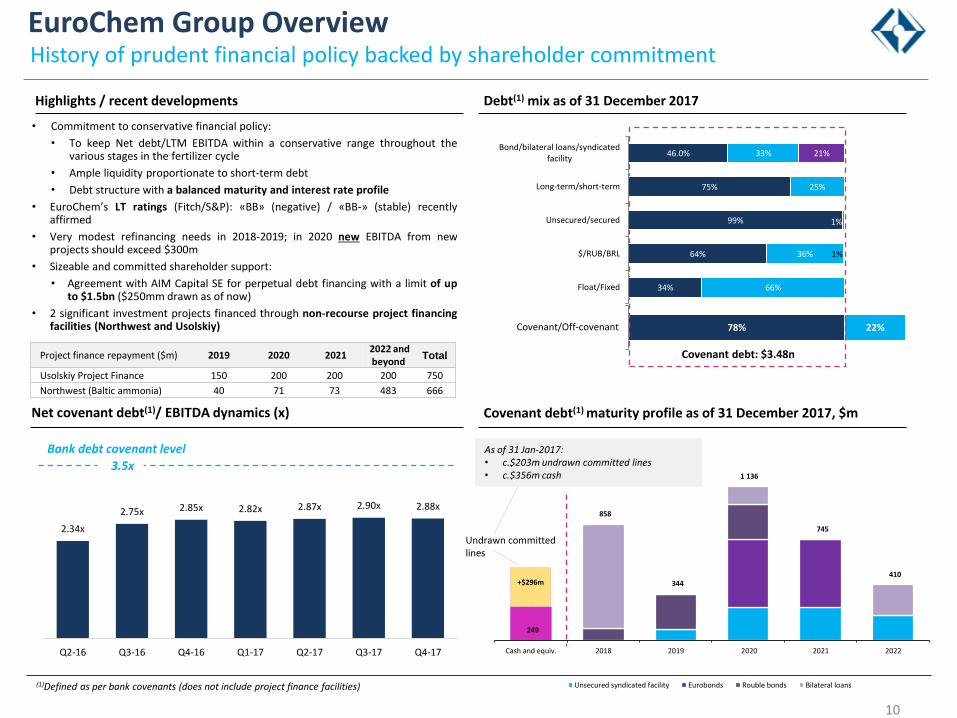
249
858
344
1 136
745
410
Cash and equiv. 2018 2019 2020 2021 2022
Unsecured syndicated facility Eurobonds Rouble bonds Bilateral loans
2.34x
2.75x 2.85x 2.82x 2.87x 2.90x 2.88x
Q2-16 Q3-16 Q4-16 Q1-17 Q2-17 Q3-17 Q4-17
Covenant debt(1) maturity profile as of 31 December 2017, $m
Debt(1) mix as of 31 December 2017
Net covenant debt(1)/ EBITDA dynamics (x)
(1)Defined as per bank covenants (does not include project finance facilities)
3.5x
Bank debt covenant level
Highlights / recent developments
$100m
• Commitment to conservative financial policy:
• To keep Net debt/LTM EBITDA within a conservative range throughout the various stages in the fertilizer cycle
• Ample liquidity proportionate to short-term debt
• Debt structure with a balanced maturity and interest rate profile
• EuroChem’s LT ratings (Fitch/S&P): «BB» (negative) / «BB-» (stable) recently affirmed
• Very modest refinancing needs in 2018-2019; in 2020 new EBITDA from new projects should exceed $300m
• Sizeable and committed shareholder support:
• Agreement with AIM Capital SE for perpetual debt financing with a limit of up to $1.5bn ($250mm drawn as of now)
• 2 significant investment projects financed through non-recourse project financing facilities (Northwest and Usolskiy)
Covenant debt: $3.48n
78% 22% Covenant/Off-covenant
Project finance repayment ($m) 2019 2020 2021 2022 and beyond
Total
Usolskiy Project Finance 150 200 200 200 750
Northwest (Baltic ammonia) 40 71 73 483 666
46.0%
75%
99%
64%
34%
33%
25%
1%
36%
66%
1%
21% Bond/bilateral loans/syndicated
facility
Long-term/short-term
Unsecured/secured
$/RUB/BRL
Float/Fixed
As of 31 Jan-2017: • c.$203m undrawn committed lines • c.$356m cash
Undrawn committed lines
+$296m
10
History of prudent financial policy backed by shareholder commitment

EuroChem Group Overview Strategic projects largely funded
Group CAPEX (US$m)
$286m
$270m
CAPEX spent todate
Remaining CAPEX Total estimatedCAPEX
$680m
c.$297m c.$977m
Amount of total investment funded to date c. 68%
$750m
CAPEX spent to date CAPEX outstanding2018 - 2026
Totalestimated CAPEX²
$1,809m
c. $3,000m
Amount of total investment funded to date: c. 60%
c. $1,191m
EuroChem-Northwest ammonia project
Usolskiy potash project
Project Finance (US$m)
Excluding temporarily unallocated CAPEX 2- including all development phases and all social infrastructure
PF Usolskiy
PF Northwest
74
110 156 186 216 211 208 194 182
355
610
312
160
257
91
177 185 140 102 100
211 221
519
378
224
341
395 380
274 326
443 458
1,323
1,496
Q1-16 Q2-16 Q3-16 Q4-16 Q1-17 Q2-17 Q3-17 Q4-17 2016 2017
Mining PF Usolskiy PF Northwest Fertilisers Oil&Gas Logistics Sales OtherP
roje
ct f
inan
ce
$4
17
m
• Despite large-scale projects the Group maintains the flexible CAPEX outlay
• 29% of 2017 CAPEX from non-recourse project financing
• $160m: EuroChem Usolskiy (potash) • €221m : EuroChem Northwest (ammonia)
• Annual Group sustaining CAPEX requirements: c.$150m
11

EuroChem Group Overview
$378
$0
$100
$200
$300
$400
$500
Jan
-16
Feb
-16
Mar
-16
Ap
r-16
May
-16
Jun
-16
Jul-
16
Au
g-16
Sep
-16
Oct
-16
No
v-16
Dec
-16
Jan
-17
Feb
-17
Mar
-17
Ap
r-17
May
-17
Jun
-17
Jul-
17
Au
g-17
Sep
-17
Oct
-17
No
v-17
Dec
-17
PhosRock Apatite AmmoniaSulphur Sulphuric acid Conversion cost
Lifosa DAP costs (FOB Baltic), US$/tonne, with iron ore credit
Assets benefiting from advantageous location and upstream integration
• From Q3-18, self sufficiency in ammonia following launch of Northwest project
• Internal phosphate rock production covers c.75% of annual consumption
• By-products (iron ore, baddeleyite ) further improve cost competitiveness of the business
Additional cost efficiency through vertical integration in logistics and distribution
• Own port facilities with annual capacity of 8.8MMT (Russia) and 3.5MMT (EU)
• Fleet of 6,400 railcars and 43 locomotives
• Distribution network covering CIS, US, Latin America, Europe and Asia
Nevinnomysskiy urea cost (FOB Black Sea), US$/tonne
Low-cost nitrogen and phosphate operations on DDP basis
Phosphate rock Ammonia Sulphur Conversion
Transport to port
DAP cost based on mix phosrock price
Freight Import duties
100Rmb export duty
DAP global cost curve in 2017 Urea global cost curve in 2016
$217
$0
$50
$100
$150
$200
$250
$300
Jan
-16
Feb
-16
Mar
-16
Ap
r-1
6
May
-16
Jun
-16
Jul-
16
Au
g-1
6
Sep
-16
Oct
-16
No
v-1
6
Dec
-16
Jan
-17
Feb
-17
Mar
-17
Ap
r-1
7
May
-17
Jun
-17
Jul-
17
Au
g-1
7
Sep
-17
Oct
-17
No
v-1
7
Dec
-17
Gas price Conversion cost Transportation FCA-FOB FOB Price BS
0
50
100
150
200
250
300
350
4 8
13 17 21 26 30 34 38 43 47
Ure
a co
st o
n D
DP
bas
is, $
/t
MMT
Gas/Coal Conversion costTransportation FCA-FOB FreightImport duty
NAK Azot
NEV Azot
Urea global cost curve in 2017
0
100
200
300
400
500
600
2 3 5 6 8 9
11
12
14
15
DA
P c
ost
on
DD
P/F
CA
bas
is, $
/to
nn
e
MMT
Fe
Lifosa
12
Competitive advantages rooted in low-cost raw materials

Potash projects
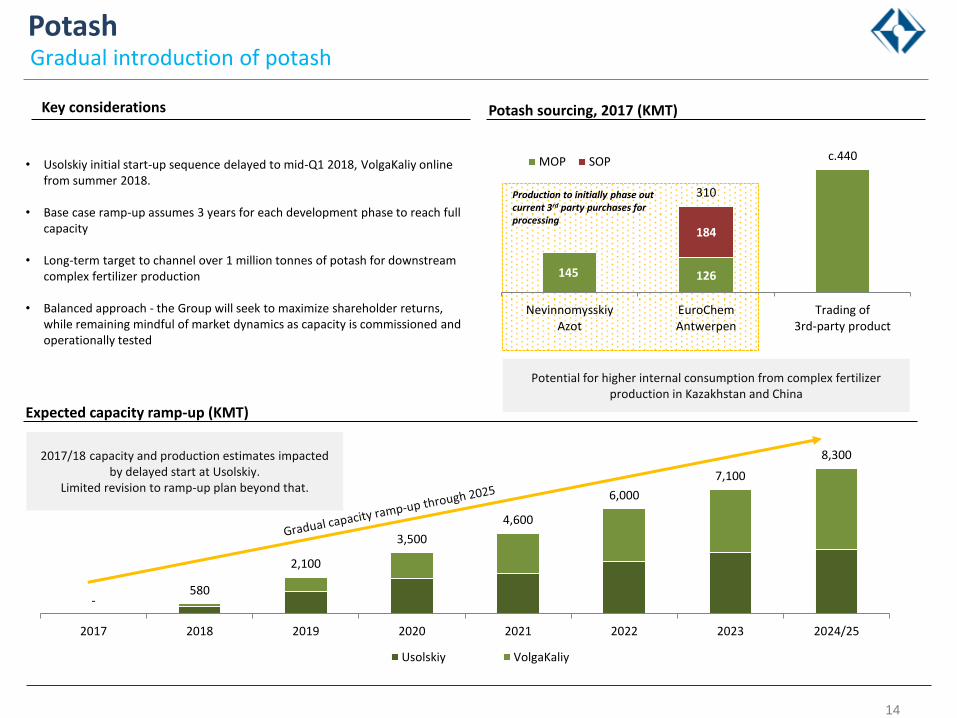
Potash
14
126
184
145
310
c.440
NevinnomysskiyAzot
EuroChemAntwerpen
Trading of3rd-party product
MOP SOP
Production to initially phase out current 3rd party purchases for processing
- 580
2,100
3,500
4,600
6,000
7,100
8,300
2017 2018 2019 2020 2021 2022 2023 2024/25
Usolskiy VolgaKaliy
Potash sourcing, 2017 (KMT)
Expected capacity ramp-up (KMT)
• Usolskiy initial start-up sequence delayed to mid-Q1 2018, VolgaKaliy online from summer 2018.
• Base case ramp-up assumes 3 years for each development phase to reach full capacity
• Long-term target to channel over 1 million tonnes of potash for downstream complex fertilizer production
• Balanced approach - the Group will seek to maximize shareholder returns, while remaining mindful of market dynamics as capacity is commissioned and operationally tested
Potential for higher internal consumption from complex fertilizer production in Kazakhstan and China
Gradual introduction of potash
Key considerations
2017/18 capacity and production estimates impacted by delayed start at Usolskiy.
Limited revision to ramp-up plan beyond that.
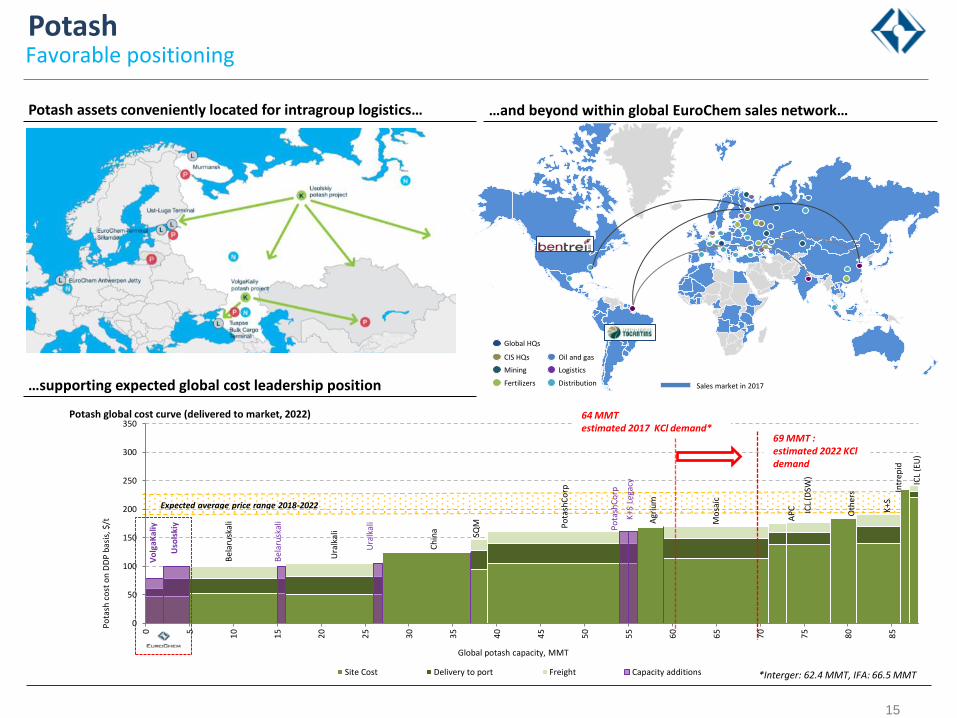
Potash
15
Expected average price range 2018-2022
Ch
ina
AP
C
ICL
(EU
)
Ura
lkal
i
Bel
aru
skal
i Pota
shC
orp
Agr
ium
ICL
(DSW
)
0
50
100
150
200
250
300
350
0 5
10
15
20
25
30
35
40
45
50
55
60
65
70
75
80
85
Po
tash
co
st o
n D
DP
bas
is, $
/t
Global potash capacity, MMT
Potash global cost curve (delivered to market, 2022)
Site Cost Delivery to port Freight Capacity additions
Mo
saic
K+S
Oth
ers
Po
tash
Co
rp
Vo
lgaK
aliy
Uso
lski
y
SQM
Intr
epid
K+S
Leg
acy
Ura
lkal
i
Bel
aru
skal
i
64 MMT estimated 2017 KCl demand*
69 MMT : estimated 2022 KCl demand
Favorable positioning
Oil and gas
Mining
Fertilizers
Logistics
Distribution
Global HQs
CIS HQs
Sales market in 2017
Potash assets conveniently located for intragroup logistics… …and beyond within global EuroChem sales network…
…supporting expected global cost leadership position
*Interger: 62.4 MMT, IFA: 66.5 MMT

VolgaKaliy Update
2.3 2.3
2.3 2.3
4.6
Phase 1 Phase 2
Capacity (KCL, MMT)
• Average KCl content of 39.5% and modern mining operations • Approximately 500km to EuroChem’s Tuapse port facilities
16

Usolskiy Update
Eight continuous mining machines operating underground
2.3 2.3
1.4 2.3
3.7
Phase 1 Phase 2
Capacity (KCL, MMT)
17

Usolskiy Update
Ore in storage prior to beneficiation
18

Thank you – and now time for our Q&A session….
Please visit www.eurochemgroup.com for further details or contact our Investor Relations. [email protected]


![The Zeta Call February 2014[1]](https://img.dokumen.tips/doc/110x75/577cd1ce1a28ab9e789503bd/the-zeta-call-february-20141.jpg)


