Embed Size (px)
Citation preview

IET RADAR, SONAR AND NAVIGATION 1
Multi-Window Time-Frequency Signature
Reconstruction from Undersampled Continuous
Wave Radar Measurements for Fall Detection
Branka Jokanovic, Moeness G. Amin, Yimin D. Zhang, and Fauzia Ahmad
Abstract
Fall detection is an area of increasing interest in independence-assisting remote monitoring tech-
nologies for the elderly population. Immediate assistance following a fall can lower the risk of medical
complications, thus saving lives and reducing the associated health care costs. Therefore, it is important
to detect a fall as it happens and promptly mobilize first responders for proper care and attendance to
possible injury. Radar offers privacy and non-intrusive monitoring capabilities. Micro-Doppler signatures
are typically employed for radar based human motion detections and classifications. Proper time-
frequency signal representation is, therefore, required from which important features can be extracted.
Missing or noise/interference corrupted data can compromise the integrity of micro-Doppler signatures
and subsequently confuse the classifier. In this paper, we restore the time-frequency signatures associated
with human motor activities, such as falling, bending over, sitting, and standing, by using a hybrid
approach of compressive sensing and multi-window analysis based on Slepian or Hermite functions.
Because time-frequency representations of many human gross-motor activities are sparse and share
common support in joint-variable domains, the multiple measurement vector approach can be effectively
applied for fall classification in both cases of full data or compressed observations.
Index Terms
Hermite functions, missing samples, multi-window time-frequency representation, multiple measurement
vector, Slepian sequences, fall detection.
This paper is made possible by NPRP Grant # NPRP 6-680-2-282 from the Qatar National Research Fund (a member of
Qatar Foundation). The statements made herein are solely the responsibility of the authors.
The authors are with the Center for Advanced Communications, Villanova University, Villanova, PA 19085, USA. E-mails:
branka.jokanovic, moeness.amin, yimin.zhang, [email protected].
IET RADAR, SONAR AND NAVIGATION 2
I. INTRODUCTION
Falls are one of the widely recognised risks encountered by the elderly in everyday life, be it
in retirement homes or private residences. Various studies have shown that falling is the leading
cause of fatal and nonfatal injuries among older adults, and the associated treatments result in
high costs to the health care system [1], [2]. Thus, it is important to provide reliable and timely
detection and classification of a fall when it occurs. Prompt assistance after a fall can reduce
complications and save lives.
Radar is an effective noninvasive technology for providing self-dependent living to the elderly
[3], [4]. This sensing modality has the capability to remotely detect various types of motions
of animate and inanimate objects, such as humans and fans, in cluttered environments. Animate
objects typically undergo translation in one, two, or three dimensions, whereas inanimate objects
may assume rotational, vibrational, or oscillatory motions [5], [6]. Radar systems can be used as
an effective sensing modality in both indoor and outdoor environments since they are insensitive
to lighting conditions, can penetrate walls and fabrics, and operate in all types of weather
conditions. However, analysis of the radar returns associated with animate and inanimate motions
can be a demanding task, given their complex nature that stems from the presence of multiple
signal components which correspond to various parts or limbs of the moving object [7], [8].
When dealing with radar measurements of human motions, two important spectral features can
be observed. The first one is the Doppler effect, which is the frequency shift of the transmitted
wave caused by the bulk target motion and it contains information about the target nominal
velocity. The second feature is caused by the movement of various components of the body,
including arms and legs. These motions generate sidebands about the Doppler frequency, referred
to as micro-Doppler signatures. Since human motions inevitably change in time, a method for
depicting the time-varying behavior of human motion is required.
Time-frequency representations (TFRs) are a powerful tool for the analysis of signals with
time-varying spectra, including signals characterizing human motion. The simplest TFR is the
short-time Fourier transform (STFT), which is obtained by applying a Fourier transform (FT)
over a windowed signal. The square modulus of the STFT is the spectrogram. However, the
resolution of spectrogram depends on the employed window size and shape, which limits its
use. In order to overcome the drawback of a single-window spectrogram, different approaches

IET RADAR, SONAR AND NAVIGATION 3
employing a set of windows have been introduced [9]-[16].
The set of optimal windows which provides maximum spectral concentration comprises the
discrete prolate spheroidal sequences (DPSS) or Slepian sequences. DPSS can be defined as
the eigenfunctions of a sinc kernel. As an alternative, Hermite functions, which are defined
as eigenfunctions of the Fourier transform, can also be used. Hermite functions have several
desirable properties, such as simplicity, recursion, and performance comparable to DPSS [17],
[18]. These properties make them attractive for practical applications. Another set of windows
is computed as eigenfunctions of a desirable time-frequency reduced interference kernel [14].
Irrespective of the number and types of windows, traditional time-frequency analysis fail to
perform well when dealing with incomplete data. Recently, compressive sensing (CS), an ap-
proach that addresses the issue of missing samples, has become an area of growing interest [19]-
[21]. Even though CS has been extensively examined in many areas, only a few researchers have
addressed the sparsity in the time-frequency domain and the applications of sparse reconstruction
techniques for accurate joint-variable representations of nonstationary signals [22]-[27].
In this paper, we consider the TFRs of specific human motions, namely, falling, bending
over, sitting, and standing. We consider continuous-wave (CW) radar operation and assume the
case when the measured radar signal has missing samples. This can be due to data multiplexing,
hardware simplicity, or discarding of noise corrupted samples. In order to obtain a good estimate
of the TFR, we use multiple windows while performing sparse reconstruction. The goal is to
offer high energy signal concentration in the time-frequency plane. Additionally, we observe
that the spectrograms corresponding to a set of windows, such as Slepian or Hermite functions,
share similar support in the time-frequency domain. This property motivates the application of
multiple measurement vector (MMV) model [28] for reconstruction of the corresponding multi-
window TFR. The multi-window approach has recently provided effective TFRs with compressed
observations [29], [30].
The remainder of the paper is organized as follows. In Section II, we present the CW radar
signal model. We review the multi-window spectrogram and the definitions of various window
functions in Section III, and discuss their advantages and shortcomings. The MMV approach
for recovery of multi-window TFR is presented in Section IV. Section V analyzes experimental
data corresponding to falling, bending over, sitting, and standing motions, collected with a CW
radar in the Radar Imaging Lab at Villanova University. Conclusion is provided in Section VI.

IET RADAR, SONAR AND NAVIGATION 4
II. CW RADAR SIGNAL MODEL
Consider a CW radar operating at frequency f0. The baseband radar return from a point target
can be expressed as,
s(t) = ρ(t) exp(−jφ(t)), (1)
where ρ(t) and φ(t) are, respectively, the range-dependent amplitude and the phase of the return.
If R(t) is the law of motion of the target, then the phase is expressed as
φ(t) =4πf0R(t)
c(2)
where c is the speed of wave propagation in free-space. The associated Doppler frequency, fd(t),
is determined by the derivative of the phase, φ(t), with respect to time, i.e.,
fd(t) = − 1
2π
dφ(t)
dt= −2f0
c
dφ(t)
dt. (3)
In contrast to the point target model in (1), the baseband return from an extended target, such
as a human, can be considered as a sum of returns from a multiplicity of point scatterers
comprising the target extent. As such, the corresponding Doppler signature is the superposition
of the various component Doppler frequencies. Human motions typically produce time-varying
Doppler frequencies, and the nature of the corresponding time-frequency signature is tied to the
specific motion and shape of the target.
In this paper, we work with the discrete version of the baseband radar return in (1), given by
s(n) = s(t)|t=nTs , n = 0, 1, . . . , N − 1. (4)
where Ts is the sampling period.
III. MULTI-WINDOW TIME-FREQUENCY REPRESENTATION
A multi-window spectrogram is defined as the weighted sum of L spectrograms corresponding
to L different window functions [9]-[16]. In a discrete form, it can be expressed as,
PMW (n, k) =L−1∑l=0
cl(n)Pl(n, k), (5)
where cl(n) is the weighting coefficient of the lth window function, whereas the lth spectrogram,
Pl(n, k), is obtained by applying the corresponding window function ψl(n) to the discrete-time

IET RADAR, SONAR AND NAVIGATION 5
signal s(n) of length N and computing the FT of the windowed signal, followed by a magnitude
squared operation, i.e.,
Pl(n, k) =
∣∣∣∣∣∑m
s(n+m)ψl(m)e−2πmk/N
∣∣∣∣∣2
. (6)
Different types of window functions can be employed for computing the multi-window spec-
trogram. We consider three sets of window functions described below, which can be used to
enhance the time-frequency signal representation.
A. Slepian Sequences
Slepian sequences or DPSS are the optimal window functions that provide maximum spectral
concentration for a given bandwidth B and time interval of length M . They are obtained by
solving the problem of maximizing the energy concentration ν, which is defined as,
ν =
M−1∑m=0
|ψ2(m)|∞∑
m=−∞|ψ2(m)|
, (7)
where ψ(m) are the desired window functions. Slepian sequences can be computed as solutions
of
Cψl = νlψl, (8)
where ψl = [ψl(0), ..., ψl(M − 1)]T is the M -length eigenvector with (·)T denoting transpose,
and νl is the eigenvalue of matrix C, whose (l,m)th element is given by
[C]l,m =sin(2πB(l −m))
π(l −m), l,m ∈ 0, 1, . . . ,M − 1. (9)
B. Hermite Functions
Another set of window functions which can be used in multi-window time-frequency analysis is
the set of Hermite functions. The Hermite functions of the zeroth and first orders are, respectively,
defined as,
ψ0(n) =14√πe−n
2/2, (10)
ψ1(n) =
√2n
4√πe−n
2/2. (11)

IET RADAR, SONAR AND NAVIGATION 6
Higher order Hermite functions can be computed using recursion as
ψl(n) = n
√2
lψl−1(n)−
√l − 1
lψl−2(n), ∀l ≥ 2. (12)
A higher number of Hermite functions will provide better concentration in the time-frequency
domain. For a signal a(n)ejθ(n), the optimal value of L will depend on the order of signal phase
laws. Additionally, if the magnitude a(n) is constant over a window, i.e., a(n) = a(n+m) for
all m, then the weighting coefficients cl(n) can be considered constant [16]. In this paper, we
assume constant values of the weighting coefficients.
C. Eigenvectors of a Time-Frequency Kernel
As another option, windows computed from a time-frequency kernel can be used. The premise
of this method lies in the fact that most reduced interference distribution kernels, upon eigen-
decomposition, are captured in the first few terms corresponding to the dominant eigenvalues.
Each eigenterm forms a spectrogram with a window equal to the eigenvector. That is, in order
to obtain the window functions, we compute the autocorrelation domain kernel, Υ(n,m), which
is the FT of the ambiguity domain kernel, Ω(p,m), with respect to p, i.e.,
Υ(n,m) =∑p
Ω(p,m)e−2πpn/N . (13)
The windows are obtained as the eigenvectors of the rotated autocorrelation domain kernel. The
rotated kernel can be defined using the unit-Jacobian linear transformation of variables, n1
n2
=
1 12
1 −12
n
m
(14)
i.e., we can represent the rotated kernel as,
Υ(n1, n2) = Υ
(n1 + n2
2, n1 − n2
). (15)
The eigenvectors of this kernel yield window functions ψl for time-frequency representation,
Υ =L∑l=1
βlψlψHl , (16)
where (·)H denotes conjugate transpose.
For comparison, Fig. 1 demonstrates the first six window functions corresponding to DPSS,
Hermite functions and eigenvectors of the time-frequency Choi-Williams kernel, respectively.

IET RADAR, SONAR AND NAVIGATION 7
We observe that there is a resemblance between the three sets of window functions. The Slepian
sequence is the optimal set when we know the signal bandwidth, whereas the Hermite functions
can be used when there is no precise information available about the signal bandwidth, but
the signal amplitude can be assumed constant within a window. The third type of windows is
based on specific kernels, which are designed to remove cross-terms arising from multiple signal
components. Thus, the resulting window sets for different kernel designs conform to different
signal properties. In order to obtain a proper time-frequency signature, any prior information
should be utilized when choosing the appropriate set of window functions.
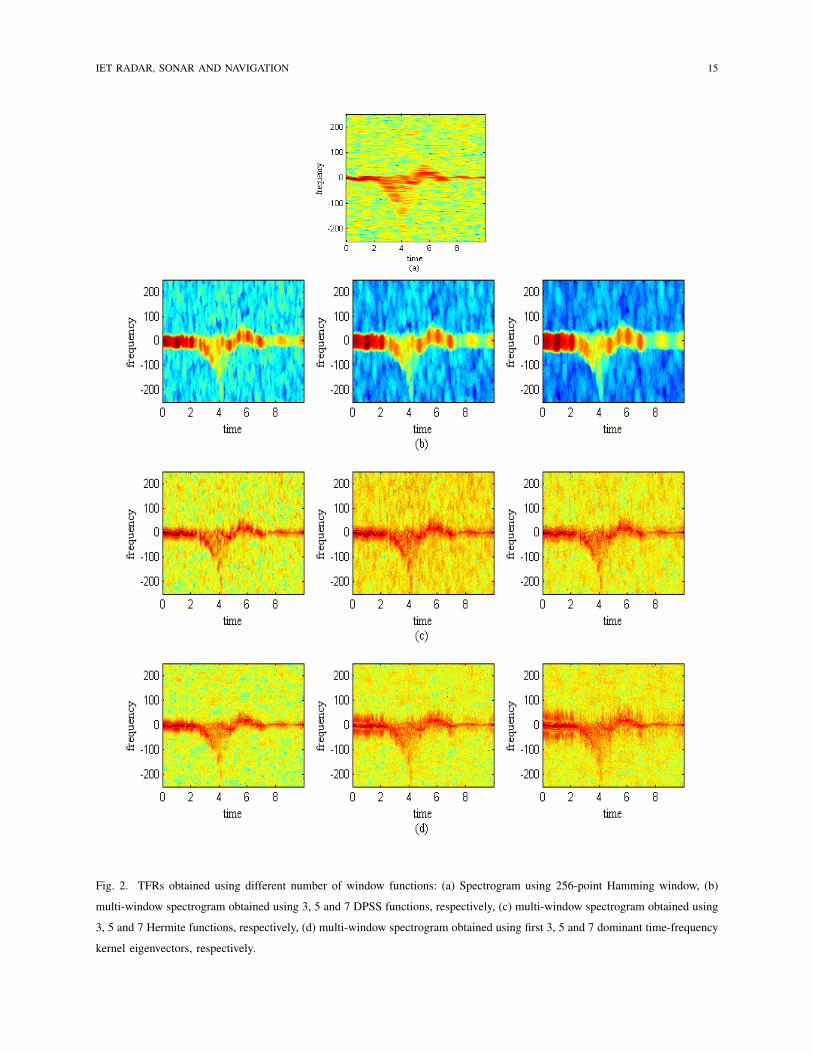
By employing different windows and forming a multi-window spectrogram, we can signifi-
cantly improve the signal energy concentration in the time-frequency domain. This is depicted
in Fig. 2 for a signal representing a backward falling motion at an angle of 45 degrees relative to
the radar. The signal is sampled at the Nyquist rate. Increasing the number of employed windows
improves concentration. However, in most cases, a few dominant windows are sufficient for TFR
estimation. This is evident from Fig. 2 where there is a negligible difference between the TFRs
based on 5 and 7 windows. Thus, in the remainder of the paper, we will use 5 dominant window
functions. In addition, since the Hermite functions and the windows computed from the time-
frequency Choi-Williams kernel provide similar time-frequency signatures, we will focus on the
Slepian and Hermite functions in the reconstruction of time-frequency signal representation and
compare their performance in the sequel.
IV. MULTI-WINDOW TIME-FREQUENCY REPRESENTATION OF RANDOMLY
UNDERSAMPLED MEASUREMENTS
In this section, we assume that a certain percentage of the N time samples of the baseband
radar return s(n) are missing. The randomly undersampled measurements can be represented as
x(n) = s(n)− v(n), v(n) =∑ni
δ(n− ni)s(n), (17)
where δ(·) is the unit impulse, and ni are the indices of the missing samples. The multi-window
spectrogram of the undersampled signal vector x = [x(1), ..., x(N)]T using L window functions
is given by,
PMW (n, k) =L−1∑l=0
cl
∣∣∣∣∣∑m
(s(n+m)− v(n+m))ψl(m)e−2πkm/N
∣∣∣∣∣2
. (18)

IET RADAR, SONAR AND NAVIGATION 8
Fig. 1. DPSS, Hermite functions and windows obtained from time-frequency kernel. First six window functions are shown, i.e.,
from 0th to 5th order. (a) 0th order, (b) 1st order, (c) 2nd order, (d) 3rd order, (e) 4th order, (f) 5th order.
The missing samples in the time domain cause noise-like artifacts in the time-frequency domain,
which clutter the resulting TFR [26]. Figs. 3, 4, 5 and 6 show the TFRs corresponding to
different human motions, namely, fall backward, fall forward, sit/stand and bending over motions,
respectively, when 50% of the samples are randomly missing. For comparison, the full data
counterparts for the fall forward, sit/stands and bending over motion are also provided in Figs.
4, 5 and 6, whereas those for the fall backward case were provided in Fig. 2. We observe that
the time-frequency signatures of human motions are significantly distorted due to the adverse
effects of the missing samples and, therefore, cannot be employed for the recognition of human
motor activities.
In order to reduce the artifacts and obtain a good estimate of the TFR, we utilize the sparse
recovery approach. For the majority of nonstationary signals, their TFRs can be considered
sparse since the energy is localized over a small bandwidth for a time slice. This property
invites the application of sparse recovery methods for TFR estimation. More specifically, in case

IET RADAR, SONAR AND NAVIGATION 9
of the multi-window spectrogram, we can observe that all spectrograms share similar support
[29],[30]. The common support property can be incorporated in the problem at hand using
the MMV model. More specifically, in solving L underdetermined systems of equations for L
employed window functions, we incorporate the assumption of similar sparsity support. The
MMV problem can be formulated as,
Yn = WnFn, (19)
where Yn = [y0n, ...,y
L−1n ] and Fn = [f0n, ..., f
L−1n ]. Each column of Y corresponds to the
measurement vector obtained in the process of applying Hermite or Slepian function of the
lth order. Namely, yln contains non-zero samples of windowed signal x(n+m)ψl(m), whereas
columns of Fn are sparse vectors with a common sparse support. Using cl, l = 0, ..., L− 1, as
weighting coefficients, the weighted sum of these columns yields a multi-window TFR for time
n. Wn is a partial Fourier matrix and is the same for all l = 0, ..., L − 1, given time n. After
obtaining f ln, ∀l, we can estimate the multi-window TFR for each n, i.e., dn, as
dn =L−1∑l=0
cl|f ln|2. (20)
It is noted that the use of the multi-window approach in TFR provides two advantages over
the single-window approach. First, the multi-window approach overcomes the poor resolution
property of the single-window spectrogram. Second, multiple windows produce multiple mea-
surement sets which improve the sparse vector estimation.
V. EXPERIMENTAL SETUP AND RESULTS
In this section, we evaluate the multi-window approach for sparse recovery of time-frequency
signatures using real radar measurements of falling, bending over, sitting, and standing human
motions. We compare the performance of sets of windows based on Slepian and Hermite
functions.
A CW radar was set up in the Radar Imaging Lab at Villanova University. A vertically
polarized horn antenna (BAE Systems, Model H-1479) with an operational frequency range of
1–12.4 GHz and 3-dB beamwidth of 45 degrees is used as a transceiver for the CW monostatic
radar. The feed point of the antenna is positioned 1 m above the floor. Agilent’s E5071B RF
network analyzer is used for signal generation and measurement of radar returns. A carrier
IET RADAR, SONAR AND NAVIGATION 10
frequency of 8 GHz is employed and the network analyzer is externally triggered at a 1 kHz
sampling rate. The record time of each experiment is 10 seconds, resulting in a total of 10,000
data samples. The following five types of human motions are performed by two subjects at a
distance of 3 m from the antenna feed point: 1) repeated sitting and standing, 2) bending over,
3) falling backward to the floor along the radar radiation direction, 4) falling forward to the floor
along the radar radiation direction, and 5) falling backward to the floor at a 45o angle relative
to the radar radiation direction.
We first downsample the data to the Nyquist sampling rate of 500 Hz, and the resulting signals
are then randomly undersampled to create the incomplete data for processing. For classification
purposes, the bending over and sit/stand motions are considered as the non-fall class, whereas
the three types of falls are collectively considered as the fall class.
We compare and contrast the following sparsity based approaches for reconstruction of the
TFR from incomplete data observations:
1) Single measurement vector (SMV) approach – This approach reconstructs the TFR by
using a single Hamming window for each time n. Orthogonal matching pursuit (OMP)
[21] is used as the reconstruction technique.
2) Separate reconstruction using multiple windows – This approach uses multiple windows,
but does not impose similar sparsity support, i.e., each sparse vector is reconstructed
independently by using OMP. We perform the reconstructions applying both Slepian and
Hermite functions.
3) MMV approach – This is the approach described in Section IV where similar sparsity
support is imposed in the reconstruction process. As in the previous case, we compute the
TFRs using both Slepian and Hermite functions. The reconstruction is performed using
the M-FOCUSS algorithm [28].
Figs. 7, 8 and 9 depict the TFR reconstruction results for fall, sit-and-stand and bending over
motions, respectively, using the aforementioned methods when 50% of the samples are randomly
missing. In the case of fall motion (Fig.7), we note that amongst all methods, the MMV approach
(Figs. 7(d) and 7(e)) provides the least cluttered solutions. This is expected due to the imposed
similar sparsity property. Also, both Slepian and Hermite functions exhibit similar performance
in obtaining proper time-frequency representation. With regards to the reconstruction results for
the sit/stand and bending over motions shown in Fig. 8 and Fig. 9, the difference between the
IET RADAR, SONAR AND NAVIGATION 11
various methods is not significant due to the relatively simple structure of sitting, standing and
bending over motions. However, the benefits of using the MMV approach are still noticeable
when compared to the SMV and separate reconstruction approaches.
Next, we extract features from the TFRs reconstructed with the various methods and use a
support vector machine (SVM) based classifier to discriminate between the fall and non-fall
motions. SVM is a powerful tool for finding a hyperplane that separates the data classes and
has been successfully used to differentiate various human gaits [31].
As can be seen from Figs. 7, 8 and 9, fall and non-fall motions have different time-frequency
signatures. These differences can be used in determining prominent features which can distinguish
fall from the non-fall motions. One feature which can be used for fall detection is the peak
frequency [4]. The peak frequency distinguishes the fall from the sit/stand and bending over
motions in the sense that falling generally assumes a higher absolute value as compared to the
sit, stand and bending over. The peak frequency is defined as,
fpeak = max[fmax,−fmin]. (21)
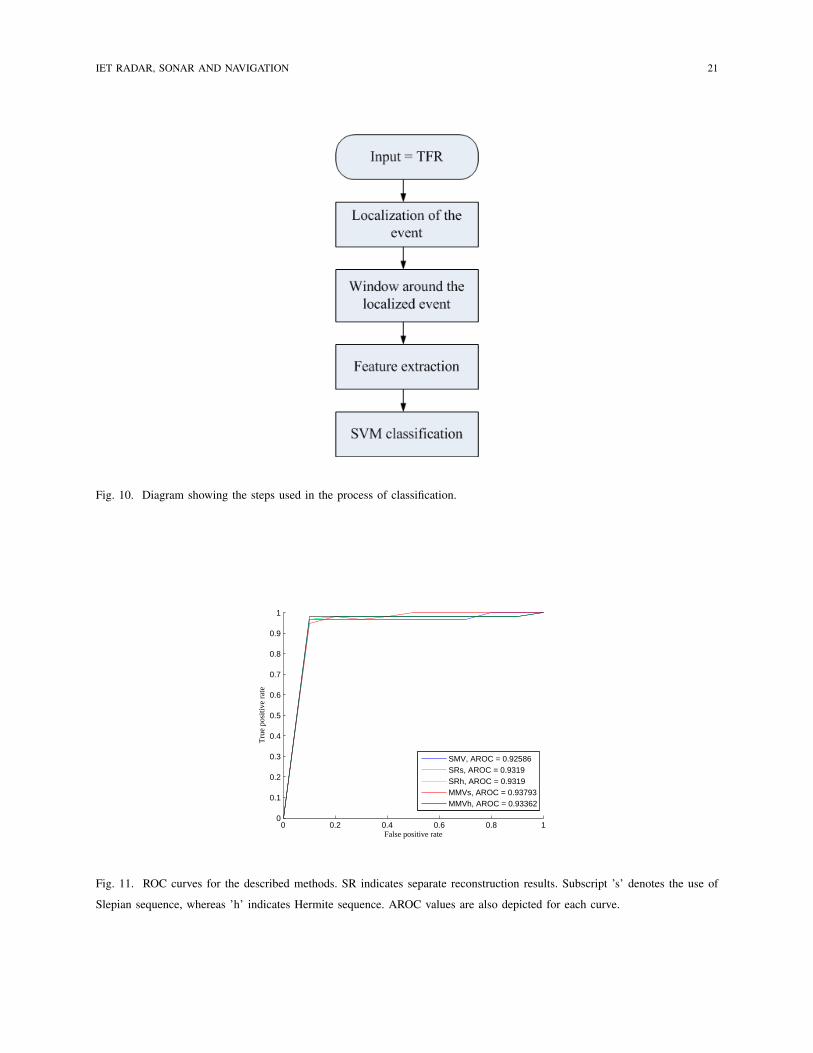
In order to compare SMV, separate reconstruction, and MMV approaches, we follow the steps
listed in Fig. 10. Similar framework was used in [3], [4]. After obtaining the TFR, denoted by
matrix R, we first localize the event. One way to this is by using the power burst curve (PBC)
which is defined for each time slice as,
PBC(n) =
f2∑f1
|R(n, k)|2 +
−f1∑−f2
|R(n, k)|2. (22)
where f1 and f2 denote the observed frequency range (f2 > f1). The following values can be
used for the observed range, f1 = 30 Hz and f2 = 180 Hz. Usually, falls assume a high power
content within a certain frequency range. An alternate metric for localizing an event is the center
of gravity for each time slice as,
CoG(n) =
∑k
k|R(n, k)|∑k
|R(n, k)|. (23)
The PBC measures the power within a certain frequency range, whereas the center of gravity
is a weighted sum of the TFR values with the frequencies themselves being the weights. The
center of gravity is a better measure of power spread since it favors higher frequency values and
does not require a priori knowledge about the range of [f1, f2].
IET RADAR, SONAR AND NAVIGATION 12
After localizing an event, a 4-second window is formed around the event timing, within which
the peak frequency is determined. A thresholding operation is used to remove clutter in the TFR
which can cause false alarms. A set of ten thresholds is used to examine the changes in the
detected peak frequency value and the resulting impact on the classification performance. The
chosen threshold values range from 1% to 10% of the TFR maximum value. All the TFRs in
Figs. 7, 8 and 9, which are obtained using the SMV and separate as well as MMV reconstruction
approaches, contain clutter, whose effect is more evident for the SMV and separate reconstruction
approaches. The clutter resembles salt-and-pepper noise and, thus, complicates the extraction of
the peak frequency feature. Image processing techniques, such as median filtering [32], can be
used for clutter reduction before applying the thresholding, feature extraction, and classification
procedures. A 7× 7 median filter is applied to the TFRs obtained using the SMV and separate
reconstruction methods before the features are extracted.
We have 32 data sets for the fall events and 32 data sets for the non-fall events. In the
training process, 6 fall signals are used as fall events whereas 3 sit-and-stand and 3 bending-
over signals are used as non-fall events. The remaining 26 fall and 26 non-fall signals are used
for the testing process. For each method, by changing the threshold value, true positive and false
positive rates are evaluated. The resulting classification performance in terms of the receiver
operating characteristics (ROC) curves [33] is depicted in Fig. 11. Each ROC curve corresponds
to one considered approach and it shows the true positive rate versus the false alarm rate. The
performance of a specific method can be measured by computing the area under the ROC curve
(AROC), which is also specified for each approach in Fig. 11. It is evident that the MMV
approach using the Slepian sequence provides the highest AROC value, thus demonstrating its
superiority for fall detection over other methods in the case of missing samples.
VI. CONCLUSION
In this paper, the time-frequency signal representation of human motions was estimated from
observed data with missing samples for the purpose of elderly fall detection. We used multi-
window spectrogram approach based on Slepian and Hermite functions in conjunction with sparse
signal recovery techniques that exploit the multiple measurement vector model to achieve high
energy localization and enhanced sparsity in the time-frequency domain. In order to validate
the proposed approach, we reconstructed time-frequency representations with real data under

IET RADAR, SONAR AND NAVIGATION 13
missing samples and performed classification of the resulting radar signatures corresponding to
fall, sit/stand, and bending-over motions. It was shown that the proposed technique achieves a
high classification accuracy, with the discrete prolate spheroidal sequences slightly outperforming
the Hermite functions.
REFERENCES
[1] X. Yu, “Approaches and principles of fall detection for elderly and patient,” in IEEE Int. Conf. HealthCom, Singapore,
July 2008, pp. 42–47.
[2] I. Immoreev and T.-H. Tao, “UWB radar for patient monitoring,” IEEE Aerospace and Electronic Systems Magazine,
vol. 23, no. 11, pp. 11–18, 2008.
[3] L. Liu, M. Popescu, M. Skubic, M. Rantz, T. Yardibi, and P. Cuddihy, “Automatic fall detection based on Doppler radar
motion signature,” in PervasiveHealth 2011, pp. 222–225.
[4] L. Ramirez Rivera, E. Ulmer, Y. D. Zhang, W. Tao, and M. G. Amin, “Radar-based fall detection exploiting time-frequency
features,” in Proc. IEEE China Summit and Int. Conf. Signal and Inf. Process., Xi’an, China, July 2014.
[5] M. I. Skolnik, Radar Systems. McGraw Hill, 2001.
[6] P. Setlur, M. Amin, and F. Ahmad, “Analysis of micro-doppler signals using linear fm basis decomposition,” in Proc.
SPIE, vol. 6210, Orlando, FL, April 2006.
[7] C. Clemente, A. Balleri, K. Woodbridge, and J. J. Soraghan, “Developments in target micro-doppler signatures analysis:
radar imaging, ultrasound and through-the-wall radar,” EURASIP Journal on Advances in Signal Processing, vol. 2013,
no. 1, pp. 1–18.
[8] V. C. Chen, “Analysis of radar micro-doppler with time-frequency transform,” in Proc. IEEE Workshop on Stat. Signal
and Array Process., Pocono Manor, PA, Aug. 2000, pp. 463–466.
[9] M. Bayram and R. G. Baraniuk, “Multiple window time-frequency and time-scale analysis,” in Proc. SPIE, 1996, pp.
174–185.
[10] F. Cakrak and P. J. Loughlin, “Multiple window non-linear time-varying spectral analysis,” in Proc. IEEE ICASSP, vol. 4,
1998, pp. 2409–2412.
[11] G. Fraser and B. Boashash, “Multiple window spectrogram and time-frequency distributions,” in Proc. IEEE ICASSP,
vol. 4, 1994, pp. IV–293.
[12] M. Hansson, “Multiple window decomposition of time-frequency kernels using a penalty function for suppressed sidelobes,”
in Proc. IEEE ICASSP, Toulouse, France, May 2006, pp. 2883–2886.
[13] W. J. Williams and S. Aviyente, “Optimum window time-frequency distribution decompositions,” in Proc. Asilomar Conf.,
vol. 1, Pacific Grove, CA, Nov. 1998, pp. 817–821.
[14] M. G. Amin, “Spectral decomposition of time-frequency distribution kernels,” IEEE Trans. Signal Process., vol. 42, no. 5,
pp. 1156–1165, 1994.
[15] J. W. Pitton, “Time-frequency spectrum estimation: An adaptive multitaper method,” in Proc. IEEE-SP Int. Symp. Time-
Frequency and Time-Scale Analysis, Pittsburgh, PA, Oct. 1998, pp. 665–668.
[16] F. Cakrak and P. J. Loughlin, “Multiwindow time-varying spectrum with instantaneous bandwidth and frequency
constraints,” IEEE Trans. Signal Process., vol. 49, no. 8, pp. 1656–1666, 2001.

IET RADAR, SONAR AND NAVIGATION 14
[17] Y. Xu, S. Haykin, and R. J. Racine, “Multiple window time-frequency distribution and coherence of EEG using Slepian
sequences and Hermite functions,” IEEE Trans. Bio. Engin., vol. 46, no. 7, pp. 861–866, 1999.
[18] I. Orovic, N. Zaric, S. Stankovic, and M. Amin, “A multiwindow time-frequency approach based on the concepts of robust
estimate theory,” in Proc. IEEE ICASSP, Prague, Czech Republic, May 2011, pp. 3584–3587.
[19] E. J. Candes and M. B. Wakin, “An introduction to compressive sampling,” IEEE Signal Process. Magazine, vol. 25, no. 2,
pp. 21–30, 2008.
[20] D. L. Donoho, “Compressed sensing,” IEEE Trans. Inf. Theory., vol. 52, no. 4, pp. 1289–1306, 2006.
[21] J. A. Tropp and A. C. Gilbert, “Signal recovery from random measurements via orthogonal matching pursuit,” IEEE Trans.
Inf. Theory, vol. 53, no. 12, pp. 4655–4666, 2007.
[22] P. Flandrin and P. Borgnat, “Time-frequency energy distributions meet compressed sensing,” IEEE Trans. Signal Process.,
vol. 58, no. 6, pp. 2974–2982, 2010.
[23] M. G. Amin, Compressive Sensing for Urban Radar. CRC Press, 2014.
[24] L. Stankovic, I. Orovic, S. Stankovic, and M. Amin, “Compressive sensing based separation of nonstationary and stationary
signals overlapping in time-frequency,” IEEE Trans. Signal Process., vol. 61, no. 18, pp. 4562–4572, Sept 2013.
[25] B. Jokanovic, M. Amin, and S. Stankovic, “Instantaneous frequency and time-frequency signature estimation using
compressive sensing,” in Proc. SPIE, vol. 8714, Baltimore, MD, May 2013.
[26] Y. D. Zhang, M. G. Amin, and B. Himed, “Reduced interference time-frequency representations and sparse reconstruction
of undersampled data,” in Proc. European Signal Proc. Conf., Marrakech, Morocco, Sept. 2013.
[27] L. Stankovic, S. Stankovic, and M. Amin, “Missing samples analysis in signals for applications to L-estimation and
compressive sensing,” Signal Processing, vol. 94, pp. 401–408, 2014.
[28] S. F. Cotter, B. D. Rao, K. Engan, and K. Kreutz-Delgado, “Sparse solutions to linear inverse problems with multiple
measurement vectors,” IEEE Trans. Signal Process., vol. 53, no. 7, pp. 2477–2488, 2005.
[29] M. G. Amin, Y. D. Zhang, and B. Jokanovic, “Time-frequency signature reconstruction from random observations using
multiple measurement vectors,” in Proc. IEEE ICASSP, Florence, Italy, May 2014.
[30] B. Jokanovic, M. G. Amin, and Y. D. Zhang, “Reconstruction of multi-window time-frequency representation based on
Hermite functions,” in Proc. SPIE, Baltimore, MD, May 2014.
[31] Y. Kim and H. Ling, “Human activity classification based on micro-Doppler signatures using a support vector machine,”
IEEE Trans. Geosci. Remote Sens., vol. 47, no. 5, pp. 1328–1337, 2009.
[32] T. Huang, G. Yang, and G. Tang, “A fast two-dimensional median filtering algorithm,” IEEE Trans. Acoust., Speech, Signal
Proc., vol. 27, no. 1, pp. 13–18, 1979.
[33] T. Fawcett, “An introduction to ROC analysis,” Pattern Recognition Letters, vol. 27, no. 8, pp. 861–874, 2006.
IET RADAR, SONAR AND NAVIGATION 15
Fig. 2. TFRs obtained using different number of window functions: (a) Spectrogram using 256-point Hamming window, (b)
multi-window spectrogram obtained using 3, 5 and 7 DPSS functions, respectively, (c) multi-window spectrogram obtained using
3, 5 and 7 Hermite functions, respectively, (d) multi-window spectrogram obtained using first 3, 5 and 7 dominant time-frequency
kernel eigenvectors, respectively.

IET RADAR, SONAR AND NAVIGATION 16
Fig. 3. Multi-window spectrogram of data representing a fall backward with 45 degrees. 50% of samples are missing, and 5
window functions are employed. (a)Incomplete data with DPSS (b) Incomplete data with Hermite functions.

IET RADAR, SONAR AND NAVIGATION 17
Fig. 4. Multi-window spectrogram of data representing a fall forward with 0 degrees. 50% of samples are missing, and 5 window
functions are employed. (a) Full data with DPSS, (b) Full data with Hermite functions, (c) Incomplete data (50% missing) with
DPSS, (d) Incomplete data (50% missing) with Hermite functions.

IET RADAR, SONAR AND NAVIGATION 18
Fig. 5. Multi-window spectrogram of data representing a sit/stand motion using 5 window functions, (a) Full data with DPSS,
(b) Full data with Hermite functions, (c) Incomplete data (50% missing) with DPSS, (d) Incomplete data (50% missing) with
Hermite functions.
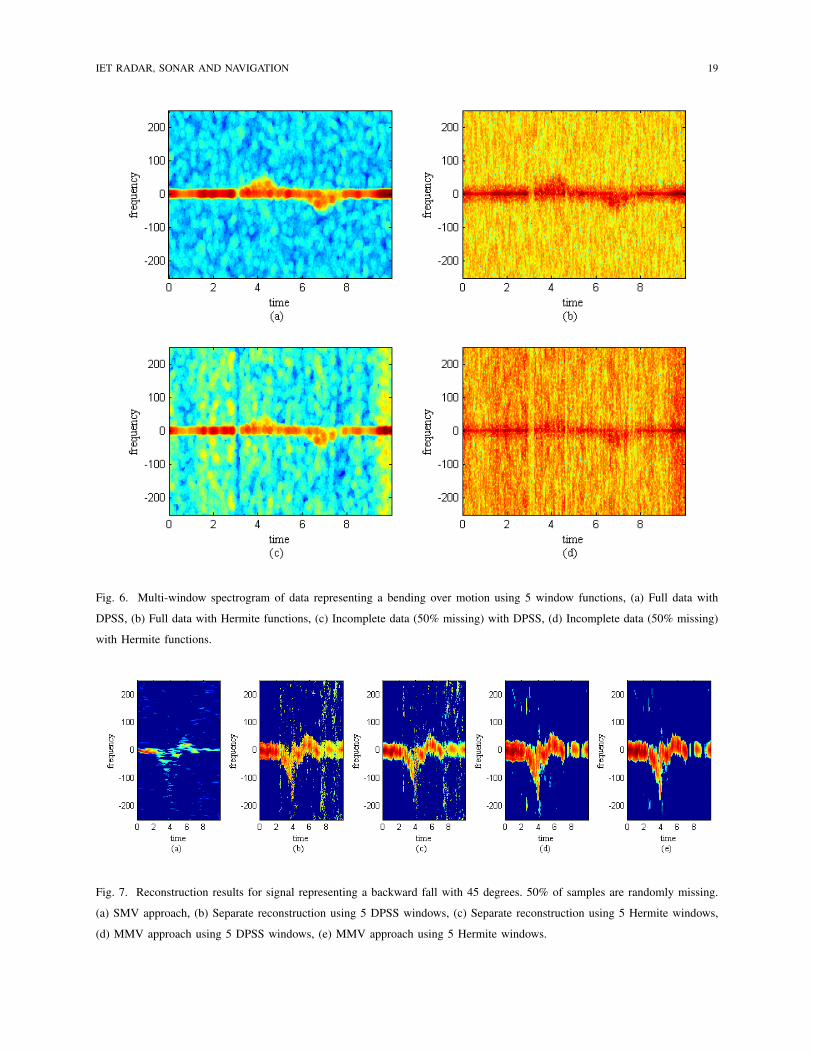
IET RADAR, SONAR AND NAVIGATION 19
Fig. 6. Multi-window spectrogram of data representing a bending over motion using 5 window functions, (a) Full data with
DPSS, (b) Full data with Hermite functions, (c) Incomplete data (50% missing) with DPSS, (d) Incomplete data (50% missing)
with Hermite functions.
Fig. 7. Reconstruction results for signal representing a backward fall with 45 degrees. 50% of samples are randomly missing.
(a) SMV approach, (b) Separate reconstruction using 5 DPSS windows, (c) Separate reconstruction using 5 Hermite windows,
(d) MMV approach using 5 DPSS windows, (e) MMV approach using 5 Hermite windows.

IET RADAR, SONAR AND NAVIGATION 20
Fig. 8. Reconstruction results for signal representing a sit/stand motion. 50% of samples are randomly missing. (a) SMV
approach, (b) Separate reconstruction using 5 DPSS windows, (c) Separate reconstruction using 5 Hermite windows, (d) MMV
approach using 5 DPSS windows, (e) MMV approach using 5 Hermite windows.
Fig. 9. Reconstruction results for signal representing a bending over motion. 50% of samples are randomly missing. (a) SMV
approach, (b) Separate reconstruction using 5 DPSS windows, (c) Separate reconstruction using 5 Hermite windows, (d) MMV
approach using 5 DPSS windows, (e) MMV approach using 5 Hermite windows.
IET RADAR, SONAR AND NAVIGATION 21
Fig. 10. Diagram showing the steps used in the process of classification.
0 0.2 0.4 0.6 0.8 10
0.1
0.2
0.3
0.4
0.5
0.6
0.7
0.8
0.9
1
False positive rate
Tru
e po
sitiv
e ra
te
SMV, AROC = 0.92586SRs, AROC = 0.9319SRh, AROC = 0.9319MMVs, AROC = 0.93793MMVh, AROC = 0.93362
Fig. 11. ROC curves for the described methods. SR indicates separate reconstruction results. Subscript ’s’ denotes the use of
Slepian sequence, whereas ’h’ indicates Hermite sequence. AROC values are also depicted for each curve.