Embed Size (px)
Citation preview

16-QAM signal pre-equalization using multiplebinary analog FIR filtersbased on 28-nm FD-SOI fordispersion compensation
Ryoichiro Nakamura, Shotaro Owaki, Kenta Amino,Kawori Sekine, Kazuyuki Wada, and Moriya Nakamuraa)
School of Science and Technology, Meiji University,
1–1–1 Higashi-Mita, Tama-ku, Kawasaki, Kanagawa 214–8571, Japan
Abstract: We propose a novel pre-equalizer for multi-level IQ-modulation
signals. The pre-equalizer is composed of multiple binary analog finite
impulse response (FIR) filters which can realize smaller integrated-circuit
(IC) chip size. In the proposed design scheme, required complex-number
operations are implemented by a butterfly construction of real-number FIR
filters. The analog FIR filters were designed using 28 nm fully depleted
silicon on insulator (FD-SOI) based complementary metal-oxide-semicon-
ductor (CMOS) circuits. The performance was investigated using numerical
simulation of a 40-Gb/s 16-ary quadrature amplitude modulation (16-QAM)
standard single-mode fiber (SSMF) transmission system. The simulated
CMOS circuits successfully compensated the 16-QAM signals distorted by
chromatic dispersion. The error vector magnitude (EVM) of the transmitted
16-QAM signals was improved from 27% to 12%.
Keywords: equalization, FIR filter, 16-QAM, CMOS circuit
Classification: Fiber-Optic Transmission for Communications
References
[1] M. Nakamura, Y. Kamio, and T. Miyazaki, “Linewidth-tolerant 10-Gbit/s16-QAM transmission using a pilot-carrier based phase-noise cancellingtechnique,” Opt. Express, vol. 16, no. 14, pp. 10611–10616, Jul. 2008.DOI:10.1364/OE.16.010611
[2] S. Randel, D. Pilori, S. Corteselli, G. Raybon, A. Adamiecki, A. Gnauck, S.Chandrasekhar, P. Winzer, L. Altenhain, A. Bielik, and R. Schmid, “All-electronic flexibly programmable 864-Gb/s single-carrier PDM-64-QAM,”Optical Fiber Communications Conference and Exhibition (OFC2014),Th5C.8, Mar. 2014. DOI:10.1364/OFC.2014.Th5C.8
[3] S. Beppu, K. Kasai, M. Yoshida, and M. Nakazawa, “2048 QAM (66Gbit/s)single-carrier coherent optical transmission over 150 km with a potential SEof 15.3 bit/s/Hz,” Opt. Express, Vol. 23, No. 4, pp. 4960–4969, Feb. 2015.DOI:10.1364/OE.23.004960
[4] K. Fukuchi, W. Maeda, D. Ogasahara, and T. Takamichi, “Expansion of system
© IEICE 2018DOI: 10.1587/comex.2017XBL0163Received October 24, 2017Accepted October 31, 2017Publicized November 15, 2017Copyedited February 1, 2018
37
IEICE Communications Express, Vol.7, No.2, 37–42

dynamic chromatic-dispersion-compensation range by optimal FIR filteradaptation,” OptoElectronics and Communications Conference (OECC2009),TuK2, Jul. 2009. DOI:10.1109/OECC.2009.5219776
[5] A. Eghbali, H. Johansson, O. Gustafsson, and S. J. Savory, “Optimal least-squares FIR digital filters for compensation of chromatic dispersion in digitalcoherent optical receivers,” J. Lightwave Technol., vol. 32, no. 8, pp. 1449–1456, Apr. 2014. DOI:10.1109/JLT.2014.2307916
[6] C. Pelard, E. Gebara, A. J. Kim, M. Vrazel, E. J. Peddi, V. M. Hietala, S.Bajekal, S. E. Ralph, and J. Laskar, “Multilevel signaling and equalization overmultimode fiber at 10Gbit/s,” Proc. IEEE GaAs Integrated Circuits Symp.,pp. 197–199, Nov. 2003. DOI:10.1109/GAAS.2003.1252393
[7] H. Wu, J. A. Tierno, P. Pepeljugoski, J. Schaub, S. Gowda, J. A. Kash, and A.Hajimiri, “Integrated transversal equalizers in high-speed fiber-optic systems,”IEEE J. Solid-State Circuits, vol. 38, no. 12, pp. 2131–2137, Dec. 2003.DOI:10.1109/JSSC.2003.819084
[8] Y. Hur, M. Maeng, C. Chun, F. Bien, H. Kim, S. Chandramouli, E. Gebara, andJ. Laskar, “Equalization and near-end crosstalk (NEXT) noise cancellation for20Gb/s 4-PAM backplane serial I/O interconnections,” IEEE Trans. Microw.Theory Techn., vol. 53, no. 1, pp. 246–255, Jan. 2005. DOI:10.1109/TMTT.2004.839311
[9] M. Maeng, F. Bien, Y. Hur, H. Kim, S. Chandramouli, E. Gebara, and J.Laskar, “0.18-mm CMOS equalization techniques for 10-Gb/s fiber opticalcommunication links,” IEEE Trans. Microw. Theory Techn., vol. 53, no. 11,pp. 3509–3519, Nov. 2005. DOI:10.1109/TMTT.2005.857108
[10] E. Mammei, F. Loi, F. Radice, A. Dati, M. Bruccoleri, M. Bassi, and A.Mazzanti, “A power-scalable 7-tap FIR equalizer with tunable active delayline for 10-to-25Gb/s multi-mode fiber EDC in 28 nm LP-CMOS,” IEEEInternational Solid-State Circuits Conference (ISSCC), Dig. Tech. Papers,pp. 142–143, Feb. 2014. DOI:10.1109/ISSCC.2014.6757373
[11] K. Amino, S. Watanabe, K. Sekine, Y. Kitani, R. Nakamura, K. Wada, and M.Nakamura, “An analog FIR filter design using inverters and Gillbert Cellswith 28-nm FD-SOI process for compensating optical transmission distortion,”IEEJ Technical Meeting on Electronic Circuits, ECT-016-027, Mar. 2016(in Japanese).
[12] R. Nakamura, K. Amino, K. Sekine, K. Wada, and M. Nakamura, “Multi-levelpre-equalization using binary analog FIR filters based on 28-nm FD-SOI for20-Gb/s 4-PAM multi-mode fiber transmission,” IEICE Commun. Express,vol. 6, no. 4, pp. 154–159, Jan. 2017. DOI:10.1587/comex.2016XBL0210
1 Introduction
Higher speed, larger capacity data transmission is required in fiber optic commu-
nication links to accommodate rapidly increasing data traffic. Multi-level modu-
lation is one key technology to increase the transmission capacity. Quadrature
amplitude modulation (QAM) including 16-QAM and 64-QAM have been exper-
imentally investigated, where in-phase (I) and quadrature (Q) components of
lightwave are modulated by multi-level signals [1, 2]. Higher order QAM schemes
have also been studied to realize higher spectral efficiency [3]. However, these
multi-level IQ-modulation signals are susceptible to waveform distortion caused by,
e.g., chromatic dispersion (CD) in comparison with binary modulations due to the© IEICE 2018DOI: 10.1587/comex.2017XBL0163Received October 24, 2017Accepted October 31, 2017Publicized November 15, 2017Copyedited February 1, 2018
38
IEICE Communications Express, Vol.7, No.2, 37–42
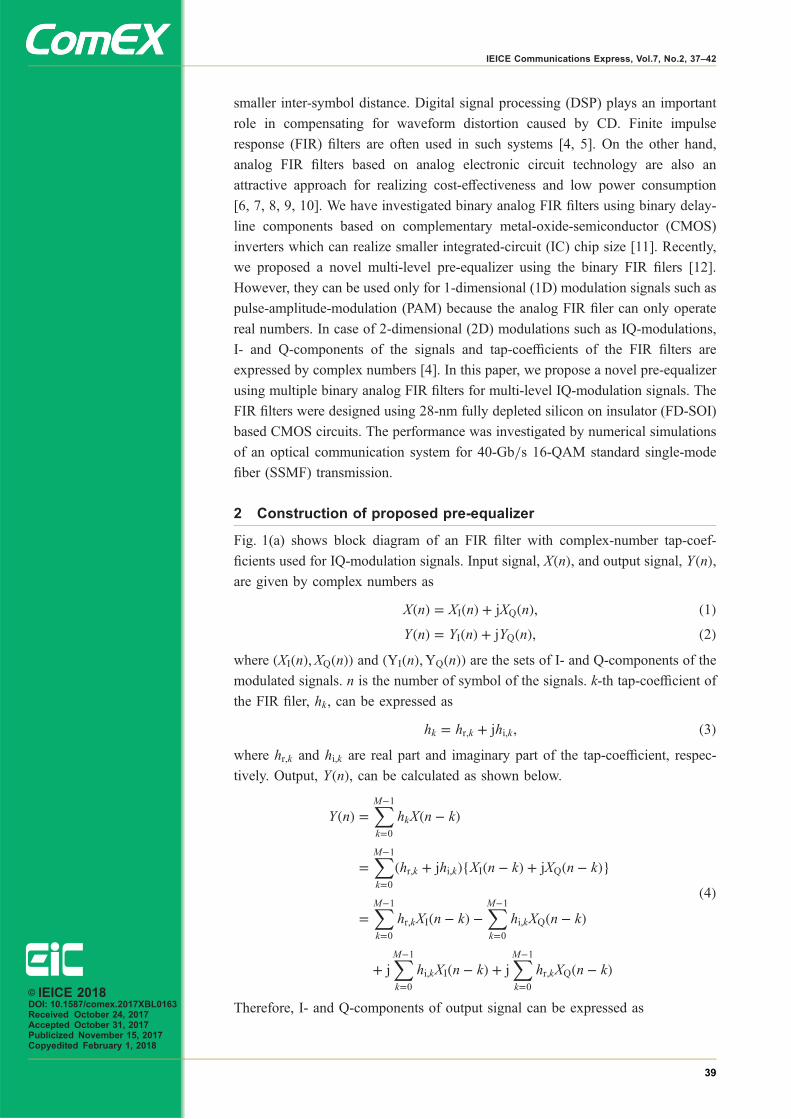
smaller inter-symbol distance. Digital signal processing (DSP) plays an important
role in compensating for waveform distortion caused by CD. Finite impulse
response (FIR) filters are often used in such systems [4, 5]. On the other hand,
analog FIR filters based on analog electronic circuit technology are also an
attractive approach for realizing cost-effectiveness and low power consumption
[6, 7, 8, 9, 10]. We have investigated binary analog FIR filters using binary delay-
line components based on complementary metal-oxide-semiconductor (CMOS)
inverters which can realize smaller integrated-circuit (IC) chip size [11]. Recently,
we proposed a novel multi-level pre-equalizer using the binary FIR filers [12].
However, they can be used only for 1-dimensional (1D) modulation signals such as
pulse-amplitude-modulation (PAM) because the analog FIR filer can only operate
real numbers. In case of 2-dimensional (2D) modulations such as IQ-modulations,
I- and Q-components of the signals and tap-coefficients of the FIR filters are
expressed by complex numbers [4]. In this paper, we propose a novel pre-equalizer
using multiple binary analog FIR filters for multi-level IQ-modulation signals. The
FIR filters were designed using 28-nm fully depleted silicon on insulator (FD-SOI)
based CMOS circuits. The performance was investigated by numerical simulations
of an optical communication system for 40-Gb/s 16-QAM standard single-mode
fiber (SSMF) transmission.
2 Construction of proposed pre-equalizer
Fig. 1(a) shows block diagram of an FIR filter with complex-number tap-coef-
ficients used for IQ-modulation signals. Input signal, XðnÞ, and output signal, YðnÞ,are given by complex numbers as
XðnÞ ¼ XIðnÞ þ jXQðnÞ; ð1ÞYðnÞ ¼ YIðnÞ þ jYQðnÞ; ð2Þ
where ðXIðnÞ; XQðnÞÞ and ðYIðnÞ;YQðnÞÞ are the sets of I- and Q-components of the
modulated signals. n is the number of symbol of the signals. k-th tap-coefficient of
the FIR filer, hk, can be expressed as
hk ¼ hr;k þ jhi;k; ð3Þwhere hr;k and hi;k are real part and imaginary part of the tap-coefficient, respec-
tively. Output, YðnÞ, can be calculated as shown below.
YðnÞ ¼XM�1
k¼0hkXðn � kÞ
¼XM�1
k¼0ðhr;k þ jhi;kÞfXIðn � kÞ þ jXQðn � kÞg
¼XM�1
k¼0hr;kXIðn � kÞ �
XM�1
k¼0hi;kXQðn � kÞ
þ jXM�1
k¼0hi;kXIðn � kÞ þ j
XM�1
k¼0hr;kXQðn � kÞ
ð4Þ
Therefore, I- and Q-components of output signal can be expressed as© IEICE 2018DOI: 10.1587/comex.2017XBL0163Received October 24, 2017Accepted October 31, 2017Publicized November 15, 2017Copyedited February 1, 2018
39
IEICE Communications Express, Vol.7, No.2, 37–42

YIðnÞ ¼XM�1
k¼0hr;kXIðn � kÞ þ
XM�1
k¼0ð�hi;kÞXQðn � kÞ; ð5Þ
YQðnÞ ¼XM�1
k¼0hi;kXIðn � kÞ þ
XM�1
k¼0hr;kXQðn � kÞ: ð6Þ
Equations (5) and (6) can be implemented with butterfly construction of four real-
number FIR filters as shown in Fig. 1(b). The four terms on the right side of Eq. (5)
and (6) are represented by the four blocks of FIR filters in the figure. In case of
16-QAM modulation, XIðnÞ and XQðnÞ are expressed by 4-level (2 bit/Symbol)
signals. We have proposed and investigated multi-level FIR filter composed of
binary analog FIR filers as shown in Fig. 1(c) [12]. In the figure, X1ðnÞ and X0ðnÞare the most-significant bit (MSB) and least-significant bit (LSB) of the 4-level
signal, respectively. One multi-level FIR filter consists of two parallel binary FIR
filters and a 2/1-weighted adder. Therefore, the complex-number FIR filter shown
in Fig. 1(a) can be implemented by using our proposed binary analog FIR filters. It
should be noted that this proposed construction scheme is fully scalable to increase
the multi-level of the modulation format. For example, an 8-level FIR filter is
composed of three parallel binary FIR filters and a 4/2/1-weighted adder, which
realize 64QAM modulation. The binary analog FIR filters are composed of multi-
pliers implemented with Gilbert Cells, as shown in Fig. 1(d) and binary delay lines
implemented with CMOS inverters, as shown in Fig. 1(e), realizing cost-effective-
(a) Block diagram of FIR filter with complex-number tap-coefficients.
(d) Gilbert cell. (e) CMOS inverters.
(b) Block diagram of proposed FIR filterwith real-number tap-coefficients.
(c) Block diagram of four-level FIR filtercomposed of binary FIR filters.
Fig. 1. Pre-equalizers composed of Gilbert cells and CMOS inverters.
© IEICE 2018DOI: 10.1587/comex.2017XBL0163Received October 24, 2017Accepted October 31, 2017Publicized November 15, 2017Copyedited February 1, 2018
40
IEICE Communications Express, Vol.7, No.2, 37–42
ness and low power consumption. The circuits were designed using 28 nm FD-SOI
based CMOS circuit [11]. The maximum output voltage and slew rate (SR) of the
Gilbert Cells were about 200mV and 5.2mV/ps, respectively. It should be noted
that the circuit has a sufficiently high response speed for 10Gsymbol/s signals. The
maximum output voltage and SR of the CMOS inverters were about 1.0V and
81mV/ps, respectively. This slow response speed of the inverters were used to
realize the binary delay lines [11].
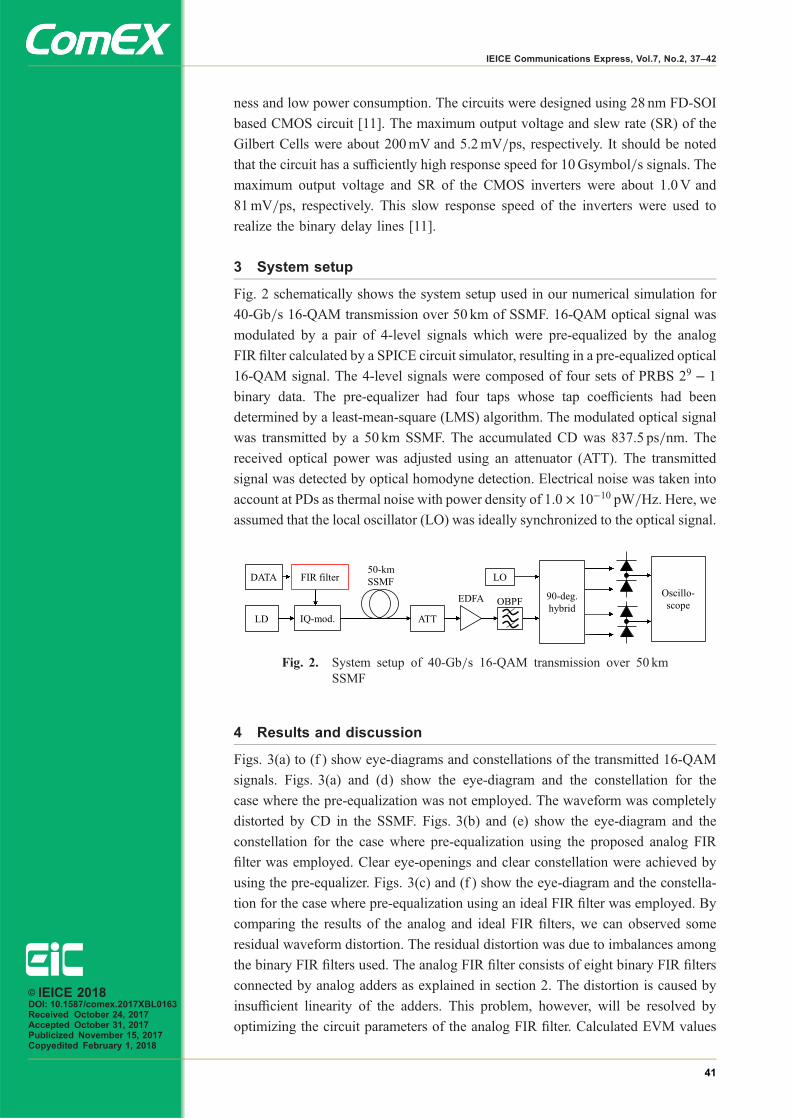
3 System setup
Fig. 2 schematically shows the system setup used in our numerical simulation for
40-Gb/s 16-QAM transmission over 50 km of SSMF. 16-QAM optical signal was
modulated by a pair of 4-level signals which were pre-equalized by the analog
FIR filter calculated by a SPICE circuit simulator, resulting in a pre-equalized optical
16-QAM signal. The 4-level signals were composed of four sets of PRBS 29 � 1
binary data. The pre-equalizer had four taps whose tap coefficients had been
determined by a least-mean-square (LMS) algorithm. The modulated optical signal
was transmitted by a 50 km SSMF. The accumulated CD was 837.5 ps/nm. The
received optical power was adjusted using an attenuator (ATT). The transmitted
signal was detected by optical homodyne detection. Electrical noise was taken into
account at PDs as thermal noise with power density of 1:0 � 10�10 pW/Hz. Here, we
assumed that the local oscillator (LO) was ideally synchronized to the optical signal.
4 Results and discussion
Figs. 3(a) to (f ) show eye-diagrams and constellations of the transmitted 16-QAM
signals. Figs. 3(a) and (d) show the eye-diagram and the constellation for the
case where the pre-equalization was not employed. The waveform was completely
distorted by CD in the SSMF. Figs. 3(b) and (e) show the eye-diagram and the
constellation for the case where pre-equalization using the proposed analog FIR
filter was employed. Clear eye-openings and clear constellation were achieved by
using the pre-equalizer. Figs. 3(c) and (f ) show the eye-diagram and the constella-
tion for the case where pre-equalization using an ideal FIR filter was employed. By
comparing the results of the analog and ideal FIR filters, we can observed some
residual waveform distortion. The residual distortion was due to imbalances among
the binary FIR filters used. The analog FIR filter consists of eight binary FIR filters
connected by analog adders as explained in section 2. The distortion is caused by
insufficient linearity of the adders. This problem, however, will be resolved by
optimizing the circuit parameters of the analog FIR filter. Calculated EVM values
Fig. 2. System setup of 40-Gb/s 16-QAM transmission over 50 kmSSMF
© IEICE 2018DOI: 10.1587/comex.2017XBL0163Received October 24, 2017Accepted October 31, 2017Publicized November 15, 2017Copyedited February 1, 2018
41
IEICE Communications Express, Vol.7, No.2, 37–42

versus optical signal-to-noise ratio (OSNR) are shown in Fig. 3(g). In the figure, we
also plotted the EVM for the case of the ideal FIR filter. Even when using the ideal
FIR filter, the EVM did not become 0% due to the electrical noise of the receiver.
In the case without the pre-equalization, the EVM did not decrease to less than
27%, even when we improved the OSNR. In the case with the pre-equalization,
however, the EVM was improved to less than 13%. The degradation of the EVM
from using the ideal FIR filter was only about 3 dB. The results clearly showed the
effectiveness of our proposed pre-equalizer.
5 Conclusion
We proposed a novel pre-equalizer for multi-level IQ-modulation signals. The pre-
equalizer is composed of multiple binary analog FIR filters which can realize
smaller IC chip size. This equalization technology should encourage the adoption
of analog FIR filters in future cost-effective and low-power-consumption optical
coherent systems.
(g) EVM performance of 16-QAM signal improved by pre-equalization.
(a) Eye-diagram of transmitted 16-QAM signal without pre-equalization.
(b) Eye-diagram of transmitted 16-QAM signal with pre-equalization using analog FIR filter.
(c) Eye-diagram of transmitted16-QAM signal withpre-equalization using idealFIR filter.
(d) Constellation of transmitted 16-QAM signal without equalization.
(e) Constellation of transmitted 16-QAM signal with pre-equalization using analog FIR filter.
(f) Constellation of transmitted16-QAM signal withpre-equalization using idealFIR filter.
Fig. 3. Eye-diagrams, constellations of the transmitted signals andEVM characteristics.
© IEICE 2018DOI: 10.1587/comex.2017XBL0163Received October 24, 2017Accepted October 31, 2017Publicized November 15, 2017Copyedited February 1, 2018
42
IEICE Communications Express, Vol.7, No.2, 37–42
Preliminary experimentof meteor burstcommunications inequatorial region
Tadahiro Wada1a), Kaiji Mukumoto2, Hiroki Wadaguchi1,I Wayan Mustika3, and Linawati41 Graduate School of Integrated Science and Technology, Shizuoka University,
3–5–1 Johoku, Naka-ku, Hamamatsu 432–8561, Japan2 Technical Division, Shizuoka University, Japan3 Department of Electrical Engineering and Information Technology,
Gadjah Mada University, Indonesia4 Department of Electrical and Computer Engineering, Udayana University,
Indonesia
Abstract: The aim of the study is to explore the possibility of the use of
Meteor Burst Communications (MBCs) in equatorial regions. We installed
the master and the remote stations at Yogyakarta, Java Island and Jimbaran,
Bali Island, Indonesia, respectively. As a preliminary experimental result, we
confirmed that some packet transmissions between the two stations were
achieved through meteor burst channels.
Keywords: meteor burst communications, equatorial regions, Indonesia
Classification: Space Utilization Systems for Communications
References
[1] D. L. Schilling, Meteor Burst Communications: Theory and Practice, Wiley,1993.
[2] A. Fukuda, Meteor Burst Communications, Corona-sha, 1997 (in Japanese).[3] “Snow telemetry (SNOTEL) and snow course data and products,” Natural
Resources Conservation Service, United States Department of Agriculture,https://www.wcc.nrcs.usda.gov/snow/, accessed Aug. 23, 2017.
[4] R. I. Desourdis, A. K. McDonough, S. C. Merrill, R. M. Bauman, D. Spector, W.Bonser, D. E. Warren, D. A. Neumann, and J. A. Lucas, “The ARPA high-ERPmeteor burst link experiment,” Proc. 1993 IEEE Military CommunicationsConf., pp. 407–412, 1993. DOI:10.1109/MILCOM.1993.408636
[5] J. Weitzen, M. Sowa, R. Scofidio, and J. Quinn, “Characterizing the multipathand doppler spreads of the high-latitude meteor burst communication channel,”IEEE Trans. Commun., vol. 35, no. 10, pp. 1050–1058, Oct. 1987. DOI:10.1109/TCOM.1987.1096690
[6] K. Mukumoto et al., “Data transmission experiments using meteor burstcommunication equipment conducted during japanese 43-rd and 44-thexpeditions in Antarctica,” IEICE Trans. Commun., vol. J88-B, no. 9,pp. 1875–1885, Sept. 2005 (in Japanese).
© IEICE 2018DOI: 10.1587/comex.2017XBL0136Received September 4, 2017Accepted November 17, 2017Publicized November 30, 2017Copyedited February 1, 2018
43
IEICE Communications Express, Vol.7, No.2, 43–47

[7] A. Fukuda, K. Mukumoto, S. Ohichi, K. Nakano, Y. Yoshihiro, M. Nagasawa,H. Yamagishi, N. Sato, H. Yang, G. He, and L. Jin, “MBC data transmissionexperiment conducted during japanese 45-th expedition in Antarctica,” IEICETrans. Commun., vol. J90-B, no. 2, pp. 199–207, Feb. 2007 (in Japanese).
[8] T. Tsuda, “Observations of lower thermosphere dynamics with a meteor windradar,” Tenki-Journal of the Meteorological Society of Japan, vol. 43, no. 1,pp. 9–23, Jan. 1996 (in Japanese).
[9] K. K. Kumar, T. M. Antonita, and S. T. Shelbi, “Initial results from SKiYMETmeteor radar at Thumba (8.5°N, 77°E): 2. Gravity wave observations in theMLT region,” Radio Sci., vol. 42, no. 6, Dec. 2007. DOI:10.1029/2006RS003553
1 Introduction
When meteors enter into the Earth’s atmosphere, ionized gas columns, which are
called “meteor bursts,” are generated by friction with the atmosphere. Meteor Burst
Communications (MBCs) are non Line-of-Sight communication methods using
reflection phenomena of low VHF band waves by the meteor bursts [1, 2, 3, 4, 5,
6, 7]. MBC systems can realize data transmission between stations apart from each
other by at most 2000 km. Moreover, MBC systems can be easily and inexpen-
sively constructed compared with satellite communications, etc.
Since the existence time of the meteor bursts is as short as about several
hundreds milliseconds, MBCs are suitable for communications which need small
data transmission and allow some delay. For this reason, MBC systems are
applicable for data transmission for environmental and meteorological observation
systems which allow some delay and do not require massive data transmissions.
A famous application of MBCs is SNOTEL operated by Natural Resources
Conservation Service (NRCS), United States Department of Agriculture [3].
SNOTEL is a snow telemetry system and collects weather data from the Rocky
Mountains and Alaska. About 800 remote stations of SNOTEL are located where
access is often difficult or restricted. Several master stations collect the data from
the remote stations and transmit them to the central computer of NRCS.
Some MBC experiments and operations have been also done in high-latitude
regions [5, 6, 7]. The experiments exhibit some interesting results from various
points of view such as within-day variation and seasonal variation. From the
experiments in Antarctica, some unique results have been obtained, which are
different from the results in mid-latitude regions.
However, to the best of our knowledge, there have been no MBC experiments
and operations in equatorial regions. Some astronomical observation results in
equatorial regions showed that the appearance of meteors has some difference with
that in mid-latitude regions, e.g., there are smaller variations in the height of meteor
bursts, smaller seasonal fluctuations, etc [8, 9]. Therefore, we expect to obtain
unique properties about MBC in equatorial regions.
In this study, we try to conduct MBC experiments to obtain communication
performance of MBCs and to explore the possibility of MBCs in equatorial regions.
In May 2017, we have conducted a preliminary experiment about MBCs in
© IEICE 2018DOI: 10.1587/comex.2017XBL0136Received September 4, 2017Accepted November 17, 2017Publicized November 30, 2017Copyedited February 1, 2018
44
IEICE Communications Express, Vol.7, No.2, 43–47

Indonesia. In this article, we provide the result of the MBC experiment and show
the possibility of using MBCs in equatorial regions.
2 Conditions of the experiment
2.1 The locations and the period of the experiment
The locations of the stations are listed below:
• The master station: Gadjah Mada University, Yogyakarta, Java Island, Indo-
nesia (S 7°48B5BB, E 110° 21B52BB), time zone: +7.• The remote station: Udayana University Jimbaran Campus, Jimbaran, Bali
Island, Indonesia (S8°22B9BB, E115°8B18BB), time zone: +8.The stations are located in approximately an east-west direction and the distance
between them is about 530 km. We carried out the experiment from May 9 to May
11, 2017 including installation of the stations. The effective period of the experi-
ment was about 26 hours, which was from May 10, 2017, 6:00 am UTC to May 11,
2017, 8:00 am UTC.
2.2 Equipment
The antennas of both the master and remote stations are Yagi antennas with 3
elements. The elevation angle of the antennas is set at 18°. The direction angle of
the master and remote antennas are 97° and 276° clockwise from the North. Both
stations used the same type of MBC modems: MRC565, Maiden Rock Commu-
nications, LLC. The specifications of the modems are: the carrier frequency is
48.375MHz, the transmission rate is 4000 bps, the modulation scheme is DEPSK
and the transmission power is set at 100W. The remote station periodically makes
20-byte test data every five minutes for sending to the master station.
3 Data transmission procedure
Fig. 1 illustrates the packet transmission procedure. In this figure, M ! R means
packets from the master station to the remote station and R ! M means packets in
vice versa. The principal of the packet transmission procedure is explained as
follows:
• The master station periodically sends Probe Packets (PPs) to the remote
station.
• When the remote station successfully receives a PP, the remote station trans-
mits a Data Packet (DP) to the master station.
• If the master station successfully receives the DP, the master station sends an
Acknowledgment Packet (AP) to the remote station.
Fig. 1. Packet Transmission Procedure
© IEICE 2018DOI: 10.1587/comex.2017XBL0136Received September 4, 2017Accepted November 17, 2017Publicized November 30, 2017Copyedited February 1, 2018
45
IEICE Communications Express, Vol.7, No.2, 43–47

• If the remote station receives the AP, the remote station removes the data
which has been transmitted to the master station from the buffer in the remote
station.
As shown in this figure, the time required for the successful packet transmission is
about 250ms.
We note that the shorter the period of transmission of PPs is, the better
performance the master station yields. However, we set the duration of PPs to
500ms to prevent a heat problem with the modem.
4 Experimental result
Fig. 2 shows the observed noise power at both of the stations during the experiment
period. Since acceptable noise power for the MBC system is −115 dBm or less, we
observed that most of the the experiment period was appropriate for the MBC
experiment. However, at the master station, the noise power level was slightly
higher than the acceptable noise level in the beginning of the experiment period.
Fig. 3 shows the number of received packets. By the transmission procedure,
the received PPs and APs were counted at the remote station and the received DP
was counted at the master station.
From this figure, we observe that, during most of the experiment period, PPs
were received by the remote station even when the number of them was not so
large. The result means that the reflection of PPs by meteor bursts occurred during
most of the period.
We also observe that many data transmissions were achieved in the period from
May 10, 8:00 pm to May 11, 4:00 am UTC. In order to clearly identify a reason of
the phenomena, we would need further experiments to collect more data. For now
we suppose the following possibilities.
One possible reason is that the number of meteors increased during the period.
The period-of-interest was during the morning in Indonesia. Some past studies in
mid-latitude regions showed that many meteor burst channels were established in
the morning, especially, around the time near sunrise. Another possible reason is
related to the noise level. From Fig. 2, we find that the noise power level of the
period-of-interest was lower than other periods. We also need to take other possible
reasons, e.g., sporadic E propagation, into account.
The total numbers of received PPs, DPs and APs were 390, 79 and 51,
respectively. Since the transmission interval of PPs was set to 500ms, the number
of probe packets was about 7200 per hour. Therefore, the PP reception rate was
about 0.208% (¼ 390=ð7200 � 26Þ).Since the number of accepted PPs at the remote station should be the same
as the number of data packets, 390 data packets have been transmitted from the
remote station. Therefore, the acceptance ratio of the DPs at the master station was
20.3% (¼ 79=390). From the viewpoint of the remote station, out of 79 DPs, the
remote station recognized that 51 data packets have been accepted by the master
station. Thus the successful data transmission rate for the remote station was 64.6%
(¼ 51=79).© IEICE 2018DOI: 10.1587/comex.2017XBL0136Received September 4, 2017Accepted November 17, 2017Publicized November 30, 2017Copyedited February 1, 2018
46
IEICE Communications Express, Vol.7, No.2, 43–47

5 Conclusion
In this article, we provided an overview of our preliminary MBC experiment in
Indonesia and showed the possibility of applying MBC in the equatorial region.
Since we expect to observe unique properties and/or communication performance
of MBCs in equatorial regions, we will continue MBC experiments to obtain
additional results.
Acknowledgments
The authors would like to thank the staff and students of Gadjah Mada University
and Udayana University for assistance with the experiments. This work was
supported by JSPS KAKENHI Grant Number (Kiban C)16K06347.
Fig. 3. The Numbers of Received Packets
Fig. 2. Observed Noise Power
© IEICE 2018DOI: 10.1587/comex.2017XBL0136Received September 4, 2017Accepted November 17, 2017Publicized November 30, 2017Copyedited February 1, 2018
47
IEICE Communications Express, Vol.7, No.2, 43–47

Joint rate and poweroptimization for SIC in uplinkNOMA systems
Meilin Hea), Guanghui Song, and Jun ChengDepartment of Intelligent Information Engineering and Sciences,
Doshisha University, Kyoto 610–0321, Japan
Abstract: To implement K-user multi-rate multi-power transmission in
non-orthogonal multiple access systems with successive interference cancel-
lation, a repeat accumulator code serially concatenated with a spreading is
employed for each user to implement a variable, low-rate coding. A joint
rate and power optimization (RPO) is proposed to maximize the sum rate
with error free decoding. Numerical results show that our proposed coding-
spreading scheme with joint RPO, supporting the multi-rate transmission
with the same structure of encoder, approaches the Shannon limit.
Keywords: non-orthogonal multiple access systems, successive interfer-
ence cancellation, joint rate and power optimization
Classification: Fundamental Theories for Communications
References
[1] Y. Saito, Y. Kishiyama, A. Benjebbour, T. Nakamura, A. Li, and K. Higuchi,“Non-orthogonal multiple access (NOMA) for cellular future radio access,”Proc. IEEE VTC Spring 2013, pp. 1–5, June 2013. DOI:10.1109/VTCSpring.2013.6692652
[2] Z. Ding, Z. Yang, P. Fan, and H. V. Poor, “On the performance of non-orthogonal multiple access in 5G systems with randomly deployed users,” IEEESignal Process. Lett., vol. 21, no. 12, pp. 1501–1505, Dec. 2014. DOI:10.1109/LSP.2014.2343971
[3] L. Dai, B. Wang, Y. Yuan, S. Han, C.-I. I, and Z. Wang, “Non-orthogonalmultiple access for 5G: Solutions, challenges, opportunities, and future researchtrends,” IEEE Commun. Mag., vol. 53, no. 9, pp. 74–81, Sep. 2015. DOI:10.1109/MCOM.2015.7263349
[4] T. M. Cover and J. A. Thomas, Elements of Information Theory, Wiley Press,New York, 2006.
[5] M. He, G. Song, and J. Cheng, “Optimal rate profile for multi-user multi-ratetransmission systems by bivariate fixed-point analysis,” IET Commun., vol. 11,no. 5, pp. 628–638, Mar. 2017. DOI:10.1049/iet-com.2016.0694
1 Introduction
For non-orthogonal multiple access (NOMA) systems with successive interference
cancellation (SIC), the Shannon limit can be achieved by power-only optimization
© IEICE 2018DOI: 10.1587/comex.2017XBL0175Received November 14, 2017Accepted November 21, 2017Publicized December 6, 2017Copyedited February 1, 2018
48
IEICE Communications Express, Vol.7, No.2, 48–53

(PO) as long as each user has an ideal channel code. Previous works [1, 2, 3] are
mainly based on this assumption of ideal code. It is intuitively to think that code
design for NOMA systems is not necessary, since each user can employ the
conventional well-designed channel codes directly.
However, NOMA systems need to support massive of users and multiple rates
to meet the requirements for diverse services. An increase in the number of users
will result in very serious multi-user interference, so that some users need low-rate
codes to guarantee the decoding performance. Moreover, such systems should
support various rates for the various multimedia services. Employing conventional
well-designed low-rate LDPC or Turbo code, is impractical since users have to
employ difference encoders to realize multi-rate transmission. It is required to
design a bank of variable, low-rate channel codes with the same structure of
encoder.
In this paper, for K-user multi-rate multi-power NOMA systems with SIC, we
use a repeat accumulator (RA) code serially concatenated with a spreading for each
user to implement a variable, low-rate coding, where the transmission rate can be
changed flexibly by varying the repeat number and spreading length. Here, users
employ the identical RA encoder, although their transmission rates are different.
Moreover, both RA and repetition (spreading) codes are simple and computation-
ally efficient. To enhance the system performance, we propose a joint rate and
power optimization (RPO) to maximize the sum rate. Numerical results show that
our proposed coding-spreading scheme with joint RPO, supporting the multi-rate
transmission with the same structure of encoder, approaches the Shannon limit.
2 System model
In this section, we simply introduce K-user multi-rate multi-power NOMA systems
in Fig. 1.
Suppose there are K active users simultaneously transmitted information to a
base station. For the kth user, we employ a rate-1=qk RA code serially concatenated
with a length-lk spreading. The kth user’s transmission rate is rk ¼ 1=ðqklkÞ.Adjusting information bit lengths Bk guarantees the same length of transmitted
signal vectors Bkqklk ≜ N for each user and realizes multi-rate transmission. The
sum rate is Rsum ¼ PKk¼1 rk. Let pk be the transmission power of the kth user. The
total power is Psum ¼ PKk¼1 pk. The receiver gets a superimposed signal vector
y ¼ ðy1; � � � ; yNÞ at time j is
Fig. 1. K-user multi-rate multi-power transmitters with multiple accesschannel
© IEICE 2018DOI: 10.1587/comex.2017XBL0175Received November 14, 2017Accepted November 21, 2017Publicized December 6, 2017Copyedited February 1, 2018
49
IEICE Communications Express, Vol.7, No.2, 48–53

yj ¼XKk¼1
ffiffiffiffiffipk
pxðkÞj þ zj; j ¼ 1; � � � ; N; ð1Þ
where zj is a zero-mean Gaussian variable with a variance of �2. The SIC performs
the decoding process of each user successively [4].
3 Joint rate and power optimization (RPO)
In this section, for given K, Psum, and �2, we give the optimal rate and power
profile, which achieves the optimal sum rate with error free decoding.
Before proceeding, let us consider a single-user system with a rate-1=q RA
code serially concatenated with a length-l spreading under the interference power
ς and noise power �2. For given transmission power p, we find an optimal pair
of ðq�; l�Þ that gives the maximum rate of 1=ðq�l�Þ by extrinsic information
transfer (EXIT) chart. Since the rate must be less the capacity, it holds that
1=ðq�l�Þ � 0:5 log2ð1 þ p=ð& þ �2ÞÞ. Hereafter, for simplicity’s sake, we still use
ðq; lÞ to represent ðq�; l�Þ.Now, let us turn back to our multi-rate multi-power NOMA systems. The SIC
receiver decodes the K users’ information in the order of increasing user index by
assumption. After recovering the information bits of the first k � 1 users, the
receiver subtracts these k � 1 users’ signals from the received signal, and decodes
the kth user’s information by regarding the remaining K � k users’ signals as
interference with power &k ¼PK
k0¼kþ1 pk0 .
For the joint RPO, let us first consider the K real powers. Multi-user informa-
tion theory tells us that arbitrary power allocation can provide the sum rate to
approach the capacity of K-user Gaussian multiple access channel [4]
XKk¼1
0:5 log2 1 þ pkXK
k0¼kþ1 pk0 þ �2
0@
1A ¼ 0:5 log2 1 þ
XK
k¼1 pk
�2
0@
1A; ð2Þ
if K random codes are used. This implies a reasonable assumption of a equal-ratio
power allocation, i.e.,
pk=pkþ1 ¼ �: ð3ÞSince Psum ¼ PK
k¼1 pk, we have
pk ¼�K�k � 1 � �
1 � �KPsum; � ≠ 1 (4a)
Psum
K; � ¼ 1 (4b)
8>><>>:
with k ¼ 1; � � � ; K.For the kth user with interference power &k, given power pk in (4), the EXIT
chart analysis (see above) gives the optimal ðqk; lkÞ that provides the maximum
rate 1=ðqklkÞ in SINRk ¼ pk=ð&k þ �2Þ. Since this optimization is given at the
power ratio of μ, we denote this optimal rate and power profile by �� ≜ððq�1 ; l�1 ; p�
1 Þ; � � � ; ðq�K; l�K; p�KÞÞ, that provides the maximum sum rate R�
max ¼PKk¼1 1=ðq�k l�k Þ.The assumption of equal-ratio power allocation above is based on the random
codes, which have arbitrary rates and thus are flexible to their corresponding real
© IEICE 2018DOI: 10.1587/comex.2017XBL0175Received November 14, 2017Accepted November 21, 2017Publicized December 6, 2017Copyedited February 1, 2018
50
IEICE Communications Express, Vol.7, No.2, 48–53

powers. In our work, the kth user’s rate 1=ðqklkÞ is discrete with the restriction of
integers qk and lk. Therefore, the simple equal-ratio power allocation may results in
a sum-rate loss. For this reason, we set � 2 ½�min; �max�. The value of �minð�maxÞ isdetermined by a minimum transmission rate requirement for each user. Over this
range, we obtain the optimal rate and power profile ��� as
��� ¼ ððq��1 ; l��
1 ; p��1 Þ; � � � ; ðq��K ; l�
�K ; p��
K ÞÞ ¼ arg max�2½�min;�max�
XKk¼1
1
q�k l�k
ð5Þ
which gives the optimal sum rate R��sum ¼ PK
k¼1 1=ðq��
k l��
k Þ with error free decoding.
In our RPO, there are two special cases. When � ¼ 1, users have the same
power, and only rate profile is optimised [5]. In the case of each user’s rate being
the same, information theory shows that its optimized power profile satisfies (3)
with � ¼ffiffiffiffiffiffiffiffiffiffiffiffiffiffiffiffiffiffiffiffiffiffiffiffiPsum=�2 þ 1K
p[4].
4 Numerical results
In this section, we present some numerical results by the above joint RPO.
Let’s set K ¼ 10, Psum ¼ 10, and SNR ¼ Psum=�2 ¼ 2 dB. Our RPO provides
sum rate R�sum for � 2 ½�min ¼ 0:74; �max ¼ 1:55� (see Fig. 2(a)). The gap between
the threshold and Shannon limit is also shown in Fig. 2(a). Among R�sum,
R��sum ¼ 0:50 is the maximum at �� ¼ 0:76 and thus is the optimal sum rate with
the minimum gap of 1.98 dB. The corresponding optimal rate and power profile ���
and it’s threshold are illustrated in Table I. In ��� , the first user’s transmission rate
of 0.00625 is very low, which is implemented by the rate-1/5 RA code and the
length-32 spreading.
Also in Fig. 2(a) and Table I, RO [5] (� ¼ 1:00, equal power) gives sum rate
R�sum ¼ 0:45, the gap of 2.48 dB, and the corresponding optimal profile. On the
other hand, PO [4] (� ¼ 1:10, equal rate) also gives these optimal values. Com-
pared with RO and PO, our RPO improves the maximum sum rate by 0.05 and
0.08, and decreases the gap by 0.50 and 0.39 dB, respectively at SNR = 2 dB. This
improvement is also available for other SNRs. We omit the discussion at the SNRs
due to limited space. The reason why RPO is superior to RO and PO is that RPO
employs multiple equal-ratio power μ, and choose the optimal ratio ��, which gives
the power profile well matched with the rate profile, and compensates the sum-rate
loss due to the restriction of discrete rates of RA code and spreading.
Table I. Optimal rate and power profiles (SNR = 2 dB)
Sch. ��� ¼ �ðq��1 ; l�
�1 ; p��
1 Þ; � � � ; ðq��K ; l�
�K ; p��
K � R��sum SNRth S. L. Gap
ð5; 32; 0:21Þ, ð5; 23; 0:29Þ, ð5; 17; 0:38Þ,RPO ð5; 13; 0:49Þ, ð5; 9; 0:65Þ, ð5; 7; 0:86Þ 0.50 2.00 0.02 1.98
ð4; 6; 1:13Þ, ð5; 3; 1:48Þ, ð5; 2; 1:95Þ, ð5; 1; 2:56Þð5; 7; 1:00Þ, ð4; 8; 1:00Þ, ð5; 6; 1:00Þ,
RO ð4; 7; 1:00Þ, ð5; 5; 1:00Þ, ð6; 4; 1:00Þ 0.45 1.91 −0.57 2.48
ð5; 4; 1:00Þ, ð6; 3; 1:00Þ, ð5; 3; 1:00Þ, ð7; 2; 1:00Þð4; 6; 1:48Þ, ð4; 6; 1:34Þ, ð4; 6; 1:22Þ,
PO ð4; 6; 1:11Þ, ð4; 6; 1:01Þ, ð4; 6; 0:92Þ 0.42 1.30 −1.07 2.37
ð4; 6; 0:84Þ, ð4; 6; 0:76Þ, ð4; 6; 0:69Þ, ð4; 6; 0:63Þ
© IEICE 2018DOI: 10.1587/comex.2017XBL0175Received November 14, 2017Accepted November 21, 2017Publicized December 6, 2017Copyedited February 1, 2018
51
IEICE Communications Express, Vol.7, No.2, 48–53
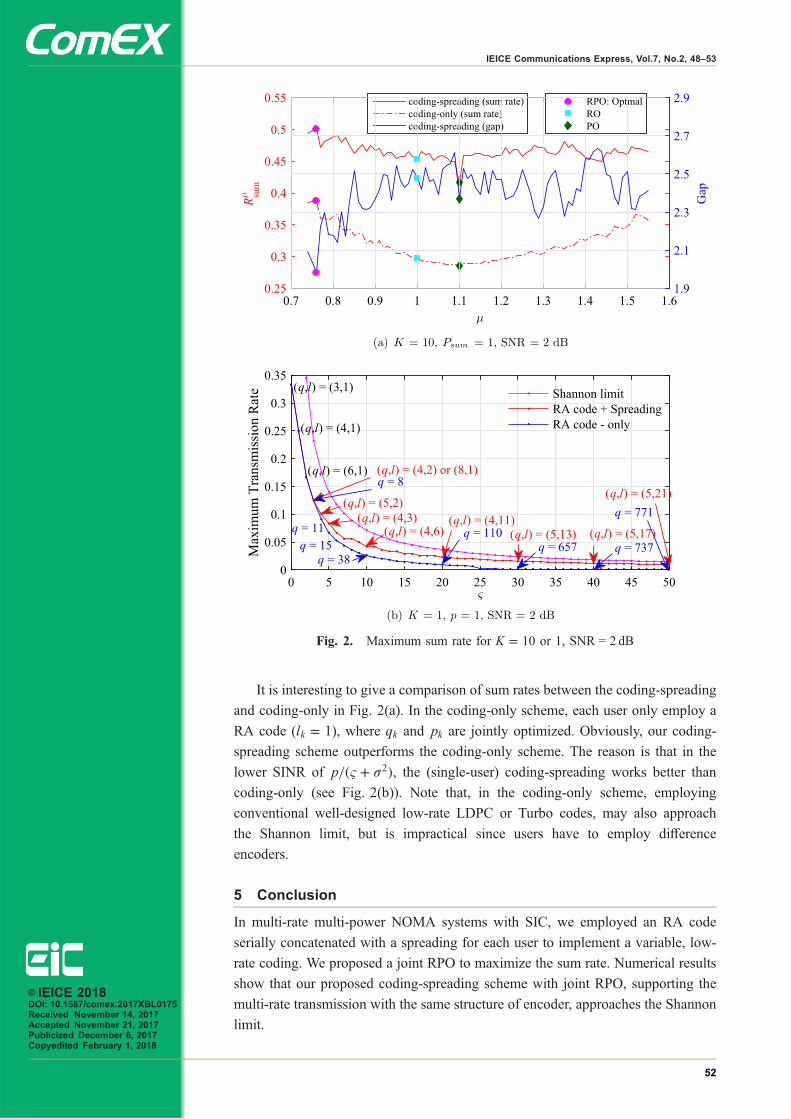
It is interesting to give a comparison of sum rates between the coding-spreading
and coding-only in Fig. 2(a). In the coding-only scheme, each user only employ a
RA code (lk ¼ 1), where qk and pk are jointly optimized. Obviously, our coding-
spreading scheme outperforms the coding-only scheme. The reason is that in the
lower SINR of p=ð& þ �2Þ, the (single-user) coding-spreading works better than
coding-only (see Fig. 2(b)). Note that, in the coding-only scheme, employing
conventional well-designed low-rate LDPC or Turbo codes, may also approach
the Shannon limit, but is impractical since users have to employ difference
encoders.
5 Conclusion
In multi-rate multi-power NOMA systems with SIC, we employed an RA code
serially concatenated with a spreading for each user to implement a variable, low-
rate coding. We proposed a joint RPO to maximize the sum rate. Numerical results
show that our proposed coding-spreading scheme with joint RPO, supporting the
multi-rate transmission with the same structure of encoder, approaches the Shannon
limit.
(a) K = 10, Psum = 1, SNR = 2 dB
(b) K = 1, p = 1, SNR = 2 dB
Fig. 2. Maximum sum rate for K ¼ 10 or 1, SNR = 2 dB
© IEICE 2018DOI: 10.1587/comex.2017XBL0175Received November 14, 2017Accepted November 21, 2017Publicized December 6, 2017Copyedited February 1, 2018
52
IEICE Communications Express, Vol.7, No.2, 48–53

Acknowledgments
This work was supported in part by the Japan Society for the Promotion of Science
through the Grant-in-Aid for Scientific Research (C) under Grant 16K06373, and in
part by the Ministry of Education, Culture, Sports, Science and Technology through
the Strategic Research Foundation at private Universities (2014–2018) under Grant
S1411030.
© IEICE 2018DOI: 10.1587/comex.2017XBL0175Received November 14, 2017Accepted November 21, 2017Publicized December 6, 2017Copyedited February 1, 2018
53
IEICE Communications Express, Vol.7, No.2, 48–53

Low computationalcomplexity spectrum sensingbased on cyclostationarity formultiple receive antennas
Daiki Cho1, Shusuke Narieda2a), and Kenta Umebayashi11 Dept. of Elect. and Electron. Eng., Tokyo University of Agriculture and Technology,
2–24–16 Nakacho, Koganei, Tokyo 184–8588, Japan2 Dept. of Elect. and Comput. Eng., National Institute of Technology, Akashi College,
679–3 Nishioka, Uozumicho, Akashi, Hyogo 674–8501, Japan
Abstract: Low computational complexity spectrum sensing based on cy-
clostationarity for multiple receive antennas is proposed. The proposed
technique does not calculate certain test statistics at all receive antennas,
as opposed to conventional techniques that perform calculations at all receive
antennas. Therefore, a low computational complexity can be achieved for
sensing. Numerical examples verify that the proposed technique can obtain
favorable sensing performance, even with the low computational complexity.
Keywords: cognitive radio network, cyclostationarity detection based
spectrum sensing, space diversity
Classification: Terrestrial Wireless Communication/Broadcasting Tech-
nologies
References
[1] S. Haykin, D. Thomson, and J. Reed, “Spectrum sensing for cognitive radio,”Proc. IEEE, vol. 97, no. 5, pp. 849–877, May 2009. DOI:10.1109/JPROC.2009.2015711
[2] M. Öner and F. Jondral, “Air interface recognition for a software radio systemexploiting cyclostationarity,” Proc. IEEE Personal Indoor, Mobile and RadioCommun. (IEEE PIMRC2004), pp. 1947–1951, Sept. 2004. DOI:10.1109/PIMRC.2004.1368338
[3] K. Muraoka, M. Ariyoshi, and T. Fujii, “A robust spectrum sensing methodbased on maximum cyclic autocorrelation selection for dynamic spectrumaccess,” IEICE Trans. Commun., vol. E92-B, no. 12, pp. 3635–3643, Dec.2009. DOI:10.1587/transcom.E92.B.3635
[4] D. Cho and S. Narieda, “Simple weighted diversity combining technique forcyclostationarity detection based spectrum sensing in cognitive radio networks,”IEICE Trans. Commun., vol. E99-B, no. 10, pp. 2212–2220, Oct. 2016.DOI:10.1587/transcom.2015EBP3524
[5] G. Huang and J. Tugnait, “On cyclostationarity based spectrum sensing underuncertain gaussian noise,” IEEE Trans. Signal Process., vol. 61, no. 8,pp. 2042–2054, Apr. 2013. DOI:10.1109/TSP.2013.2246158
[6] S. Narieda, “Computational complexity reduction for cyclostationarity detection
© IEICE 2018DOI: 10.1587/comex.2017XBL0167Received November 1, 2017Accepted November 24, 2017Publicized December 8, 2017Copyedited February 1, 2018
54
IEICE Communications Express, Vol.7, No.2, 54–59

based spectrum sensing in cognitive radio,” Proc. IEEE Int’l Symp. on Circuitsand Systems (IEEE ISCAS 2017), pp. 1–4, May 2017. DOI:10.1109/ISCAS.2017.8050564
[7] J. P. Alegre Pérez, S. C. Pueyo, and B. C. López, Automatic Gain Control:Techniques and Architectures for RF Receivers, 2011 ed., Analog Circuits andSignal Processing, Springer, New York, Aug. 2011.
1 Introduction
Cognitive radio is the core technology for the efficient use of wide-frequency
bands. In cognitive radio networks, secondary users (SUs) need to sense and
monitor the radio spectrum around themselves for detecting and sharing the
frequency bands that are not occupied by primary users (PUs). Because SUs must
not inhibit the PUs’ communication, spectrum sensing techniques for PUs’ pro-
tection are very important in realizing cognitive radio networks [1]. It is well
established in several spectrum sensing types that cyclostationarity-based spectrum
sensing [2, 3] is robust against interference, although its computational complexity
is not low. In order to improve performance, various techniques have been
proposed for cyclostationarity-based spectrum sensing using multiple receive
antennas (MRAs) [4, 5]. In conventional approaches to cyclostationarity-based
spectrum sensing with MRAs, the computational complexity is proportional to the
number of antennas, as statistics are computed at each antenna. This letter proposes
computationally efficient spectrum sensing by means of test statistics sharing
among MRAs.
2 Cyclostationarity based spectrum sensing
We consider that a PU transmits an orthogonal frequency division multiplexing
(OFDM) signal, which is composed of the useful symbol duration TFFT and cyclic
prefix (CP) duration TCP, as well as the OFDM symbol duration TOFDM ¼TFFT þ TCP, and the SU detects the PU signal by means of spectrum sensing.
Spectrum sensing of the OFDM signal is carried out in order to detect the signal
cyclostationarity. This is a binary hypothesis testing problem, as follows:
H0 : riðnÞ ¼ viðnÞH1 : riðnÞ ¼ hisðnÞ þ viðnÞ
; i ¼ 1; . . . ; NR; ð1Þ
where riðnÞ, viðnÞ, hi, sðnÞ, and NR are the received signal, additive white Gaussian
noise (AWGN) following CNð0; �2vi), channel gain at the ith receive antenna, PU
signal, and number of receive antennas, respectively. Moreover, the hypotheses H0
andH1 indicate that the PU is inactive and active, respectively. In cyclostationarity-
based spectrum sensing, a cyclic autocorrelation function (CAF) is employed. Let
R̂�;N
riðn; �Þ denote an N sample-computed approximated CAF for riðnÞ, lag parameter
τ, and cyclic frequency α. Then, it can be written as
R̂�;N
riðm; �Þ ¼ 1
N
XmþN�1n¼m
riðnÞr�i ðn þ �Þe�j2��n�t; i ¼ 1; . . . ; NR; ð2Þ© IEICE 2018DOI: 10.1587/comex.2017XBL0167Received November 1, 2017Accepted November 24, 2017Publicized December 8, 2017Copyedited February 1, 2018
55
IEICE Communications Express, Vol.7, No.2, 54–59

where �t is the sampling period. The OFDM signal exhibits a cyclostationarity
because of its own CP [2]. Let �k ¼ k=TOFDM (k 2 Z) and �k ¼ ðk þ 0:5Þ=TOFDM,and the CAF of the OFDM signal has peaks at �k and � ¼ NFFT :¼ TFFT=�t;
moreover, the CAF of the OFDM signal has no peaks at �k [2]. Maximum cyclic
autocorrelation selection (MCAS) [3] originally has low computational complexity,
because the CAF must be computed at only a limited number of cyclic frequencies.
In MCAS, the CAF values at certain cyclic frequencies, namely �1 (peak) and �k
(k ¼ 0; 1; . . . ; ND � 1) (non-peak), are compared in order to detect the PU signal,
where ND is the number of non-peak CAFs to be used for sensing. In the single
antenna case, MCAS carries out signal detection using peak and non-peak CAFs, as
follows:
jR̂�1;N
r1ðm;NFFTÞj ≷
H0
H1
maxk
ffiffiffiffiffiffiN 0
N
rR̂�k;N
0
r1ðm þ kN 0; NFFTÞ
�����
�����; k ¼ 0; 1; . . . ; ND � 1; ð3Þ
where N 0 is the number of samples for R̂�k;N
0
r1ðm þ kN 0; NFFTÞ computation. Fur-
thermore, N 0 is any integer satisfying N 0ND � N; however, the MCAS signal
detection performance is degraded when N 0 is extremely small [6]. It should be
noted that R̂�1;N
r1ðm;NFFTÞ and
ffiffiffiffiffiffiffiffiffiffiffiN 0=N
pR̂�k;N
0
r1ðm; kN 0; NFFTÞ follow CNð0; �4
v1=NÞ in
H0 [3]. Because both of the probability density functions agree, MCAS can control
the false alarm probability as PFA ¼ 1=ðND þ 1Þ.
3 Test statistics sharing among multiple antennas based on MCAS
As noted above, the non-peak CAFffiffiffiffiffiffiffiffiffiffiffiN 0=N
pR̂�k;N
0
riðm þ kN 0; NFFTÞ � CNð0; �4
vi=NÞ
in H0; furthermore, the non-peakffiffiffiffiffiffiffiffiffiffiffiN 0=N
pR̂�k;N
0
riðm þ kN 0; NFFTÞ is a zero mean
complex Gaussian in H1. Therefore, it can be stated that the non-peak CAFffiffiffiffiffiffiffiffiffiffiffiN 0=N
pR̂�k;N
0
riðm þ kN 0; NFFTÞ can only take a random variable in, whether H0 or
H1. These facts indicate that a comparison of the peak CAF and non-peak CAFs
corresponds to a comparison of the peak CAF and certain random variables where
the statistical property is known in MCAS. Based on the above consideration, the
proposed technique computes ND number of CAFs at �k from among the NR � ND
that are computable, as illustrated in Fig. 1(a), and the decision variables at �1 and
�k are defined as
Z�1 ¼1
NR
XNR
i¼1R̂�1;N
riðm;NFFTÞ
�����
�����; ð4Þ
Z�k ¼ jR̂�k;N0
riðm þ kN 0; NFFTÞj; i ¼ 1; . . . ; NR; k ¼ 0; 1; . . . ; ND � 1: ð5Þ
Again, ND of NR � ND Z�ks are used for signal detection. The subscripts ði; kÞ,which are in Z�k , for the receive antenna and �k cyclic frequencies, are chosen
without deviation for the receive antenna, e.g., ð1; 1Þ; . . . ; ðNR; NRÞ; ð1; NR þ1Þ; . . . ; ðNR; 2NRÞ; ð1; 2NR þ 1Þ; . . . in the NR < ND case. The decision criterion
of the proposed technique is expressed by
Z�1 ≷H0
H1
maxk
ffiffiffiffiffiffiffiffiffiffiN 0
NNR
rZ�k ; k ¼ 0; 1; . . . ; ND � 1: ð6Þ
© IEICE 2018DOI: 10.1587/comex.2017XBL0167Received November 1, 2017Accepted November 24, 2017Publicized December 8, 2017Copyedited February 1, 2018
56
IEICE Communications Express, Vol.7, No.2, 54–59

4 Computational complexity
The computational complexity required for the complex operation multiplication in
the proposed technique is compared with that of the conventional techniques [4, 5].
We let MProposed, MCho, and MHuang denote the computational complexity of the
proposed and conventional techniques [4, 5], respectively. These can be written as
MProposed ¼ 8NNR þ 4N 0ND þ 2ðND þ 1Þ; ð7ÞMCho ¼ 2NRf4N þ 2NDðN 0 þ 1Þ þ 1g; ð8Þ
MHuang ¼ 8NN2R þ 2NRðN þ 2Þ: ð9Þ
Fig. 2 illustratesMProposed,MCho, andMHuang for different numbers of NR. We
set NR ¼ 2{8, N ¼ 2560, N 0 ¼ 134, and ND ¼ 9. It can be seen that the computa-
tional complexity of the proposed technique is lower than that of [4, 5]; therefore,
computational complexity can be reduced by the CAFs at �k sharing. Furthermore,
it can be seen that the difference in the computational complexity increases as NR
increases.
5 Numerical examples
For evaluation of the proposed technique, we set TFFT ¼ 64�t, TCP ¼ 16�t, N ¼2560, N 0 ¼ 134, ND ¼ 9, and a Rayleigh flat fading channel model is employed.
Moreover, the proposed technique is also evaluated in the case of an automatic gain
control (AGC). The proposed technique must compute only ND number of non-
peak CAFs, under the assumption that the noise variances at all RF chains are the
same. However, the AGC causes the AWGN variance itself with OFDM signals to
change, and this results in the difference in noise variances at each RF chain,
because the received signal amplitude at each receive antenna determines the AGC
gain level at each receive antenna [7]. As a result, the variances of the non-peak
CAFs may be also varied. Therefore, it is conceivable that non-peak CAF sharing
(b) conventional techniques(a) proposed sharing technique
Fig. 1. Overview of CAF computation in proposed and conventionaltechniques.
© IEICE 2018DOI: 10.1587/comex.2017XBL0167Received November 1, 2017Accepted November 24, 2017Publicized December 8, 2017Copyedited February 1, 2018
57
IEICE Communications Express, Vol.7, No.2, 54–59

affects signal detection performance. Thus, we evaluate the two cases: 1) without
AGC and 2) with AGC in this section. In order to simulate the AGC behavior, each
received signal is normalized by its maximum value for N samples, and each signal
is multiplied by a constant gain factor G. We assume that the RF received signal
power is approximately −80 dBm, the characteristic impedance of the RF chains,
baseband circuits, and so on is 50Ω, and that the maximum amplitude of the
baseband signal after passing through the AGC is 3V. From these, we employ
G ¼ 105.
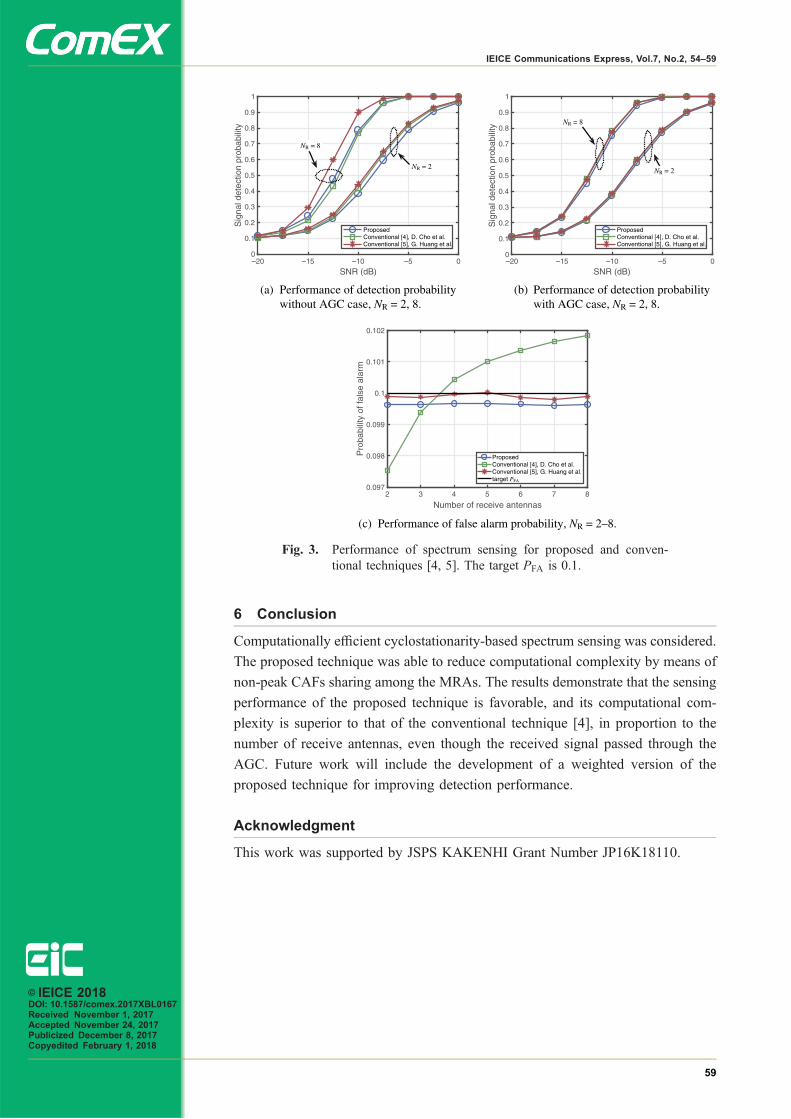
Firstly, Fig. 3(a) illustrates the detection performance of the proposed and
conventional techniques [4, 5] in the without AGC case. The performance of the
proposed technique is slightly degraded in comparison with that of the conventional
techniques, even though its computational complexity is lower (former: 84 and
70%; latter: 56 and 13% for NR ¼ 2 and 8). Next, Fig. 3(b) illustrates the detection
performance of the proposed technique in the with AGC case. It can be seen that the
performance degradation caused by the AGC is negligible. Moreover, it can be
observed that the proposed technique can obtain almost the same performance as
the conventional techniques [4, 5]. Finally, Fig. 3(c) illustrates the PFA perform-
ances of the proposed and conventional techniques. The proposed technique
achieves the target PFA with an error of less than 1%.
Fig. 2. Computational complexity of the proposed to conventionaltechniques [4, 5]. NR ¼ 2{8, N ¼ 2560, N 0 ¼ 134, and ND ¼ 9.
© IEICE 2018DOI: 10.1587/comex.2017XBL0167Received November 1, 2017Accepted November 24, 2017Publicized December 8, 2017Copyedited February 1, 2018
58
IEICE Communications Express, Vol.7, No.2, 54–59
6 Conclusion
Computationally efficient cyclostationarity-based spectrum sensing was considered.
The proposed technique was able to reduce computational complexity by means of
non-peak CAFs sharing among the MRAs. The results demonstrate that the sensing
performance of the proposed technique is favorable, and its computational com-
plexity is superior to that of the conventional technique [4], in proportion to the
number of receive antennas, even though the received signal passed through the
AGC. Future work will include the development of a weighted version of the
proposed technique for improving detection performance.
Acknowledgment
This work was supported by JSPS KAKENHI Grant Number JP16K18110.
(a) Performance of detection probability without AGC case, NR = 2, 8.
(c) Performance of false alarm probability, NR = 2–8.
(b) Performance of detection probability with AGC case, NR = 2, 8.
Fig. 3. Performance of spectrum sensing for proposed and conven-tional techniques [4, 5]. The target PFA is 0.1.
© IEICE 2018DOI: 10.1587/comex.2017XBL0167Received November 1, 2017Accepted November 24, 2017Publicized December 8, 2017Copyedited February 1, 2018
59
IEICE Communications Express, Vol.7, No.2, 54–59