Embed Size (px)
Citation preview

IEEE TRANSACTIONS ON NUCLEAR SCIENCE, VOL. 52, NO. 3, JUNE 2005 599
Investigation of the “Block Effect” on SpatialResolution in PET Detectors
Nada Tomic, Student Member, IEEE, Christopher J. Thompson, Member, IEEE, and Michael E. Casey, Member, IEEE
Abstract—Previous studies suggest that when block detectors areused in positron emission tomography (PET) scanners, a “block ef-fect” of about 2 mm should be added in quadrature to the other ef-fects blurring spatial resolution (SR). However, no explanation ofthe cause of the effect has ever been published. If the effect couldbe identified, isolated, and reduced then the SR of PET scannersshould improve. We studied the origin of the “block effect,” usingexperiments in which all other blurring effects on SR were min-imized and precisely determined. Thin, 1 mm wide bismuth ger-manate (BGO) crystals and a small (1 mm) 68Ge source were usedto probe the SR of a HR+ block detector. Two precise transla-tion stages were used to move detectors. We compared coincidenceaperture functions (CAFs) for crystals in the block with CAFs ofsingle crystals of various widths. From those measurements, donewith one block detector, we concluded that the central crystals inthe block showed an additional blurring of 0.8 mm whereas theedge ones showed no additional blurring. When the detectors wereseparated by 21 cm, the full width at half maximum (FWHM) forcentral crystals was found to be 2 20 0 04mm and for edge crys-tals 1 98 0 04 mm. The FWHM for 4.4 mm width crystals (asused in the HR + block) was estimated to be 2 1 0 2 mm. Re-sults from the crystal identification matrix show that the apparentcentroids of the crystals are not located at the geometric centers,which would give errors in the reconstruction algorithm assumeduniform sampling. Our results suggest that the additional blurringpreviously reported in PET scanners with block detectors is not en-tirely due to the use of block detectors.
Index Terms—BGO, block detectors, positron emission tomog-raphy (PET), spatial resolution.
I. INTRODUCTION
ONE of the major limitations of positron emission tomog-raphy (PET) is its spatial resolution (SR). SR in PET
depends on positron range, noncolinearity of the annihilationgamma rays, and the width of the detector’s crystals. However,when block detectors are used an additional blurring term re-ferred to as the “block effect” has been proposed to account fortheir poorer SR [1], [2].
In order to reduce the scanner’s cost, most modern PET scan-ners use block detectors in which up to 64 crystal elements arecoupled to four photo-multiplier tubes (PMTs). Block detec-tors use light sharing schemes to identify the crystal that de-
Manuscript received February 25, 2003. This work was supported by theNatural Science and Engineering Research Council of Canada (NSERC) underGrant 0GP0036672.
N. Tomic is with Department of Radiation Oncology, Jewish GeneralHospital, McGill University, Montreal, QC H3T 1E2, Canada (e-mail: [email protected]).
C. J. Thompson is with the Montreal Neurological Institute and the Med-ical Physics Department, McGill University, Montreal, QC, Canada (e-mail:[email protected]).
M. E. Casey is with the CTI PET Systems, Inc., Knoxville, TN 37932 USA(e-mail [email protected]).
Digital Object Identifier 10.1109/TNS.2005.851433
tected annihilation photon. They are much cheaper than detec-tors with 1:1 coupling between crystals and PMTs. However,there is an uncertainty in the determination of the location ofthe event within a block detector, due to the presence of mul-tiple crystal elements. In such detectors there appears to be anadditional degradation of SR in PET images caused by the use ofcrystal array. This additional blurring of SR also appears in de-tectors using many crystals with 1:1 coupling between crystalsand photodetectors. Previously, the block effect was reported[1], [2], and SR data were compiled from published reports de-scribing the performance of many PET scanners [2], [3], [17].Those data suggested that the SR is better in scanners with 1:1coupling between crystals and PMTs than in those with blockdetectors. The block effect was reported to be 2.3 mm with theuse of light sharing and 1.2 mm without [3], [17]. The funda-mental cause of the effect has never been investigated.
There are several possible causes of the “block effect”: mul-tiple interactions of the gamma ray within the crystal array, lighttransport in the scintillation crystal as a function of interactiondepth, additional electronic noise due to the use of at least fourlight sensors, under-sampling of the image with stationary de-tectors, errors in the crystal identification matrix, and errors dueto the effective crystal location being different from its physicallocation.
One of the possible causes of the additional blurring of SR inblock detectors is the existence of multiple interactions of gammaray within the block This implies that the most of the scintillationlight will not originate from the point where the gamma ray firstinteracts with the detector. In all scintillators, currently used inPET scanners, most 511 keV gamma rays undergo Comptonscattering in the crystal before being photo-electrically absorbed.Previously, the meansquare distance between the point of the firstinteraction and the centroid of all the interactions in the crystalwas simulated using the Monte Carlo technique. This blurringcomponent was found to be 0.73 mm in bismuth germanate(BGO) detector 30 mm deep and 50 mm wide (as in the ECATExact HR , CTI PET Systems Inc., Knoxville, TN) [4]. This issignificantly less than the 2.3 mm reported in actual scanners. Inthis paper, we report an experimental study of the block detector.
II. MATERIALS AND METHODS
A. Spatial Resolution of PET Scanners
An empirical formula has been proposed [1], [2] in orderto combine the various factors affecting the spatial resolution,which has been written as
(1)
0018-9499/$20.00 © 2005 IEEE
600 IEEE TRANSACTIONS ON NUCLEAR SCIENCE, VOL. 52, NO. 3, JUNE 2005
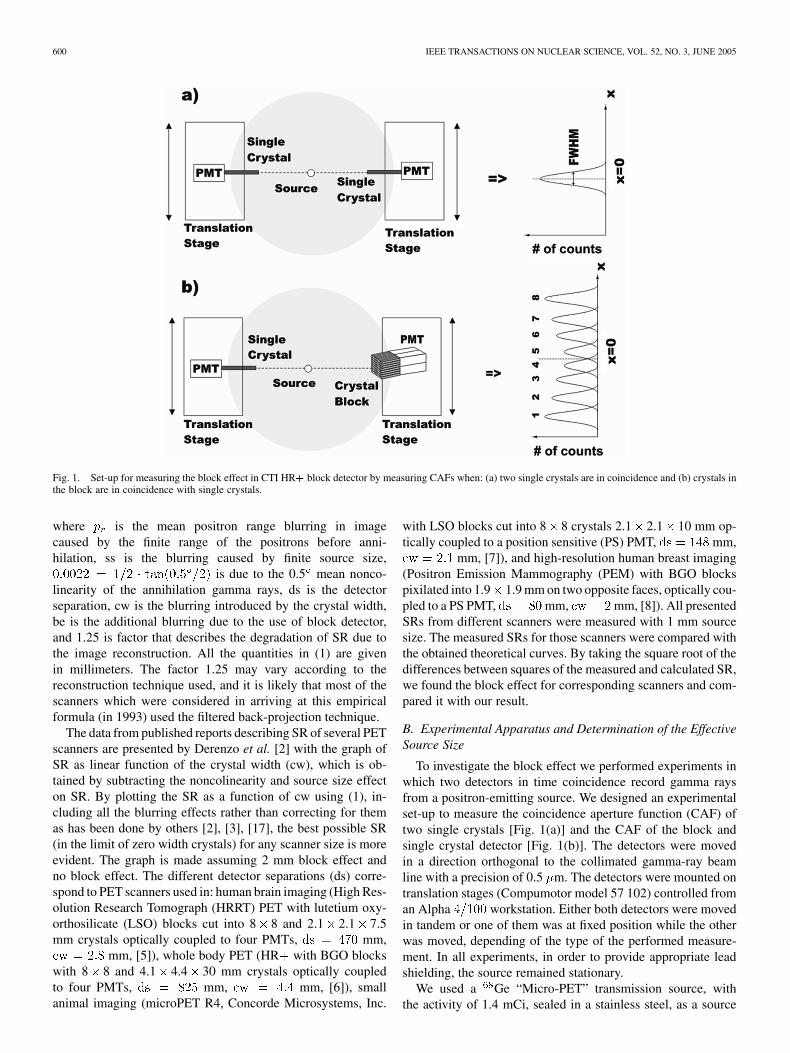
Fig. 1. Set-up for measuring the block effect in CTI HR+ block detector by measuring CAFs when: (a) two single crystals are in coincidence and (b) crystals inthe block are in coincidence with single crystals.
where is the mean positron range blurring in imagecaused by the finite range of the positrons before anni-hilation, ss is the blurring caused by finite source size,
is due to the 0.5 mean nonco-linearity of the annihilation gamma rays, ds is the detectorseparation, cw is the blurring introduced by the crystal width,be is the additional blurring due to the use of block detector,and 1.25 is factor that describes the degradation of SR due tothe image reconstruction. All the quantities in (1) are givenin millimeters. The factor 1.25 may vary according to thereconstruction technique used, and it is likely that most of thescanners which were considered in arriving at this empiricalformula (in 1993) used the filtered back-projection technique.
The data from published reports describing SR of several PETscanners are presented by Derenzo et al. [2] with the graph ofSR as linear function of the crystal width (cw), which is ob-tained by subtracting the noncolinearity and source size effecton SR. By plotting the SR as a function of cw using (1), in-cluding all the blurring effects rather than correcting for themas has been done by others [2], [3], [17], the best possible SR(in the limit of zero width crystals) for any scanner size is moreevident. The graph is made assuming 2 mm block effect andno block effect. The different detector separations (ds) corre-spond to PET scanners used in: human brain imaging (High Res-olution Research Tomograph (HRRT) PET with lutetium oxy-orthosilicate (LSO) blocks cut into 8 8 and 2.1 2.1 7.5mm crystals optically coupled to four PMTs, mm,
mm, [5]), whole body PET (HR with BGO blockswith 8 8 and 4.1 4.4 30 mm crystals optically coupledto four PMTs, mm, mm, [6]), smallanimal imaging (microPET R4, Concorde Microsystems, Inc.
with LSO blocks cut into 8 8 crystals 2.1 2.1 10 mm op-tically coupled to a position sensitive (PS) PMT, mm,
mm, [7]), and high-resolution human breast imaging(Positron Emission Mammography (PEM) with BGO blockspixilated into 1.9 1.9 mm on two opposite faces, optically cou-pled to a PS PMT, mm, mm, [8]). All presentedSRs from different scanners were measured with 1 mm sourcesize. The measured SRs for those scanners were compared withthe obtained theoretical curves. By taking the square root of thedifferences between squares of the measured and calculated SR,we found the block effect for corresponding scanners and com-pared it with our result.
B. Experimental Apparatus and Determination of the EffectiveSource Size
To investigate the block effect we performed experiments inwhich two detectors in time coincidence record gamma raysfrom a positron-emitting source. We designed an experimentalset-up to measure the coincidence aperture function (CAF) oftwo single crystals [Fig. 1(a)] and the CAF of the block andsingle crystal detector [Fig. 1(b)]. The detectors were movedin a direction orthogonal to the collimated gamma-ray beamline with a precision of 0.5 m. The detectors were mounted ontranslation stages (Compumotor model 57 102) controlled froman Alpha workstation. Either both detectors were movedin tandem or one of them was at fixed position while the otherwas moved, depending of the type of the performed measure-ment. In all experiments, in order to provide appropriate leadshielding, the source remained stationary.
We used a Ge “Micro-PET” transmission source, withthe activity of 1.4 mCi, sealed in a stainless steel, as a source
TOMIC et al.: THE “BLOCK EFFECT” ON SPATIAL RESOLUTION IN PET DETECTORS 601
Fig. 2. X-ray image of the CTI HR+ block detector used in these studies.
of 511 keV annihilation photons, which was purchased fromSanders Medical Products Inc. Two thin, 1 mm 30 mm20 mm BGO crystals were purchased from Alpha Spectra Inc.The single crystals, PMTs and charge-integrating amplifiers areenclosed in light-tight aluminum boxes.
The block detector investigated in this work is of the typeused in HR scanner, and it was provided by CTI. A set of fourcharge-integrating amplifiers and a high-voltage decouplingnetwork was assembled in a small plastic box. This box and theblock detector were attached together to the translation stage.The signals from the four PMTs on the HR detector are sentto the summing amplifier. The sum of these signals and theenergy signal from the single PMT are acquired with a JorwayAurora-12 bit analog to digital converter (ADC) CAMACmodule and saved in a list file. The ADC is strobed each time acoincidence between the two detectors is identified.
In order to locate the crystals within the block, the HR de-tector was X-rayed at 81 kV, 32 mAs at a distance of 200 cmto visualize the BGO crystal and saw cuts. To show the metalhousing of the module and the PMTs we made a second ra-diograph using 50 kV, 10 mAs, and source to film distance of110 cm. A composite picture was made and glued to the detectorto assist in the alignment during the experiments. CompositeX-ray radiograph of the HR detector is shown in Fig. 2. Thesaw cuts are clearly visible and the crystal widths are 4.4 mmfor central crystals and 4.2 mm for the edge crystals.
Acquisition software allows the detectors to be pre-positionedand then to move either one or both detectors to the next pointwithout operator intervention. It also allows the spectrum, rawevents (in list mode) and images to be saved. During the study,for each source position, an image is created by incrementing alocation determined by Anger logic in a 256 256 matrix foreach event within a preset energy window. A summed image isalso created. The appearance of the summed image is similar tothat acquired by block detector exposed to a point source.
The display software has several windows in which theimages are analyzed. The main window shows up to 64 images,which are minified to 64 64 matrices. Any image can bezoomed to its full size, and profiles drawn through the crystalterritory matrix. Another window allows for placement of upto eight regions of interest (ROI). The count rate in these ROIscan be displayed as a function of the detector positions duringthe experiment. These graphs correspond to the intercrystalaperture functions. They can be fitted to the sum of threeGaussian functions and the centroid, full width at half max-imum (FWHM) and full width at tenth maximum (FWTM) areprinted.
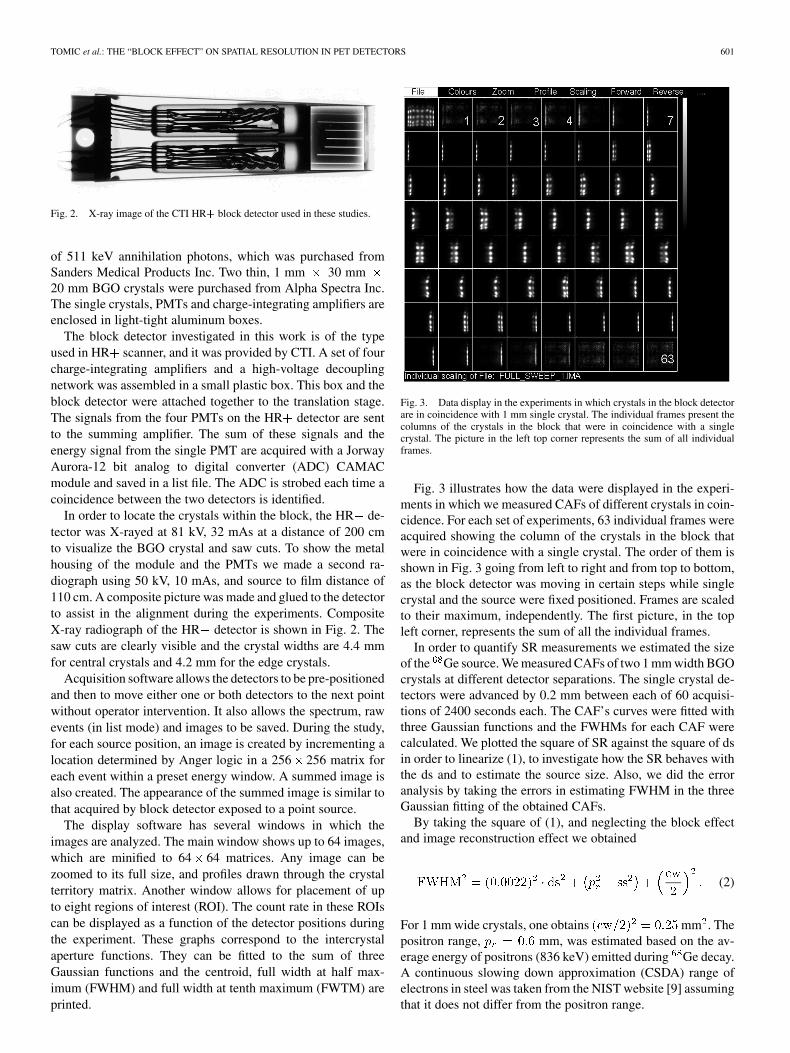
Fig. 3. Data display in the experiments in which crystals in the block detectorare in coincidence with 1 mm single crystal. The individual frames present thecolumns of the crystals in the block that were in coincidence with a singlecrystal. The picture in the left top corner represents the sum of all individualframes.
Fig. 3 illustrates how the data were displayed in the experi-ments in which we measured CAFs of different crystals in coin-cidence. For each set of experiments, 63 individual frames wereacquired showing the column of the crystals in the block thatwere in coincidence with a single crystal. The order of them isshown in Fig. 3 going from left to right and from top to bottom,as the block detector was moving in certain steps while singlecrystal and the source were fixed positioned. Frames are scaledto their maximum, independently. The first picture, in the topleft corner, represents the sum of all the individual frames.
In order to quantify SR measurements we estimated the sizeof the Ge source. We measured CAFs of two 1 mm width BGOcrystals at different detector separations. The single crystal de-tectors were advanced by 0.2 mm between each of 60 acquisi-tions of 2400 seconds each. The CAF’s curves were fitted withthree Gaussian functions and the FWHMs for each CAF werecalculated. We plotted the square of SR against the square of dsin order to linearize (1), to investigate how the SR behaves withthe ds and to estimate the source size. Also, we did the erroranalysis by taking the errors in estimating FWHM in the threeGaussian fitting of the obtained CAFs.
By taking the square of (1), and neglecting the block effectand image reconstruction effect we obtained
(2)
For 1 mm wide crystals, one obtains mm . Thepositron range, mm, was estimated based on the av-erage energy of positrons (836 keV) emitted during Ge decay.A continuous slowing down approximation (CSDA) range ofelectrons in steel was taken from the NIST website [9] assumingthat it does not differ from the positron range.

602 IEEE TRANSACTIONS ON NUCLEAR SCIENCE, VOL. 52, NO. 3, JUNE 2005
C. Measurements of CAF of Various Crystals
In order to measure the block effect in the HR block de-tector we used the same experimental set-up as in Section II-B.On one translation stage, we kept 1 mm wide single crystal. Onthe other one, we mounted single crystal detectors with variouscrystal widths. To investigate how the FWHMs of correspondingCAFs behave with changing the cw of the crystals in coinci-dence, we performed three sets of measurements. The 1.0 mmwide single crystal on the first translation stage was set in coin-cidence with single crystals 1.0 mm, 3.4 mm, and 7 mm widepositioned on the second translation stage. The detector separa-tion was 21 cm. We collected the counts at 60 different crystalpositions in steps of 0.2 mm with acquisition time of 60 sec-onds. The square of FWHM of the measured CAFs was plottedagainst the square of the crystal widths. We did the error analysisby taking the errors in estimating FWHM in the three Gaussianfitting of the obtained CAFs. Also, we estimated from the linearfit the value of FWHM for mm as it is in an HRdetector. The error of the FWHM was obtained from the linearfit calculating standard deviation.
We repeated the study with block detector crystals. This ex-periment was performed for 36 central crystals (whose cw is4.4 mm), and 12 edge crystals within the block detector (whosecw is 4.2 mm) set in coincidence with the single crystal. The sep-aration between single crystal and the block detector was 21 cm.We collected the counts at 60 different crystal positions in stepsof 0.2 mm with an acquisition time of 240 seconds. We mea-sured CAFs for crystals in the block and obtained CAF valuedistribution among different crystals in the block. We presentedFWHM values for crystals in six rows of the block. The first andthe last row are missing because of the limitations of the exper-imental set-up.
The mean values of squares of FWHMs of the measuredCAFs for one block detector in coincidence with single crystalswere calculated for each column and mean values for centraland for edge crystals were determined. We did the error analysiscalculating standard deviations for the obtained mean values.In order to estimate the FWHMs of crystals when two blockdetectors are in coincidence the obtained mean values weremultiplied by .
D. Measurements of Intercrystal Distance in the Block
Previous studies reported that the centroids of interactionsin the crystal do not correspond to the geometrical centers ofthe crystals [10]. In order to determine the separation betweenthe crystals in the HR block detector and to assign territoryin the crystal identification matrix to appropriate crystals, weperformed the following experiment. The crystals in the blockwere in coincidence with a 1 mm thick crystal. The block de-tector moved in steps of 0.75 mm while the source and the singlecrystal detector were at fixed position. We collected data for2000 seconds. For each set of experiments, 63 frames were ac-quired. A ROI was placed over each crystal’s representation inone row of the obtained crystal identification matrix and countsper minute per pixel (CPM/pixel) were determined for eachcrystal in each of the 63 frames. In such a way, we obtainedeight curves for each crystal in one row. Then, the separationsbetween the peaks of the obtained curves (of the neighboring
crystals) were determined. The ROI was also placed over theterritory between two crystals and the counts from these regionswere plotted as a function of detector position.
In a given direction along the crystal block, there is a proba-bility that the photon is detected in a crystal or in a crystal
, even if its first interaction was in crystal . To estimate thefraction of mispositioned events in the crystals, we took a profilealong the central row crystals in the crystal identification ma-trix. The profile was fitted with a multi-Gaussian model, having25 fitting parameters: eight peaks times three Gaussian func-tion parameters (position, width, and amplitude) and a baselinelevel. First iterations were performed with the Gaussian func-tions positions and widths fixed, while the amplitudes varied.In the second set of iterations, the widths varied and finally inthe last set of iterations, the positions and the baseline varied,altogether with all the other parameters. From eight Gaussianfunctions, we calculated the fraction of mispositioned events ina given crystal in the block detector using
(3)
where is the area of the given crystal , and are theoverlapping areas with the neighboring crystals and .
III. RESULTS
A. Spatial Resolution of PET Scanners
Fig. 4 represents the SR as a function of cw for differentseparations between detectors in coincidence that correspond tocommercially available PET scanners: HRRT, HR+, microPET,and PEM, using (1) and assuming positron range of 0.6 mm and1 mm source size. The solid lines represent a set of curves ob-tained by assuming no block effect and dashed lines assume theblock effect of 2 mm.
For HR scanner, the measured SR is very close to the the-oretical curve assuming block effect of 2 mm. For microPETR4, HRRT, and PEM system the measured points are below pre-dicted curves, which assume a 2 mm block effect but above thecurves that assumes no block effect. Using Fig. 4, we calcu-lated block effects for those scanners by taking the square rootof the differences between squares of measured and calculatedFWHMs. The results show that the block effect for the scan-ners is: 1.7 mm (HR ), 1.1 mm (HRRT), 1.2 mm (PEM), and0.8 mm (microPET).
B. Determination of the Effective Source Size
In Fig. 5, the square of the SR against the square of the ds isplotted, as well as the error bars coming from the estimation ofthe FWHM in three Gaussian fitting of the obtained CAFs. TheFWHM points were fitted using linear fit , where
corresponds to corresponds to , parametercorresponds to the slope of the line, and is the intercept fords equal to zero. In Fig. 5, the value of the slope is in a goodagreement with the predicted value of , as given in(2), i.e. which gives . Thisconfirms 0.5 noncolinearity of the annihilation gamma rays.The intercept with axis for the gives
(4)

TOMIC et al.: THE “BLOCK EFFECT” ON SPATIAL RESOLUTION IN PET DETECTORS 603
Fig. 4. SR in PET as a function of cw with and without a 2 mm block effect, as obtained from (1). The symbols show the measured SRs for different PET scannersfrom published reports.
Fig. 5. Variation of the FWHM of CAF of single crystals with detectorseparation. The error bars represent the errors in calculating the FWHMs usingthree Gaussian fitting of the obtained CAFs.
The cw in our study is 1 mm, mm , and theestimated positron range for Ge in steel is about 0.6 mm. Thelinear fit intersects the y-axis for a zero detector separation at aneffective source size (the sum of the physical size of the sourceand the positron range) to be 1.164 mm. We estimated the sourcesize (ss) from the following expression:
(5)
This gave us the value of 0.99 mm for the source size. This isslightly underestimated because we used CSDA positron rangeinstead of FWHM of the projected path lengths distributionfunction, which would give us a positron range effect smallerthan 0.6 mm.
C. Determination of the CAF of Various Crystals
In Fig. 6, the square of FWHM of the measured CAFs for twosingle crystals in coincidence is plotted against the square of thevarious crystal widths, which is presented with circle symbols.The square of the FWHM varies linearly with the square of thecw, in accordance with (1).
Fig. 6. Variation of the FWHM of CAF of two single crystals ( ) with crystalwidth. The error bars represent the errors in calculating the FWHMs using threeGaussian fitting of the CAFs. Variation of the FWHM of CAF of single crystalwith crystals in the block detector ( ; ). The error bars represent standarddeviations for central and for edge crystals.
We also measured CAFs for crystals in the block and we ob-tained CAF value distribution among different crystals in theblock. In Table I, we presented the corresponding FWHMs forcrystals in six rows of the block, as well as mean values andstandard deviations for each column.
In Fig. 6, we presented the square of the mean FWHM ofthe measured CAFs for crystals in the block in coincidencewith 1 mm wide single crystal. The results show the meanvalues: for central crystals mm and
for edge crystals mm. The resultfor the edge crystals (presented in Fig. 6 with down triangle)coincides with the single crystals fit line whereas the resultfor central ones (presented in Fig. 6 with up triangle) is abovethe line. From the linear fit shown in Fig. 6, we obtained:FWHM (for 4.4 mm width crystals, as used in the HRblock) mm.

604 IEEE TRANSACTIONS ON NUCLEAR SCIENCE, VOL. 52, NO. 3, JUNE 2005
TABLE IMEASURED CAF VALUE. DISTRIBUTION AMONG DIFFERENT CRYSTALS INSIDE
THE BLOCK, SHOWING FWHMs (MM) FOR DIFFERENT CRYSTALS IN THE
DETECTOR IN SIX ROWS OF THE BLOCK
The edge crystals appear to have similar FWHM as singlecrystal of the same width. The blurring for central crystals isslightly greater than for single crystals of the same width. FromFig. 6 the discrepancy between squares of measured FWHMsfor central crystals and the fitted curve was determined to be0.63 mm . This difference is attributed to the block effect forcentral crystals in the block having a value of mmwhen one block detector is in coincidence with a single crystal.For two block detectors in coincidence we estimated block ef-fect to be mm.
D. Measurements of Intercrystal Distance in the Block
Results obtained from the determination of the intercrystalseparation in the CTI block detector module are illustrated inFigs. 7 and 8.
In Fig. 7, ROIs were placed over each crystal’s representationin a third row, and the CPM/pixel are plotted as a function ofdistance. The results show that the mean separation of the peaksbetween central crystals in the block is mm, while onthe periphery it is mm. The edge crystals appear tobe closer to each other than the central ones. From these results,it appears that crystals in the block do not appear to be uniformlyspaced, which confirms the results from the investigation blockdetector using Anger logic [11].
In Fig. 8, small adjacent regions were placed over the territoryspanned by two crystals and the counts from these regions wereplotted as a function of distance. Except for two (the lowest in-tensity) peaks, the peaks are symmetric and their centroids are inidentical positions. This suggests that only in a very narrow re-gion approximately midway between the peaks of each crystal’sterritory, there is a possibility of assigning an event to the wrongcrystal. The fraction of mispositioned events in the crystal wascalculated using (3) to be 2% for edge crystals up to 4% for cen-tral ones, showing that crystals in the block are well separatedand that mispositioning of the events in the crystals in the blockis small.
IV. DISCUSSION AND CONCLUSION
The various experiments done during this study examined theblock effect in the HR block detector. The results from ourexperiment, specifically made to measure the block effect, withall the other factors affecting the SR minimized and preciselydetermined show that there is additional blurring of 0.8 mm for
Fig. 7. CPM/pixel as a function of distance for the regions around visiblecrystals in the image.
Fig. 8. CPM/pixel as a function of distance for the territories between twocrystals in the image.
central and no additional blurring for the edge crystals when oneblock detector is in coincidence with a single crystal. For twoblock detectors in coincidence we estimated the block effect tobe 1.1 mm. This result suggests that some other effects, apartfrom block effect alone, could be the reasons of poorer SR inthe PET scanners compared by others.
The Sherbrooke APD scanner [12] is reported to have imageSR of 2.1 mm or 2.4 mm, the Donner 600 (Berkeley) scanner[13] 2.6 or 2.9 mm and Tomitani scanner [14] 2.8 mm or3.5 mm, depending whether the clamshell motion is used ornot. The clamshell or wobble motion increases the spatialsampling and improves the SR. Some of the early PET scannershad both high-resolution (wobbled) and low-resolution (sta-tionary) mode scans. The under-sampling, which occurs in thestationary scans, produces poorer SR. Our opinion is that thiswas not taken into account when SR for different PET scannerswere compared with PET scanners with 1:1 coupling betweencrystals and PMTs [2], [3], [17].
We solved (1) to determine the block effect for the scannerswhose spatial resolutions are shown in Fig. 4, we found theblock effect to be: 1.1 mm for HRRT, 1.2 mm for PEM-1, and0.8 mm for microPET R4. All of these are much smaller thanpreviously reported value of 2 mm. The pure block effect mightbe closer to our experimental result. On the other hand, a totalblock effect may incorporate other factors that degrade the SR,

TOMIC et al.: THE “BLOCK EFFECT” ON SPATIAL RESOLUTION IN PET DETECTORS 605
which might be dependent on the construction of the detectorring and block detectors within the ring. Evaluation of (1) forthe HR yields a block effect of 1.7 mm. For the HR PETscanner, these effects may have been much more pronouncedthan in the other three models. We found that the contributionfrom the central crystals is only 1.1 mm.
From the determination of the separation between crystalsin the HR block detector and the assignment of territory inthe crystal identification matrix to appropriate crystals, we con-cluded that the crystals do not appear to be uniformly spaced inthe block. This must be taken into account when reconstructingimages. Also, our results suggest that only in a very narrowregion between the peaks of each crystal’s territory, there is apossibility of assigning an event to the wrong crystal. The cal-culated rate of mispositioned events in the crystals shows thatcrystals in the block are well separated.
Our study suggests that the measured CAFs and nonuniformsampling are not sufficient to explain the 2.3 mm block effect,which has been observed by Lecomte [3], [17], and proposedand observed by Moses [1], [2]. However, when their theoreticalequations are plotted as in Fig. 4, the SR of the HR scanneris very close to the curve corresponding to a 2 mm block ef-fect. This could be due to under-sampling of the image spacewith stationary detectors. This present study was aimed at theintrinsic properties of the block effect rather than the effects ofunder-sampling. Experiments on a complete PET scanner havenow been performed. These experiments isolate the under-sam-pling effects from intrinsic blurring from block detectors. Ourpreliminary findings were presented at the 2004 meeting of theSociety of Nuclear Medicine [15] and a more complete reportwill appear later [16].
REFERENCES
[1] W. W. Moses and S. E. Derenzo, “Empirical observation for spatial res-olution degradation in positron emission tomographs using block detec-tors,” J. Nucl. Med., vol. 33, no. 5, p. 101P, 1993.
[2] S. E. Derenzo, W. W. Moses, R. H. Huesman, and T. F. Budinger, “Crit-ical instrumentation issues for<2 mm resolution, high sensitivity brainPET,” in Quantification of Brain Function, K. Uemura, N. A. Lassen,T. Jones, and I. Kanno, Eds. Amsterdam, The Netherlands: Elsevier,1993, pp. 25–37.
[3] R. Lecomte, private communication, 1998 personal communication.[4] C. J. Thompson, “The effects of detector material and structure on PET
spatial resolution and efficency,” IEEE Trans. Nucl. Sci., vol. 37, no. 2,pp. 718–724, 1990.
[5] R. Boellaard, F. Buijs, H. W. A. M. de Jong, M. Lenox, T. Gremil-lion, and A. A. Lammertsma, “Characterization of a single LSO crystallayer high resolution research tomograph,” Phys. Med. Biol., vol. 48, pp.429–448, 2003.
[6] G. Brix, J. Zaers, L. E. Adam, M. E. Bellemann, H. Ostertag, H. Trojan,U. Haberkorn, J. Doll, F. Oberdorfer, and W. J. Lorenz, “Performanceevaluation of a whole-body PET scanner using the NEMA protocol,” J.Nucl. Med., vol. 38, no. 10, pp. 1614–1623, 1997.
[7] C. Knoess, S. S. Siegel, D. Newport, N. Richerzhagner, A. Winkler, A.Jacobs, R. N. Goble, R. Graf, K. Wienhard, and W. D. Heiss, “Perfor-mance evaluation of the microPET R4 PET scanner for rodents,” Eur. J.Nucl. Med. Mol. Imaging, vol. 30, no. 5, pp. 737–747, 2003.
[8] C. J. Thompson, K. Murthy, Y. Pickard, I. N. Weinberg, and R. Mako,“Positron emission mammography (PEM): A promising technique fordetecting breast cancer,” IEEE Trans. Nucl. Sci., vol. 42, no. 4, pp.1012–1017, Aug. 1995.
[9] J. H. Hubbel and S. M. Seltzer. Tables of X-Ray Mass Attenuation Coef-ficients and Mass Energy-Absorption Coefficients. [Online]. Available:http://www.physics.nist.gov/PhysRefData/XrayMassCoef/cover.htm
[10] Y. Picard and C. J. Thompson, “Determination of the centroid of interac-tion of the crystals in block detectors for PET,” IEEE Trans. Nucl. Sci.,vol. 41, no. 4, pp. 1464–1468, Aug. 1994.
[11] M. Dahlbom and E. J. Hoffman, “An evaluation of a two-dimensionalarray detector for high resolution PET,” IEEE Trans. Med. Imag., vol. 7,no. 4, pp. 264–271, Dec. 1988.
[12] R. Lecomte et al., “Initial results from the Sherbrooke avalanche pho-todiode positron tomograph,” IEEE Trans. Nucl. Sci, vol. 43, no. 3, pp.1952–1957, Jun. 1996.
[13] S. E. Derenzo, R. H. Huesman, J. L. Cahoon, A. Geyer, D. Uber, T.Vuletich, and T. F. Budinger, “A positron tomograph with 600 BGOcrystals and 2.6 mm resolution,” IEEE Trans. Nucl. Sci., vol. 35, no.1, pp. 659–664, Feb. 1988.
[14] T. Tomitani, N. Nohara, H. Morayama, M. Yamamoto, and E. Tanaka,“Development of a high resolution positron CT for animal studies,”IEEE Trans. Nucl. Sci., vol. NS-32, no. 1, pp. 822–825, Feb, 1985.
[15] C. J. Thompson, N. Tomic, M. Hinse, and S. Richard, “Blurring of im-ages from PET scanners due to under-sampling of the image space,” J.Nucl. Med., vol. 45, p. 167, 2004.
[16] C. J. Thompson, S. S. James, and N. Tomic, “Under-sampling in PETscanners as a source of image blurring,” Nucl. Instrum. Meth. Phys. Res.(A), Oct. 2004, submitted for publication.
[17] Based on data presented at the conference on High Resolution Imagingin Small Animals with PET MR and Other Modalities, Amsterdam, TheNetherlands, Sep. 1999.