Embed Size (px)
Citation preview
IEEE JOURNAL OF SELECTED TOPICS IN QUANTUM ELECTRONICS, VOL. 23, NO. 4, JULY/AUGUST 2017 8400505
Interferometric Terahertz Wavefront AnalysisEmmanuel Abraham, Takayuki Ogawa, Mathilde Brossard, and Takeshi Yasui
Abstract—Wavefront characterization of terahertz beams is use-ful for various applications such as terahertz spectroscopy andimaging. In this paper, we report on the aberration measurementof a terahertz beam issued from a quantum cascade laser. By usinga terahertz camera and a two-wave noncommon path interferom-eter, we measured the wavefront distortions. As an example, weevaluated the Zernike coefficients giving the aberrations of spher-ical wavefronts induced by a converging lens. Associated with adeformable mirror, the sensor will open the route to terahertzadaptive optics.
Index Terms—Terahertz imaging, wavefront, optical aberra-tions, quantum cascade laser, interferometer.
I. INTRODUCTION
AWAVEFRONT sensor is an optical beam analyzer thatdetermines the surface of equi-phase of an electromag-
netic wave. For instance, the well-known Hartmann sensor wasinvented more than a century ago [1]. It makes it possible tolocally measure the wavefront slopes of an incoming opticalradiation by using a mask composed of a holes array placed justin front of a 2D sensor. At present, many other wavefront sen-sors are commercially available for visible and infrared light,based on intensity measurement or interference fringe analysis[2]–[4]. These systems are essential since they can provide thewavefront characterization for adaptive optics and a wide va-riety of applications including astronomy, ophthalmology andmicroscopy. These sensors are widely used to measure opticalaberrations such as astigmatism, coma, spherical aberration, etc.
In the terahertz (THz) spectral domain, it is still challengingto fully measure the spatial profile and wavefront of a THz beamdue to the lack of effective THz cameras. A few previous stud-ies were oriented towards the measurement of THz wavefrontsfor both continuous wave and pulsed sources. In 2008, Bitzeret al. determined the beam profiles of THz pulses after passingthrough a hyperhemispherical silicon lens [5]. They observedan asymmetric spatio-temporal field dynamic in the focus of thelens attributed to a distortion of the incident THz wavefront.
Manuscript received September 29, 2016; revised November 10, 2016; ac-cepted December 7, 2016. This work was supported in part by the CNRS PICSProject no. 6507.
E. Abraham is with the Laboratoire Ondes et Matiere d’Aquitaine, CNRSUMR 5798, Bordeaux University, Bordeaux Cedex 33000, France (e-mail:[email protected]).
T. Ogawa and T. Yasui are with the Graduate School of Advanced Technol-ogy and Science, Tokushima University, Tokushima 770-8501, Japan (e-mail:[email protected]; [email protected]).
M. Brossard is with NeTHIS – New TeraHertz Imaging Systems, Merignac33700, France (e-mail: [email protected]).
Color versions of one or more of the figures in this paper are available onlineat http://ieeexplore.ieee.org.
Digital Object Identifier 10.1109/JSTQE.2016.2638540
However, they did not measure the THz wavefront but onlythe THz beam profile and their indirect and time-consumingmethod used a XY-scanning system in order to determine point-by-point the beam profile. Another aperture scanning device wasproposed in 2013 to characterize the THz beam propagation ina time-domain spectrometer [6]. Associated with a Hartmannmask, it has been used to produce 2D topographical image ofthe THz wavefront. In 2012, Richter et al. proposed the firstTHz wavefront measurement with a Hartmann sensor and mi-crobolometer camera [7]. The performance of the system wasdemonstrated by characterizing the wavefront of a THz beamemitted by a quantum cascade laser. Cui et al. analyzed theTHz wavefront of a quantum cascade laser and a gas laser byusing a Hartmann mask. However, they also used an indirectXY-scanning method to detect the radiation with a pyroelectricsensor [8], [9]. More recently, we reported on the wavefrontmeasurement of THz pulses using a Hartmann sensor asso-ciated with a 2D electro-optic imaging system composed of aZnTe crystal and a CMOS camera. We quantitatively determinedthe frequency-resolved deformations of planar and convergingspherical wavefronts using the modal Zernike reconstructionleast-squares method [10].
In this paper, we propose a simple interferometric method tomeasure the wavefront of a THz continuous wave. The measure-ment can be useful to control the optical alignment of a THzimaging system for which an incident planar THz wavefrontis required in order to optimize, for instance, the focalizationof the THz beam at the sample position. Basically, the systemis based on a modified Mach Zehnder interferometer. It onlyrequires a sensitive THz camera which is able to record theinterferometric image generated by the superposition of two in-coming THz waves. Then, using a simple fringe analysis, we canobtain the THz wavefront and its decomposition along the well-known Zernike coefficients. As a demonstration, the method hasbeen applied to measure the wavefronts and optical aberrationsof convergent and divergent THz beams. Associated with de-formable mirrors, the sensor will also open the route to THzadaptive optics.
II. EXPERIMENTAL SETUP
The experimental setup of the wavefront sensor is presentedin Fig. 1. In our study, the source is a Quantum CascadeLaser (QCL, Longwave) providing a continuous wave at 3 THz(λ = 100 µm) with an output power of 1.7 mW. As many THzsources, the output beam is highly divergent and requires aspecific beam shaping before any further utilization for THzimaging applications for instance. In our case, we used two
1077-260X © 2016 IEEE. Personal use is permitted, but republication/redistribution requires IEEE permission.See http://www.ieee.org/publications standards/publications/rights/index.html for more information.
8400505 IEEE JOURNAL OF SELECTED TOPICS IN QUANTUM ELECTRONICS, VOL. 23, NO. 4, JULY/AUGUST 2017
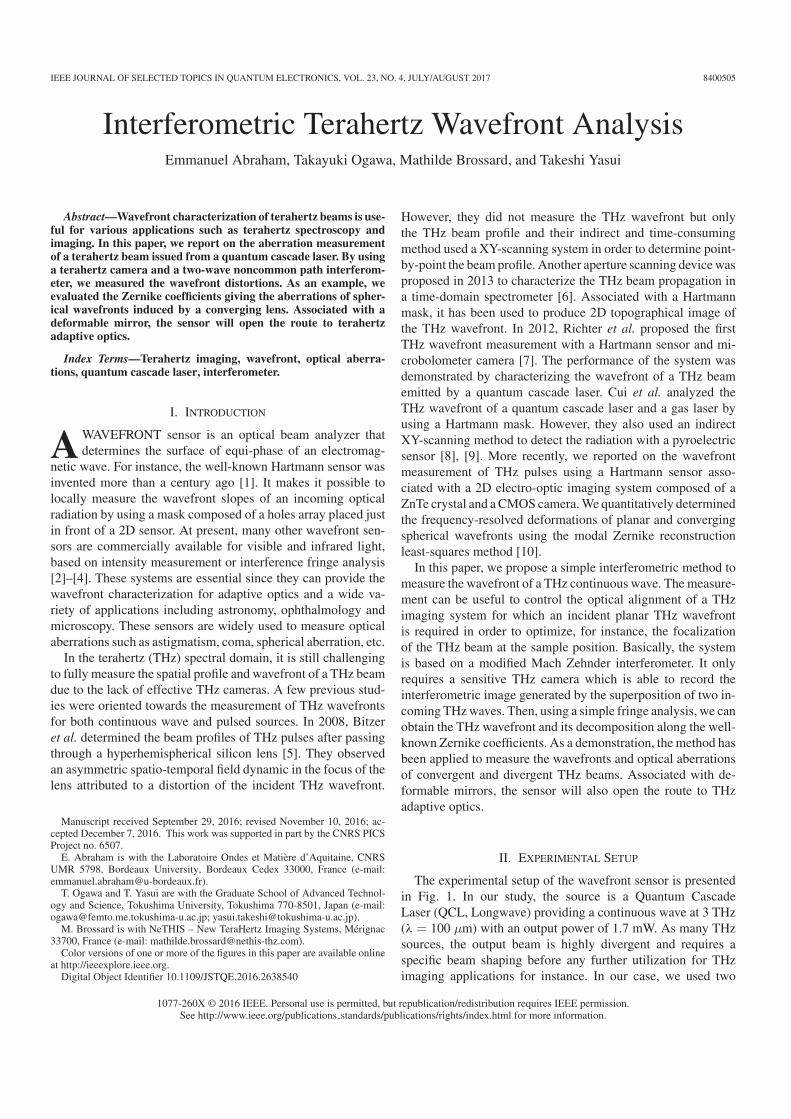
Fig. 1. General experimental setup for the analysis of planar THz wavefront.L1 and L2: plano-convex lens, focal distance of 50 mm. Pinhole diameter D =3.2 mm.
plano-convex lenses (L1 and L2) and a spatial filtering to pro-vide a planar beam.
The type of interferometer has been selected regarding thesensitivity of the THz camera. We used a NEC microbolome-ter array (320 × 240 pixels, 23.5 µm pixel size) with a sen-sitivity of 1 nW. Therefore, to get a sufficient signal-to-noiseratio, it is better that the initial beam passes only once througha beamsplitter. For this reason, we selected a modified MachZehnder interferometer where the reference and sample beamstravel along different paths before interfering. This shearing in-terferometer will be able to measure small aberrations since thefringe lateral shifting must be smaller to 2π to avoid any phaseambiguity [11].
The interferometer is simply composed by a HFRZ-Si beam-splitter (reflection = 54%, transmission = 46% for the verticalpolarization) and two mirrors. The incoming THz beam is di-vided by the beamsplitter in order to form sample and referencebeams. Both beams are recombined spatially in the plane of apinhole whose diameter is set to D = 3.2 mm in the presentstudy. The angle between the two interfering beams is noted α.The intensity distribution in the plane of the pinhole is imagedwith a magnification factor equal to one by the THz cameraequipped with a 34 mm objective lens. In the present study, in-terference pattern is easily obtained owing to the long coherencelength of the THz source (tens of centimeters).
III. RESULTS AND DISCUSSION
A. Optical Distortions Delivered by the Interferometer
First, before characterizing the signal THz wavefront, weneed to quantify the optical aberrations delivered by the in-terferometer itself, attributed to the beamsplitter and the twometallic mirrors.
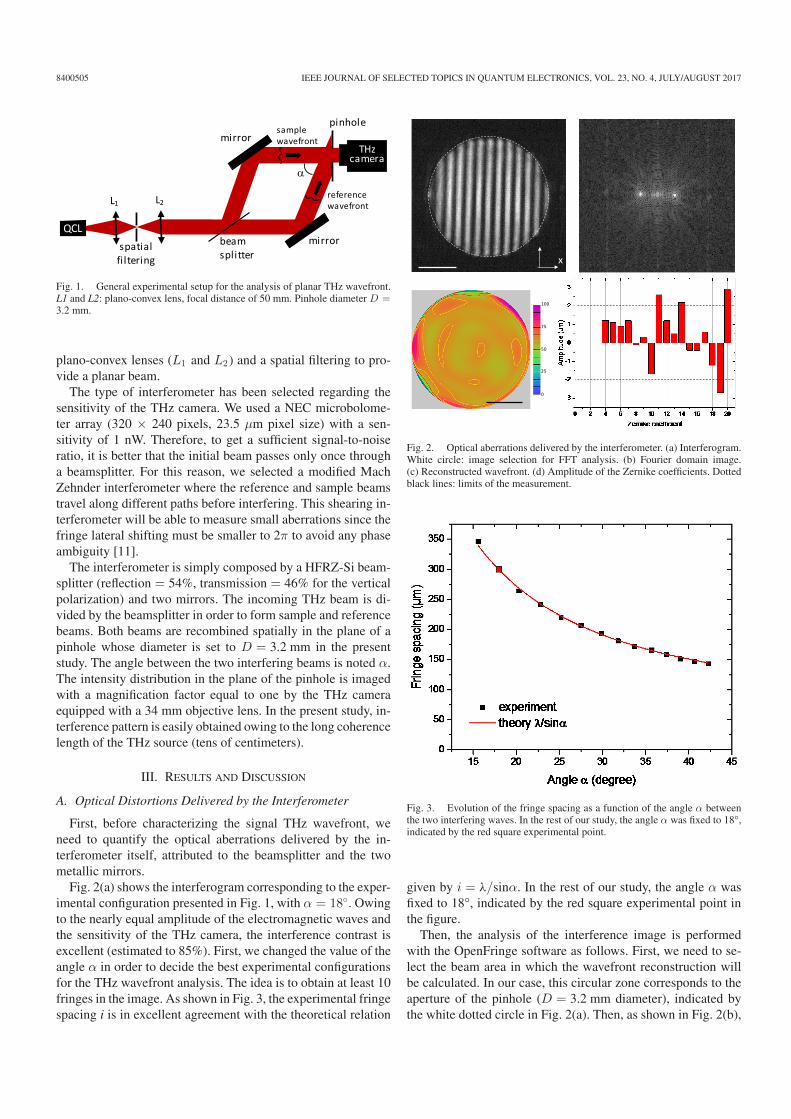
Fig. 2(a) shows the interferogram corresponding to the exper-imental configuration presented in Fig. 1, with α = 18◦. Owingto the nearly equal amplitude of the electromagnetic waves andthe sensitivity of the THz camera, the interference contrast isexcellent (estimated to 85%). First, we changed the value of theangle α in order to decide the best experimental configurationsfor the THz wavefront analysis. The idea is to obtain at least 10fringes in the image. As shown in Fig. 3, the experimental fringespacing i is in excellent agreement with the theoretical relation
Fig. 2. Optical aberrations delivered by the interferometer. (a) Interferogram.White circle: image selection for FFT analysis. (b) Fourier domain image.(c) Reconstructed wavefront. (d) Amplitude of the Zernike coefficients. Dottedblack lines: limits of the measurement.
Fig. 3. Evolution of the fringe spacing as a function of the angle α betweenthe two interfering waves. In the rest of our study, the angle α was fixed to 18°,indicated by the red square experimental point.
given by i = λ/sinα. In the rest of our study, the angle α wasfixed to 18°, indicated by the red square experimental point inthe figure.
Then, the analysis of the interference image is performedwith the OpenFringe software as follows. First, we need to se-lect the beam area in which the wavefront reconstruction willbe calculated. In our case, this circular zone corresponds to theaperture of the pinhole (D = 3.2 mm diameter), indicated bythe white dotted circle in Fig. 2(a). Then, as shown in Fig. 2(b),

ABRAHAM et al.: INTERFEROMETRIC TERAHERTZ WAVEFRONT ANALYSIS 8400505
TABLE IZERNIKE POLYNOMIALS
i Aberration Zi (ρ, θ)
1 Piston 12 X tilt ρ cos θ3 Y tilt ρ sin θ4 Defocus 2ρ2 − 15 X astigmatism ρ2 cos 2θ6 Y astigmatism ρ2 sin 2θ7 X coma (3ρ3 − 2ρ) cos θ8 Y coma (3ρ3 − 2ρ) sin θ9 Spherical 6ρ4 − 6ρ2 + 110 X trefoil ρ3 cos 3θ11 Y trefoil ρ3 sin 3θ12 X 2nd astigmatism (4ρ4 − 3ρ2 ) cos 2θ13 Y 2nd astigmatism (4ρ4 − 3ρ2 ) sin 2θ14 X 2nd coma (10ρ5 − 12ρ3 + 3ρ) cos θ15 Y 2nd coma (10ρ5 − 12ρ3 + 3ρ) sin θ16 2nd spherical 20ρ6 − 30ρ4 + 12ρ2 − 117 X tetrafoil ρ4 cos 4θ18 Y tetrafoil ρ4 sin 4θ19 X 2nd trefoil (5ρ5 − 4ρ3 ) cos 3θ20 Y 2nd trefoil (5ρ5 − 4ρ3 ) sin 3θ
we computed the magnitude of the 2D Fast Fourier Transforma-tion (FFT) of the interferogram. This is the usual procedure toperform a spatial frequency analysis of the interferogram. Theoutput of this transformation represents the interference imagein the Fourier or frequency domain where, each pixel representsa particular frequency contained in the spatial domain image.The magnitude of the Fourier domain image in Fig. 2(b) presentsthree horizontal bright spots since the original interferogram iscomposed of vertical fringes. The central spot can be ignoredsince it corresponds to the DC component of the Fourier domainimage. The rest of the image, including the two remaining com-plex conjugated bright spots contain all the required informationto calculate the phases shift between the sample and referencewaves at the pinhole position.
The wavefront presented in Fig. 2(c) is almost planar evenif some aberrations are visible in the edge of the beam, with amaximum wavefront distortion of about 100 µm near the beamedge. This indicates that the optical elements of the interferom-eter, i.e. the Si beamsplitter and both mirrors, does not distortthe wavefront of the incoming THz beam.
To quantify these aberrations delivered by the interferometer,we decomposed the wavefront W into a linear combination ofthe Zernike polynomials [12]:
W (ρ, θ) =!
i
aiZi(ρ, θ) (1)
where (ρ, θ) are the normalized polar coordinates (ρ ≤ 1) andthe coefficient ai represents the amplitude of the aberration at-tributed to the polynomial Zi , as referenced in Table I. Due tothe non-collinear interaction between the reference and signalbeams, the X tilt term is naturally very large (a2 = 575 µm, cal-culated with a beam diameter of D = 3.2 mm)). For the wave-front reconstruction, the piston and XY tilt terms have been setto zero since they did not represent any intrinsic aberrations ofthe interferometer. Fig. 2(d) shows the amplitudes of the 20th
Fig. 4. Experimental setup for the analysis of spherical THz wavefront. L1and L2: lens, focal distance of 50 mm. L: lens with f ′ = 100 mm. Pinholediameter D = 3.2 mm.
first Zernike coefficients, corresponding to the representation ofthe wavefront up to the second-order aberrations. All terms aresmaller than 3 µm, i.e. λ/33. The precision of our measurementhas been estimated to 10%, taking into account the accuracy ofthe fringe spacing determination (error of ±1 pixel correspond-ing to a fringe spacing of (300 ± 25) µm for α = 18◦). We alsoestimated the minimum amplitude of the Zernike coefficientsthat the system is able to calculate. Considering a minimum tiltof i = 25 D = 80 mm and the relation
a2 =R
tan"arcsin
#λi
$% (2)
one gets a2 = 2 µm that can be generalized for any givenZernike coefficient. Therefore, we conclude that the minimumvalue of the Zernike coefficients that our system can measureis 2 µm, indicated by the two horizontal dotted black lines inFig. 2(d). This shows the method makes it possible to reveal,at the limit of our detection limit, the following major intrinsicaberrations delivered by the interferometer: a11 = 2.6 µm (Ytrefoil), a14 = 2.2 µm(X 2nd coma), a19 = −2.7 µm (X 2ndtrefoil) and a20 = 2.9 µm (Y 2nd trefoil). In the rest of this pa-per, these small aberrations will be subtracted in order to mea-sure the signal THz wavefront without any perturbation comingfrom the interferometer itself.
B. Wavefront Analysis of a THz Spherical Beam
This section will present the wavefront analysis of THz spher-ical beams with different radius of curvature. The aim of thestudy consists in comparing the experimental defocus parame-ter to its theoretical prediction and the determination of all theother distortions.
The previous experimental setup has been modified by insert-ing, a plano-convex lens L with a focal distance f ′ = 100 mmon the pathway of the signal beam (Fig. 4). By varying thedistance d between the lens and the pinhole it is possibleto change the beam from converging (d < f ’) to diverging(d > f ’) wavefronts. Theoretically, assuming an incoming col-limated Gaussian beam, the radius of curvature R of the THz
8400505 IEEE JOURNAL OF SELECTED TOPICS IN QUANTUM ELECTRONICS, VOL. 23, NO. 4, JULY/AUGUST 2017
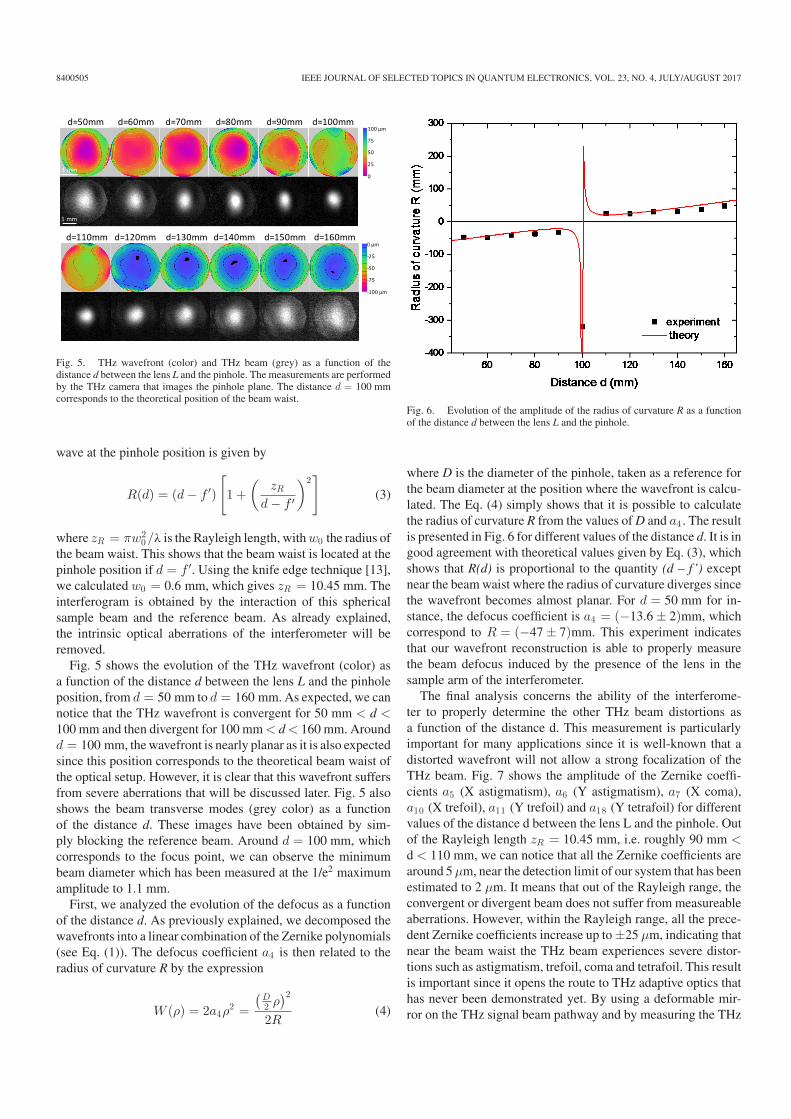
Fig. 5. THz wavefront (color) and THz beam (grey) as a function of thedistance d between the lens L and the pinhole. The measurements are performedby the THz camera that images the pinhole plane. The distance d = 100 mmcorresponds to the theoretical position of the beam waist.
wave at the pinhole position is given by
R(d) = (d − f ′)
&1 +
'zR
d − f ′
(2)
(3)
where zR = πw20/λ is the Rayleigh length, with w0 the radius of
the beam waist. This shows that the beam waist is located at thepinhole position if d = f ′. Using the knife edge technique [13],we calculated w0 = 0.6 mm, which gives zR = 10.45 mm. Theinterferogram is obtained by the interaction of this sphericalsample beam and the reference beam. As already explained,the intrinsic optical aberrations of the interferometer will beremoved.
Fig. 5 shows the evolution of the THz wavefront (color) asa function of the distance d between the lens L and the pinholeposition, from d = 50 mm to d = 160 mm. As expected, we cannotice that the THz wavefront is convergent for 50 mm < d <100 mm and then divergent for 100 mm < d < 160 mm. Aroundd = 100 mm, the wavefront is nearly planar as it is also expectedsince this position corresponds to the theoretical beam waist ofthe optical setup. However, it is clear that this wavefront suffersfrom severe aberrations that will be discussed later. Fig. 5 alsoshows the beam transverse modes (grey color) as a functionof the distance d. These images have been obtained by sim-ply blocking the reference beam. Around d = 100 mm, whichcorresponds to the focus point, we can observe the minimumbeam diameter which has been measured at the 1/e2 maximumamplitude to 1.1 mm.
First, we analyzed the evolution of the defocus as a functionof the distance d. As previously explained, we decomposed thewavefronts into a linear combination of the Zernike polynomials(see Eq. (1)). The defocus coefficient a4 is then related to theradius of curvature R by the expression
W (ρ) = 2a4ρ2 =
#D2 ρ
$2
2R(4)
Fig. 6. Evolution of the amplitude of the radius of curvature R as a functionof the distance d between the lens L and the pinhole.
where D is the diameter of the pinhole, taken as a reference forthe beam diameter at the position where the wavefront is calcu-lated. The Eq. (4) simply shows that it is possible to calculatethe radius of curvature R from the values of D and a4 . The resultis presented in Fig. 6 for different values of the distance d. It is ingood agreement with theoretical values given by Eq. (3), whichshows that R(d) is proportional to the quantity (d – f’) exceptnear the beam waist where the radius of curvature diverges sincethe wavefront becomes almost planar. For d = 50 mm for in-stance, the defocus coefficient is a4 = (−13.6 ± 2)mm, whichcorrespond to R = (−47 ± 7)mm. This experiment indicatesthat our wavefront reconstruction is able to properly measurethe beam defocus induced by the presence of the lens in thesample arm of the interferometer.
The final analysis concerns the ability of the interferome-ter to properly determine the other THz beam distortions asa function of the distance d. This measurement is particularlyimportant for many applications since it is well-known that adistorted wavefront will not allow a strong focalization of theTHz beam. Fig. 7 shows the amplitude of the Zernike coeffi-cients a5 (X astigmatism), a6 (Y astigmatism), a7 (X coma),a10 (X trefoil), a11 (Y trefoil) and a18 (Y tetrafoil) for differentvalues of the distance d between the lens L and the pinhole. Outof the Rayleigh length zR = 10.45 mm, i.e. roughly 90 mm <d < 110 mm, we can notice that all the Zernike coefficients arearound 5 µm, near the detection limit of our system that has beenestimated to 2 µm. It means that out of the Rayleigh range, theconvergent or divergent beam does not suffer from measureableaberrations. However, within the Rayleigh range, all the prece-dent Zernike coefficients increase up to ±25 µm, indicating thatnear the beam waist the THz beam experiences severe distor-tions such as astigmatism, trefoil, coma and tetrafoil. This resultis important since it opens the route to THz adaptive optics thathas never been demonstrated yet. By using a deformable mir-ror on the THz signal beam pathway and by measuring the THz

ABRAHAM et al.: INTERFEROMETRIC TERAHERTZ WAVEFRONT ANALYSIS 8400505
Fig. 7. Evolution of the amplitude of the Zernike coefficients as a function ofthe distance d between the lens L and the pinhole.
wavefront error after it has been corrected by the interferometer,we can form a closed loop wavefront sensor able to fully correctthe beam distortion at the focus position, where a sample or adetector can be placed.
IV. CONCLUSION
The paper concerns the characterization of THz wavefrontsissued from a QCL source. With a modified Mach Zehnder inter-ferometer, we determined the optical aberrations of the THz sig-nal beam. Especially, important distortions have been measurednear the focal spot of the THz beam, which can be problematicfor future applications in spectroscopy or imaging for whicha planar terahertz wavefront is required in order to optimizethe focalization of the terahertz beam at the sample or detectorposition. Further, we believe that the interferometer could beassociated with a deformable mirror and a realtime controller toopen the route to THz adaptive optics.
REFERENCES
[1] J. Hartmann, “Bemerkungen uber den Bau und die Justierung von Spek-trographen,” Z. Instrumentenkunde, vol. 20, pp. 47–58, 1900.
[2] J. M. Geary, Introduction to Wavefront Sensors. Bellingham, WA, USA:SPIE, 1995.
[3] R. A. Gonsalves, “Phase retrieval and diversity in adaptive optics,” Opt.Eng., vol. 21, pp. 829–832, 1982.
[4] J. Primot, “Three-wave lateral shearing interferometer,” Appl. Opt.,vol. 32, pp. 6242–6249, 1993.
[5] A. Bitzer, H. Helm, and M. Walther, “Beam-profiling and wavefront-sensing of THz pulses at the focus of a substrate-lens,” IEEE J. Sel. TopicsQuantum Electron., vol. 14, no. 2, pp. 476–481, Mar./Apr. 2008.
[6] J. F. Molloy, M. Naftaly, and R. A. Dudley, “Characterization of terahertzbeam profile and propagation,” IEEE J. Sel. Topics Quantum Electron.,vol. 19, no. 1, Jan./Feb. 2013, Art. no. 8401508.
[7] H. Richter et al., “Terahertz wavefront measurement with a Hartmannsensor,” Appl. Phys. Lett., vol. 101, 2012, Art. no. 031103.
[8] M. Cui, J. N. Hovenier, Y. Ren, A. Polo, and J. R. Gao, “Terahertzwavefronts measured using the Hartmann sensor principle,” Opt. Express,vol. 20, pp. 14380–14391, 2012.
[9] M. Cui et al., “Beam and phase distributions of a terahertz quantumcascade wire laser,” Appl. Phys. Lett., vol. 102, 2013, Art. no. 111113.
[10] E. Abraham, H. Cahyadi, M. Brossard, J. Degert, E. Freysz, and T. Ya-sui, “Development of a wavefront sensor for THz pulses,” Opt. Express,vol. 24, pp. 5203–5211, 2016.
[11] D. C. Ghiglia and M. D. Pritt, Two-Dimensional Phase Unwrapping:Theory, Algorithms, and Software. Hoboken, NJ, USA: Wiley, 1998.
[12] W. H. Southwell, “Wave-front estimation from wave-front slope measure-ments,” J. Opt. Soc. Amer., vol. 70, pp. 998–1006, 1980.
[13] A. E. Siegman, M. W. Sasnett, and T. F. Johnston Jr., “Choice of cliplevels for beam width measurements using knife-edge techniques,” IEEEJ. Quantum Electron., vol. 27, no. 4, pp. 1098–1104, Apr. 1991.
Emmanuel Abraham was born in Reims, France, 1970. He received the Ph.D.degree in physics from Bordeaux University, France, in 1997.
In 1997–1998, he joined the National Research Laboratory of Metrology,AIST, Tsukuba, Japan, as a Postdoctoral Research Fellow, and the FemtoSecondTechnology project to study industrial applications of femtosecond lasers, in-cluding ultrafast optical Kerr gate. He has published more than 50 peer-reviewedjournals, four patents, four book chapters, and more than 100 conference pro-ceedings. From 1998 to 2013, he was an Assistant Professor in the LaboratoireOndes et Matiere d’Aquitaine, Bordeaux University, where he is currently aProfessor. He was invited in Osaka University as an Invited Researcher in 2007and the University of Tokushima as a Short-Term Invited Fellow Researcherof Japan Society for the Promotion of Science in 2010. His research interestsinclude femtosecond time-resolved spectroscopy and nonlinear optics. He alsohas investigated the potential of terahertz (THz) radiation for the analysis ofobjects related to cultural heritage such as paintings, sculptures, ceramics, etc.,by using pulsed and continuous millimeter-wave sources for 2-D imaging and3-D THz computed tomography. He developed intense THz sources and stud-ied their applications for nonlinear spectroscopy. Thanks to the internationalcollaboration with Tokushima University, he also developed innovative instru-mentation for THz science and technology.
Takayuki Ogawa received the Bachelor’s degree in mechanical engineeringfrom Tokushima University, Japan, in 2015, where he is currently workingtoward the Master’s degree in the Graduate School of Advanced Technologyand Science. His areas of research are THz digital holography.
Mr. Ogawa is a member of the Optical Society of America and the LaserSociety of Japan.
Mathilde Brossard was born in St Etienne, France, 1992. She received the En-gineering degree from the Institut d’Optique Graduate School, France, in 2015.She started working toward the Ph.D. degree on THz wavefront measurementin Nethis Company in collaboration with Bordeaux University in 2016.
Takeshi Yasui received the Ph.D. degree in mechanical engineering fromTokushima University, Japan, in 1997.
From 1997 to 1999, he was a Postdoctoral Research Fellow in the NationalResearch Laboratory of Metrology, Japan. He was with the Graduate Schoolof Engineering Science, Osaka University, Japan, from 1999 to 2010, and wasbriefly with the University of Bordeaux I in 2007 and the University of LittoralCote d’Opale in 2010 as an Invited Professor. He is currently a Professor inthe Graduate School of Science and Technology, Tokushima University, andan Invited Professor in the Graduate School of Engineering Science, OsakaUniversity. His research interests include THz instrumentation and metrology,nonlinear optical microscopy, and optical comb.
Dr. Yasui is a member of the Optical Society of America, the Japan So-ciety of Applied Physics, the Optical Society of Japan, the Laser Society ofJapan, the Japan Society of Medical Electronics and Biological Engineering,and the Japan Society of Mechanical Engineers. He received the Award for theMost Promising Young Scientist from the Optical Society of Japan in 1998, theSakamoto Award from the Japan Society of Medical Electronics and BiologicalEngineering in 2006, the Optics Paper Award from the Japan Society of AppliedPhysics, and the Funai Award from the Japan Society of Mechanical Engineersin 2009.


![[Hermann] - IM 06 - Topics in the Mathematics of Quantum Mechanics](https://img.dokumen.tips/doc/110x75/577cd8d01a28ab9e78a20c89/hermann-im-06-topics-in-the-mathematics-of-quantum-mechanics.jpg)


