Embed Size (px)
Citation preview

IEEE COMMUNICATIONS SURVEYS & TUTORIALS, ACCEPTED FOR PUBLICATION 1
EXIT Charts for System Design and AnalysisMohammed El-Hajjar and Lajos Hanzo
Abstract—Near-capacity performance may be achieved withthe aid of iterative decoding, where extrinsic soft informationis exchanged between the constituent decoders in order to im-prove the attainable system performance. Extrinsic InformationTransfer (EXIT) charts constitute a powerful semi-analytical toolused for analysing and designing iteratively decoded systems.In this tutorial, we commence by providing a rudimentaryoverview of the iterative decoding principle and the concept ofsoft information exchange. We then elaborate on the concept ofEXIT charts using three iteratively decoded prototype systems asdesign examples. We conclude by illustrating further applicationsof EXIT charts, including near-capacity designs, the concept ofirregular codes and the design of modulation schemes.
Index Terms—EXIT charts, convolutional codes, turbo codes,concatenated codes, mutual information.
I. INTRODUCTION
IN THE ERA of smart phones and tablet PCs, there is ademand for flawless high-rate wireless multimedia services.
On the other hand, bandwidth is a valuable commodity andtherefore the information has to be transmitted over the com-munication channel as efficiently as possible due to the band-limited nature of communication networks [1, 2]. Furthermore,the capacity of wireless systems is interference limited, hencecannot be readily increased by simply increasing the trans-mitted power [2]. Therefore, flexible and bandwidth-efficienttransceivers have to be designed for supporting wireless mul-timedia services.
The history of channel coding dates back to Shannon’spioneering work in 1948 [3, 4], where it was predicted thatreliable communication can be achieved with the aid of chan-nel coding by incorporating redundancy into the transmittedmessage. Ever since Shannon quantified the capacity of acommunications system [3], researchers have endeavouredto devise high-speed, high-quality wireless communicationsystems exhibiting both a high bit rate and a low Bit ErrorRate (BER). Advances in coding made it feasible to approachShannon’s capacity limit [4, 5]. Channel coding dates back tothe 1950s, when the first Hamming codes were invented [6].Convolutional codes were introduced in [7] and then sev-eral algorithms were proposed for their decoding in [8–11].Then Viterbi invented the Maximum Likelihood SequenceEstimation (MLSE) algorithm in 1967 [12, 13], which wasa major breakthrough for convolutional codes. In 1974, theMaximum A Posteriori (MAP) algorithm was proposed forattaining the minimum BER for the convolutional codes [14].
Manuscript received July 2, 2012; revised January 8, 2013 and March 15,2013. The financial support of the RC-UK under the auspices of the India-UK Advanced Technology Centre (IU-ATC) and the EU’s Concerto projectis gratefully acknowledged.
The authors are with the School of Electronics and Computer Science, Uni-versity of Southampton, SO17 1BJ, UK (e-mail: {meh,lh}@ecs.soton.ac.uk).
Digital Object Identifier 10.1109/SURV.2013.050813.00137
However, the MAP algorithm has not been widely employeduntil the invention of turbo codes, because its complexity wassubstantially higher than that of the Viterbi algorithm, whilstits performance was only marginally better.
The concept of concatenated codes was proposed in [15].However, it was not until the turbo codes were proposed in [16,17] that the concept of iterative decoding at low complexitybecame a reality with the employment of simple constituentcodes. Turbo codes use parallel concatenation of two Recur-sive Systematic Convolutional (RSC) codes accommodatingan interleaver between the two constituent encoders [16, 17].The concept of turbo codes was extended to multiple parallelconcatenated codes in [18]. Then, the turbo principle wasextended to both serially concatenated block and convolutionalcodes in [19]. In [20–22] the concept and design rules of Bit-Interleaved Coded Modulation (BICM) and BICM relying onIterative Detection (BICM-ID) were presented.
Substantial efforts have been invested in optimising theperformance of concatenated codes in order to improve theslopes of their BER curves and to attain a near-capacityperformance. Recently, significant efforts have also been ded-icated to studying the convergence behaviour of iterativedecoding. Semi-analytical tools devised for analysing theconvergence behaviour of iteratively decoded systems wereproposed in [23–26, 28, 31, 33–36, 41–43, 45, 46]. The MutualInformation (MI) between the data bits at the transmitter andthe soft values at the receiver were used for describing the ex-change of extrinsic information between the decoders in [47].The exchange of extrinsic information between the constituentdecoders may be visualised by EXtrinsic Information Transfer(EXIT) charts [23–25, 46, 48]. EXIT charts characterise theflow of information between the constituent decoders of aconcatenated structure. In [36] the computation of EXIT chartswas simplified for the scenario when the Probability DensityFunction (PDF) of the transmitted message is symmetric. Aninsightful tutorial introduction to EXIT charts was provided byHagenauer in [49]. Additionally, several algorithms predictingthe decoding convergence of iterative decoding schemes werecompared in [35].
The concept of EXIT charts was further developed foranalysing three-stage concatenated systems by Ten Brinkin [26], Tuchler in [36] and Brannstrom in [42]. In [41, 42]an algorithm was proposed for finding the optimal decoderactivation order, namely for determining the order of soft-information exchange among the three components. Addi-tionally, a beneficial technique was suggested in [41, 42] forprojecting three-dimensional EXIT functions onto a singletwo-dimensional EXIT chart. Furthermore, it was proposedin [37, 38] to create systems exhibiting beneficial decodingconvergence after a fixed number of iterations, which resulted
1553-877X/13/$31.00 c© 2013 IEEE

2 IEEE COMMUNICATIONS SURVEYS & TUTORIALS, ACCEPTED FOR PUBLICATION
TABLE IMAJOR CONTRIBUTIONS ON STUDYING THE CONVERGENCE OF ITERATIVE DECODING.
Year Author(s) Contribution1999 Peleg et al. [23] investigated the convergence behaviour of inner rate-1 codes based on a combination of Signal to Noise
Ratio (SNR) measures and mutual information.2000 ten Brink [24–26] proposed the employment of the EXIT charts for characterising the convergence behaviour of concatenated
decoders.2001 Richardson and Urbanke [27] proposed the employment of a density evolution algorithm in order to investigate the PDFs of the
iteratively decoded information.2001 Richardson et al. [28] the density evolution algorithm was employed for the sake of constructing LDPC codes capable of
operating at low Eb/N0 values.2001 Chung et al. [29] the density evolution algorithm was also employed for the sake of designing LDPC codes operating
within 0.0045dB of the Shannon limit.2001 ten Brink [30] the EXIT chart analysis was extended to three-stage parallel concatenated systems.2001 El Gamal and Hammons [31] SNR based measures were used for studying the convergence of iterative decoding.2001 Scanavino et al. [32] investigated the convergence properties of iterative decoders working at both bit and symbol level, where
useful performance improvements were observed, when employing symbol-based iterative decoding.2001 Grant [33] EXIT charts were extended to the non-binary (index-based) case, where a histogram-based approximation
of the extrinsic information was used in order to compute the mutual information.2002 Tuchler and Hagenauer [34] the computation of EXIT charts was further simplified to a time average, when PDFs of the communicated
information at the input and output of the constituent decoders are both symmetric and consistent.2002 Tuchler et al. [35] several algorithms predicting the decoding convergence of iterative decoding schemes were compared.2002 Tuchler [36] the EXIT chart analysis was extended to three-stage serially concatenated systems.2003 Tuchler [37, 38] a design procedure was proposed for creating systems exhibiting beneficial decoding convergence after
a fixed number of iterations.2004 Tuchler and Hagenauer [34, 38] Irregular Convolutional Codes (IrCC) were proposed for the sake of appropriately shaping the EXIT
curves by minimising the area within the EXIT-tunnel.2004 Lee et. al. [39, 40] The EXIT band chart tool was proposed for analysing systems having short interleaver length.
2003-2005 Brannstrom et al. [41, 42] the EXIT chart analysis of multiple concatenated codes was considered, where an algorithm was proposedfor finding the optimal decoder activation order. Additionally, a technique was also given for combiningand projecting a series of three-dimensional EXIT functions onto a single two-dimensional EXIT chart.
2006 Kliewer et al. [43] an efficient and low-complexity method of computing non-binary EXIT charts from index-based aposteriori probabilities was proposed, which may considered a generalisation of the approach presentedin [44].
in a complexity reduction. The design procedure is basedon the observation that EXIT chart predictions are usuallyaccurately satisfied by the BER curves for the first fewiterations, regardless of the depth of the interleaver employed.
The design of Irregular Convolutional Codes (IrCC) wasproposed by Tuchler and Hagenauer in [34, 38] for the sakeof accurately matching the shape of the EXIT curves ofthe decoder components by minimising the area within theopen EXIT tunnel. On the other hand, Lee et. al. [39,40] proposed the principle of EXIT-band charts as a toolfor analysing systems having short interleaver length. Themajor contributions on studying the convergence of iterativedecoding are summarised in Table I.
In this treatise we aim for providing a comprehensive tuto-rial of the semi-analytical EXIT chart tool used for designingand analysing iteratively decoded systems.The rest of thepaper is organised as follows. In Section II, we present abrief overview of the iterative decoding principle followedby a tutorial insights into the employment of EXIT chartsin Section III. Our discourse essentially relies on designexamples. We then present further applications of EXIT chartsin Sections IV and V. Finally, we conclude in Section VII.
II. OVERVIEW OF CONCATENATED CODES AND THE TURBO
PRINCIPLE
The concatenation of low-complexity channel codes consti-tutes a convenient technique of constructing powerful codescapable of approaching the capacity, while having a moderatedecoding complexity. Serially concatenated codes were pro-posed in 1966 in [15], while the discovery of parallel concate-
Encoder 1
Encoder 2
Decoder 1
Decoder 2
DEMUX
ΠΠ−1
ΠMUX
u1 c1
u2 c2
E(u1)
A(u2)
A(c1)
A(c2)
A(u1)
E(u2)
Fig. 1. Encoder and decoder structure of a parallel concatenated code [54].
nated codes [16] improved the achievable system performanceby separating the constituent codes using interleavers for thesake of exchanging sufficient decorrelated extrinsic informa-tion between the constituent decoders in order to improvethe system’s BER [50]. Iterative decoding and the turboprinciple [51] can be employed for both parallel concatenatedcodes [16–18] and serially concatenated codes [19, 52, 53]. Inthis section we provide a rudimentary overview of the differentconcatenated code schemes, including both parallel and serialconcatenated structures.
The block diagram of parallel concatenated codes is shownin Fig. 1. As shown in Fig. 1 the input bit stream u1 is encodedin Encoder 1 and an interleaved version of the input bit stream

EL-HAJJAR and HANZO: EXIT CHARTS FOR SYSTEM DESIGN AND ANALYSIS 3
Encoder 1 Encoder 2Π
Π−1
ΠDecoder 2 Decoder 1
u1c2c1 u2
A(c2)E(u2) A(c1)
E(u1)
A(u2) E(c1)
Fig. 2. Encoder and decoder structure of a two-stage serial concatenatedcode [54].
u2 is encoded by Encoder 2. The role of this interleaver is thatof ensuring that the parity-related redundancy appropriatelyinserted into the original information bit-stream is spreadacross a long sequence. The rationale of this is that this wayeach information bit is protected by parity bits, which areless likely to be affected by the same channel effects, as theinformation bits they are protecting. The output of the twoencoders is then multiplexed and transmitted, as shown inFig. 1.
At the receiver side, the two decoders, namely Decoder 1and Decoder 2 of Fig. 1, exchange soft information in the formof Logarithmic-Likelihood Ratio (LLR), where the notationsA(.) and E(.) used in Fig. 1 refer to the Extrinsic and apriori LLRs of the bits, respectively. First, the received datais demultiplexed, as shown in Fig. 1 and then the LLRs repre-senting the encoded bit streams c1 and c2 are passed to theircorresponding decoders. Decoder 1 generates the extrinsicLLRs E(u1), as shown in Fig. 1, which are then interleaved toform the a priori LLRs A(u2) for Decoder 2. To elaboratea little further, the bit providing a priori information fromDecoder 2 would have travelled through the channel with ahigh time-displacement and hence is likely to be affected bystatistically independent propagation phenomena. This resultsin time diversity.
Decoder 2 uses the a priori LLRs A(c2) and A(u2) inorder to generate improved extrinsic LLRs E(u2), which arethen de-interleaved and passed to Decoder 1 as a prioriLLRs, as shown in Fig. 1. In other words, the interleaver/de-interleaver pair simply order the soft information in the correctorder. Decoder 1 then uses the a priori LLRs for getting animproved extrinsic LLRs E(u1), which are then passed toDecoder 2 for further iterations.
Fig. 1 shows the block diagram of a non-systematic parallelconcatenated code. It is possible to design a systematic parallelconcatenated code, where in addition to encoding the inputbit stream in encoders 1 and 2, the input bit stream is simplypassed to the output. In the decoder of the systematic parallelconcatenated codes, the extrinsic information is exchangedbetween the two constituent decoders, while also benefitingfrom the a priori LLRs provided for the systematic bits [54].
Fig. 1 shows a parallel concatenated code using two con-stituent codes. It is possible to use more than two constituentcodes leading to multiple-stage turbo codes [4, 18, 55]. Addi-tionally, the constituent codes used in turbo codes may be fromany arbitrary channel code family, although ConvolutionalCodes (CC) are used most frequently.
On the other hand, iterative decoding may be applied toserially concatenated systems as shown in Fig. 2 and Fig. 3 for
two-stage and three-stage concatenated systems, respectively.Fig. 2 shows the encoder and decoder block diagrams of atwo-stage serially concatenated system consisting of an outerencoder, Encoder 1 of Fig. 2, followed by an interleaverconnected to an inner encoder, Encoder 2 of Fig. 2. Again, theinterleaver is used for introducing time-diversity by scramblingthe bit sequence and hence providing independent a prioriinformation, which is capable of reducing the effects of deepfades on the output of the outer decoder. As shown in Fig. 2,the input bit stream u1 is first encoded by Encoder 1 togenerate the bit sequence c1, which is then interleaved byinterleaver Π of Fig. 2. The interleaved bit stream u2 is thenencoded by Encoder 2 to produce the bit stream c2. In thedecoder of the two-stage serially concatenated codes, the apriori LLRs A(c2) of bits c2 are passed to Decoder 2, whichoutputs its extrinsic LLRs E(u2). The output of Decoder 2 isthen de-interleaved and passed to Decoder 1 as a priori LLRs,as shown in Fig. 2. Similarly to parallel concatenated codes,the role of the interleaver/de-interleaver pair is to ensure thecorrect ordering/alignment of the a priori information.
Decoder 1 then decodes the input soft information andoutput its extrinsic LLRs E(c1), which are then interleavedand passed back to Decoder 2 as a priori LLRs. Decoder2 then uses its a priori LLRs input in order to provideimproved extrinsic LLRs, which are passed to Decoder 1and are then used for further iterations, as shown in Fig. 2.After the last iteration, Decoder 1 outputs the extrinsic LLRsfor its data input stream E(u1), which can be passed toa hard decision decoder. In the receiver of the two-stagesystem shown in Fig. 2 iterative decoding is implementedby exchanging soft information between the two constituentdecoders [1, 4, 52, 54]. Over the years, the concept of iterativedecoding of serially concatenated schemes was extended toturbo equalisation [4, 56], coded modulation [21, 57], multi-user detection [58] and to joint channel-estimation and data-detection plus synchronisation as well as joint source-channeldecoding [1, 59, 60].
Similarly, the serially concatenated design may be extendedto more than two constituent codes [1, 36, 42, 53] as shownin Fig. 3 for a three-stage system. Fig. 3 shows the blockdiagrams of the encoder and decoder for a three-stage seriallyconcatenated code. As shown in Fig. 3, the data is encoded inthree constituent encoders Encoder 1, Encoder 2 and Encoder3, invoking the interleavers Π1 and Π2 between the encoders.In the decoder of the three-stage serially concatenated codesof Fig. 3, extrinsic information is exchanged between the threeconstituent decoders in order to attain an improved BER.
A. Interleaver Design
Interleavers are used between the constituent codes ofboth serial or parallel concatenated structures in order toreduce the correlations between the data exchanged betweenthe decoders and hence to provide as independent extrinsicinformation between the constituent decoders as possible [25].Furthermore, the interleavers are also useful in terms ofspreading a burst of errors across the whole decoded frame,hence effectively transforming a bursty channel into a randomchannel. As a benefit, the errors in a codeword appear to
4 IEEE COMMUNICATIONS SURVEYS & TUTORIALS, ACCEPTED FOR PUBLICATION
Encoder 1 Encoder 2 Encoder 3Π1 Π2
Decoder 3 Decoder 2 Decoder 1Π−1
2
Π2
Π−11
Π1
u1 c1 u2 c2 u3
A(u2)
E(u3)
E(c2)A(u3)
E(u2)A(c2) A(c1)
E(c1)
c3
A(c3) E(u1)
Fig. 3. Encoder and decoder structure of a three-stage serial concatenated code [54].
be independent [61]. Furthermore, using longer interleaverstypically leads to more Gaussian-like LLR distributions andhence the system’s performance may approach Shannon’scapacity limit more closely [25]. The interleaver has beenshown to be an essential component of iterative decoding andits length is the dominant factor in determining the code’sdistance properties, which in turn determines the asymptoticperformance of iteratively decoded systems [61–63]. The goalof the interleaver is to improve the distance properties of thecode [64]. In summary, the interleaver design substantiallyaffects both the BER “turbo cliff” as well as the error floor.
Several interleaver designs were proposed in [61] for in-creasing the minimum Hamming distance of parallel con-catenated codes. According to [61], at high SNR values, theasymptotic BER of a turbo code decreases linearly uponincreasing the interleaver length. The interleaver designs maybe categorised as random and deterministic. The randominterleavers actually rely on pseudo-random sequences [61].Several pseudo-random interleavers, such as the S-randominterleaver, were described in [65]. On the other hand, thedeterministic interleavers are parametrised and hence do notrequire as large a memory as a random interleaver. Severaldeterministic interleaver designs were presented in [61].
In contrast to parallel concatenated turbo codes, the seriallyconcatenated codes use interleavers associated with differentHamming distance properties [64]. A theoretical frameworkconceived for the optimisation of interleavers designed forserially concatenated systems was presented in [66], wherethe optimisation cost function was related to the asymptoticperformance of the system. In [67], an interleaver was pro-posed for serially concatenated convolutional codes, whichwas designed for mitigating the correlation between theneighbouring LLRs. This approach increased the minimumHamming distance and hence reduced the corresponding errorfloor. Finally, an interleaver algorithm was proposed in [64]for achieving a specific minimum Hamming distance, whichis limited only by the degree of freedom offered by theinterleaver length. This design was capable of providing afurther improved error floor performance compared to theprevious designs.
B. Log-likelihood ratios
The soft information exchanged between the constituentdecoders of Fig. 1, Fig. 2 and Fig. 3 is used in the formof Logarithmic-Likelihood Ratios, or LLRs for short. Theconcept of LLR was proposed by Robertson in [68] in orderto simplify the passing of information between the constituentdecoders and is now widely used in iterative decoding litera-
0 0.1 0.2 0.3 0.4 0.5 0.6 0.7 0.8 0.9 1−8
−6
−4
−2
0
2
4
6
8
P(uk=+1)
LLR(uk)
Fig. 4. LLR versus the probability of uk = +1.
ture. The LLR of a bit bk is defined as follows:
L(bk) � ln
(P (uk = +1)
P (uk = −1)
), (1)
where L(bk) denotes the LLR of bit bk and is defined as thelogarithm of the ratios of the probability of the bit bk assumingits two legitimate values. P (uk) denotes the probability of bituk having values of +1 and −1.
Fig. 4 shows how the LLR varies with the probability ofuk = +1. As seen in Fig. 4, the sign of the LLR indicateswhether the bit uk is more likely to be +1 or −1, while themagnitude of the LLR gives an indication of how likely it isthat the sign of the LLR gives the correct value of uk. Whenthe LLR L(uk) ≈ 0, the probability that the bit uk = +1is equivalent to the probability that the bit uk = −1, i.e.P (uk = +1) = P (uk = −1) = 0.5, which indicates thatthere is no real certainty about the value of uk. On the otherhand, when L(uk) � 0, then P (uk = +1) � P (uk = −1)and hence it is highly likely that uk = +1. Similarly, whenL(uk) � 0, then P (uk = +1) � P (uk = −1) and hence itis highly likely that uk = −1.
III. EXIT CHART ANALYSIS
The main objective of employing EXIT charts proposedby Stephan ten Brink [24, 25], is to predict the convergencebehaviour of the iterative decoder by examining the evolutionof the input/output mutual information exchange between theconstituent decoders in consecutive iterations. The applicationof EXIT charts is based on two assumptions, namely on havinga high interleaver length [1], which ensures that

EL-HAJJAR and HANZO: EXIT CHARTS FOR SYSTEM DESIGN AND ANALYSIS 5
SoftDecoder
Encoder cx LeLa
Fig. 5. A block diagram of an encoder and its corresponding soft decoderaccepting apriori LLRs and outputting extrinsic LLRs.
• the a priori LLR values are fairly uncorrelated;• the probability density function of the a priori LLR
values is Gaussian.
The EXIT chart analysis may be applied for visualisingthe convergence behaviour of serially concatenated systems,parallel concatenated systems and hybrid systems combiningserial and parallel concatenation. We will continue by high-lighting the concept of EXIT charts with the aid of seriallyconcatenated system design examples, noting that the analysiscan be extended to parallel concatenated and hybrid systems.In the following, we will describe the concept of mutualinformation followed by illustrative examples of using EXITcharts for characterising iteratively decoded systems.
A. Mutual information
The theoretical foundations of information theory are basedon Shannon’s pioneering work [3], including the concept ofMutual Information (MI) which forms an introduction to theconcept of EXIT charts.
Consider an information source generating “q” equi-probable levels, with each level having a probability of pi =1/q, where i = 1, · · · , q. The information carried by any ofthe q levels is defined as [4, 54, 69]
I = log2
(1
pi
)= log2 (q) . (2)
The average information per message emitted by a sourceis referred to as its entropy, which is defined as [4, 54, 69]:
H =
q∑i=1
piIi =
q∑i=1
pi log2
(1
pi
)=
q∑i=1
pi log2 (q) bits.
(3)When data is transmitted over a non-ideal channel, impair-
ments are introduced and hence the received symbol Y mightbecome different from the transmitted symbol X . DenoteP (Xi) as the probability that Xi was transmitted and P (Yj) asthe probability that Yj was received. Then, P (Xi, Yj) denotesthe joint probability that Xi was transmitted and Yj wasreceived, while P (Xi/Yj) denotes the conditional probabilitythat Xi was transmitted, given that Yj was received. Bycontrast, P (Yj/Xi) denotes the conditional probability thatYj was received, given that Xi was transmitted [4, 54]. TheMI of Xi and Yj is defined as:
I(Xi, Yj) = log2
(P (Xi/Yj)
P (Xi)
)
= log2
(P (Yj/Xi)
P (Yj)
)bits. (4)
The average MI, which gives the average amount of source
0 1 2 3 4 5 6 7 80
0.1
0.2
0.3
0.4
0.5
0.6
0.7
0.8
0.9
1
σA=J−1(I
A)
I A=J(σ)
Fig. 6. The MI IA = J(σ) as a function of σA evaluated usingEquation (10).
information acquired per received symbol, can be defined as:
I(X,Y ) =∑x,y
P (Xi, Yj) · I(Xi, Yj) (5)
=∑x,y
P (Xi, Yj) · log2(P (Xi/Yj)
P (Xi)
)bits/symbol.
Consider the encoder and its corresponding Soft-Input Soft-Output (SISO) decoder shown in Fig. 5. The encoder encodesthe bit stream x and outputs the encoded bit stream c. Onthe other hand, the decoder’s input is comprised of the apriori LLRs denoted by La and its output extrinsic LLRs aredenoted by Le. The MI between the information bit stream xand the decoder’s a priori LLRs La may be formulated asIA = I(x;La), 0 ≤ IA ≤ 1, and is used for quantifying theinformation content of the a priori knowledge [70]:
I(x, La) = IA (6)
=1
2·
∑x=−1,+1
∫ +∞
−∞pA(ζ|X = x)
· log22 · pA(ζ|X = x)
pA(ζ|X = −1) + pA(ζ|X = +1)dζ,
where pA(ζ|X = x) is the conditional PDF associated withthe a priori LLR La and the information bits x are assumedto be equiprobable, i.e. we have P (x = +1) = P (x = −1) =1/2.
In order to compute the MI IA of Equation (7), theconditional PDF pA(ζ|X = x) of the LLR La has to beknown. If we model the a priori LLR La as an independentzero-mean Gaussian random variable nA having a variance ofσ2A, in conjunction with the encoder’s input bits b ∈ {0, 1} or
equivalently x ∈ {−1,+1} as shown in Fig. 5, the a prioriinput La may be written as [24]
La = μA · x+ nA, (7)
where we have μA = σ2A/2, since La is an LLR-value
obeying the Gaussian distribution provided that the interleaverused in the system is sufficiently long [71]. Accordingly, theconditional probability density function of the a priori inputLa obeys:
pA(ζ|X = x) =1√2πσA
exp
⎛⎜⎝−
(ζ − σ2
A
2 · x)2
2σ2A
⎞⎟⎠ . (8)

6 IEEE COMMUNICATIONS SURVEYS & TUTORIALS, ACCEPTED FOR PUBLICATION
-1.0
-0.8
-0.6
-0.4
-0.2
0.0
0.2
0.4
0.6
0.8
1.0
La
0 100 200 300 400 500 600 700 800 900 1000
Bit index
.......................................................................................................................................................................................................................................................................................................................................................................................................................................................................................................................................................................................................................................................................................................................................................................................................................................................................................................................................................................................................................................
IA=0
Fig. 7. Soft output from the soft decoder of Fig. 5 for a transmitted streamof x = +1 and a mutual information IA = 0.
-10
-8
-6
-4
-2
0
2
4
6
8
10
La
0 100 200 300 400 500 600 700 800 900 1000
Bit index
.
.
.
.
.
.
...
.
.
.
..
..
.
.
..
.
.
.
.............
..
....
.
..
..
.
.
.
..
.
..
.
...
.
.
..
.
.
..
..
.
..
..
..
.
.
..
.
.
.
.
.
..
.
.
.
.
.
.
.
.
.
....
.
.
.
..
.
.
.
.
........
.
.
..
.
...
...
.
.
.
..
.
..
.....
.
..
.....
.
.
.
.
..
.
.
.
.
.
..
.
..
.
.
.
.
.
.
.
.
.
.
.
.
.
.
.
.
........
.
.
..
.
..
.
.
.
.
.
.
....
.
..
.
..
.
...
.
...
.
..
.
.
..
..
.
...
.
.
...
.
.
..
.
..
.
..
.
.
..
..
.
.
.
...
.
.
.
..
.
..
.
........
..
...
.
.
.
..
.
...
.
...
.
.
...
...
..
.....
.
.
.
.
.
..
.
.
.
.
.
.
.
..
.
..........
.
..
.
.
.
.
.
.
.
...
..
.
...
.
..
..
.
.
.
...
.
.
..
..
...
.
.
..
......
..
.
.
.
.
.
.
..
.
..
.
..
....
.
..
.
.
.
..
...
.
.
..
.
..
.
.
..
.
..
.
.
.
.
.
...
.
.
.
.
.
.
.
..
..
..
.....
.
.
.
.
.
..
...
...
..
.
.
.
.
....
.
.
.
.
.
.
.
..
.
.
.
..
...
...
.....
.
.
.
..
...........
...
..
.
..
.
.
.
..
.
.
.
...
.
.
.
.
..
.
.
.
..
.
..
.
.
.
.
.
.
.
.
..
.......
.
.......
.
.
.
.
.
..
...
.
.
.
.
.
.
.
....
.
.
.
.
.
..
.
.
.
.
.
.
.
.
.
.
.
...
.
.
.
.
..
.
.
.
.
..
...
....
..
.
.
.
.
.
..
.
.
.
.
.
.
.
.
.
..
.
.
.
.
.
...
.
.
.
.
..
.
.
...
.
.
...
...
...
.
.
.
......
.
..
.
.
.
......
.
.
..
.
.
.
.
.
.
..
..........
..
.
..
.
.
.
.
.
.
.
.
..
.
.
..
...
..
.
..
.
.
.
..
.
.
.
.
.
..
..
.
.
.
......
.
...
.
.
.
...
.
...
..
...
..
.
.
.
....
.
.
........
.
.
..
.
.
.
..
.
.
...
.
.
....
..
.
.
.
..
.
.
.
..
.
.
...
.
.
..
..
.
.
.
.
...........
.
.
.
..
...
...
.
.
.
.
.
........
.
..
..
.
.
.
..
..
.
.
..
.
.
.
..
...
..
.
.
.
..
..
..
.
..
.
.
.
.
.
.
.
.
...
.
..
...
....
.
.
..
.
.
.
...
....
.
...
.
..
.
.
.
.
.
..
..
.
...
..
.
IA=0.5
Fig. 8. Soft output from the soft decoder of Fig. 5 for a transmitted streamof x = +1 and a mutual information IA = 0.5.
Consequently, the MI IA given in Equation (7) may alter-natively be expressed as:
IA(σA) = 1− 1√2πσA
∫ +∞
−∞exp
⎛⎜⎝−
(ζ − σ2
A
2
)2
2σ2A
⎞⎟⎠
· log2[1 + e−ζ
]dζ. (9)
For notational simplicity and in order to highlight theexplicit dependence of IA on σA, the following abbreviationis introduced [24, 25]
J(σ) := IA(σA = σ), (10)
where the function J(σ) is monotonically increasing andtherefore its inverse exists. Additionally, the J(σ) function ischaracterised by limσ←0 J(σ) = 0, limσ←∞ J(σ) = 1, σ > 0.Fig. 6 shows a plot of J(σ) as a function of σ.
It was shown in [35] that the MI between the equiprobablebits X and their respective LLRs L for symmetric andconsistent1 L-values always obeys:
I(X ;L) = 1−∫ +∞
−∞p(L|X = +1) · log2
[1 + e−L
]dL
= 1− EX=+1
{log2
[1 + e−L
]}, (11)
where EX is the expectation value of X .For the sake of further illustrating the relation between the
LLR and the corresponding MI, Figs. 7–10 show how the
1The LLR values obeying a symmetric distribution of p(−ζ|X = +1) =p(ζ|X = −1) are said to satisfy the consistency condition [35] iff p(−ζ|X =x) = e−xζp(ζ|X = x) holds.
-20
-15
-10
-5
0
5
10
15
20
La
0 100 200 300 400 500 600 700 800 900 1000
Bit index
...
.
.
.
.
.
.
..
.
.
...
.
..
.
.
.
.
.
..
......
....
.
.
.....
.
..
.
.
.
..
.
..
..
..
..
...
.
.
.
.
.......
.....
..
.............
.
...
....
.
.
.
.
..........................
.
.
..
.
.
.
...
..
.
.
.
.
...
...
.
...
.
.
..
.
.
.
.
.
.
...
.
.
.
..
.
.
.
...
..
...
.
...
..
..
.
.
..
...
...........
..
....
.
.
.
.
..
...
.
.
.
..
..
.
......
.
..
...
..
.
.
..
.
.
.
..
...........................
.
.
......................................
.
.
.
.
..
.
..
..........
.
.
.
.
.
.
...
.
....
.
.
..
.
.
.
.
.
.
.
...
.
..
.
.
..
.
..
.
.
........
.
.
..
.
.
..
.
.
.
...
.
.
.
.
.
.
..
.
..
....
.
...
...
.
.
.
.
.
.
.
.
.
..
.
..
..
......................
.
.
.
.
..
.
..
.
.
...
..
.
.
.
.
.......
.
.
..
.
.
.
.
.
..
..
...
.
.
..
..
.
...
.
..
.
.
.
.....
.
..
.
.
.
...
.
.
.
.
..
.
..
.
.
.
.
.......................
.
.
...
.
.
.....
.
...
.
...
.
.
..
.
.
.
.
.
.
..
.
.
..
..
.
...
........
.
.
.
..
.
.
..
.
.
....
.
...
.
.
.
...
.
.
.......
.
.
...
.
.
.
..
.
.
.
.
.......
.........
.
.
.
...
...
...
.
...
...
.
...................
.
.
....
..
.
.
..
...
.
.
...............
.
.
..
.
.
.
.
.
.
.
.
...
.
.
.
.
..
.
..
...
.
.
.
..
.
..
.
..
.
..
.
.
.
.
.
..
.
.
.
..
.
.
.............................
.
.
..
...
.
.
.
..
..
.
........................
.
..
.
..
.
.
.
.
.
.
.
.
.
.
.
.
.
.
.
.
...
.
..
.
.
.
...
...
.
..
.
..
..
............
...
....
.
.
.
.
.
...........
.
.
..
.
.
.
.
..
.
.
.
..
.
.
.
...
.
.
.
.
.
.
..
.
.
...
.
IA=0.8
Fig. 9. Soft output from the soft decoder of Fig. 5 for a transmitted streamof x = +1 and a mutual information IA = 0.8.
-10
0
10
20
30
40
50
La
0 100 200 300 400 500 600 700 800 900 1000
Bit index
.....
...
.
.
.
.
.
.
...
..
.
.
.
.
.
.
.
.
.
.
.
.
.
.
...
...
..
.
..
.
.
.
..
...
.
.
..
.............
.
.
.
..
.
.
.
.
.
.
.
.
.
..
.
.
.
.
...
.
.
.
.
..
.
..
..
..
...
..
.
.
.
.
.
.
.
...
.
.
.
..
..
.
.
.
.
.
....
.
.
.
.
.
.
..
.
.
.
...
.
.
..
.
.
.
.
.
...
..
.
.
.
...
.
.
...
.
.
.
.
.
.
...
...
.
.
..
.
..
.
..
.
.
.
..
.
.
.
.
..
..
.
.
.
.
.
.
.
.
.
..
.
....
.
.
.
.
..
.
.
.
.
..
.
.
.............
..
.....
.
...
.
.
.........
.
.
.
.
.
.
.
.
.
..
...
.
.
..
..
.
.
.
..
.
.
...........
.
...
..
.
...
.
.
.
.
.
..
.
.
.
.
.
.
.
.
..
.
.
..
.
.
.
.
.
...
.
..
.
..
.
.
.
.
.
......
.
..
.
.
.
.
.
.
..
.
.
.
.
.
.
.
..
.
.
.
.
.
.
.
.
.
.
.
.....
.
.
.
.
.
..
...
.
.
.
..
.
.
..
.
..
.....
.
.
.
..
.
..
.
.
.
.
.
.
.
.......
.
.
.
..
.
..
.
.
.
.
.
.
.
.
.
.
.
.
.
...
.
..........
...
..
.
.
.
.
.
.
...
...
.
.
...
..
.
.
.
..
.
..
.
..
.
.
.
.
.
..
.
.
.
.
.
.
.
.
..
.
.
.
.
.
.
.
.
.
.
.
.
.
..
.
.
..
.
....
.
.
..
..
.
.
..
.
.
.
.
..
.
..
.
..
.
.
.
.
.
.
.
.
.
.
..
.
.
.
...
.
.
.
.
..
.
.
.
.
..
.
.
..
..
.
.
.
.
.
.
...
..
.
...
.
.
.
.
.
.
..
.
.
.
.
.
.
.
.
.
.
.
.
.
.
.
.
.
..
.
.
.
..
..
.
.
.
..
.
.
.
.
.
.
.
.
..
.
...
.
.
.
.
.
.
.
..
.
..
.
.............
.
.
..
.
.
..
.
..
.
.
.
.
.
..
...
.
.
..
.
.
..
..
.
.
.
.
.
.
.
.
.
.
.
.
.
..
.
.
.
.
..
.
.
.
.
.
..
.
.
...
.
..
.
.
.
.
.
..
.
..
..
..
.....
.
.
.
.........
.
.
.
.
..
.
....................
.
.
..
.
.
.
.
.
.
.
...
.
.
.
..
.
.
.
.
.
.
..
.
.
.
.
.
....
..
...
.
.
.
..
......
.
.
.
.
.
.
.
.
.
..
.
..
.
..
.
.
.
...
.
.
.
...
.
..
.
.
.
.
.
..
.
.
.
.
.
.
.
..
.
..
.
.
.
.
.
.
.
..
.
.
.
.
..
.
.
.
.
.
.
.
..
.
.
.
.
.
.......
...
.
.
.
.
.
....
.
.
.
...
IA=1.0
Fig. 10. Soft output from the soft decoder of Fig. 5 for a transmitted streamof x = +1 and a mutual information IA = 1.0.
LLRs La vary with the corresponding MI values. The bitsequence in this case consists entirely of logical ‘1’s, whichis equivalent to x = +1, implying that a positive LLR valueLa corresponds to a correct hard decision, while a negativeone corresponds to an incorrect hard decision. As shown inFig. 7, an all-zeros LLR sequence corresponds to a MI of0, indicating a low confidence that the transmitted bits are1 or 0. More explicitly, the probabilities that a 1 or 0 istransmitted are equal. It may be seen from Figs. 7–10 thatas the number of negative LLR values decreases, i.e. moreLLRs become positive, and the LLR magnitude increases,the corresponding MI increases. By contrast, when the LLRmagnitudes are high positive numbers, the MI approaches 1,as shown in Fig. 10. Conversely, when the MI is low, i.e.close to 0, the corresponding LLRs will have a low magnitudeand the wrong sign. As seen in Figs. 7–10, when the MIvalue increases, the number of LLRs with the incorrect sign isreduced and the magnitude of the correct LLRs is increaseduntil all the LLRs reach a high magnitude with the correctpolarity, corresponding to a MI of 1.
B. EXIT chart analysis of a two-stage serially concatenatedsystem
The block diagram of a two-stage serially concatenatedsystem is shown in Fig. 11, where the transmitted sourcebit stream b is convolutionally encoded by a 1/2-rate Recur-sive Systematic Convolutional (RSC) code generating the bitstream c, which is then interleaved by a random bit interleaverΠ. The bit interleaved sequence u is then mapped to the

EL-HAJJAR and HANZO: EXIT CHARTS FOR SYSTEM DESIGN AND ANALYSIS 7
QPSKDemapper
RSCDecoder
QPSKMapper
RSC Encoder
Π
Π−1
Πc u
sb
DecisionHard
r
Lo,e(c)
Lo,a(c)
Li,a(u)
Li,e(u)
Fig. 11. Block diagram of a two-stage iteratively decoded system usingQPSK modulation and RSC code.
symbol-stream s in the QPSK mapper. The resultant set ofsymbols may then be transmitted through the channel. Weconsider a temporally correlated narrowband Rayleigh fadingchannel, associated with a normalised Doppler frequency offD = fdTs = 0.01, where fd is the Doppler frequencyand Ts is the symbol duration. The complex Additive WhiteGaussian Noise (AWGN) of n = nI + jnQ contaminatesthe received signal, where nI and nQ are two independentzero-mean Gaussian random variables having a variance ofσ2n = σ2
nI= σ2
nQ= N0/2 per dimension, with N0/2
representing the double-sided noise power spectral densityexpressed in W/Hz.
At the receiver of Fig. 11, the SISO RSC decoder iterativelyexchanges extrinsic information with the soft demapper. TheRSC decoder invokes the Bahl-Cocke-Jelinek-Raviv (BCJR)algorithm [14] on the basis of a bit-based trellis [72]. AllBCJR calculations are performed in the logarithmic proba-bility domain for the sake of converting multiplications toadditions and using a lookup table for correcting the Jacobianapproximation in the Log Maximum Aposteriori Probability(Log-MAP) algorithm, as discussed in [4, 73, 74].
The extrinsic soft information, represented in the form ofthe LLRs exmplified in Fig. 4 [71], is iteratively exchangedbetween the demapper and the RSC decoder of Fig. 11 for thesake of assisting each other’s operation, as detailed in [4, 19].In Fig. 11, L(·) denotes the LLRs of the bits concerned, wherethe subscript i indicates the demapper, also often termed asthe inner ‘decoder’, while o corresponds to outer RSC decodercomponent. Additionally, the subscripts a and e denote thededicated role of the LLRs with a and e indicating a prioriand extrinsic information, respectively.
As shown in Fig. 11, the received complex-valued symbolsr are demapped to their LLR representation for each of thechannel-coded bits of a QPSK symbol. The demapper’s extrin-sic output LLRs Li,e(u) are deinterleaved by a soft-bit dein-terleaver, as seen in Fig. 11 to generate the soft bits Lo,a(c),which are passed to the RSC decoder as apriori LLRs inorder to compute the extrinsic LLR values Lo,e(c) providedby the Log-MAP algorithm [4, 73] for all the channel-codedbits. During the last iteration, only the LLR values of theoriginal uncoded systematic information bits b are required,which are passed to the hard decision decoder of Fig. 11 inorder to determine the estimated transmitted source bits. Asseen in Fig. 11, the extrinsic information generated by theRSC decoder is then fed back to the demapper as the a prioriinformation Li,a(u) after appropriately reordering them usingthe interleaver of Fig. 11. The demapper of Fig. 11 exploits
Mapperx
(σn ↔ Eb/N0)Channelset
Ii,aσA = J−1(Ii,a) Li,a =
σ2A
2 x+ nA
CalculateIi,e
Demapper
Li,a
Li,e
Fig. 12. Evaluation of the demapper transfer characteristic.
0.0
0.2
0.4
0.6
0.8
1.0
I i,e(
u)
0.0 0.2 0.4 0.6 0.8 1.0
Ii,a(u)
QPSKEb/N0=1dB
GMAGM
Fig. 13. Symbol-to-bit demapper EXIT characteristics for different bit-to-symbol mapping for the system shown in Fig. 11 operating at Eb/N0=1.0 dB.The number of possible AGM bit-to-symbol mapping schemes depends on thespecific modulation scheme considered and here the one having the steepestgradient was provided.
the a priori information for the sake of providing improvedextrinsic LLR values, which are then passed to the channeldecoder and then back to the demapper for further iterations.1) Transfer characteristics of the inner demapper: In order
to quantify the information content of the extrinsic LLR valuesLi,e(u) at the output of the demapper, the mutual informationIi,e(u) = I [U ;Li,e(u)] can be used. As seen in Equation (7)in Section III-A using the PDF pE of the extrinsic output LLRLi,e(u), Ii,e(u) can be expressed as [70]:
Ii,e(u) =1
2·
∑x=−1,+1
∫ +∞
−∞pE(ζ|U = u) (12)
· log22 · pE(ζ|U = u)
pE(ζ|U = −1) + pE(ζ|U = +1)dζ,
or in terms of the function J(.) as
Ii,e(u) = J(σi,e), (13)
where σi,e is the standard deviation of the extrinsic LLRs ofthe inner decoder.
Observe in Fig. 11 that Ii,e(u) is a function of both Ii,a(u)and the Eb/N0 value encountered, hence the demapper’sextrinsic information transfer characteristic is defined as [25,26, 46]
Ii,e(u) = Ti [Ii,a(u), Eb/N0] . (14)
Fig. 12 illustrates how the EXIT characteristicTi [Ii,a(u), Eb/N0] is calculated for a specific

8 IEEE COMMUNICATIONS SURVEYS & TUTORIALS, ACCEPTED FOR PUBLICATION
RSCEncoder
OuterDecoder
Loa =σ2A
2 c+ nA
setIo,a
CalculateIo,e
x c
σA = J−1(Io,a)
Lo,a Lo,e
Fig. 14. Evaluation of the RSC decoder’s EXIT characteristics.
[Ii,a(u), Eb/N0] input combination. First the noise varianceσn of the wireless channel is set according to the Eb/N0 valueconsidered. Then, σA is calculated based on that specificvalue of Ii,a(u), where the EXIT curve has to be evaluatedusing the inverse function σA = J−1(Ii,a(u)) expressed fromEquation (10) and plotted in Fig. 6. Next, σA is used forcreating Li,a(u) according to Equation (7), which is appliedas the a priori input of the demapper. Finally, the mutualinformation of Ii,e(u) = I [U ;Li,e(u)], 0 ≤ Ii,e(u) ≤ 1,between the outer coded as well as interleaved bits u and theLLR values Li,e(u) is calculated using Equation (13) withthe aid of the PDF pE of the extrinsic output Li,e(u). Thisrequires the determination of the distribution pE by meansof Monte Carlo simulations. However, according to [35], byinvoking the ergodicity theorem of Equation (11), namely byreplacing the ensemble average by the time average, the MIcan be estimated using a sufficiently large number of sampleseven for non-Gaussian or unknown distributions, which canbe formulated as [35]:
Ii,e(u) = I [X ;Li,e(u)]
= 1− EX=+1
{log2
[1 + e−Li,e
]}
≈ 1− 1
N
N∑n=1
log2[1 + e−x(n)·Li,e(n)
]. (15)
Fig. 13 shows the extrinsic information transfer character-istics of the QPSK demapper in conjunction with differentbit-to-symbol mapping schemes. As shown in Fig. 13, GrayMapping (GM) does not provide any iteration gain uponincreasing the MI at the input of the demapper. However, usingthe multi-dimensional hupercube labelling defined for QPSKin [75, 76], which we refer to as Anti-Gray Mapping (AGM)2,results in different EXIT characteristics, as illustrated by thecontinuous line seen in Fig. 13.2) Transfer characteristics of the RSC decoder: The EXIT
characteristic of the RSC decoder of Fig. 11 describes therelationship between the RSC apriori input Lo,a(c) and theRSC extrinsic output Lo,e(c). The RSC decoder has a singleinput namely the a priori input Lo,a(c) provided by thesymbol-to-bit demapper. Therefore, the EXIT characteristicsof the outer channel decoder is independent of the Eb/N0
value and hence may be written as
Io,e(c) = To [Io,a(c)] , (16)
where Io,a(c) = I [C;Lo,a(c)], 0 ≤ Io,a(c) ≤ 1, is theMI between the RSC coded bits c and the apriori LLR
2Any bit-to-symbol mapping, which is not a Gray mapping, is termed asAGM.
0.0
0.2
0.4
0.6
0.8
1.0
I o,e(c
)
0.0 0.2 0.4 0.6 0.8 1.0
Io,a(c)
RSC code
Constraint length K=3(Gr,G) = (7,5)Constraint length K=4(Gr,G) = (13,15)Constraint length K=5(Gr,G) = (23,31)
Fig. 15. Extrinsic information transfer characteristics of 1/2-rate RSC codeshaving different constraint lengths.
0.0
0.2
0.4
0.6
0.8
1.0
I o,e(c
)
0.0 0.2 0.4 0.6 0.8 1.0
Io,a(c)
RSC codeConstraint length K=3
(Gr,G)(4,4)(4,5)(4,7)(5,7)(6,7)
Fig. 16. Extrinsic information transfer characteristics of 1/2-rate RSC codeshaving a constraint length of K=3 and different generator polynomials.
values Lo,a(c) and similarly, Io,e(c) = I [C;Lo,e(c)], 0 ≤Io,e(c) ≤ 1, is the MI between the RSC coded bits c andthe extrinsic LLR values Lo,e(c). The computational modelof evaluating the EXIT characteristics of the outer channeldecoder is shown in Fig. 14. As seen from the figure, theprocedure is similar to that of the demapper shown in Fig. 12,except that its value is independent of the SNR. Again,Io,e(c) = I [C;Lo,e(c)] can be computed either by evaluatingthe histogram based approximation of pE [25, 26, 46] and thenapplying Equation (13) or, more conveniently, by the timeaveraging method [35] of Equation (15) as
Io,e(c) = I [C;Lo,e(c)]
= 1− E{log2
[1 + e−Lo,e
]}
≈ 1− 1
N
N∑n=1
log2[1 + e−c(n)·Lo,e(n)
]. (17)

EL-HAJJAR and HANZO: EXIT CHARTS FOR SYSTEM DESIGN AND ANALYSIS 9
0.0
0.2
0.4
0.6
0.8
1.0I i,
e(u)
,Io,
a(c)
0.0 0.2 0.4 0.6 0.8 1.0
Io,e(c), Ii,a(u)
QPSK AGM0dB to 12dBsteps of 1dBRSC(2,1,3)(Gr,G)=(7,5)
0 dB
12 dB
Fig. 17. EXIT chart of an iteratively detected RSC-coded QPSK schemeof Fig. 11 in combination with the outer RSC(2,1,3) code using the GPof (Gr , G) = (7, 5), while communicating over a temporally correlatedRayleigh fading channel exhibiting a normalised Doppler frequency offD=0.01.
The EXIT characteristics of various 1/2-rate RSC codeshaving different constraint lengths K are shown in Fig. 15.The Generator Polynomials (GP) employed are given in thefigure’s legend in octal form, where Gr is the feedbackpolynomial and G is the feed-forward polynomial. Fig. 15demonstrates that for Io,a(c) > 0.5, the set of RSC codeshaving higher constraint lengths converge faster upon increas-ing Io,a(c) than the RSC codes having smaller constraintlengths. Furthermore, observe in Fig. 15 that the extrinsiccharacteristics of the RSC codes having constraint lengths ofK=3 and K=4 are close to each other. However, the specificshape of the two extrinsic MI curves is more dependent on thegenerator polynomial used, as shown in Fig. 16. Explicitly, theextrinsic transfer characteristics of several 1/2-rate RSC codeshaving a constraint length of K=3 and diverse GPs are shownin Fig. 16, where the code using the GPs (Gr, G) = (5, 7)converges faster than the other codes.
3) Extrinsic information transfer charts: The exchangeof extrinsic information in the system of Fig. 11 can bevisualised by plotting the EXIT characteristics of the innerdemapper and of the outer RSC decoder in an EXIT chart [24,25]. The outer RSC decoder’s extrinsic output informationIo,e(c) becomes the demapper’s a priori input informationIi,a(u), which is represented on the x-axis of the EXIT chart.Similarly, on the y-axis we plot the demapper’s extrinsicoutput information Ii,e(u), which becomes the outer RSCdecoder’s a priori input information Io,a(c). The EXIT curvespresented in this section correspond to the system employinga 1/2-rate RSC code having a constraint length of K=3,denoted as RSC(2,1,3), in conjunction with an octal GP of(Gr, G) = (7, 5).
Fig. 17 shows the EXIT chart of the iteratively detectedRSC-coded system of Fig. 11 employing QPSK relying on theAGM [75, 76] of Fig. 13. Ideally, in order for the exchange ofextrinsic information between the demapper and the outer RSC
0.0 0.2 0.4 0.6 0.8 1.0Io,e(c) at output of outer RSC decoder
10-5
10-4
10-3
10-2
10-1
1
BE
R
RSC (2,1,3) -> (2,1,9) (Io,e(c) 0.998)
(Io,e(c) 0.985)
(Io,e(c) 0.895)
(Io,e(c) 0.390)
Fig. 18. BER of different 1/2-rate RSC decoders using the maximum-free-distance GPs versus their extrinsic output IED
, when increasing the code’sconstraint length from K = 3 to K = 9.
0.0 0.2 0.4 0.6 0.8 1.0Io,a(c) at input of outer RSC decoder
10-4
2
5
10-3
2
5
10-2
2
5
10-1
2
5
1
BE
RConv. Code (2,1,3)Conv. Code (2,1,4)Conv. Code (2,1,5)Conv. Code (2,1,6)Conv. Code (2,1,7)Conv. Code (2,1,8)Conv. Code (2,1,9)
Fig. 19. BER of different 1/2-rate RSC decoders using the maximum-free-distance GPs versus their a priori input IAD
.
decoder to converge for the sake of achieving a vanishinglylow BER at a specific Eb/N0 value, the EXIT curve of thedemapper at the Eb/N0 value of interest and the extrinsic MItransfer curve of the outer RSC decoder should not intersectbefore reaching the (1.0, 1.0) point. This implies that givenIa = 1.0, we have Ie = 1.0 and provided that this conditionis satisfied, a so-called open-convergence tunnel [24, 25]appears in the EXIT chart. The narrower the tunnel, the moreiterations are required for reaching the (1.0, 1.0) point and thecloser the BER curve approaches the vertical line representingthe channel capacity. If however, the two extrinsic MI transfercharacteristics intersect at a point close to the vertical line atIi,a(u) = 1.0 rather than at the (1.0, 1.0) point, then a lowBER may still be achieved, although it will remain higherthan the BER of the schemes having an intersection at the(1.0, 1.0) point. These types of EXIT tunnels are referred tohere as semi-convergent tunnels. Observe in Fig. 17 that asemi-convergent tunnel exists at around Eb/N0=8.0 dB. Thisimplies that according to the predictions of the EXIT chartseen in Fig. 17, the iterative decoding process is expectedto converge at an Eb/N0 value between 8.0 dB and 9.0 dB.These EXIT chart based decoding convergence predictions areusually verified by the Monte-Carlo simulation based iterativedecoding trajectory, as will be discussed in Section III-B4.
Observe in the EXIT chart of Fig. 17 that once a semi-

10 IEEE COMMUNICATIONS SURVEYS & TUTORIALS, ACCEPTED FOR PUBLICATION
TABLE IIIo,a(c) REQUIRED AT THE INPUT OF THE RSC DECODER FOR ACHIEVING
A BER OF 10−4 .
Constraint length Required Io,a(c)3 0.8634 0.8325 0.8136 0.7837 0.7648 0.7319 0.710
0.0
0.2
0.4
0.6
0.8
1.0
I i,e(
u),I
o,a(
c)
0.0 0.2 0.4 0.6 0.8 1.0
Io,e(c), Ii,a(u)
QPSK AGMEb/N0=9dBRSC(2,1,3)Decoding Trajectory
Fig. 20. Monte-Carlo simulation based decoding trajectory of the iterativelydetected system of Fig. 11 in conjunction with QPSK using AGM atEb/N0 = 9.0 dB for an interleaver length of 800, 000 bits.
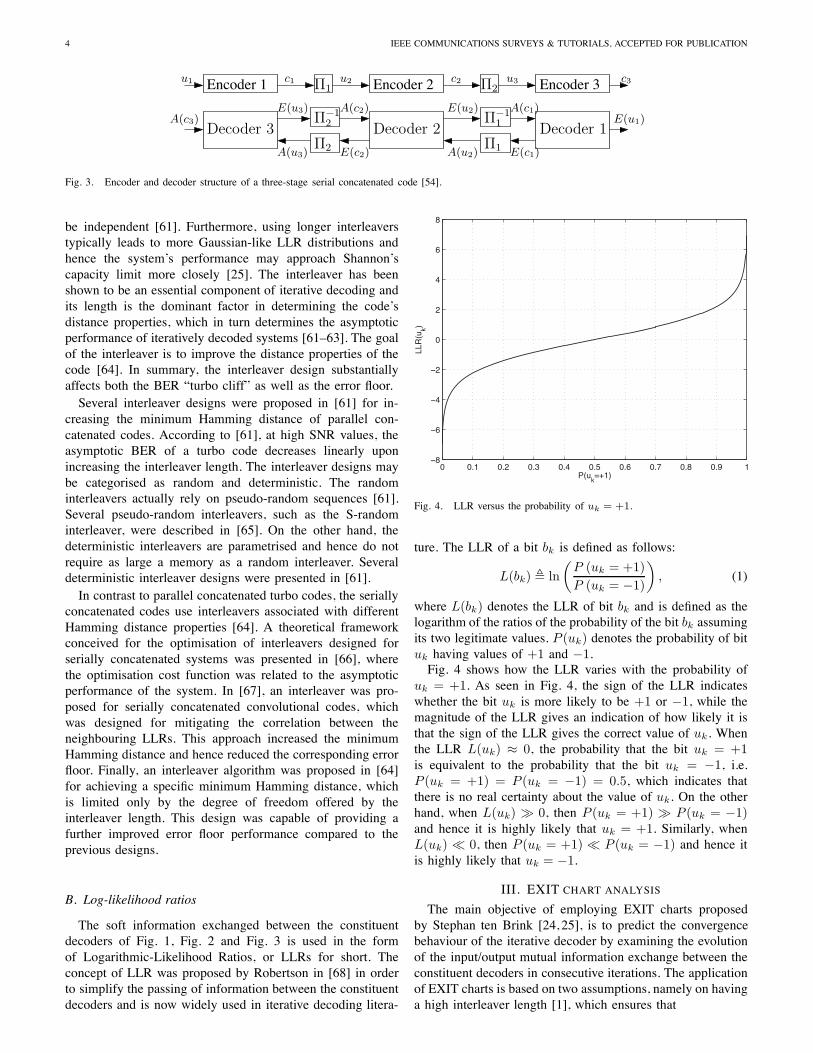
convergent tunnel is formed, the intersection point of theextrinsic MI transfer characteristic curves of the inner symbol-to-bit demapper and the outer RSC decoder gradually movestowards the (1.0, 1.0) point upon increasing the SNR. In orderto investigate how the position of the intersection point affectsthe BER performance, Fig. 18 shows the achievable BER asa function of the mutual information Io,e(c) at the output ofthe RSC decoder for different constraint lengths. Accordingto Fig. 18, the point of intersection should be at least atIo,e(c) = 0.985 in order to achieve a BER of 10−3, which ispractically independent of the RSC code’s constraint length.This is true, because Fig. 18 relates the MI at the output of theRSC decoder to the achievable BER. Fig. 19, however, relatesthe MI at the input of the RSC decoder to the achievable BER.The effect of the code’s constraint length becomes evidentin Fig. 19, since RSC codes having higher constraint lengthsrequire lower Io,a(c) values in order to achieve a similar BER.Table II summarises the Io,a(c) values required for achievinga BER of 10−4 at the input of the RSC decoder of Fig. 11.4) Decoding trajectory: As mentioned in Section III-B3,
the EXIT chart based convergence predictions can be verifiedby the Monte-Carlo simulation based iterative decoding trajec-tory. Fig. 20 illustrates the corresponding decoding trajectoryof the iteratively decoded system of Fig. 11 at Eb/N0 = 9.0dBin conjunction with QPSK AGM and using an interleaver
-50
-40
-30
-20
-10
0
10
20
30
40
50
Lo,
e(c)
0 100 200 300 400 500 600 700 800 900 1000
Bit index
.
.
.
..
.
.
.
.....
.
..
..
.
.
.
...
.
.
..........
.
.
..
.
.
.
.
.
.
.
..
.
...
.
.
..
.
.
.
.
.
..
.
.
...
.
.
.
.
.
..
.
.
..
....
...
.
..
.
.
.
.
..
.
.
.
.
.
.
......
.
.
..
...
.
..
.
.
.
.
.
.
.
.
.
..
....
..
.
.
..
..
.
.
.
.
.
.
.
.
.
.
.
.
...
.
.
.
...
.
..
.
..
.
.
..
.
.
.
.
.
..
.
.
.
....
.
..
.
.
.
.
.
.
.
.
.
.
.
.
.
...
.
.
.
.
..
.
.
.
.
.
.
.
.
...
.
.
.
.
..
.
.
.
.
..
.
.
.
.
.
.
.
.
..
.
.
.
.
.
.
..
.
.
.
.
..
.
..
.
.
.
.
.
.
.
.
.
.
.
..
.
.
...
.
.
.
..
..
..
.
.
.
.
.
...
.
.
.
.
.
.
.
..
.
..
...
.
..........
.
.
.
.
.
...
..
.
.
..
..
.
.
..
.
..
.
.
.
.
.
..
.
..
.
..
.
...
.....
.
..
.
..
.
..
..
..
.
.
.
.
.
.
.
...
.
.
.
..
.
.
.
.
.
..
.
...
.
.
.
.
.
..
.
.
.
.
.
..
.
...
.
.
.
....
.
.
.
.
.
.
.
.
.
.
.
.
.
.
.
.
.
.
.
.
....
.
.
.
.
..
.
.
.
..
.
.
.
.
.
..
.
.
..
.
.
.
.
....
.
.
.
.
.
.
...
.
.
.
...
.
.
.
....
.
.
.
..
.
.
.
..
.
.
.
.
.
...
.
.
.
.
..
.
.
...
.
.
...
.
.
.
.
...
.
.
.
.
.
.
.
.
..
.
.
..
.
.
.
.
.
..
.
.
.
.
.
.
.
.
.
.
..
.
.
.
.
...
.
.
.
.
.
.
.
....
.
.
.
.
....
..
.
.
.
.
.
.
.
..
.
.
.
.
.......
.
.
.
.
.
..
.
.
......
.
.
.
.
.
.
..
..
.
.
.
.
.
.
.
.
.
.
.
.
.
.
.
.
.
..
.
.
..
.
..
..
.
.
.
...
.
.
.
.
.
.
.
.
.
.
..
.
..
.
..
.
.
.
.
..
..
.
..
.
.
.
..
.
.
..
...
.
...
.
.
.
.
.
....
.
.
.
..
.
.
.
.
.
.
.
.
.
...
.
.
.
....
.
.
.
.
.
.
.
.
.
.
...
.
.....
.
...
..
.
..
.
.
.
.
.
.
..
.
.
.
.
..
.
.
.....
.
.
.
...
.
.....
.
..
.
.
.
.
.
.
..
.
.
.
.
.
.
.
.
..
.
.
.
..
.
..
.
.
.
.
....
.
.
.
..
.
.
.
.
..
.
...
.
.
.
.
.
.
....
.
.
.
..
.
..
..
...
.
..
.
.
..
...
.
.
.
.
.
.
.
..
.
.
.
..
...
.
..
..
.
.
.
..
.
.
.
.
.
.
..
.
.
.
.
.
.
.
.
.
Fig. 21. Soft output of the 1/2-rate, K = 3, (Gr , G) = (5, 7) RSCdecoder of Fig. 11 for a transmitted stream of all +1 during the first iterationat Eb/N0 = 9.0 dB. The mutual information at the output of the RSCdecoder is Io,e(c) = 0.886.
-40
-20
0
20
40
60
80
Lo,
e(c)
0 100 200 300 400 500 600 700 800 900 1000
Bit index
.
.
..
.
.
.
....
.
.
.
..
..
.
.
...
.
.
.
.
.
.
.
.
.
.
.
.
.
.
.
.
.
.
.
..
........
.
.
.
.
.
.
.
.
..
.
.
.
.
.
.
.
.
.
...........
.
.
.
.
.
...
.
.
..
...
.
.
.
..
.
.
.
.
.
..
...
.
.
.
.......
..
.
.
.
.
.
.
.
..
.
.
.....
..
.
..
.
.
..
.
..
..
.
..
.
..
..
.
..
..
.
......
.
.
.
.
..
.
..
.
.
.
.
.
.
.
.
.
..
.
.
.
.
.
..
..
...
................
.
..
.
.
.
....
.
.
.
........
.
.
...
.
......
.
.
.
.
.....
.
...
.
.
...
......
...
..
..
...
......
.
.......
.
..
.
..
..
.
.
.
.
.
..
.
.
.............
.
..
.
.
.
.
.
.
.
.
.
.
.
..
..
.
.
.
.
.
.
........
.
.
..
.
.
.
.
.
.
.
.
.
..
.
...
.
.
.
.
...........
.
.
.
...
.
.
.
.
..
.
...
.
...........
.
..
.
.
.
.
.
.
..
.
.
.
.
...
.
.
.
.
.
.
.
......
.
.
..
.
.
.
..
..
.
.
.
.
....
.
.....
.
.
....
.
.
.
.
.
.
.
.
.
..
.
......
.
.
.
..
..
.
.
.......
..
.
..
.
.....
.
.
.
.
..
...
.
.
.
.
.
....
.
.
.
..........
..
.
.
.
.
..
.
..
.
.
.
.
.
.
...
.
.....
.
...
.
.
...
..
.
.
..
.
.
..
..
..
.
..
..
.
..
..
.
.
...
.
.
.
..
......
.
.
....
.
.
.
.
..
.
..................
..
..
.
.
.
.
.
.
.
.
..
.......
.
.....
.
...
..
.
.....
.
.
...
.
.
..
.
.
.
...
.
.
..
.
........
.
.
........
.
..
..
.
...
.
.
.
.
...
.
.
..
Fig. 22. Soft output of the 1/2-rate, K = 3, (Gr , G) = (5, 7) RSC decoderof Fig. 11 for a transmitted stream of all +1 during the second iteration atEb/N0 = 9.0 dB. The mutual information at the output of the RSC decoderis Io,e(c) = 0.935. Observe that in contrast to Fig. 21, a substantial reducednumber of erroneous bit-decisions would emerge.
depth of 800, 000 bits. The horizontal and vertical steps seenin Fig. 20 represent the actual extrinsic information transferbetween the inner demapper and the outer RSC channeldecoder of Fig. 11.
Figs. 21 and 22 show how the LLRs Lo,e(c) are affected byincreasing the number of decoding iterations from one to two.The bit sequence in this case consists entirely of logical ‘1’s,which is equivalent to x = +1. This implies that a positiveLLR value Lo,e(c) corresponds to a correct hard decisionand a negative LLR value corresponds to an incorrect harddecision. The LLRs shown in Fig. 21 and Fig. 22 are shownfor Eb/N0 = 9.0 dB. As observed in Fig. 21, during thefirst iteration there are lots of errors and this is manifestedby the negative LLRs shown in the figure. The MI for theLLRs in the first iteration is Io,e(c) = 0.886. By contrast,Fig. 22 shows that during the second iteration the amplitudeof the LLRs increases and there are less LLRs with a negativesign. The MI in this case is Io,e(c) = 0.935. As shown in thedecoding trajectory of Fig. 20, there is no further gain aftertwo iterations and the EXIT curves of the inner demapper andthe outer RSC decoder intersect before reaching the (1.0, 1.0)point. Hence there will be still residual errors in this case andthis is clearly indicated by the LLRs with the negative sign inFig. 22.
The BER of the iteratively decoded system of Fig. 11 isshown in Fig. 23. The figure compares the BER performanceof the GM- and AGM-aided QPSK modulated system for a

EL-HAJJAR and HANZO: EXIT CHARTS FOR SYSTEM DESIGN AND ANALYSIS 11
10-62
510
-52
510
-42
510
-32
510
-22
510
-12
5
1
BE
R
0 2 4 6 8 10 12 14
Eb/N0 [dB]
QPSK GM0 iter1 iter
QPSK AGM0 iter1 iter2 iter3 iter
Fig. 23. BER Performance of the AGM- and GM-based iteratively detectedRSC-coded system shown in Fig. 11 in conjunction with an interleaver depthof 800, 000 bits while using a variable number of iterations.
variable number of iterations, while employing an interleaverdepth of 800, 000 bits and communicating over a narrow-band Rayleigh fading channel having a normalised Dopplerfrequency of 0.01. As shown in Fig. 23, the BER performanceof the GM-aided system does not improve upon increasingthe number of iterations and this matches the EXIT chartprediction of Fig. 13, where the GM-based system has a flatEXIT transfer function. On the other hand, the AGM-basedsystem’s performance improves upon increasing the number ofiterations from 0 to 1, but beyond that the BER performance nolonger improves upon increasing the number of iterations. Thistrend is confirmed by the decoding trajectory of Fig. 20, whereit was shown that the EXIT curves of the inner demapper andthe outer RSC decoder intersect after the first iteration. Alsonote that the BER curves of Fig. 23 do not exhibit a sharplydecaying “turbo-cliff” shape that is expected in an iterativelydecoded system. This is due to the fact that the EXIT transferfunctions of the inner and outer decoders intersect beforereaching the (1.0, 1.0) point of perfect convergence to aninfinitesimally low BER and hence we experience a gradually,rather than sharply, decaying BER curve in Fig. 23.
C. EXIT chart analysis of a two-stage serially concatenatedsystem using a recursive inner code
The BER results shown in the previous section did notexhibit a steep turbo-cliff due to the fact that the EXIT curveof the inner demapper and the outer RSC decoder intersectedbefore reaching the (1.0, 1.0) point. It was shown in [52] thata recursive inner decoder component is needed in order tomaximise the interleaver gain and to avoid the formation of aBER floor, when employing iterative decoding. In [45], unity-rate inner codes were employed for designing low-complexityiterative detection aided schemes suitable for bandwidth andpower limited systems having stringent BER requirements.
RSCDecoder
RSC Encoder
URCEncoder
QPSKMapper
URCDecoder
QPSKDemapper
d
Π
Π−1
DecisionHard
Π s
r
Lo,e(c)
Lo,a(c)
Li,a(u)
Li,e(u)
c ub
LM (d)
Fig. 24. Block diagram of a two-stage iteratively decoded system usingQPSK modulation in conjunction with URC and RSC codes.
0.0
0.2
0.4
0.6
0.8
1.0
I i,e(
u),I
o,a(
c)0.0 0.2 0.4 0.6 0.8 1.0
Io,e(c), Ii,a(u)
QPSK GMURC0dB to 12dBsteps of 1dBRSC(2,1,3)(Gr,G)=(7,5)
0 dB
12 dB
Fig. 25. EXIT chart of the 1/2-rate K = 3 RSC-coded and URC-precodedscheme of Fig. 24 employing GM QPSK, while using an interleaver depth of800, 000 bits, which should be contrasted to the EXIT chart of Fig. 17 basedon the schematic of Fig. 11 using no URC.
Hence, in this section we consider the iteratively decodedsystem of Fig. 24, where iterative detection is carried outby exchanging extrinsic information between the outer RSCdecoder and the inner Unity-Rate Code’s (URC) decoder. Anexplicit benefit of the URC is that it has an Infinite ImpulseResponse (IIR) and hence it efficiently spreads/randomises theextrinsic information without increasing the interleaver delayand without reducing the throughput. This is achieved at amodest complexity increase, because a memory-1 URC hasonly two trellis states.
The schematic of the proposed system is shown in Fig. 24,where the transmitted source bits b are convolutionally en-coded by a 1/2-rate memory-2 K = 3 RSC code having aGP octally represented as (Gr, G)=(7, 5). The RSC encodedbit stream c is then interleaved by a random bit interleaver.Following channel interleaving the bit stream u is encodedby a URC encoder. More specifically, the URC encoder isa simple rate-1 memory-1 accumulator, which is describedby the pair of octal GPs of (Gr , G) = (3, 2). The QPSKmapper of Fig. 24 then maps the RSC coded and URCprecoded bits to QPSK symbols for transmission from a singleantenna. Similarly to Section III-B, we consider transmissionover a temporally correlated narrowband Rayleigh fadingchannel associated with a normalised Doppler frequency offD=fdTs=0.01.
As shown in Fig. 24, the received complex-valued symbols
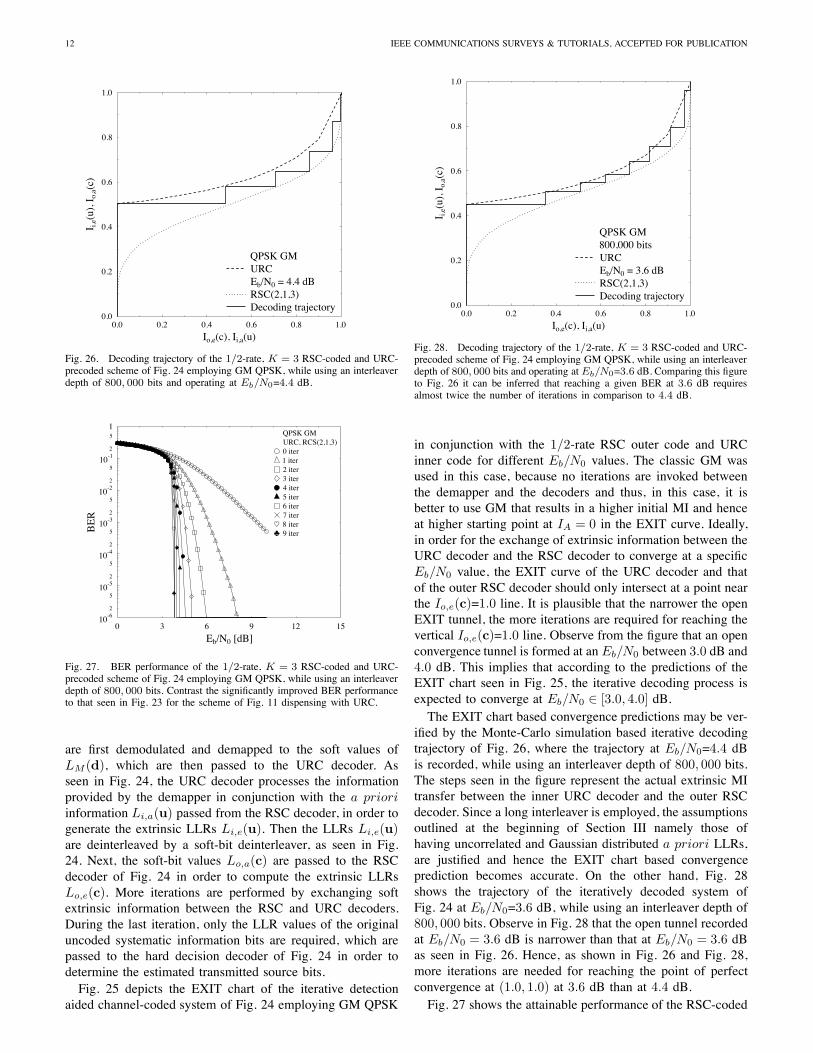
12 IEEE COMMUNICATIONS SURVEYS & TUTORIALS, ACCEPTED FOR PUBLICATION
0.0
0.2
0.4
0.6
0.8
1.0I i,
e(u)
,Io,
a(c)
0.0 0.2 0.4 0.6 0.8 1.0
Io,e(c), Ii,a(u)
QPSK GMURCEb/N0 = 4.4 dBRSC(2,1,3)Decoding trajectory
Fig. 26. Decoding trajectory of the 1/2-rate, K = 3 RSC-coded and URC-precoded scheme of Fig. 24 employing GM QPSK, while using an interleaverdepth of 800, 000 bits and operating at Eb/N0=4.4 dB.
10-62
510
-52
510
-42
510
-32
510
-22
510
-12
5
1
BE
R
0 3 6 9 12 15
Eb/N0 [dB]
♣♣♣♣♣♣♣♣♣♣♣♣♣♣♣♣♣♣
♣
♣
QPSK GMURC, RCS(2,1,3)0 iter1 iter2 iter3 iter4 iter5 iter6 iter7 iter8 iter
♣ 9 iter
Fig. 27. BER performance of the 1/2-rate, K = 3 RSC-coded and URC-precoded scheme of Fig. 24 employing GM QPSK, while using an interleaverdepth of 800, 000 bits. Contrast the significantly improved BER performanceto that seen in Fig. 23 for the scheme of Fig. 11 dispensing with URC.
are first demodulated and demapped to the soft values ofLM (d), which are then passed to the URC decoder. Asseen in Fig. 24, the URC decoder processes the informationprovided by the demapper in conjunction with the a prioriinformation Li,a(u) passed from the RSC decoder, in order togenerate the extrinsic LLRs Li,e(u). Then the LLRs Li,e(u)are deinterleaved by a soft-bit deinterleaver, as seen in Fig.24. Next, the soft-bit values Lo,a(c) are passed to the RSCdecoder of Fig. 24 in order to compute the extrinsic LLRsLo,e(c). More iterations are performed by exchanging softextrinsic information between the RSC and URC decoders.During the last iteration, only the LLR values of the originaluncoded systematic information bits are required, which arepassed to the hard decision decoder of Fig. 24 in order todetermine the estimated transmitted source bits.
Fig. 25 depicts the EXIT chart of the iterative detectionaided channel-coded system of Fig. 24 employing GM QPSK
0.0
0.2
0.4
0.6
0.8
1.0
I i,e(
u),I
o,a(
c)
0.0 0.2 0.4 0.6 0.8 1.0
Io,e(c), Ii,a(u)
QPSK GM800,000 bitsURCEb/N0 = 3.6 dBRSC(2,1,3)Decoding trajectory
Fig. 28. Decoding trajectory of the 1/2-rate, K = 3 RSC-coded and URC-precoded scheme of Fig. 24 employing GM QPSK, while using an interleaverdepth of 800, 000 bits and operating at Eb/N0=3.6 dB. Comparing this figureto Fig. 26 it can be inferred that reaching a given BER at 3.6 dB requiresalmost twice the number of iterations in comparison to 4.4 dB.
in conjunction with the 1/2-rate RSC outer code and URCinner code for different Eb/N0 values. The classic GM wasused in this case, because no iterations are invoked betweenthe demapper and the decoders and thus, in this case, it isbetter to use GM that results in a higher initial MI and henceat higher starting point at IA = 0 in the EXIT curve. Ideally,in order for the exchange of extrinsic information between theURC decoder and the RSC decoder to converge at a specificEb/N0 value, the EXIT curve of the URC decoder and thatof the outer RSC decoder should only intersect at a point nearthe Io,e(c)=1.0 line. It is plausible that the narrower the openEXIT tunnel, the more iterations are required for reaching thevertical Io,e(c)=1.0 line. Observe from the figure that an openconvergence tunnel is formed at an Eb/N0 between 3.0 dB and4.0 dB. This implies that according to the predictions of theEXIT chart seen in Fig. 25, the iterative decoding process isexpected to converge at Eb/N0 ∈ [3.0, 4.0] dB.
The EXIT chart based convergence predictions may be ver-ified by the Monte-Carlo simulation based iterative decodingtrajectory of Fig. 26, where the trajectory at Eb/N0=4.4 dBis recorded, while using an interleaver depth of 800, 000 bits.The steps seen in the figure represent the actual extrinsic MItransfer between the inner URC decoder and the outer RSCdecoder. Since a long interleaver is employed, the assumptionsoutlined at the beginning of Section III namely those ofhaving uncorrelated and Gaussian distributed a priori LLRs,are justified and hence the EXIT chart based convergenceprediction becomes accurate. On the other hand, Fig. 28shows the trajectory of the iteratively decoded system ofFig. 24 at Eb/N0=3.6 dB, while using an interleaver depth of800, 000 bits. Observe in Fig. 28 that the open tunnel recordedat Eb/N0 = 3.6 dB is narrower than that at Eb/N0 = 3.6 dBas seen in Fig. 26. Hence, as shown in Fig. 26 and Fig. 28,more iterations are needed for reaching the point of perfectconvergence at (1.0, 1.0) at 3.6 dB than at 4.4 dB.
Fig. 27 shows the attainable performance of the RSC-coded
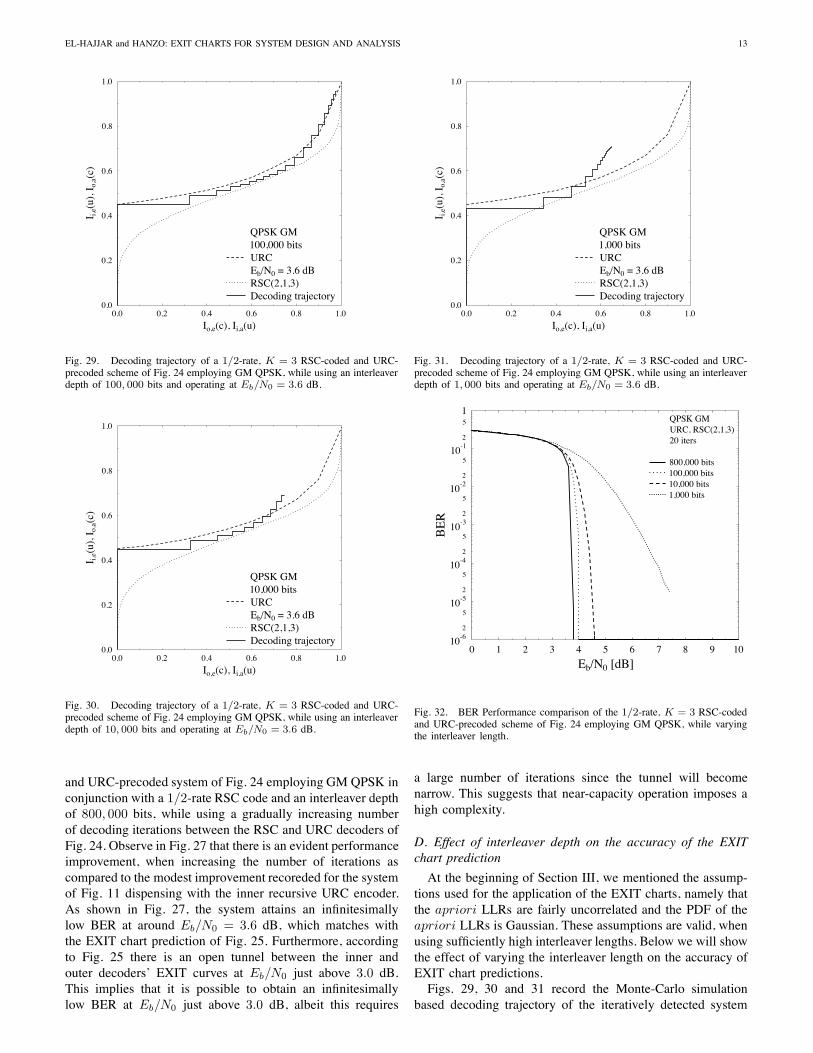
EL-HAJJAR and HANZO: EXIT CHARTS FOR SYSTEM DESIGN AND ANALYSIS 13
0.0
0.2
0.4
0.6
0.8
1.0I i,
e(u)
,Io,
a(c)
0.0 0.2 0.4 0.6 0.8 1.0
Io,e(c), Ii,a(u)
QPSK GM100,000 bitsURCEb/N0 = 3.6 dBRSC(2,1,3)Decoding trajectory
Fig. 29. Decoding trajectory of a 1/2-rate, K = 3 RSC-coded and URC-precoded scheme of Fig. 24 employing GM QPSK, while using an interleaverdepth of 100, 000 bits and operating at Eb/N0 = 3.6 dB.
0.0
0.2
0.4
0.6
0.8
1.0
I i,e(
u),I
o,a(
c)
0.0 0.2 0.4 0.6 0.8 1.0
Io,e(c), Ii,a(u)
QPSK GM10,000 bitsURCEb/N0 = 3.6 dBRSC(2,1,3)Decoding trajectory
Fig. 30. Decoding trajectory of a 1/2-rate, K = 3 RSC-coded and URC-precoded scheme of Fig. 24 employing GM QPSK, while using an interleaverdepth of 10, 000 bits and operating at Eb/N0 = 3.6 dB.
and URC-precoded system of Fig. 24 employing GM QPSK inconjunction with a 1/2-rate RSC code and an interleaver depthof 800, 000 bits, while using a gradually increasing numberof decoding iterations between the RSC and URC decoders ofFig. 24. Observe in Fig. 27 that there is an evident performanceimprovement, when increasing the number of iterations ascompared to the modest improvement recoreded for the systemof Fig. 11 dispensing with the inner recursive URC encoder.As shown in Fig. 27, the system attains an infinitesimallylow BER at around Eb/N0 = 3.6 dB, which matches withthe EXIT chart prediction of Fig. 25. Furthermore, accordingto Fig. 25 there is an open tunnel between the inner andouter decoders’ EXIT curves at Eb/N0 just above 3.0 dB.This implies that it is possible to obtain an infinitesimallylow BER at Eb/N0 just above 3.0 dB, albeit this requires
0.0
0.2
0.4
0.6
0.8
1.0
I i,e(
u),I
o,a(
c)
0.0 0.2 0.4 0.6 0.8 1.0
Io,e(c), Ii,a(u)
QPSK GM1,000 bitsURCEb/N0 = 3.6 dBRSC(2,1,3)Decoding trajectory
Fig. 31. Decoding trajectory of a 1/2-rate, K = 3 RSC-coded and URC-precoded scheme of Fig. 24 employing GM QPSK, while using an interleaverdepth of 1, 000 bits and operating at Eb/N0 = 3.6 dB.
10-62
510
-52
510
-42
510
-32
510
-22
510
-12
5
1
BE
R
0 1 2 3 4 5 6 7 8 9 10
Eb/N0 [dB]
QPSK GMURC, RSC(2,1,3)20 iters
800,000 bits100,000 bits10,000 bits1,000 bits
Fig. 32. BER Performance comparison of the 1/2-rate, K = 3 RSC-codedand URC-precoded scheme of Fig. 24 employing GM QPSK, while varyingthe interleaver length.
a large number of iterations since the tunnel will becomenarrow. This suggests that near-capacity operation imposes ahigh complexity.
D. Effect of interleaver depth on the accuracy of the EXITchart prediction
At the beginning of Section III, we mentioned the assump-tions used for the application of the EXIT charts, namely thatthe apriori LLRs are fairly uncorrelated and the PDF of theapriori LLRs is Gaussian. These assumptions are valid, whenusing sufficiently high interleaver lengths. Below we will showthe effect of varying the interleaver length on the accuracy ofEXIT chart predictions.
Figs. 29, 30 and 31 record the Monte-Carlo simulationbased decoding trajectory of the iteratively detected system

14 IEEE COMMUNICATIONS SURVEYS & TUTORIALS, ACCEPTED FOR PUBLICATION
RSCEncoder I
URCEncoder II
QPSKMapperΠ1 Π2
QPSKDemapper
Π2
Π−12Π−1
1
Π1HardDecision
RSCDecoder
URCDecoderIII
b c1 u1 c2 u2s
LII,e(c2) Li,a(u2)
LII,a(c2) Li,e(u2)
LII,a(u1)
LII,e(u1)
r
LI,a(c1)
LI,e(c1)
Fig. 33. Block diagram of a three-stage iteratively decoded system usingQPSK modulation in conjunction with URC and RSC codes, which includesthe additional interleaver Π2 in comparison to Fig. 24.
of Fig. 24, while operating at Eb/N0=3.6 dB associated withinterleaver depths of 100, 000 bits, 10, 000 bits and 1, 000bits, respectively. The decoding trajectory of Fig. 29 employsan interleaver depth of 100, 000 bits, where the decodingtrajectory is different from that observed in Fig. 28. In otherwords, the system employing a shorter interleaver requiresmore iterations to reach the highest point of intersectionbetween the EXIT curves of the inner URC decoder andthe outer RSC decoder. Additionally as Ii,a(u) increases, theMonte-Carlo decoding trajectory starts to deviate from theEXIT curves of the URC or RSC decoders, because the LLRdistribution is no longer Gaussian for high Ii,a(u) values.
The Monte-Carlo simulation based decoding trajectoriesshown in Fig 30 and Fig. 31 became even more different fromthe EXIT chart predictions because shorter interleavers areused and thus the assumptions stipulated at the beginning ofSection III become even less accurate. More explicitly, whenusing shorter interleavers, the LLRs Li,a(u) are no longernear-Gaussian distributed. This implies that the EXIT chartprediction of having an open tunnel at Eb/N0 > 3.0 dBand hence a low BER at this Eb/N0 value is no longervalid for low interleaver lengths. This is verified by the BERperformance curves shown in Fig. 32.
The BER performance of the iteratively detected RSC-coded and URC precoded scheme of Fig. 24 using 20 iter-ations and varying the interleaver depth is shown in Fig. 32.As seen in the figure, upon increasing the interleaver depthfrom 1, 000 bits to 10, 000 bits, the system’s performancedramatically improves. Upon further increasing the interleaverdepth from 10, 000 bits to 100, 000 bits, the attainable perfor-mance improves, but not as much as upon increasing it from1, 000 to 10, 000 bits. Furthermore, increasing the interleaverdepth beyond 100, 000 bits fails to significantly improve theachievable system performance, as seen in Fig. 32, whilecomparing the BER curves recorded for the interleaver lengthsof 800, 000 bits and 100, 000 bits.
E. EXIT chart analysis of a three-stage serially concatenatedsystem and 3D EXIT charts
The turbo principle of [16] was extended to multiple seri-ally concatenated codes in [19]. The appeal of concatenatedcoding is that low-complexity iterative detection replaces thepotentially more complex optimum non-iterative decoder, suchas that of [77]. The concept of EXIT chart analysis has beenextended to three-stage concatenated systems in [30, 36, 41,42].
The two-stage iteratively decoded system of Fig. 24 can befurther improved by employing an interleaver at the output of
QPSK Demapperat Eb/N0=3.6dB Unity-Rate Decoder II
00.2
0.40.6
0.81
III,a(u1), II,e(c1)0
0.2
0.4
0.6
0.8
1
III,a(c2), Ii,e(u2)
0
0.2
0.4
0.6
0.8
1
III,e(c2), Ii,a(u2)
Fig. 34. 3D EXIT chart of Decoder II and the demapper of Fig. 33 atEb/N0 = 3.6 dB.
the URC, as shown in Fig. 33, in order to further randomisingthe bursty errors imposed by the channels characterised byboth time and frequency selectivity. Furthermore, extrinsicsoft information can be exchanged between the demapper andURC decoder resulting in a three-stage iteratively decodedsystem The schematic of the three-stage system is shown inFig. 33, where the transmitted source bits b are encoded bythe outer RSC Encoder I having a rate of RI . Similarly toFig. 24, the outer channel encoded bits c1 are then interleavedby the first random bit interleaver Π1 of Fig. 33, where therandomly permuted bits u1 are fed through the URC EncoderII. The URC coded bits c2 at the output of the URC encoderare interleaved by the second random bit interleaver Π2, asshown in Fig. 33, producing the permuted bits u2. Afterbit interleaving, the bits are mapped to QPSK symbols fortransmission.
Similarly to Section III-B we consider transmission overa temporally correlated narrowband Rayleigh fading chan-nel associated with a normalised Doppler frequency offD=fdTs=0.01. As shown in Fig. 33, the received complex-valued symbols r are decoded by the QPSK demapper. Then,iterative demapping/decoding is carried out by exchangingextrinsic information between the QPSK demapper, URCSISO Decoder II and RSC SISO Decoder I. The iterativeprocess is performed for a number of consecutive iterations.During the last iteration, only the LLR values LI,e(b) of theoriginal uncoded systematic information bits b are required,which are passed to a hard decision decoder in order todetermine the estimated transmitted source bits, as shown inFig. 33.
As seen from Fig. 33, the input of the URC DecoderII is constituted by the a priori input LII,a(c2) and thea priori input LII,a(u1) provided by the demapper andDecoder I after bit deinterleaving, respectively. Therefore, theEXIT characteristic of Decoder II may be described by thefollowing two EXIT functions [24, 42]:
III,e(c2) = TII,c2 [III,a(u1), III,a(c2))] (18)
III,e(u1) = TII,u1 [III,a(u1), III,a(c2)] , (19)
which are illustrated by the 3D surfaces drawn in dotted lines

EL-HAJJAR and HANZO: EXIT CHARTS FOR SYSTEM DESIGN AND ANALYSIS 15
Unity-Rate Decoder II
Outer Decoder I
EXIT Projection
00.2
0.40.6
0.81
III,a(u1), II,e(c1)0
0.2
0.4
0.6
0.8
1
III,a(c2), Ii,e(u2)
0
0.2
0.4
0.6
0.8
1
III,e(u1), II,a(c1)
Fig. 35. 3D EXIT chart of Decoder II and Decoder I of Fig. 33, also showingthe EXIT projection from Fig. 34.
0.0
0.2
0.4
0.6
0.8
1.0
I II,e
(u1)
,II,a
(c1)
0.0 0.1 0.2 0.3 0.4 0.5 0.6 0.7 0.8 0.9 1.0
II,e(c1), III,a(u1)
EXIT ProjectionEb/N0 = 3.8dB0 inner iter20 inner iter
RSC(2,1,3)
Fig. 36. 2D projection of the EXIT charts of Fig. 35 for the three-stagesystem of Fig. 33, when employing AGM aided QPSK, while using aninterleaver depth of 800, 000 bits.
in Fig. 34 and Fig. 35, respectively. On the other hand, theEXIT characteristic of the demapper as well as that of DecoderI are each dependent on a single a priori input, namelyon Li,a(u2) and LI,a(c1), respectively, both of which areprovided by the URC Decoder II after appropriately orderingthe bits by the interleavers, as seen in Fig. 33. The EXITcharacteristic of the demapper is also dependent on the Eb/N0
value. Consequently, the corresponding EXIT functions drawnfor the demapper and Decoder I, respectively, may be writtenas:
II,e(u2) = Ti,u2 [Ii,a(u2), Eb/N0] , (20)
II,e(c1) = TI,c1 [II,a(c1)] , (21)
which are illustrated by the 3D surfaces drawn in solid linesin Fig. 34 and Fig. 35, respectively.
As observed in Fig. 34 and Fig. 35, it is somewhat cum-bersome to interpret the 3D EXIT charts. Fortunately, theirunique and unambiguous 2D representations can be deduced,which may be interpreted more readily. More explicitly, theintersection of the surfaces seen in Fig. 34 is shown as a thick
0.0
0.2
0.4
0.6
0.8
1.0
I II,e
(u1)
,II,a
(c1)
0.0 0.1 0.2 0.3 0.4 0.5 0.6 0.7 0.8 0.9 1.0
II,e(c1), III,a(u1)
EXIT ProjectionEb/N0 = 3.0dB0 inner iter20 inner iter
RSC(2,1,2)
Fig. 37. 2D projection of the EXIT charts of the three-stage system of Fig. 33,when employing the AGM aided QPSK, while using an interleaver depth of800, 000 bits and an RSC with constraint length K = 2 at Eb/N0 = 3.0 dB.
solid line, which characterises the achievable performancewhen exchanging mutual information between the demapperand the URC Decoder II for different fixed values of III,a(u1)gleaned for Decoder I and spanning the range of [0, 1].Each [III,a(u1), III,a(c2), III,e(c2)] point belonging to theline of intersection in Fig. 34 uniquely specifies a point[III,a(u1), III,a(c2), III,e(u1)] in the 3D space of Fig. 35,according to the EXIT function of Equation (19). Therefore,the line corresponding to the [III,a(u1), III,a(c2), III,e(c2)]points along the thick line of Fig. 34 is projected to the solidline shown in Fig. 35. This projected EXIT curve may bewritten as
III,e(u1) = T pII,u1
[III,a(u1), Eb/N0] . (22)
The intersection of the surfaces in Fig. 34, shown as athick solid line, characterises the best achievable performance,when exchanging MI between the demapper and the URCDecoder II for different fixed values of III,a(u1) spanningthe range of [0, 1]. Therefore, the line corresponding to the[III,a(u1), III,a(c2), III,e(c2)] points along the thick line ofFig. 34 is projected to the solid line shown in Fig. 35, whilethe 2D projection of the solid line in Fig. 35 at III,a(c2) = 0onto the plane spanned by the lines [III,a(u1), III,e(u1)] and[II,e(c1), II,a(c1)] is shown in Fig. 36 at Eb/N0 = 3.6 dB.More explicitly, Fig. 36 records the 2D-projected EXIT curvesfor 0 and 20 inner iterations between the demapper andDecoder II. As observed from Fig. 36, when no inner iterationsare employed, the system becomes essentially a two-stagearrangement as the one shown in Fig. 24 of Section III-C.According to Fig. 36, regardless whether 0 or 20 inneriterations are employed between the demapper and the URCdecoder II, the projected curve has more or less the same shapeand an open tunnel is attained for Eb/N0 = 3.6 dB. Thisimplies that a three-stage system relying on the configurationof Fig. 33 may be replace by a simpler two-stage system,which is capable of attaining the same performance.
On the other hand, the three-stage system of Fig. 33
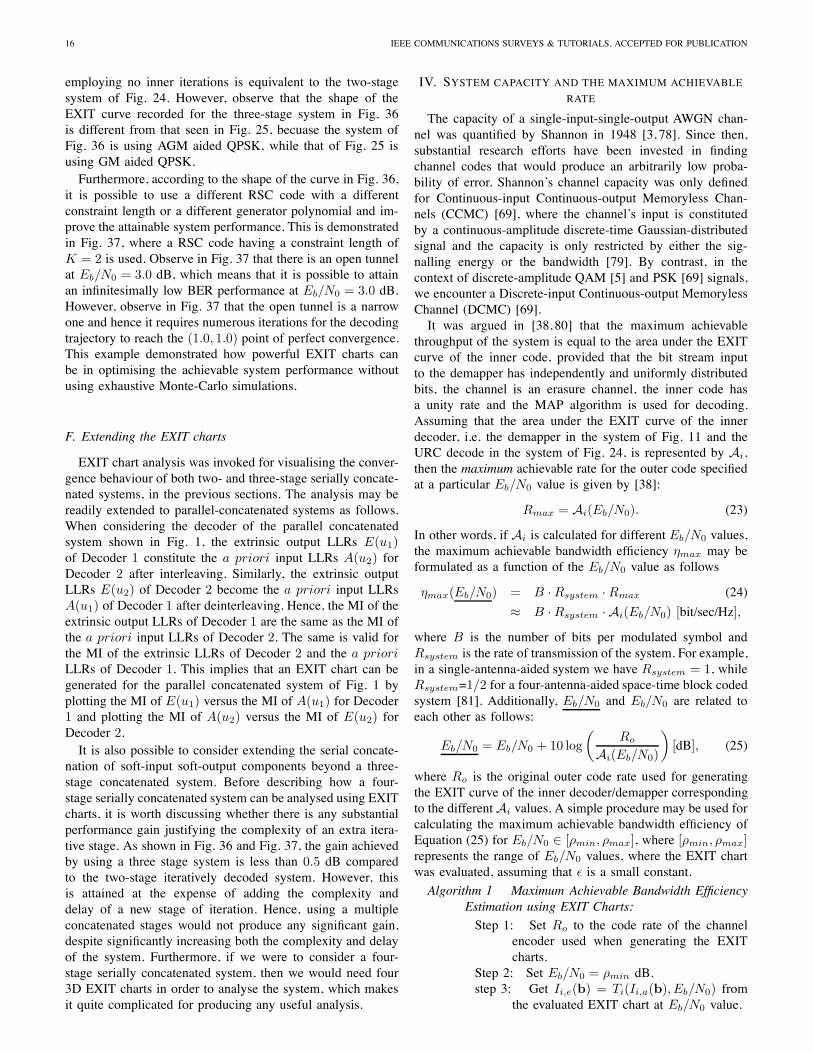
16 IEEE COMMUNICATIONS SURVEYS & TUTORIALS, ACCEPTED FOR PUBLICATION
employing no inner iterations is equivalent to the two-stagesystem of Fig. 24. However, observe that the shape of theEXIT curve recorded for the three-stage system in Fig. 36is different from that seen in Fig. 25, becuase the system ofFig. 36 is using AGM aided QPSK, while that of Fig. 25 isusing GM aided QPSK.
Furthermore, according to the shape of the curve in Fig. 36,it is possible to use a different RSC code with a differentconstraint length or a different generator polynomial and im-prove the attainable system performance. This is demonstratedin Fig. 37, where a RSC code having a constraint length ofK = 2 is used. Observe in Fig. 37 that there is an open tunnelat Eb/N0 = 3.0 dB, which means that it is possible to attainan infinitesimally low BER performance at Eb/N0 = 3.0 dB.However, observe in Fig. 37 that the open tunnel is a narrowone and hence it requires numerous iterations for the decodingtrajectory to reach the (1.0, 1.0) point of perfect convergence.This example demonstrated how powerful EXIT charts canbe in optimising the achievable system performance withoutusing exhaustive Monte-Carlo simulations.
F. Extending the EXIT charts
EXIT chart analysis was invoked for visualising the conver-gence behaviour of both two- and three-stage serially concate-nated systems, in the previous sections. The analysis may bereadily extended to parallel-concatenated systems as follows.When considering the decoder of the parallel concatenatedsystem shown in Fig. 1, the extrinsic output LLRs E(u1)of Decoder 1 constitute the a priori input LLRs A(u2) forDecoder 2 after interleaving. Similarly, the extrinsic outputLLRs E(u2) of Decoder 2 become the a priori input LLRsA(u1) of Decoder 1 after deinterleaving. Hence, the MI of theextrinsic output LLRs of Decoder 1 are the same as the MI ofthe a priori input LLRs of Decoder 2. The same is valid forthe MI of the extrinsic LLRs of Decoder 2 and the a prioriLLRs of Decoder 1. This implies that an EXIT chart can begenerated for the parallel concatenated system of Fig. 1 byplotting the MI of E(u1) versus the MI of A(u1) for Decoder1 and plotting the MI of A(u2) versus the MI of E(u2) forDecoder 2.
It is also possible to consider extending the serial concate-nation of soft-input soft-output components beyond a three-stage concatenated system. Before describing how a four-stage serially concatenated system can be analysed using EXITcharts, it is worth discussing whether there is any substantialperformance gain justifying the complexity of an extra itera-tive stage. As shown in Fig. 36 and Fig. 37, the gain achievedby using a three stage system is less than 0.5 dB comparedto the two-stage iteratively decoded system. However, thisis attained at the expense of adding the complexity anddelay of a new stage of iteration. Hence, using a multipleconcatenated stages would not produce any significant gain,despite significantly increasing both the complexity and delayof the system. Furthermore, if we were to consider a four-stage serially concatenated system, then we would need four3D EXIT charts in order to analyse the system, which makesit quite complicated for producing any useful analysis.
IV. SYSTEM CAPACITY AND THE MAXIMUM ACHIEVABLE
RATE
The capacity of a single-input-single-output AWGN chan-nel was quantified by Shannon in 1948 [3, 78]. Since then,substantial research efforts have been invested in findingchannel codes that would produce an arbitrarily low proba-bility of error. Shannon’s channel capacity was only definedfor Continuous-input Continuous-output Memoryless Chan-nels (CCMC) [69], where the channel’s input is constitutedby a continuous-amplitude discrete-time Gaussian-distributedsignal and the capacity is only restricted by either the sig-nalling energy or the bandwidth [79]. By contrast, in thecontext of discrete-amplitude QAM [5] and PSK [69] signals,we encounter a Discrete-input Continuous-output MemorylessChannel (DCMC) [69].
It was argued in [38, 80] that the maximum achievablethroughput of the system is equal to the area under the EXITcurve of the inner code, provided that the bit stream inputto the demapper has independently and uniformly distributedbits, the channel is an erasure channel, the inner code hasa unity rate and the MAP algorithm is used for decoding.Assuming that the area under the EXIT curve of the innerdecoder, i.e. the demapper in the system of Fig. 11 and theURC decode in the system of Fig. 24, is represented by Ai,then the maximum achievable rate for the outer code specifiedat a particular Eb/N0 value is given by [38]:
Rmax = Ai(Eb/N0). (23)
In other words, if Ai is calculated for different Eb/N0 values,the maximum achievable bandwidth efficiency ηmax may beformulated as a function of the Eb/N0 value as follows
ηmax(Eb/N0) = B ·Rsystem ·Rmax (24)
≈ B ·Rsystem · Ai(Eb/N0) [bit/sec/Hz],
where B is the number of bits per modulated symbol andRsystem is the rate of transmission of the system. For example,in a single-antenna-aided system we have Rsystem = 1, whileRsystem=1/2 for a four-antenna-aided space-time block codedsystem [81]. Additionally, Eb/N0 and Eb/N0 are related toeach other as follows:
Eb/N0 = Eb/N0 + 10 log
(Ro
Ai(Eb/N0)
)[dB], (25)
where Ro is the original outer code rate used for generatingthe EXIT curve of the inner decoder/demapper correspondingto the different Ai values. A simple procedure may be used forcalculating the maximum achievable bandwidth efficiency ofEquation (25) for Eb/N0 ∈ [ρmin, ρmax], where [ρmin, ρmax]represents the range of Eb/N0 values, where the EXIT chartwas evaluated, assuming that ε is a small constant.
Algorithm 1 Maximum Achievable Bandwidth EfficiencyEstimation using EXIT Charts:
Step 1: Set Ro to the code rate of the channelencoder used when generating the EXITcharts.
Step 2: Set Eb/N0 = ρmin dB.step 3: Get Ii,e(b) = Ti(Ii,a(b), Eb/N0) from
the evaluated EXIT chart at Eb/N0 value.

EL-HAJJAR and HANZO: EXIT CHARTS FOR SYSTEM DESIGN AND ANALYSIS 17
0.0
0.5
1.0
1.5
2.0
2.5
[bps
/Hz]
-5 0 5 10 15 20 25 30
Eb/N0 [dB]
QPSK
DCMC Bandwidth EfficiencyMaximum achievable rate
Fig. 38. Comparison of the DCMC bandwidth efficiency and the maximumachievable rate obtained using EXIT charts of a single-antenna-aided QPSKmodulated system of Fig. 11.
0.0 0.2 0.4 0.6 0.8 1.0A priori input IA of the demapper
0.0
0.2
0.4
0.6
0.8
1.0
Cha
nnel
and
extr
insi
cou
tput
I Eof
the
dem
appe
r
(2Tx,1Rx)
(anti-clockwise)AGM-1 -> AGM-10Anti-Gray MappingGray Mapping
L=16, Eb/N0 = 3.0dBBit-Based STBC-SP,
->
Fig. 39. Sphere packing demapper extrinsic information transfer charac-teristics for different bits to sphere-packing symbol mapping schemes atEb/N0 = 3.0dB for L = 16 c© Hanzo et. al. [1].
Step 4: Calculate Ai(Eb/N0) =∫ 1
0 Ti(i, Eb/N0) di.Step 5: Calculate Eb/N0 using Equation (25).Step 6: Save ηmax(Eb/N0) of Equation (25).Step 7: Let Eb/N0 = Eb/N0 + ε.
If Eb/N0 ≤ ρmax dB, go to Step 3.Step 8: Output ηmax(Eb/N0) from Step 6.
Observe that ρmin and ρmax are adjusted accordingly, in orderto produce the desired range of the resultant Eb/N0 values.Furthermore, the output of Algorithm 1 is independent of thespecific choice of Ro, since Equation (25) would always adjustthe Eb/N0 values, regardless of Ro.
The channel capacity curve of the single-antenna aidedQPSK modulated system of Fig. 11 is shown in Fig. 38.The figures portrays both the DCMC bandwidth efficiencycurve, evaluated according to [69], as well as the maxi-mum achievable rate of the system derived from the EXITcurves according to Algorithm 1. Observe in Fig. 38 thatthe maximum achievable rate of the system derived fromthe EXIT curves is almost perfectly matching the DCMC
0.0 0.2 0.4 0.6 0.8 1.0IED
of outer RSC decoder becomes a priori input IAMof demapper
0.0
0.2
0.4
0.6
0.8
1.0
I EM
ofde
map
per
beco
mes
apr
iori
inpu
tIA
Dof
oute
rR
SCde
code
r
. . . . . . . . . . .
STBC-SP, L=16Eb/N0 = 2.5dB. AGM-7AGM-9AGM-10
RSC Code, (2,1,5)(Gr,G) = (35,23)8
(Gr,G) = (27,23)8
(Gr,G) = (31,34)8
Fig. 40. EXIT chart of turbo-detected STBC-SP systems employing theAGM-7, AGM-9 and AGM-10 schemes of Fig. 39 in combination withouter RSC codes having a constraint length K = 5 and different GPsc© Hanzo et. al. [1].
bandwidth efficiency curve. Note that the maximum achievablerate obtained from the EXIT chart was proven mathematicallyfor the family of binary erasure channels [80]. Nonetheless,similar experimentally verified trends have been observed forboth AWGN and Inter-Symbol-Interference (ISI) contaminatedchannels [34, 38], provided that APP-based decoders are usedfor all decoder blocks [80].
V. APPLICATIONS OF EXIT CHARTS
A. Optimisation of sphere packing constellation mapping
In [1] a multi-dimensional modulation scheme was in-troduced, which was referred to as Sphere Packing (SP)modulation combined with twin-antenna aided Space-TimeBlock Coding (STBC) [81, 82]. SP modulation is capable ofmaximising the coding advantage of the transmission schemeby jointly designing and detecting the sphere-packed STBCsystem.
In [1], different GM and AGM schemes were proposedand optimised using EXIT charts. It was shown that EXITcharts can be used for selecting the best configuration of theconstellation mapping in conjunction with diverse inner andouter code GPs and constraint lengths.
Fig. 39 shows the extrinsic information transfer character-istics of the SP demapper in conjunction with a SP signallingalphabet having L = 16 symbols and different bit-to-symbolmapping schemes. As expected, GM does not provide any iter-ation gain upon increasing the MI at the input of the demapper.However, using a variety of different AGM schemes [57]results in different EXIT characteristics, as illustrated by thedifferent slopes seen in Fig. 39. There are a total of 16-factorial (16!) different mapping schemes. Having differentlegitimate bit-to-SP symbol mapping schemes provides us withthe flexibility for selecting the most appropriate mapping fora specific system design with the aid of EXIT charts. This isshown in Fig. 40, where the EXIT charts of three possible SPAGM schemes are plotted in conjunction with three possible

18 IEEE COMMUNICATIONS SURVEYS & TUTORIALS, ACCEPTED FOR PUBLICATION
0 1 2 3 4 5 6 7Eb/N0 [dB]
10-6
10-5
10-4
10-3
10-2
10-1
1
BE
RAGM-7,(Gr,G) = (35,23)8
AGM-9,(Gr,G) = (27,23)8
AGM-10,(Gr,G) = (31,34)8
STBC-SP, L=16RSC Code, (2,1,5)10 itersD = 1000000 bits
Fig. 41. BER performance of the AGM-7, AGM-9 and AGM-10 basedRSC-coded STBC-SP schemes of Fig. 39 in conjunction with L = 16c© Hanzo et. al. [1].
outer RSC code EXIT curves. As shown in Fig. 40, theAGM-10 scheme requires a higher SNR to generate an opentunnel than the AGM-9 modulated system, which in turnrequires a higher SNR for attaining an open tunnel than theAGM-7 based system. This indicates that according to theEXIT chart prediction of Fig. 40, the AGM-7 based schemeexhibits a turbo cliff at a lower Eb/N0 value than the others,when combined with the specific RSC code having the octalgenerator polynomials of (Gr , G) = (35, 23)8. However, theAGM-7 based scheme will acquire the highest BER floor,since the intersection point between the EXIT curves ofthe inner and outer codes is the lowest amonst the threeAGM schemes considered. Therefore, different AGM schemesmay be combined with specific RSC codes for the sakeof designing systems satisfying specific criteria, such as forexample attaining an early convergence or a lower BER floor.The BER performance comparison of the systems using thedifferent AGM scheme used in Fig. 40 are shown in Fig. 41.
On the other hand, given the flexibility of the differentAGMs, it is possible to optimise a three-stage iterativelydetected system similar to that shown in Fig. 33 for SPmodulation. More details about this issue can be found in [1].
EXIT charts and error floor: It is possible to relate theerror floor observed in Fig. 41 to the corresponding EXITcurve in Fig. 40. As shown in Fig. 40, the EXIT curve ofthe demapper employing AGM-7 intersects with the EXITcurve of the outer decoder at a point lower than those for thedemapper employing AGM-9 and AGM-10. This translates,as shown in Fig. 41, to a higher error floor for AGM-7 thanAGM-9 and for AGM-10. This can be explained by referringto Fig. 18, where lower extrinsic LLRs result in higher BERand hence a higher error floor. The same can be said forcomparing the error floors of the systems employing AGM-9and AGM-10.
Fig. 18 shows clearly that a lower output extrinsic LLR ofthe outer decoder results in a lower BER. This means thatthe lower the intersection point between the inner and outerdecoder EXIT curves, the higher the BER, hence resultingin a higher error floor. Furthermore, in order to get a lowererror floor, the output extrinsic MI of the outer decoder, whichcorresponds to the intersection point between the EXIT curves
0.0
0.2
0.4
0.6
0.8
1.0
I I,a(c
1)
0.0 0.2 0.4 0.6 0.8 1.0
II,e(c1)
Fig. 42. EXIT functions of the seventeen K = 5 subcodes in the IrCC,which have rates in the range [0.1, 0.9], which is confirmed by the area undertheir curves.
of the inner and outer decoders, should be as high as 0.998as shown in Fig. 18.
B. Design of irregular codes using EXIT charts
As described in Section III, a narrow but marginally openEXIT-tunnel represents a near-capacity performance [38].Therefore, IrCC were proposed in [34, 38] for the sake ofappropriately shaping the EXIT curves by minimising the areawithin the EXIT tunnel using curve fitting of the EXIT charts.
For the sake of illustrating the IrCC concept further, weconsider the three-stage system of Fig. 33 as an example. LetAI and AI be the areas under the EXIT-curve of Decoder Iand its inverse, respectively. Similarly, the area Ap is definedas that under the EXIT projection curve. It was observedin [34, 83] that for the APP-based outer Decoder I, the areaAI may be approximated by AI ≈ RI , where the equalityAI = RI was later shown in [80] for the family of BinaryErasure Channels (BECs). The area property of AI ≈ RI
implies that the lowest SNR convergence threshold occurs,when we have Ap = RI + ε, where ε is an infinitesimallysmall number.
Observe in Fig. 36 and Fig. 37 that there is a wide opentunnel between the EXIT curve of the outer decoder and theEXIT projection curve, especially for I < 0.2 and I > 0.6.This implies that the BER curve is farther from the achievablecapacity than necessary. More quantitatively, the area underthe EXIT projection curve is Ap ≈ 0.57 at Eb/N0 = 3.0 dB,which is larger than the outer code rate of RI = 0.50.Therefore, according to Fig. 36 and Fig. 37 and to the areaproperty of AI ≈ RI , a lower Eb/N0 convergence thresholdmay be attained. In other words, the EXIT curve of the outercode should match the EXIT projection curve more closely.Hence IrCCs can be invoked as an outer code that exhibitflexible EXIT characteristics, which can be optimised formore closely matching the EXIT projection curve of Fig. 36and Fig. 37, converting the near-capacity code optimisationoptimisation to a simple curve-fitting problem.

EL-HAJJAR and HANZO: EXIT CHARTS FOR SYSTEM DESIGN AND ANALYSIS 19
0.0
0.2
0.4
0.6
0.8
1.0I I
I,e(
u 1),
I I,a(c
1)
0.0 0.2 0.4 0.6 0.8 1.0
II,e(c1), III,a(u1)
EXIT projection2.4dB to 3.0dBsteps of 0.2dB
IRCC
Fig. 43. EXIT chart of the two-stage system shown in Fig. 24 in conjunctionwith AGM based QPSK, where the outer RSC code was replaced by the IrCCcode-components characterised in Fig. 42.
An IrCC scheme constituted by a set of 17 subcodes wasconstructed in [38] from a systematic 1/2-rate memory-4mother code defined by the octally represented GPs (Gr , G) =(31, 27)8. Each of the 17 subcodes have a different code rateRi
I , ∀i ∈ [1, 17], where puncturing was employed to obtainthe rates of Ri
I > 0.5 and the code rates of RiI < 0.5 were
created by adding more GPs and by puncturing. The twoadditional GPs employed in [38] are defined by the octallyrepresented GPs of G1 = (35)8 and G2 = (35)8, where theresultant 17 subcodes have coding rates spanning the range of[0.1, 0.9]. Each of the 17 subcodes encodes a specific fractionof the uncoded bits determined by the weighting coefficientαi, i = 1, . . . , P . Assuming an overall average code rate ofRI = 0.5, the following conditions must be satisfied:
17∑i=1
αi = 1, RI =
17∑i=1
αiRiI , and αi ∈ [0, 1], ∀i.
(26)The EXIT function corresponding to the IrCC may be
constructed from the EXIT functions of the 17 subcodes. Morespecifically, the EXIT function of the IrCC is the weightedsuperposition of the 17 EXIT functions, as follows [38]
TI,c1 [II,a(c1)] =17∑i=1
αiTiI,c1 [II,a(c1)] . (27)
Again, Fig. 42 shows the EXIT functions of the 17 subcodesused in [38]. Hence the coefficients αi are optimised with theaid of the iterative algorithm of [34], so that the EXIT curve ofthe resultant IrCC closely matches the EXIT projection curveat that specific Eb/N0 value, where we have Ap ≈ 0.50. Itis observed that we have Ap ≈ 0.501 at Eb/N0 = 2.4 dB.However, observe in Fig. 43 that we have an open tunnel atEb/N0 = 2.6 dB, indicating that this Eb/N0 value is close tothe lowest attainable convergence threshold, when employinga 1/2-rate outer code. Fig. 43 also shows the EXIT curve ofthe resultant IrCC. It may be inferred from Fig. 43 that anopen convergence tunnel is formed around Eb/N0 = 2.6 dB.
This implies that according to the predictions of the EXITchart of Fig. 43, the iterative decoding process is expected toconverge at Eb/N0 = 2.6 dB. However, observe in Fig. 43that the open tunnel at Eb/N0 = 2.6 dB is quite narrow andthus it requires a large number of iterations to converge atEb/N0 = 2.6 dB.
C. Multi-dimensional constellation labelling
It is widely recognised that the choice of a specific bit-to-symbol mapping scheme or a beneficial constellation labellingis an influential factor, when designing Bit-Interleaved CodedModulation using Iterative Decoding (BICM-ID) for the sakeof achieving a high iteration gain [24, 84, 85]. Hence, in [84]an EXIT chart based flexibility measure was introduced foranalysing the effect of expanding the constellation to a higher-dimensional space by jointly transmitting a pair of symbols ofa classic two-dimensional constellation.
In order to attain a near-capacity performance, the SNRvalue corresponding to the turbo cliff has to be as lowas possible. The crucial point at the receiver is that theconcatenated detectors/demappers/decoders are SISO decodersthat are capable of accepting and delivering probabilities orsoft values, where the extrinsic information of the soft-outputof one detector/demapper/decoder is passed on to the otherdetector/demapper/decoder to be used as its a priori input.
Several papers studied the multi-dimensional constellationlabelling demonstrating that it was beneficial to invoke multi-dimensional modulation in the context of both TCM andBICM [76, 86–88]. However, these papers did not quantify theachievable improvement, neither did they detail whether theimprovement was merely due to the increased number of bitsused by the combined symbols allowing for more flexibilityin the design of the constellation , or due to the beneficialmulti-dimensional labelling. In [84], a flexibility measure wasproposed based on EXIT charts, where investigations werecarried out into the effect of expanding the constellationto more dimensions as well as to quantify the benefits ofincreasing the classic constellation order. It was shown in [84]that the flexibility improvement of the bit-to-symbol mappingoffered by expanding the modulation constellation to a higher-dimensional space, when communicating over a Rayleighchannel was mainly due to the increased number of bits-per-joint-symbol. Nonetheless, useful EXIT flexibility improve-ments may also be obtained by expanding the modulationconstellation to a higher-dimensional space, especially whencommunicating over an independent fading based Rayleighchannel [84].
D. Symbol-based EXIT charts
The analysis in Section III was presented in the contextof iterative decoding at the bit level. However, it was shownin [32] that a reduced transmit power may be required,when symbol-based rather than bit-based iterative decodingis employed.
The convergence behaviour of bit-based iterative decodingwas studied in Section III. EXIT charts have been extendedto iterative non-binary coding schemes in [33], where ahistogram-based approximation of the extrinsic information’s

20 IEEE COMMUNICATIONS SURVEYS & TUTORIALS, ACCEPTED FOR PUBLICATION
PDF was required in order to compute the MI. Moreover, theevaluation of the extrinsic information’s histogram becomescomputationally demanding for a large number of bits persymbol. Hence a reduced-complexity method of computingnon-binary EXIT charts was proposed in [43], which dispenseswith the above-mentioned histogram computation and maybe considered to constitute a generalisation of the approachpresented in [44].
Motivated by the performance improvements reportedin [32, 45, 89, 90], a symbol-based iterative scheme was pro-posed in [1], where it was shown that the non-binary turbo-detection aided scheme is capable of providing further per-formance improvements over the equivalent bit-based turbo-detected scheme.
E. Coded Modulation
As mentioned in Section I of this paper, one of theobjectives for the design of digital communications is theefficient exploitation of the available bandwidth in order toaccommodate the ever-increasing traffic demand. Hence codedmodulation was proposed, where it is possible to insert paritybits into the bit sequence and absorb them by expanding thesignal constellation in order to accommodate the parity bitswithout expanding the bandwidth of the un-coded signal [4]. Ithas been shown in [4, 91] that the design of coded modulationschemes is affected by different design criteria. While a highsquared free Euclidean distance is desired for Additive WhiteGaussian Noise (AWGN) channels, a high effective codelength and minimum product distance are desired for fadingchannels [92]. Trellis-Coded Modulation (TCM) [91, 93] wasoriginally proposed for Gaussian channels, but later it wasfurther developed for applications in mobile communicationsover fading channels [92, 94]. Again, the philosophy of TCMschemes is that they combine channel coding and modulationin a way that the modulated signal constellation is extended toan increased number of constellation points, so that more bitsper symbol can be transmitted for the sake of absorbing theparity bits, hence requiring no increase in the bandwidth [95].Turbo Trellis-Coded Modulation (TTCM) [96] is another jointcoding and modulation scheme that has a structure similar tothat of the family of binary turbo codes [16], but it employsTCM schemes as component codes.
The coded modulation design and optimisation has beenpresented for AWGN channels [91, 93], where the design crite-ria was that of acquiring a higher free Euclidean distance. ThenTCM was redesigned for fading channels, where the criteria isthat of attaining a minimum product distance [92]. Then, afterthe introduction of EXIT charts, they were used as a powerfultool in designing and optimising coded modulation techniques,especially because the bit-to-symbol mapping makes the TCMencoder structure more complicated than that of classic turbocodes [97]. In [33], the EXIT chart concept has been ex-tended to the non-binary case, where serially concatenatedsystems having an inner TCM component and a space-timeconvolutional code were analysed. Furthermore, it was shownin [33] that the requirement of having a Gaussian distributionfor the a priori LLRs of a decoder can only be really arguedbased on the properties of the extrinsic information, rather
than those of the actual transmission channel. Afterwards,in [97] the approach of [33] was extended to TTCM relyingon employing symbol-based EXIT charts. On the other hand,the non-binary EXIT chart technique proposed in [43] wasshown to be well-suited to the analysis of non-binary iterativedecoding schemes associated with a large index alphabet, suchas for example a TTCM system employing a 32-QAM signalset. In [98], the EXIT chart was utilised in order to develop adesign criterion for choosing the constituent codes of TTCM,where the optimization method was developed for constructinghigh-rate and high-performance serially concatenated TCMschemes.
The EXIT charts of Self-Concatenated Trellis Coded Mod-ulation (SCTCM) [99] were presented in [100], where it wasfound that the symbol-based EXIT charts are fairly accurate inpredicting the decoding convergence threshold, despite the in-accurate simplifying assumption that the extrinsic informationand the systematic information of each encoded symbol areindependent of each other. For example, it was shown in [100]that the EXIT chart analysis of SCTCM schemes allows thedesigner to determine the number of self-iterations requiredby the SCTCM decoder for achieving convergence and henceto attain a very low BER [95].
Another coded modulation scheme distinguishing itself byutilising bit-based interleaving in conjunction with Gray signalconstellation labelling is referred to as Bit-Interleaved CodedModulation (BICM) [101]. More explicitly, BICM combinesconventional convolutional codes with several independentbit interleavers in order to increase the achievable diversityorder of a code for transmission over fading channels [101].The number of parallel bit interleavers equals the numberof coded bits in a symbol for the BICM scheme proposedin [101]. The performance of BICM is better than that of TCMfor transmission over uncorrelated or perfectly interleavednarrowband Rayleigh fading channels, but worse than that ofTCM in Gaussian channels owing to the reduced Euclideandistance of BICM. Additionally, iterative joint decoding anddemodulation assisted BICM (BICM-ID) was proposed inan effort to further increase the achievable system perfor-mance [21, 91, 102–104], where the approach of BICM-IDis to increase the Euclidean distance of BICM and hence toexploit the full advantage of bit interleaving with the aid ofsoft-decision iterative decoding [22].
The convergence behaviour of BICM-ID was analysedin [105] for the case of imperfect channel state information,while communicating over fading channels. It was shownusing EXIT charts that the correlation coefficient betweenthe fading and its estimate is the key parameter affectingthe decoding convergence. Additionally, it was shown that thedecoding convergence can be controlled by striking a trade-offbetween the quality of channel estimation and the code rate.Furthermore, EXIT charts were also used for analysing BICM-ID systems over the an AWGN channel in [106], where theauthors develop a generalised model for the a priori inputs.It was shown in [106] that the demapper and decoder transferfunctions are sensitive to over-estimation of the noise variance.Additionally, in [107] a method was proposed for predictingthe BERs of BICM-ID for all types of channels, which isbased on EXIT charts and avoids extensive BER simulations.

EL-HAJJAR and HANZO: EXIT CHARTS FOR SYSTEM DESIGN AND ANALYSIS 21
In [108], the iterative convergence of TCM, TTCM, BICMand DICM-ID was analysed using EXIT charts and a 3-dimensional EXIT chart was proposed for studying the itera-tive convergence behaviour of the multi-stage decoding usedin Multi-Level Coding (MLC) [109]. Furthermore, in [110] anear-capacity irregular BICM-ID (Ir-BICM-ID) scheme wasdesigned, which adopted a design philosophy similar to thatof the IrCC scheme of [34, 38]. It was shown in [110] thatthe irregular design of the Ir-BICM-ID scheme pervades thethree basic components of BICM-ID, namely the encoder, theunity-rate precoder and the bit-to-symbol mapper, where theproposed ir-BICM-ID schemes are capable of approachingthe capacity of coded modulation. Furthermore, since theappropriate choice of the bit-to-symbol mapping, which is alsooften referred to as constellation labelling, is essential in thedesign of BICM-ID, EXIT charts were used to design thislabelling for BICM-ID in [111].
F. Combining EXIT chart and union bounds for system designand analysis
According to the previous analysis, it has been shownhow the EXIT charts can be used as a powerful techniqueof analysing and designing iteratively decoded system char-acterised by near-capacity performance. EXIT charts havebeen successfully applied in both bit-based as well as insymbol-based iteratively detected systems. In [112] the low-complexity symbol-based EXIT charts proposed in [43] andthe corresponding BER union bound of Turbo Trellis CodedModulation (TTCM) schemes [96] were employed in order todesign new, near-capacity symbol-interleaved TTCM schemes.More specifically, new GPs were sought for the Trellis CodedModulation (TCM) [93] component codes, based on both theirdecoding convergence and on the error floor of the TTCMdecoder, rather than using the classic ‘punctured’ minimal dis-tance criterion of the TCM component codes defined in [96].In [112] the prime design criterion was that of finding aconstituent TCM code, where the corresponding EXIT chartsexhibit an open tunnel at the lowest possible SNR value, aswell as having an acceptable error floor, where the latter wasestimated by the truncated symbol-based union bound.
G. EXIT band charts
It has been shown in Section III that the EXIT chart and itsprediction is accurate for long interleavers, where the LLR’sPDF approaches the Gaussian distribution. This implies thatthe EXIT chart constitutes an accurate technique of predictingthe convergence behaviour in the turbo-cliff region of a BERcurve, when using long interleavers. In [39, 40], the EXIT bandchart tool was proposed for analysing systems having shorterinterleavers.
The EXIT charts are obtained by evaluating the average MIof the a priori and the extrinsic LLRs, while running severalsimulations with the aid of long interleavers. In this case, thevariance of the different simulations is small. However, whenrunning simulations for shorter interleavers, the MI transfercurve becomes different for each single simulation run even atthe same Eb/N0 value for both the inner and outer decoders. Inthis case, a band of EXIT curves is evaluated for both the inner
as well as the outer decoders for each given Eb/N0 value. Theband of MI transfer curves is then referred to as the EXITband [39], where the EXIT chart can be inferred by getting theaverage of the band. It was shown in [39] that as the interleaverlength increases, the width of the EXIT band reduces until wearrive at the EXIT chart valid for long interleavers.
H. Code design
Since the introduction of turbo codes and iterative decod-ing [16], substantial research efforts have been invested inimproving their performance as well as in reducing their com-plexity. For example, by choosing the best constituent encoder,a turbo code would achieve an improved performance withoutincreasing its complexity. In [113], a parameter referred toas the effective free distance was introduced for optimisingthe design of parallel concatenated codes and it was shownthat good constituent codes are those that have the maximumpossible effective free distance [62]. The effective free distancecan be defined as the lowest-weight codeword having thelowest for any weight-2 message [48]. In [113–115] a listof the best low-complexity constituent codes were presentedbased on maximising the effective free distance.
On the other hand, it was shown in [25] that the designof the constituent codes of turbo codes relying on iterativedecoding based on the effective free distance substantiallyaffects the code’s performance in the error-floor region, whilsthaving only a modest effect on the convergence propertiesof the code and on its performance in the turbo cliff region.These statements may be readily confirmed with the aid ofEXIT charts. Additionally, it was shown in [116] that there isa difference between the codes designed according to the non-iterative Maximum Likelihood (ML) design criterion and thosedesigned according to the iterative decoding criterion. For MLdecoding, the design criterion is to maximise the effective freedistance, while the design criterion for iterative decoding usingEXIT charts is to find the lowest turbo cliff SNR. Hence, it wasconcluded in [116] that a trade-off has to be struck betweenboth design criteria for the sake of designing good codes. Forexample, in [117] non-systematic turbo codes were designed,where the effective free distance was maximised in order toprovide a better error floor performance and the EXIT chartswere utilised for improving the turbo-cliff performance of theproposed non-systematic turbo codes.
I. Further EXIT Chart Applications
EXIT charts constitute a powerful semi-analytical tool thatmay be used for analysing any system, where there is anexchange of information. In a practical system relying onrealistic channel estimation and synchronisation, the errors dueto channel estimation and synchronisation imperfections mayalso be considered as an additional source of noise, hencethe EXIT chart analysis may provide us with an indication ofthe degradation due to realistic imperfect channel estimationand synchronisation, without the need to embark on the time-consuming Monte-Carlo simulations [118].
On the other hand, in a multi-user system supportingN users [119, 120], where Multi-User Detection (MUD) is

22 IEEE COMMUNICATIONS SURVEYS & TUTORIALS, ACCEPTED FOR PUBLICATION
employed at the receiver, the EXIT charts have to be (N+1)-dimensional to analyse such a system, which makes its em-ployment infeasible. In this case, we may assume howeverthat all transmitters have the same transmission power. Then,an average EXIT chart can be adopted for the entire systemin order to arrive at an indication of the average systemperformance, while varying the number of users, for example.Furthermore, it may be argued that EXIT charts can be usedfor estimating the complexity of an iteratively decoded systemby predicting the number of iterations required for attainingthe target BER performance.
Additionally, based on the EXIT-curve matching techniqueof IrCCs, Irregular Variable Length Coding (IrVLC) wasproposed in [121] for near-capacity joint source and channelcoding. In IrVLC a number of component Variable LengthCoding (VLC) codebooks having different coding rates encodespecific fractions of the input source symbol stream. EXITcharts are used for appropriately selecting these fractions toshape the IrVLC EXIT curve in order to match that of theinner decoder, which allows for near-capacity performance.In [121] an IrVLC was amalgamated with TCM, whereiterative decoding was employed at the receiver for exchangingextrinsic information between the IrVLC and TCM decoders.On the other hand, an IrVLC was used in [122] combinedwith a Time Hopping (TH) Pulse Position Modulation (PPM)-aided Ultra Wide-Band (UWB) Spread Spectrum (SS) impulseradio system. In [122] the TH PPM-aided UWB SS systemwas amalgamated with a URC in conjunction with the losslessIrVLC [121] joint source and channel coding in order to attainnear-capacity performance. Additionally, in [123] iterativedecoding of the IrVLC scheme concatenated with precodedFast Frequency Hopping (FFH) M-ary Frequency Shift Keying(MFSK) was considered. It was shown in [123] that using theproposed scheme, an infinitesimally low BER may be achievedat low SNR values.
On the other hand, the EXIT chart matching technique wasinvoked for designing serially concatenated inner and outercodes in [124]. In [124] the inner code used was a URC,while the outer code was a VLC, where the irregular designwas constituted by a variety of the inner and outer componentcodes and EXIT chart matching was used for minimisingthe area of the open EXIT tunnel between the inner andouter codes’ EXIT curves. Hence, this facilitates operationat Eb/N0 values that are closer to the channel’s capacitybound. Additionally, another irregular design based on EXITcharts was proposed in [110], where a near-capacity IrregularBICM-ID (Ir-BICM-ID) scheme was proposed. The irregulardesign of the scheme uses the three components of BICM-ID,namely the encoder, the URC and the bit-to-symbol mapper.The proposed system was capable of approaching the capacityof coded modulation.
Furthermore, a capacity-approaching cooperative space-time coding scheme employing irregular design for a twin-relay aided network was proposed in [125], where a successiverelaying protocol was employed for the sake of recoveringthe multiplexing loss imposed by a half-duplex three-terminalnetwork. Additionally, near-capacity coding was employedby the proposed system, where the cooperative space-timecodes used at the source and the relays were jointly designed
with the aid of EXIT charts for attaining a near-relaying-channel-capacity performance. As a further advance, in [126]an Irregular Distributed Space-Time (Ir-DST) coding schemedesigned for near-capacity cooperative communications waspresented. The proposed system’s effective throughput wasmaximised with the aid of a joint source-and-relay modedesign procedure. In the system presented in [126], an IrCCwas serially concatenated with a URC and a STBC at thesource node for the sake of approaching the correspondingsource-to-relay link capacity. EXIT charts were used foroptimising the IrCC. On the other hand, another IrCC wasserially concatenated with an identical STBC at the relaynode. The relay’s IrCC was re-optimised using EXIT chartsfor the sake of approaching the relay channel’s capacity andalso to maximise the relay’s coding rate, hence maximisingthe effective throughput. At the destination node, a three-stage iterative decoding scheme was constructed for achievingdecoding convergence to an infinitesimally low BER.
Since the introduction of turbo-code-aided Hybrid Auto-matic Repeat reQuest (HARQ) schemes, research focusedon their complexity reduction. In [127], an early stoppingstrategy was proposed for a turbo HARQ scheme, whichresults in significant complexity reduction, while maintaininga high throughput. Further improvements were also proposedin [127], where a new Deferred Iterations (DI) strategy wasdesigned to take into account the prevalent channel conditions.More explicitly, the proposed DI strategy delays the com-mencement of the turbo-decoding until an open EXIT charttunnel appears, leading to a successful decoding operation.
VI. DESIGN GUIDELINES
In the age of smart phones and tablet PCs, the main drivingforce behind the advances in wireless communications is thepromise of seamless global mobility and flawless high-ratewireless multimedia services. This is required, while meetinga range of contradicting design challenges such as those in-cluded in the illustration of Fig. 44. For example, it is possibleto both increase the effective throughput and simultaneouslyto reduce the BER, if an increased implementation complexityand a higher power consumption may be tolerated to facilitatemore sophisticated signal processing [2].
In the following we will focus on the design of channelcoding utilising the EXIT chart analysis tool, while reflectingon the design trade-offs of Fig. 44. Considering a givencoding rate, we focus on the following design trade-offs:BER, coding gain, interleaving delay and complexity in termsof the number of decoding iterations. Fig. 45 shows theachievable BER of the RSC-coded and URC-precoded schemeof Fig. 24 for a variable number of decoding iterations anda variable interleaver length at Eb/N0 of 3.6 dB. As shownin Fig. 45, one more iteration is necessitated by the systememploying an interleaver length of 100, 000 bits in order toachieve the same BER as that of the system employing aninterleaver of length 800, 000 bits. Furthermore, the systemsusing interleaver lengths of 1, 000 and 10, 000 bits acquirelittle to no gain upon increasing the number of iterationsat Eb/N0 of 3.6 dB. Relating this to the design factors ofFig. 44, it is shown that increasing the complexity in termsof the number of decoding iterations as well as increasing

EL-HAJJAR and HANZO: EXIT CHARTS FOR SYSTEM DESIGN AND ANALYSIS 23
Bit errorrate
Codingrate
Systembandwidth
Coding/interleavingdelayChannel
characteristics
Effectivethroughput
Implementationalcomplexity
Codinggain
SystemDesign
Wirless
Fig. 44. Factors affecting the design of channel coding and modulationschemes c©Hanzo et. al. [4].
the interleaver delay, it is possible to attain an improved BERperformance.
The results shown in Fig. 45 can be related to the EXITcharts and decoding trajectories of Figs. 28, 29, 30 and 31.It has been shown in Section III-D that when sufficientlylong interleavers are used, the decoding trajectory can reachthe (1.0,1.0) point of perfect decoding convergence to avanishingly low BER.
Furthermore, it has been mentioned in Section III-B2 thattwo different methods can be used for evaluating the MI. Oneof the methods computes the MI by evaluating the histogrambased approximation of pE [25, 26, 46] and then applyingEquation (13) or alternatively by using the time averagingmethod [35] of Equations (15) and (17). The histogram-basedand the averaging methods stipulate different assumptions, asdescribed in Section III-A, although they both assume thatthe ‘0’s and ‘1’s of the encoder input bit sequence are equi-probable. When the LLRs satisfy the consistency condition,then the averaging method gives more accurate results as com-pared to the histogram-based method, which on the other handworks better when using long interleavers. The consistencycondition is normally satisfied when all the component in thesystem are optimal and are using no approximation such asthe MAP or Log-MAG algorithms. This does not mean thatthe two methods will result in different EXIT curves. The twomethods can be used to verify that the design is sound bymaking sure that the EXIT curves using the two methods arematching.
It was shown in [128] that when employing non-optimaldecoders relying on several approximations, the EXIT curveof the inner URC decoder does not reach the (1.0,1.0) point,although the URC uses a recursive encoder. It was alsoshown that even if the LLRs of the decoders are clippedat a maximum value, in order to eliminate any chance forthem to saturate, this does not result in the correct EXITcurve for the LLRs satisfying the consistency condition. Itwas concluded in [128] that this phenomenon was due to theassumption used in the demapper and decoders namely thatthe data was Gaussian distributed, even though this assumptionwas inaccurate. Therefore, a LLR pre-processing techniquewas proposed in order to have LLRs output by the demapper
10-62
510
-52
510
-42
510
-32
510
-22
510
-12
5
1
BE
R
0 1 2 3 4 5 6 7 8 9 10
Complexity [Number of Iterations]
QPSK GMURC, RSC(2,1,3)3.6 dB
1,000 bits10,000 bits100,000 bits800,000 bits
Fig. 45. Achievable BER of the RSC-coded and URC-precoded scheme ofFig. 24 in combination with the outer RSC(2,1,3) and operating for at Eb/N0
of 3.6 dB with different interleaver lengths and number of iterations
satisfying the consistency condition.
VII. CONCLUSIONS
In order for any communications system to attain a lowBER at SNRs close to the channel capacity, it is essentialto invoke channel coding and iterative decoding. Iterativedecoding can be done for parallel as well as serially con-catenated systems. Substantial efforts have been invested inoptimising the performance of concatenated codes in orderto improve the slopes of their BER curves and to attain anear-capacity performance. Recently, significant efforts havealso been dedicated to studying the convergence behaviour ofiterative decoding. EXIT charts were proposed as a powerfulsemi-analytical tools devised for analysing the convergencebehaviour of iteratively decoded systems, where MI betweenthe data bits at the transmitter and the soft values at thereceiver were used for describing the exchange of extrinsicinformation between the constituent decoders.
The main objective of employing EXIT charts is to predictthe convergence behaviour of iterative decoding by analysingthe evolution of the MI exchange between the constituent de-coders in consecutive iterations. In this paper, we have shownhow the EXIT charts can be used for analysing and designingiteratively decoded systems using two-stage and three-stageiteratively decoded serially concatenated systems as designexamples. The EXIT chart properties can be summarised asfollows:
• Ideally, in order for the exchange of extrinsic informationbetween the inner and the outer decoders to convergefor the sake of achieving a vanishingly low BER ata specific Eb/N0 value, the EXIT curve of the innerdecoder recorded at the Eb/N0 value of interest and thatof the outer RSC decoder should not intersect beforereaching the (1.0, 1.0) point.
• This implies that given Ia = 1.0, we have Ie = 1.0and provided that this condition is satisfied, an open

24 IEEE COMMUNICATIONS SURVEYS & TUTORIALS, ACCEPTED FOR PUBLICATION
convergence tunnel appears in the EXIT chart. Thenarrower the tunnel, the more iterations are required forreaching the (1.0, 1.0) point and the closer the BER curveapproaches the vertical line representing the channelcapacity.
• If however, the two extrinsic MI transfer characteristicsintersect at a point close to the vertical line at Ii,a = 1.0− rather than at the (1.0, 1.0) point − then a low BERmay still be achieved, although it will remain higher thanthe BER of the schemes having an intersection at the(1.0, 1.0) point. These types of EXIT tunnels are referredto here as semi-convergent tunnels.
• The EXIT chart based decoding convergence predictionsare usually verified by the Monte-Carlo simulation basediterative decoding trajectory as detailed in Section III-B4.
• In order for the EXIT charts of the inner and outerdecoders to intersect at the (1.0, 1.0) point, a recursiveinner decoder component is needed for maximising theinterleaver gain and for avoiding the formation of aBER floor. This can be achieved by employing a URC,which has an IIR and hence it efficiently randomises theextrinsic information without increasing the interleaverdelay and without reducing the throughput.
• The application of EXIT charts is based on two as-sumptions, namely on having a high interleaver length,which ensures that the a priori LLR values are fairlyuncorrelated and the probability density function of thea priori LLR values is Gaussian. It has been shown inSection III-D that when using short interleavers, thesetwo assumptions become less accurate. This implies thatthe EXIT chart prediction of having an open tunnel andhence a low BER at the specific Eb/N0 is no longer valid.
• EXIT charts can also be used for predicting the con-vergence behaviour of three-stage iteratively decodedsystems. In this case, 3D EXIT charts are generated,where 2D EXIT charts can be generated by projecting theintersection between the 3D EXIT curves of the ”innerand intermediate” or the ”intermediate and outer” decoderonto a 2D EXIT chart with the outer or inner decoderEXIT charts, respectively.
• The maximum achievable throughput of a system is equalto the area under the EXIT curve of the inner decoder asdetailed in Section IV.
LIST OF ACRONYMS
AGM Anti-Gray MappingAWGN Additive White Gaussian NoiseBCJR Bahl-Cocke-Jelinek-Raviv algorithmBEC Binary Erasure ChannelBER Bit Error RateBICM Bit-Interleaved Coded ModulationBICM-ID BICM relying on Iterative DetectionCC Convolutional CodesCCMC Continuous-input Continuous-output Memo-
ryless ChannelsDCMC Discrete-input Continuous-output Memory-
less ChannelDI Deferred Iterations
EXIT Extrinsic Information TransferFFH Fast Frequency-HoppingGM Gray MappingGP Generator PolynomialsHARQ Hybrid Automatic Repeat reQuestIIR Infinite Impulse ResponseIr-BICM-ID Irregular BICM-IDIrCC Irregular Convolutional CodesIr-DST Irregular Distributed Space-Time codingIrVLC Irregular Variable Length CodingISI Inter-Symbol-InterferenceLLR Logarithmic-Likelihood RatioLog-MAP Log Maximum Aposteriori ProbabilityMAP Maximum A PosterioriMFSK M-ary Frequency-Shift KeyingMI Mutual InformationMLSE Maximum Likelihood Sequence EstimationMUD Multi-User DetectionPDF Probability Density FunctionPLR Packet Loss RatioPPM Pulse Position ModulationRSC Recursive Systematic ConvolutionalSISO Soft-Input Soft-OutputSNR Signal to Noise RatioSP Sphere PackingSS Spread SpectrumSTBC Space-Time Block CodingTCM Trellis Coded ModulationTH Time HoppingTTCM Turbo Trellis Coded ModulationURC Unity-Rate CodeUWB Ultra Wide-BandVLC Variable Length Coding
REFERENCES
[1] L. Hanzo, O. Alamri, M. El-Hajjar and N. Wu, Near-Capacity Multi-Functional MIMO Systems: Sphere-Packing, Iterative Detection andCooperation. John Wiley & Sons - IEEE Press, 2009.
[2] L. Hanzo, M. El-Hajjar and O. Alamri, “Near-Capacity WirelessTransceivers and Cooperative Communications in the MIMO Era:Evolution of Standards, Waveform Design, and Future Perspectives,”Proc. IEEE, vol. 99, pp. 1343–1385, August 2011.
[3] C. E. Shannon, “A mathematical theory of communication,” BellSystems Technical Journal, vol. 27, pp. 623–656, October 1948.
[4] L. Hanzo, T.H. Liew, B.L. Yeap, R.Y.S. Tee, S.X. Ng, Turbo Coding,Turbo Equalisation and Space-Time Coding: EXIT-Chart-Aided Near-Capacity Designs for Wireless Channels, Second Edition. John Wiley& Sons - IEEE Press, 2011.
[5] L. Hanzo, S.X. Ng, T. Keller and W. Webb, Quadrature amplitudemodulation: From basics to adaptive trellis-coded, turbo equalisedand space-time coded OFDM, CDMA and MC-CDMA systems, 2ndEdition. Chichester, England: John Wiley and Sons Ltd and IEEEPress, 2004.
[6] R.W. Hamming, “Error detecting and error correcting codes,” BellSystems Tech. Journal, vol. 29, pp. 41–56, 1950.
[7] P. Elias, “Coding for noisy channels,” IRE Conv. Rept., pp. 37–47,1955.
[8] J. Wozencraft, “Sequential decoding for reliable communications,” IRENat. Conv. Rec., vol. 5, pp. 11–25, 1957.
[9] J. Wozencraft and B. Reiffen, Sequential Decoding. MIT Press, 1961.[10] R. Fano, “A heuristic discussion of probabilistic decoding,” IEEE
Trans. Inf. Theory, vol. 9, pp. 64–74, April 1963.[11] J. Massey, Threshold Decoding. MIT Press, 1963.

EL-HAJJAR and HANZO: EXIT CHARTS FOR SYSTEM DESIGN AND ANALYSIS 25
[12] A. Viterbi, “Error bounds for convolutional codes and an asymptoti-cally optimum decoding algorithm,” IEEE Trans. Inf. Theory, vol. 13,pp. 260–269, April 1967.
[13] G. Forney, “The Viterbi algorithm,” Proc. IEEE, vol. 61, pp. 268–278,march 1973.
[14] L. Bahl, J. Cocke, F. Jelinek and J. Raviv, “Optimal decoding of linearcodes for minimizing symbol error rate,” IEEE Trans. Inf. Theory,vol. 20, no. 2, pp. 284–287, 1974.
[15] G. Forney, Concatenated codes. Cambridge: MIT Press, 1966.[16] C. Berrou, A. Glavieux and P. Thitimajshima, “Near Shannon limit
error-correcting coding and decoding: Turbo-codes. 1,” in IEEE Inter-national Conference on Communications, vol. 2, (Geneva), pp. 1064–1070, May 1993.
[17] C. Berrou, A. Glavieux, “Near optimum error correcting coding anddecoding: turbo-codes,” IEEE Trans. Commun., vol. 44, pp. 1261–1271, October 1996.
[18] D. Divsalar and F. Pollara, “Multiple turbo codes for deep-spacecommunications,” Telecommunications and Data Acquisition ProgressReport 42-121, Jet Propulsion Laboratory, Pasadena, CA, May 1995.
[19] S. Benedetto and G. Montorsi, “Serial concatenation of block andconvolutional codes,” Electronics Letters, vol. 32, pp. 887–888, May1996.
[20] G. Caire, G. Taricco and E. Biglieri, “Bit-interleaved coded modu-lation,” IEEE Trans. Information Theory, vol. 44, pp. 927–946, May1998.
[21] X. Li and J. A. Ritcey, “Bit-interleaved coded modulation with iterativedecoding,” IEEE Commun. Lett., vol. 1, pp. 169–171, November 1997.
[22] X. Li and J. A. Ritcey, “Bit-interleaved coded modulation with iter-ative decoding using soft feedback,” IEE Electronics Letters, vol. 34,pp. 942–943, May 1998.
[23] M. Peleg, I. Sason, S. Shamai and A. Elia, “On interleaved differen-tially encoded convolutional codes,” IEEE Trans. Inf. Theory, vol. 45,pp. 2572–2582, November 1999.
[24] S. ten Brink, “Designing iterative decoding schemes with the extrinsicinformation transfer chart,” AEU International Journal of Electronicsand Communications, vol. 54, pp. 389–398, November 2000.
[25] S. ten Brink, “Convergence behavior of iteratively decoded parallelconcatenated codes,” IEEE Trans. Commun., vol. 49, no. 10, pp. 1727–1737, 2001.
[26] S. Ten Brink, “Code characteristic matching for iterative decoding ofserially concatenated codes,” Annals of Telecommunications, vol. 56,pp. 394–408, 2001.
[27] T. J. Richardson and R. Urbanke, “The capacity of low-densityparity-check codes under message-passing decoding,” IEEE Trans. Inf.Theory, vol. 47, pp. 599–618, February 2001.
[28] T.J. Richardson, A. Shokrollahi and R. Urbanke, “Design of capacity-approaching low-density parity-check codes,” IEEE Trans. Inf. Theory,vol. 47, pp. 619–637, February 2001.
[29] S. Y. Chung, G. D. Forney, T. J. Richardson and R. Urbanke, “Onthe design of low-density parity-check codes within 0.0045 dB of theShannon limit,” IEEE Commun. Lett., vol. 5, pp. 58–60, February 2001.
[30] S. ten Brink, “Convergence of multi-dimensional iterative decodingschemes,” in 35th Asilomar Conference on Signals, Systems, andComputers, vol. 1, (Pacific Grove, CA), pp. 270–274, November 2001.
[31] H. El Gamal and A.R. Hammons, “Analyzing the turbo decoder usingthe Gaussian approximation,” IEEE J. Sel. Areas Commun., vol. 47,pp. 671–686, February 2001.
[32] B. Scanavino, G. Montorsi and S. Benedetto, “Convergence propertiesof iterative decoders working at bit and symbol level,” in Proceed-ings of IEEE Global Telecommunications Conference (GLOBECOM),vol. 2, (San Antonio, TX), pp. 1037–1041, November 2001.
[33] A. Grant, “Convergence of non-binary iterative decoding,” in Proc.IEEE Global Telecommunications Conference (GLOBECOM), vol. 2,(San Antonio, USA), pp. 1058–1062, November 2001.
[34] M. Tuchler and J. Hagenauer, “EXIT charts of irregular codes,” inConference on Information Science and Systems, (Princtone, NJ),pp. 748–753, March 2002.
[35] M. Tuchler, S. ten Brink and J. Hagenauer, “Measures for tracing con-vergence of iterative decoding algorithms,” in Proc. 4th InternationalITG Conference on Source and Channel Coding, (Berlin, Germany),pp. 53–60, 2002.
[36] M. Tuchler, “Convergence prediction for iterative decoding of threefoldconcatenated systems,” in IEEE Global Telecommunications Confer-ence (GLOBECOM ), vol. 2, pp. 1358–1362, November 2002.
[37] M. Tuchler, “Design of serially concatenated systems for long orshort block lengths,” in Proc. IEEE International Conference onCommunications (ICC), vol. 4, (Anchorage Alaska, USA), pp. 2948–2952, May 2003.
[38] M. Tuchler, “Design of serially concatenated systems depending on theblock length,” IEEE Trans. Commun., vol. 52, pp. 209–218, February2004.
[39] J.W. Lee and R.E. Blahut, “Lower bound on BER of finite-length turbocodes based on EXIT characteristics,” IEEE Commun. Lett., vol. 8,pp. 238–240, April 2004.
[40] J.W. Lee and R.E. Blahut, “Convergence Analysis and BER Perfor-mance of Finite-Length Turbo Codes,” IEEE Trans. Commun., vol. 55,pp. 1033–1043, May 2007.
[41] F. Brannstrom, L. K. Rasmussen and A. Grant, “Optimal scheduling formultiple serially concatenated codes,” in 3rd International Symposiumon Turbo Codes and Related Topics, (Brest, France), pp. 383–386,September 2003.
[42] F. Brannstrom, L.K. Rasmussen and A.J. Grant, “Convergence analysisand optimal scheduling for multiple concatenated codes,” IEEE Trans.Inf. Theory, vol. 51, no. 9, pp. 3354–3364, 2005.
[43] J. Kliewer, S.X. Ng and L. Hanzo, “Efficient Computation of EXITFunctions for Nonbinary Iterative Decoding,” IEEE Trans. Commun.,vol. 54, pp. 2133–2136, December 2006.
[44] I. Land, P. Hoeher and S. Gligorevic, “Computation of symbol-wisemutual information in transmission systems with logAPP decoders andapplication to EXIT charts,” in Proc. International ITG Conference onSource and Channel Coding (SCC), (Erlangen, Germany), pp. 195–202, January 2004.
[45] D. Divsalar, S. Dolinar and F. Pollara, “Low complexity turbo-likecodes,” in 2nd International Symposium on Turbo Codes and RelatedTopics, (Brest, France), pp. 73–80, September 2000.
[46] S. Ten Brink, “Design of serially concatenated codes based on iterativedecoding convergence,” in Proc. 2nd International Symposium onTurbo Codes and Related Topics , (Brest, France), pp. 319–322,September 2000.
[47] S. ten Brink, “Convergence of iterative decoding,” Electronics Letters,vol. 35, no. 13, pp. 1117–1119, 1999.
[48] S.J. Johnson, Iterative Error Correction: Turbo, Low-Density Parity-Check and Repeat-Accumulate Codes. Cambridge University Press,November 2009.
[49] J. Hagenauer, “The EXIT chart - introduction to extrinsic informa-tion transfer in iterative processing,” in European Signal ProcessingConference, (Vienna, Austria), pp. 1541–1548, September 2004.
[50] J.M. Walsh, P.A. Regalia and C.R. Johnson, “Turbo Decoding as It-erative Constrained Maximum-Likelihood Sequence Detection,” IEEETrans. Inf. Theory, vol. 52, pp. 5426–5437, December 2006.
[51] J. Hagenauer, “The turbo principle: Tutorial introduction and state ofthe art,” in Proc. 1st International Symposium on Turbo Codes andRelated Topics, (Brest, France), pp. 1–12, 1997.
[52] S. Benedetto, D. Divsalar, G. Montorsi and F. Pollara, “Serial concate-nation of interleaved codes: performance analysis, design and iterativedecoding,” IEEE Trans. Inf. Theory, vol. 44, pp. 909–926, May 1998.
[53] S. Benedetto, D. Divsalar, G. Montorsi and F. Pollara, “Analysis,design and iterative decoding of double serially concatenated codeswith interleavers,” IEEE J. Sel. Areas Commun., vol. 16, pp. 231–244,February 1998.
[54] L. Hanzo, R.G. Maunder, J. Wang and L.-L. Yang, Near-CapacityVariable-Length Coding: Regular and EXIT Chart-Aided IrregularDesigns. John Wiley & Sons - IEEE Press, 2011.
[55] S. Huettinger and J. Hubber, “Design of multiple turbo codes withtransfer characteristics of component codes,” in Proc. Conference onInformation Science and Systems, March 2002.
[56] C. Douillard, M. Jezequel, C. Berrou, A. Picart, P. Didier and A.Glavieux, “Iterative correction of intersymbol interference: turbo equal-ization,” European Trans. Telecommunications, vol. 6, pp. 507–511,September/October 1995.
[57] S. ten Brink, J. Speidel and R.-H. Yan, “Iterative demapping and de-coding for multilevel modulation,” in IEEE Global TelecommunicationsConference (GLOBCOM), vol. 1, pp. 579–584, 1998.
[58] M. Moher, “An iterative multiuser decoder for near-capacity commu-nications,” IEEE Trans. Commun., vol. 46, pp. 870–880, July 1998.
[59] R. Bauer and J. Hagenauer, “On variable length codes for iterativesource/channel decoding,” in Proc. Data Compression Conference(DCC), (Snowbird, UT), pp. 273–282, March 2001.
[60] M. Adrat, P. Vary and J. Spittka, “Iterative source-channel decoderusing extrinsic information from softbit-source decoding,” in IEEEInternational Conference on Acoustics, Speech and Signal Processing,pp. 2653–2656, May 2001.
[61] B. Vucetic, Y. Li, L.C. Perez and F. Jiang, “Recent Advances in TurboCode Design and Theory,” Proc. IEEE, vol. 95, pp. 1323–1344, June2007.
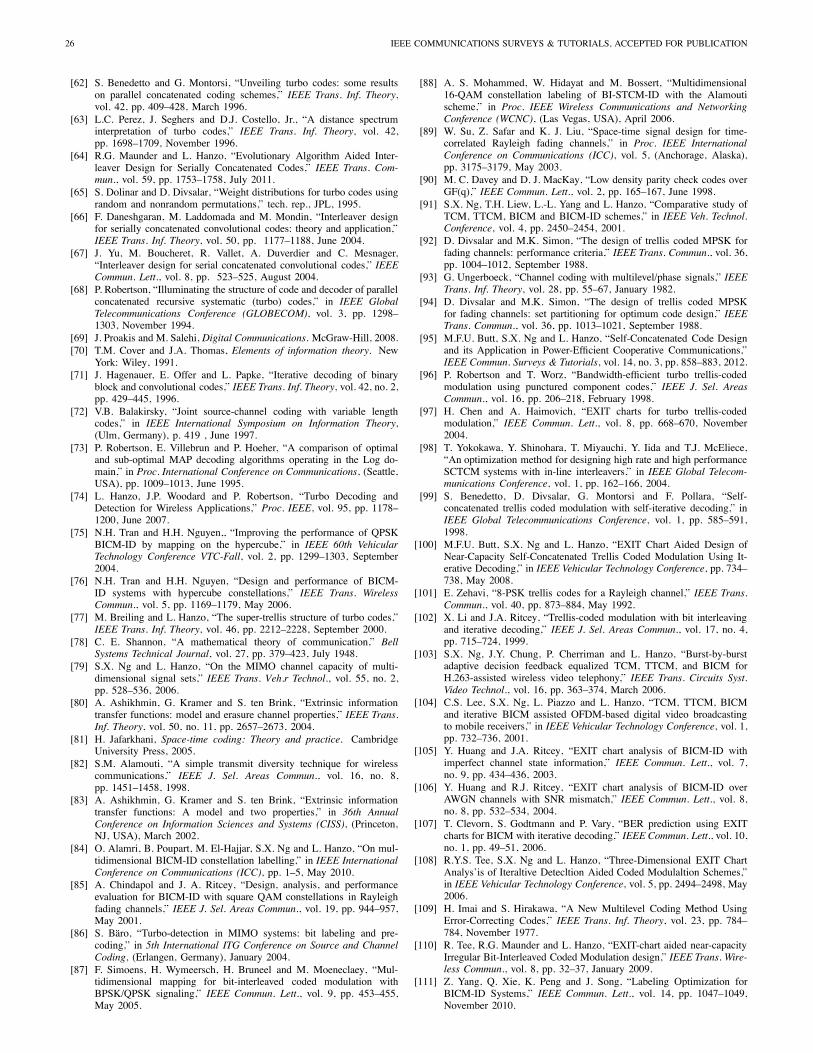
26 IEEE COMMUNICATIONS SURVEYS & TUTORIALS, ACCEPTED FOR PUBLICATION
[62] S. Benedetto and G. Montorsi, “Unveiling turbo codes: some resultson parallel concatenated coding schemes,” IEEE Trans. Inf. Theory,vol. 42, pp. 409–428, March 1996.
[63] L.C. Perez, J. Seghers and D.J. Costello, Jr., “A distance spectruminterpretation of turbo codes,” IEEE Trans. Inf. Theory, vol. 42,pp. 1698–1709, November 1996.
[64] R.G. Maunder and L. Hanzo, “Evolutionary Algorithm Aided Inter-leaver Design for Serially Concatenated Codes,” IEEE Trans. Com-mun., vol. 59, pp. 1753–1758, July 2011.
[65] S. Dolinar and D. Divsalar, “Weight distributions for turbo codes usingrandom and nonrandom permutations,” tech. rep., JPL, 1995.
[66] F. Daneshgaran, M. Laddomada and M. Mondin, “Interleaver designfor serially concatenated convolutional codes: theory and application,”IEEE Trans. Inf. Theory, vol. 50, pp. 1177–1188, June 2004.
[67] J. Yu, M. Boucheret, R. Vallet, A. Duverdier and C. Mesnager,“Interleaver design for serial concatenated convolutional codes,” IEEECommun. Lett., vol. 8, pp. 523–525, August 2004.
[68] P. Robertson, “Illuminating the structure of code and decoder of parallelconcatenated recursive systematic (turbo) codes,” in IEEE GlobalTelecommunications Conference (GLOBECOM), vol. 3, pp. 1298–1303, November 1994.
[69] J. Proakis and M. Salehi, Digital Communications. McGraw-Hill, 2008.[70] T.M. Cover and J.A. Thomas, Elements of information theory. New
York: Wiley, 1991.[71] J. Hagenauer, E. Offer and L. Papke, “Iterative decoding of binary
block and convolutional codes,” IEEE Trans. Inf. Theory, vol. 42, no. 2,pp. 429–445, 1996.
[72] V.B. Balakirsky, “Joint source-channel coding with variable lengthcodes,” in IEEE International Symposium on Information Theory,(Ulm, Germany), p. 419 , June 1997.
[73] P. Robertson, E. Villebrun and P. Hoeher, “A comparison of optimaland sub-optimal MAP decoding algorithms operating in the Log do-main,” in Proc. International Conference on Communications, (Seattle,USA), pp. 1009–1013, June 1995.
[74] L. Hanzo, J.P. Woodard and P. Robertson, “Turbo Decoding andDetection for Wireless Applications,” Proc. IEEE, vol. 95, pp. 1178–1200, June 2007.
[75] N.H. Tran and H.H. Nguyen,, “Improving the performance of QPSKBICM-ID by mapping on the hypercube,” in IEEE 60th VehicularTechnology Conference VTC-Fall, vol. 2, pp. 1299–1303, September2004.
[76] N.H. Tran and H.H. Nguyen, “Design and performance of BICM-ID systems with hypercube constellations,” IEEE Trans. WirelessCommun., vol. 5, pp. 1169–1179, May 2006.
[77] M. Breiling and L. Hanzo, “The super-trellis structure of turbo codes,”IEEE Trans. Inf. Theory, vol. 46, pp. 2212–2228, September 2000.
[78] C. E. Shannon, “A mathematical theory of communication,” BellSystems Technical Journal, vol. 27, pp. 379–423, July 1948.
[79] S.X. Ng and L. Hanzo, “On the MIMO channel capacity of multi-dimensional signal sets,” IEEE Trans. Veh.r Technol., vol. 55, no. 2,pp. 528–536, 2006.
[80] A. Ashikhmin, G. Kramer and S. ten Brink, “Extrinsic informationtransfer functions: model and erasure channel properties,” IEEE Trans.Inf. Theory, vol. 50, no. 11, pp. 2657–2673, 2004.
[81] H. Jafarkhani, Space-time coding: Theory and practice. CambridgeUniversity Press, 2005.
[82] S.M. Alamouti, “A simple transmit diversity technique for wirelesscommunications,” IEEE J. Sel. Areas Commun., vol. 16, no. 8,pp. 1451–1458, 1998.
[83] A. Ashikhmin, G. Kramer and S. ten Brink, “Extrinsic informationtransfer functions: A model and two properties,” in 36th AnnualConference on Information Sciences and Systems (CISS), (Princeton,NJ, USA), March 2002.
[84] O. Alamri, B. Poupart, M. El-Hajjar, S.X. Ng and L. Hanzo, “On mul-tidimensional BICM-ID constellation labelling,” in IEEE InternationalConference on Communications (ICC), pp. 1–5, May 2010.
[85] A. Chindapol and J. A. Ritcey, “Design, analysis, and performanceevaluation for BICM-ID with square QAM constellations in Rayleighfading channels,” IEEE J. Sel. Areas Commun., vol. 19, pp. 944–957,May 2001.
[86] S. Baro, “Turbo-detection in MIMO systems: bit labeling and pre-coding,” in 5th International ITG Conference on Source and ChannelCoding, (Erlangen, Germany), January 2004.
[87] F. Simoens, H. Wymeersch, H. Bruneel and M. Moeneclaey, “Mul-tidimensional mapping for bit-interleaved coded modulation withBPSK/QPSK signaling,” IEEE Commun. Lett., vol. 9, pp. 453–455,May 2005.
[88] A. S. Mohammed, W. Hidayat and M. Bossert, “Multidimensional16-QAM constellation labeling of BI-STCM-ID with the Alamoutischeme,” in Proc. IEEE Wireless Communications and NetworkingConference (WCNC), (Las Vegas, USA), April 2006.
[89] W. Su, Z. Safar and K. J. Liu, “Space-time signal design for time-correlated Rayleigh fading channels,” in Proc. IEEE InternationalConference on Communications (ICC), vol. 5, (Anchorage, Alaska),pp. 3175–3179, May 2003.
[90] M. C. Davey and D. J. MacKay, “Low density parity check codes overGF(q),” IEEE Commun. Lett., vol. 2, pp. 165–167, June 1998.
[91] S.X. Ng, T.H. Liew, L.-L. Yang and L. Hanzo, “Comparative study ofTCM, TTCM, BICM and BICM-ID schemes,” in IEEE Veh. Technol.Conference, vol. 4, pp. 2450–2454, 2001.
[92] D. Divsalar and M.K. Simon, “The design of trellis coded MPSK forfading channels: performance criteria,” IEEE Trans. Commun., vol. 36,pp. 1004–1012, September 1988.
[93] G. Ungerboeck, “Channel coding with multilevel/phase signals,” IEEETrans. Inf. Theory, vol. 28, pp. 55–67, January 1982.
[94] D. Divsalar and M.K. Simon, “The design of trellis coded MPSKfor fading channels: set partitioning for optimum code design,” IEEETrans. Commun., vol. 36, pp. 1013–1021, September 1988.
[95] M.F.U. Butt, S.X. Ng and L. Hanzo, “Self-Concatenated Code Designand its Application in Power-Efficient Cooperative Communications,”IEEE Commun. Surveys & Tutorials, vol. 14, no. 3, pp. 858–883, 2012.
[96] P. Robertson and T. Worz, “Bandwidth-efficient turbo trellis-codedmodulation using punctured component codes,” IEEE J. Sel. AreasCommun., vol. 16, pp. 206–218, February 1998.
[97] H. Chen and A. Haimovich, “EXIT charts for turbo trellis-codedmodulation,” IEEE Commun. Lett., vol. 8, pp. 668–670, November2004.
[98] T. Yokokawa, Y. Shinohara, T. Miyauchi, Y. Iida and T.J. McEliece,“An optimization method for designing high rate and high performanceSCTCM systems with in-line interleavers,” in IEEE Global Telecom-munications Conference, vol. 1, pp. 162–166, 2004.
[99] S. Benedetto, D. Divsalar, G. Montorsi and F. Pollara, “Self-concatenated trellis coded modulation with self-iterative decoding,” inIEEE Global Telecommunications Conference, vol. 1, pp. 585–591,1998.
[100] M.F.U. Butt, S.X. Ng and L. Hanzo, “EXIT Chart Aided Design ofNear-Capacity Self-Concatenated Trellis Coded Modulation Using It-erative Decoding,” in IEEE Vehicular Technology Conference, pp. 734–738, May 2008.
[101] E. Zehavi, “8-PSK trellis codes for a Rayleigh channel,” IEEE Trans.Commun., vol. 40, pp. 873–884, May 1992.
[102] X. Li and J.A. Ritcey, “Trellis-coded modulation with bit interleavingand iterative decoding,” IEEE J. Sel. Areas Commun., vol. 17, no. 4,pp. 715–724, 1999.
[103] S.X. Ng, J.Y. Chung, P. Cherriman and L. Hanzo, “Burst-by-burstadaptive decision feedback equalized TCM, TTCM, and BICM forH.263-assisted wireless video telephony,” IEEE Trans. Circuits Syst.Video Technol., vol. 16, pp. 363–374, March 2006.
[104] C.S. Lee, S.X. Ng, L. Piazzo and L. Hanzo, “TCM, TTCM, BICMand iterative BICM assisted OFDM-based digital video broadcastingto mobile receivers,” in IEEE Vehicular Technology Conference, vol. 1,pp. 732–736, 2001.
[105] Y. Huang and J.A. Ritcey, “EXIT chart analysis of BICM-ID withimperfect channel state information,” IEEE Commun. Lett., vol. 7,no. 9, pp. 434–436, 2003.
[106] Y. Huang and R.J. Ritcey, “EXIT chart analysis of BICM-ID overAWGN channels with SNR mismatch,” IEEE Commun. Lett., vol. 8,no. 8, pp. 532–534, 2004.
[107] T. Clevorn, S. Godtmann and P. Vary, “BER prediction using EXITcharts for BICM with iterative decoding,” IEEE Commun. Lett., vol. 10,no. 1, pp. 49–51, 2006.
[108] R.Y.S. Tee, S.X. Ng and L. Hanzo, “Three-Dimensional EXIT ChartAnalys’is of Iteraltive Detecltion Aided Coded Modulaltion Schemes,”in IEEE Vehicular Technology Conference, vol. 5, pp. 2494–2498, May2006.
[109] H. Imai and S. Hirakawa, “A New Multilevel Coding Method UsingError-Correcting Codes,” IEEE Trans. Inf. Theory, vol. 23, pp. 784–784, November 1977.
[110] R. Tee, R.G. Maunder and L. Hanzo, “EXIT-chart aided near-capacityIrregular Bit-Interleaved Coded Modulation design,” IEEE Trans. Wire-less Commun., vol. 8, pp. 32–37, January 2009.
[111] Z. Yang, Q. Xie, K. Peng and J. Song, “Labeling Optimization forBICM-ID Systems,” IEEE Commun. Lett., vol. 14, pp. 1047–1049,November 2010.

EL-HAJJAR and HANZO: EXIT CHARTS FOR SYSTEM DESIGN AND ANALYSIS 27
[112] S. X. Ng, O. Alamri, Y. Li. J. Kliewer and L. Hanzo, “Near-capacityturbo trellis coded modulation design based on EXIT charts and unionbounds,” IEEE Trans. Commun., vol. 56, pp. 2030–2039, December2008.
[113] S. Benedetto and G. Montorsi, “Design of parallel concatenatedconvolutional codes,” IEEE Trans. Commun., vol. 44, pp. 591–600,May 1996.
[114] M.S.C. Ho, S.S. Pietrobon and T. Giles, “Improving the constituentcodes of turbo encoders,” IEEE Global Telecommunications Confer-ence, vol. 6, pp. 3525–3529, 1998.
[115] S. Benedetto, R. Garello and G. Montorsi, “A search for goodconvolutional codes to be used in the construction of turbo codes,”IEEE Trans. Commun., vol. 46, pp. 1101–1105, September 1998.
[116] C. Kose, W.-Y. Weng and R.D. Wesel, “Serially concatenated trelliscoded modulation for the compound periodic erasures channel,” inIEEE International Conference on Communications, vol. 4, pp. 2953–2957, 2003.
[117] A. Banerjee, F. Vatta, B. Scanavino and D.J. Costello, “Nonsystematicturbo codes,” IEEE Trans. Commun., vol. 53, pp. 1841–1849, Novem-ber 2005.
[118] C.-Y. Wei, J. Akhtman, S.X. Ng and L. Hanzo, “Iterative Near-Maximum-Likelihood Detection in Rank-Deficient Downlink SDMASystems,” IEEE Trans. Veh. Technol., vol. 57, pp. 653–657, January2008.
[119] V. Kuhn, “Analysis of iterative multi-user detection schemes with EXITcharts,” in IEEE Eighth International Symposium on Spread SpectrumTechniques and Applications, pp. 535–539, August-September 2004.
[120] K. Li and X. Wang, “EXIT chart analysis of turbo multiuser detection,”IEEE Trans. Wireless Commun., vol. 4, pp. 300–311, January 2005.
[121] R.G. Maunder, J. Wang, S.X. Ng, L.-L. Yang and L. Hanzo, “Onthe Performance and Complexity of Irregular Variable Length Codesfor Near-Capacity Joint Source and Channel Coding,” IEEE Trans.Wireless Commun., vol. 7, pp. 1338–1347, April 2008.
[122] R.A. Riaz, R.G. Maunder, M.F.U. Butt, S.X. Ng, S. Chen and L.Hanzo, “EXIT-Chart-Aided Three-Stage Concatenated UltrawidebandTime-Hopping Spread-Spectrum Impulse Radio Design,” IEEE Trans.Veh. Technol., vol. 58, pp. 5320–5324, November 2009.
[123] S. Ahmed, R.G. Maunder, L.-L. Yang and L. Hanzo, “Iterative Detec-tion of Unity-Rate Precoded FFH-MFSK and Irregular Variable-LengthCoding,” IEEE Trans. Veh.Technol., vol. 58, pp. 3765–3770, September2009.
[124] R.G. Maunder and L. Hanzo, “Near-capacity irregular variable lengthcoding and irregular unity rate coding,” IEEE Trans. Wireless Com-mun., vol. 8, pp. 5500–5507, November 2009.
[125] L. Kong, S.X. Ng, R.G. Maunder and L. Hanzo, “Near-Capacity Coop-erative Space-Time Coding Employing Irregular Design and SuccessiveRelaying,” IEEE Trans. Commun., vol. 58, pp. 2232–2241, August2010.
[126] L. Kong, S.X. Ng, R.G. Maunder and L. Hanzo, “Maximum-Throughput Irregular Distributed Space-Time Code for Near-CapacityCooperative Communications,” IEEE Trans. Veh. Technol., vol. 59,pp. 1511–1517, March 2010.
[127] H. Chen, R.G. Maunder and L. Hanzo, “Lookup-Table-Based Deferred-Iteration Aided Low-Complexity Turbo Hybrid ARQ,” IEEE Trans.Veh. Technol., vol. 60, pp. 3045–3053, September 2011.
[128] M. El-Hajjar, O. Alamri, R.G. Maunder and L. Hanzo, “LayeredSteered Space Time-Spreading-Aided Generalized MC DS-CDMA,”IEEE Trans. Veh. Technol., vol. 59, pp. 999–1005, February 2010.
Mohammed El-Hajjar is a lecturer in the Elec-tronics and Computer Science in the University ofSouthampton. He received his BEng degree in Elec-trical Engineering from the American Universityof Beirut, Lebanon in 2004. He then received anMSc in Radio Frequency Communication Systemsand PhD in Wireless Communications both fromthe University of Southampton, UK in 2005 and2008, respectively. Following the PhD, he joinedImagination Technologies as a research engineer,where he worked on designing and developing the
BICM peripherals in Imagination’s multi-standard communications platform,which resulted in several patent applications. In January 2012, he joinedthe Electronics and Computer Science in the University of Southampton asa lecturer in the Communications, Signal Processing and Control researchgroup. He is the recipient of several academic awards and has published aWiley-IEEE book and in excess of 40 journal and international conferencepapers. His research interests include mm-wave communications, massiveMIMO, cooperative communications and Radio over fibre systems.
Lajos Hanzo (http://www-mobile.ecs.soton.ac.uk)FREng, FIEEE, FIET, Fellow of EURASIP, DScreceived his degree in electronics in 1976 andhis doctorate in 1983. In 2009 he was awardedthe honorary doctorate “Doctor Honoris Causa” bythe Technical University of Budapest. During his35-year career in telecommunications he has heldvarious research and academic posts in Hungary,Germany and the UK. Since 1986 he has been withthe School of Electronics and Computer Science,University of Southampton, UK, where he holds
the chair in telecommunications. He has successfully supervised 80 PhDstudents, co-authored 20 John Wiley/IEEE Press books on mobile radiocommunications totalling in excess of 10 000 pages, published 1300 researchentries at IEEE Xplore, acted both as TPC and General Chair of IEEEconferences, presented keynote lectures and has been awarded a number ofdistinctions. Currently he is directing a 100-strong academic research team,working on a range of research projects in the field of wireless multimediacommunications sponsored by industry, the Engineering and Physical SciencesResearch Council (EPSRC) UK, the European IST Programme and the MobileVirtual Centre of Excellence (VCE), UK. He is an enthusiastic supporter ofindustrial and academic liaison and he offers a range of industrial courses.He is also a Governor of the IEEE VTS. During 2008 - 2012 he was theEditor-in-Chief of the IEEE Press and since 2009 he has been a ChairedProfessor also at Tsinghua University, Beijing. For further information onresearch in progress and associated publications please refer to http://www-mobile.ecs.soton.ac.uk