Embed Size (px)
DESCRIPTION
IDV Perspective: Climatology of the 2005 Hurricane Season. Shelley O. Holmberg University of North Carolina at Charlotte, Charlotte, NC Brian J. Etherton University of North Carolina at Charlotte, Charlotte, NC W. Jeff Weber Unidata Program Center, Boulder, CO. Acknowledgements. - PowerPoint PPT Presentation
Citation preview

IDV Perspective: Climatology of the 2005 Hurricane Season
Shelley O. HolmbergUniversity of North Carolina at Charlotte, Charlotte, NC
Brian J. EthertonUniversity of North Carolina at Charlotte, Charlotte, NC
W. Jeff WeberUnidata Program Center, Boulder, CO
Acknowledgements
Project: Interactive Multimedia Prototype for Creating Case Studies in the Community - the 2005 Atlantic Hurricane Season
Sponsor: Unidata/University Corporation for Atmospheric Research (UCAR)
Thanks to: Greg Byrd, Bruce Muller, and Pat Parrish at the Cooperative Program for Operational Meteorology, Education, and Training (COMET) and Richard Cianflone

Setting Context
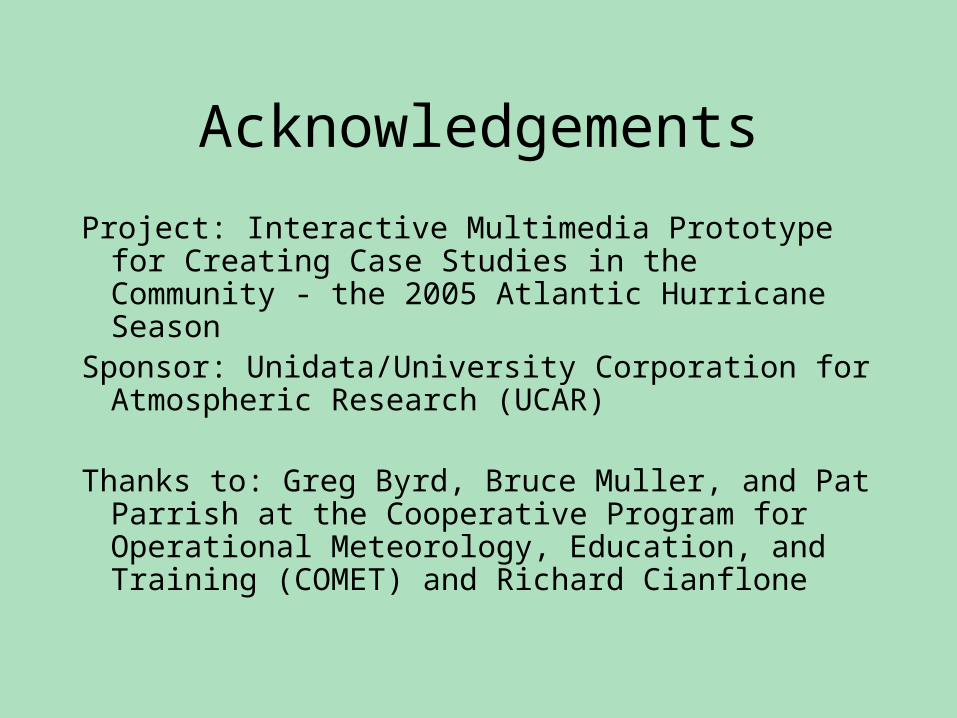
• Integrated Data Viewer (IDV)– Interactive framework to visualize/analyze
Earth Science data
• Distinctive because…– 3-dimensional renderings– Supports more data formats than other
data visualization programs– Platform independent (Java-based)
IDV Example

IDV Example

IDV Example

IDV Example

IDV Example

IDV Example

IDV Example

IDV Example

IDV Example

IDV System Requirements
• Supported Operating Systems– Windows– Linux– MacOS-X– Solaris
• RAM (Random Access Memory) requirements– 512MB minimum

• Supported Formats:– netCDF– GRIB– ADDE– Vis5D
• Access Methods:– Local files– HTTP– ADDE and TDS
servers
Supported Data Sources• Data Types:
– Gridded data– Satellite imagery– Radar data– Point observations– Balloon soundings– NOAA Profiler
Network winds– GIS data – Quicktime movies
ADDE = Abstract Data Distribution EnvironmentTDS (THREDDS) = Thematic Realtime Environmental Distributed Data Services
Unidata Program Center, IDV Users Guide, Version 2.0, July 7, 2006.
The Module
• Purpose of “2005 Atlantic Tropical Cyclone Season” module (hereafter 2005 module)– Educational module to showcase the
climatological factors present in 2005 to force the most active season on record

Methods: 2005 module sources
• National Center for Environmental Prediction (NCEP) Nomad3 Reanalyses– On-line GrADS-DODS Server 1.2.9– Resolution: 2.5o x 2.5o
• National Climate Data Center (NCDC) NOMADS reanalysis– On-line GrADS Server 1.3– Resolution: 2.0o x 2.0o
NOMADS = NOAA Operational Model Archive and Distribution System

Methods: Making the 2005 module
• Formatting based on “ingredients” favorable for Tropical Cyclone formation– Pre-existing disturbances– 26oC sea surface temperatures at least 50m deep– Low shear– Thermodynamic Instability– Moist mid-troposphere– Vorticity
• Use IDV to illustrate all are more favorable in 2005 than climate averages

2005 Module: Dashboard

2005 Module: Dashboard

2005 Module: Dashboard
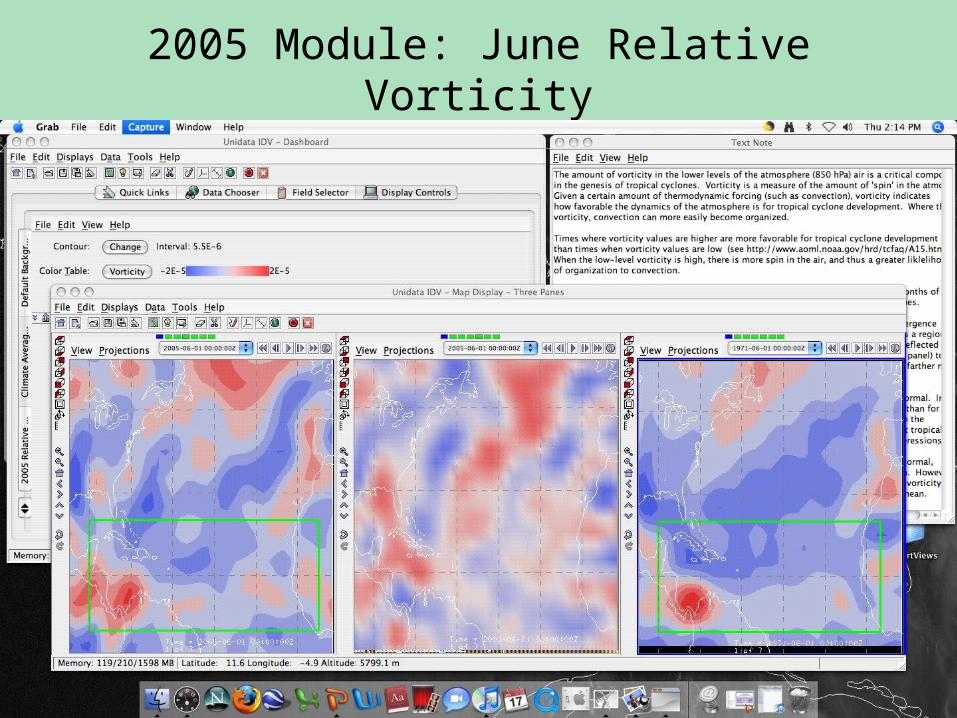
2005 Module: June Relative Vorticity
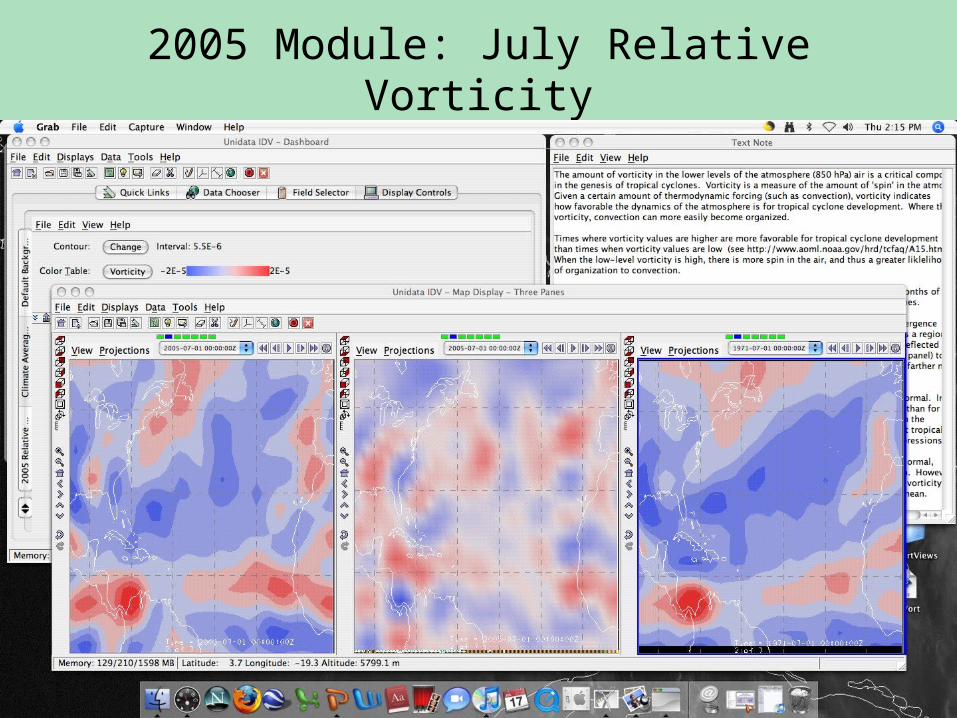
2005 Module: July Relative Vorticity

2005 Module: August Relative Vorticity

2005 Module: September Relative Vorticity

2005 Module: October Relative Vorticity

2005 Module: November Relative Vorticity

2005 Module: December Relative Vorticity

2005 Module: Text Notes
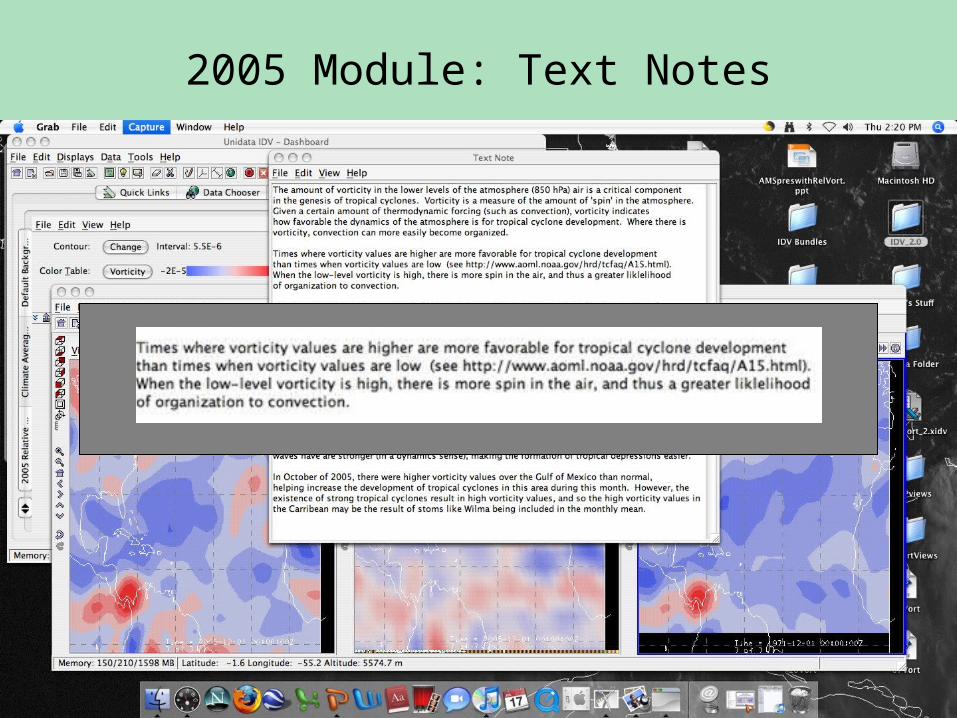
2005 Module: Text Notes

Future Modules
• Series of at least three educational modules– “2005 Atlantic Tropical Cyclone Season” module -
climatological focus– “Hurricane Katrina” module - societal impacts
focus– “Hurricane Wilma” module - meteorological
aspects focus
… to showcase broad spectrum of IDV capabilities

Classroom Applicability
• Target age group: upper-level undergraduates
• Encourages better understanding and recognition of atmospheric processes
• Use of real data beneficial: – more sophisticated presentation of concepts – better prepares students entering the
atmospheric science career field