Embed Size (px)
Citation preview
Idle Chatter or Learning? Evidence from Rural Tanzania of Social Learning
About Clinicians and the Health System
by
Sarah Adelman, Timothy Essam, and Kenneth L. Leonard
WP 08-11
Department of Agricultural and Resource Economics
The University of Maryland, College Park
Copyright © 2008 by Sarah Adelman, Timothy Essam, and Kenneth L. Leonard. All rights reserved. Readers may make verbatim copies of this document for non-commercial purposes by any means, provided that this copyright notice appears on all such copies.
Idle Chatter or Learning? Evidence from Rural
Tanzania of Social Learning about Clinicians and the
Health System∗
Sarah Adelman†, Timothy Essam‡, Kenneth L. Leonard§
September 1, 2008
Abstract
We examine data from rural Arusha region in Tanzania in which households areasked to recall the illness episodes of randomly chosen other households in their village.We analyze the probability that a household would be able to recall another illnessepisode as a function of the characteristics of the illness, the location and type of healthcare chosen and the outcome experienced. Households are more likely to recall severeillnesses and illnesses for which good quality care is important, illnesses that resultedin visits to hospitals or when the patient was not cured. In addition, households aremore likely to recall illnesses that resulted in a visit to a facility where the averagetenure of clinicians is less than two years old. The results are consistent with a modelin which households deliberately collect information in order to learn about cliniciansand facilities in their local area.
JEL Classification: I1, O1, O2Keywords: learning, health care, trust, social networks
∗This work was funded by NSF grant 00-95235. I am grateful for the assistance of David Bedoll. Thedata analyzed in this paper was collected by Nelson John, Olais Loi, Peter Martin, Narivi Mkawei, SionMengori, and Grace Zebedayo with assistance of Robert Saidi.
†Department of Agricultural and Resource Economics, University of Maryland, College Park‡Department of Agricultural and Resource Economics, University of Maryland, College Park§Corresponding Author: 2200 Symons Hall, University of Maryland College Park, MD 20742,
1 Introduction
Learning and technology adoption have been central issues in development economics for
many decades (see Feder et al., 1985, for a review). Research in this area has focused
on learning as a process of experimentation, observation and adaptation by individuals or
households. Recent research suggests specifically that in developing countries, observation
of the activities, choices and experiences of neighbors or members of a social network is
a significant source of knowledge about new technologies and their use (Conley and Udry,
2001, 2005; Fafchamps and Minten, 1999; Fafchamps, 2000, 2005; Foster and Rosenzweig,
1995). For the typical household in a developing country, learning about the clinicians and
facilities that provide health care in the area is also likely to benefit from social learning.
Whether households are concerned with broader characteristics such as trustworthiness or
with narrower features such as technical quality, households improve their understanding of
their options and therefore make better choices when they have more information. Given the
value of information and their proximity to families facing similar decisions, learning should
be a social, not an individual experience.
We examine evidence from rural northern Tanzania on the knowledge that households
have about the health histories of their neighbors. We collected data from households about
their own health histories, and asked them to recall the health histories of randomly selected
neighbors in their villages. We match the recalled illnesses to the actual illnesses described
by households and examine the characteristics of these recalled illnesses. In particular, are
households more likely to gather information that is useful for learning about clinicians and
facilities? Are they more likely to recall illnesses for which outcomes are responsive to quality,
where the difference between a good and bad clinician is clearer? Are they more likely to
recall illnesses when the patient visited a new clinician, when information is more likely to
be useful? Are they more likely to recall illnesses when the outcome is surprising?
At least four features of health care demand in developing countries suggest the potential
for learning from the experiences of others. First, patients rarely have access to formal
2
sources of information about the facilities they could visit. Second, the variation in important
characteristics of the clinician, such as quality or trustworthiness, is significant, and not fully
explained by the facility in which the clinician practices.1 Thus, if one clinician replaces
another, quality could change significantly. Third, because health care outcomes are not
perfectly determined by the quality of care received (i.e. some sick patients are not helped
by good clinicians and some are helped by bad clinicians), patients cannot assess quality
or trustworthiness from a single visit. Fourth, despite stochastic outcomes, it is better
to visit a good clinician than a bad clinician; the probability of a cure is higher at the
better clinician. Therefore, information on multiple outcomes of visits to a provider can
help individual households assess quality and therefore households should share information
about their experiences to learn from collective information.
In addition, there is evidence that households do learn about the quality of care available
at multiple facilities. Leonard et al. (2002) show that households in rural Tanzania are willing
to pay significant additional costs to visit providers with above average quality of care, where
quality is judged by medical teams visiting the facilities. This suggests that patients know
something about the quality of care available at these facilities. Leonard (2007) examines
the temporal and spatial variation in the willingness to pay and shows that households act
as if they are slowly adapting their beliefs about quality based on local information and
experiences. The greatest changes in willingness to pay to visit a given provider occur
when that provider has between 1 and 3 years of tenure at the local facility. This data is
consistent with households that accumulate information on their neighbors’ experiences with
health care and use this highly stochastic series of outcomes and experiences to adapt their
beliefs on quality.
1For a cross country comparison of variation in clinician quality, including Tanzania, see Das and Hammer(2007a); Das and Sohnesen (2007); Leonard and Masatu (2007) as well as Das and Hammer (2005, 2007b);Leonard et al. (2007).
3
2 Data and Methods
2.1 Data
The research team interviewed 502 randomly selected households from 22 villages in 20
wards of Arusha region of northern Tanzania. Each household was interviewed twice over
the period 2002 to 2003. Households were chosen by a stratified random procedure: one
village was selected in each ward in the research area.2 Each village is comprised of 1 to 5
subvillages and each subvillage contains 2 to 5 cells. Cells are groupings of approximately 20
households. We randomly chose two subvillages in each village, two cells from one subvillage
and one cell from the other subvillage.3 We interviewed eight households in each cell.4 This
process insures a sample of households that are geographically dispersed within each village.
In addition to socio-demographic characteristics of all members of each household, the
survey team collected information on the health history of the household over the past
year. We collected information on the symptoms and self-declared severity of the illness, the
patient’s ability to perform a series of activities of daily living (ADLs) before and after the
onset of the illness, the number of days sick and number of days bedridden before seeking
care, the first provider visited (if any), the diagnosis, and the outcome. With two rounds of
data collection almost exactly a year apart, the survey has data on many if not most of the
health episodes suffered by a household over a two-year period.
All of the information about health episodes except the provider chosen, diagnosis and
outcome was transcribed onto cards and copies of these cards were given to clinicians who
practice medicine in this region. These clinicians graded each illness by the following criteria
(on a scale of 1 to 10):
• responsiveness to effort (the degree to which more effort in examination improves the
2We over-sampled villages in two wards that experienced a change in their local health facility during thefirst round of data collection.
3For villages with only one subvillage, all cells were drawn from the same subvillage.4The response rate was therefore 502/528 or 95%. Twenty-four of these missing households had no adults
present on the day of the survey or the make-up day. Two households refused consent.
4

chances of a successful outcome);
• responsiveness to skill available at an untrained provider (the degree to which untrained
providers with experience can properly diagnose and treat the illness);
• responsiveness to skill available at a dispensary (the degree to which low levels of
training and equipment are adequate to properly diagnose and treat the illness);
• responsiveness to skill available at a hospital (the degree to which training and better
laboratories or other equipment improve the chances of a successful outcome);
• chance of a successful outcome with the best possible care (the chance of recovery if a
clinician provides all necessary effort and has all necessary skill);
• chance of a successful outcome with poor quality care (the chance of recovery if a
clinician provides no effort or has no skill);
• severity (the degree to which a severe outcome is possible);
• urgency (the degree to which the patient requires immediate medical attention).
Thirty-seven clinicians examined the full set of illnesses, and at least three different
clinicians coded each illness. We examine seven scores derived from the scores above: (1)
the responsiveness to effort, (2) severity, (3) urgency, (4) chance of recovery with the best
possible care, (5) the net value of skill at a hospital (the net gain from skill available at a
hospital over skill available at an untrained provider), (6) the net value of skill at a clinic
(the net gain from skill available at a hospital over skill available at an untrained provider),
(7) the ratio of the chance of recovery with the best possible care to the chance of recovery
with poor care.
Since the illnesses were randomly assigned to clinicians for coding, we create scores for
each illness by standardizing these seven scores for each coder and then averaging for each
illness episode over all clinician coders.
5
As part of the household survey, we also asked each household whether they knew any
members of eight randomly selected households from their village drawn from our village
sample. We selected three random households from the same cell, three from the same
subvillage but different cell and two from the same village but different subvillage. Thus,
every household in the survey knew at least one of the given households, and almost no
households knew all of the households. If they said they knew any members of the other
household, they were asked if they could recall any health events from that household. If they
could recall any health events, they were asked the name of the patient (or the relationship to
someone they could name), the symptoms and the location visited. We refer to the household
reporting information about their neighbors as the respondent household and the household
about which information is reported as the subject household. Each individual household,
however, is both a respondent and a subject household. The set of subject households was
randomly assigned to respondent households in each of the two rounds of data collection
separately and was not designed to be reciprocal.
For privacy reasons, the enumerator asking questions of the respondent household only
knew the names of the adults in the subject household, and therefore could not clarify any
of the information provided during the interview. After the interview, however, we could
examine information on health episodes from both the subject and respondent. Taking the
subject reports as correct, we tried to match all illness episodes reported by the respondent
to a subject report. In other words, given that household A recalled that household B had
suffered from a particular illness, we looked for evidence of that particular illness in our
data from household B. The data was matched when the name (or relationship) and the
symptoms or location matched a unique illness among the subject reports.
In many cases, we have a report from the respondent that we could not conclusively
match to a report from the subject. Frequently, the lack of correspondence is clearly due
to differing definitions of the household. For example, many respondents reported an illness
that was suffered by relatives of their neighbors, but these relatives are not listed in the
6
subject household roster because they do not normally reside in that household. In other
cases, respondents are confused about recall periods. For example, in one case three different
respondents reported the life-threatening injuries suffered by the head of one subject house-
hold in an automobile accident. However, in our interview with this same woman, she never
mentioned the accident. The most likely explanation is that the accident occurred before the
one-year recall period and that the woman who suffered the accident had a superior recollec-
tion of the timing. In others cases we cannot conclusively isolate which of multiple episodes
recalled by the subject should be matched to the episode reported by the respondent. For
example, the respondent says that a young child suffered from an episode of pneumonia, but
we find that the subject household recalled multiple episodes with such characteristics.
At the same time as the household survey, every modern medical facility in the research
area—including those in nearby urban areas—was visited by a medical team at least twice
over the course of the data collection period. Therefore, the type of facility (clinic, health
center or hospital), number of medical personnel on duty and the tenure of all personnel
can be assigned to every health episode that led to a visit to a modern provider. Using
information on the dates that clinicians began and ended their assignments at particular
posts we know which clinicians were present on the date that someone visited a facility and
their tenure at the facility on that date.
2.2 Methodology
In this section, we provide a simple theoretical motivation for the empirical analysis of
the data described above based in on the analysis of Bayesian learning in Chamley (2004).
Households seek to learn the characteristics of the clinicians in their area. Some characteris-
tics of health facilities are easy for the households to discern. The location of a facility, the
gender of the clinician, the average fees, the types of medicines available, etc, are all things
that a household could learn from one visit to a facility. Other characteristics, however,
are more difficult to observe and infer. The quality of care provided by a clinician and the
7
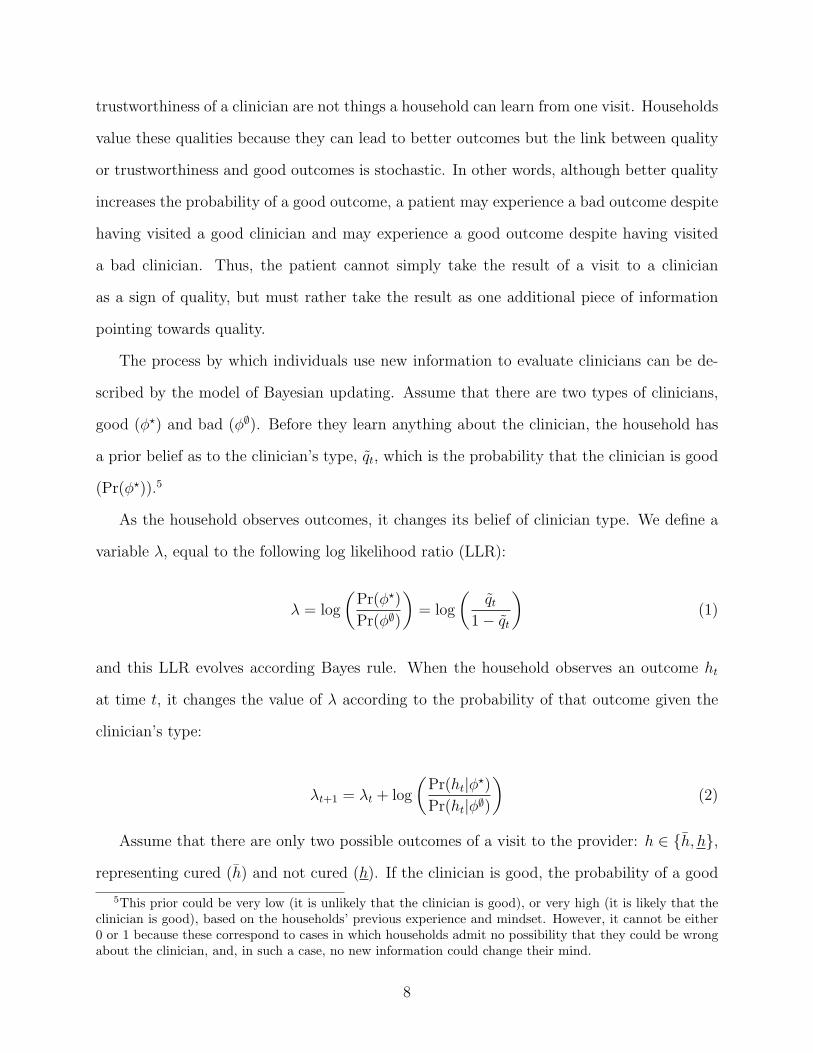
trustworthiness of a clinician are not things a household can learn from one visit. Households
value these qualities because they can lead to better outcomes but the link between quality
or trustworthiness and good outcomes is stochastic. In other words, although better quality
increases the probability of a good outcome, a patient may experience a bad outcome despite
having visited a good clinician and may experience a good outcome despite having visited
a bad clinician. Thus, the patient cannot simply take the result of a visit to a clinician
as a sign of quality, but must rather take the result as one additional piece of information
pointing towards quality.
The process by which individuals use new information to evaluate clinicians can be de-
scribed by the model of Bayesian updating. Assume that there are two types of clinicians,
good (φ?) and bad (φ∅). Before they learn anything about the clinician, the household has
a prior belief as to the clinician’s type, q̃t, which is the probability that the clinician is good
(Pr(φ?)).5
As the household observes outcomes, it changes its belief of clinician type. We define a
variable λ, equal to the following log likelihood ratio (LLR):
λ = log
(Pr(φ?)
Pr(φ∅)
)= log
(q̃t
1 − q̃t
)(1)
and this LLR evolves according Bayes rule. When the household observes an outcome ht
at time t, it changes the value of λ according to the probability of that outcome given the
clinician’s type:
λt+1 = λt + log
(Pr(ht|φ?)
Pr(ht|φ∅)
)(2)
Assume that there are only two possible outcomes of a visit to the provider: h ∈ {h̄, h},
representing cured (h̄) and not cured (h). If the clinician is good, the probability of a good
5This prior could be very low (it is unlikely that the clinician is good), or very high (it is likely that theclinician is good), based on the households’ previous experience and mindset. However, it cannot be either0 or 1 because these correspond to cases in which households admit no possibility that they could be wrongabout the clinician, and, in such a case, no new information could change their mind.
8
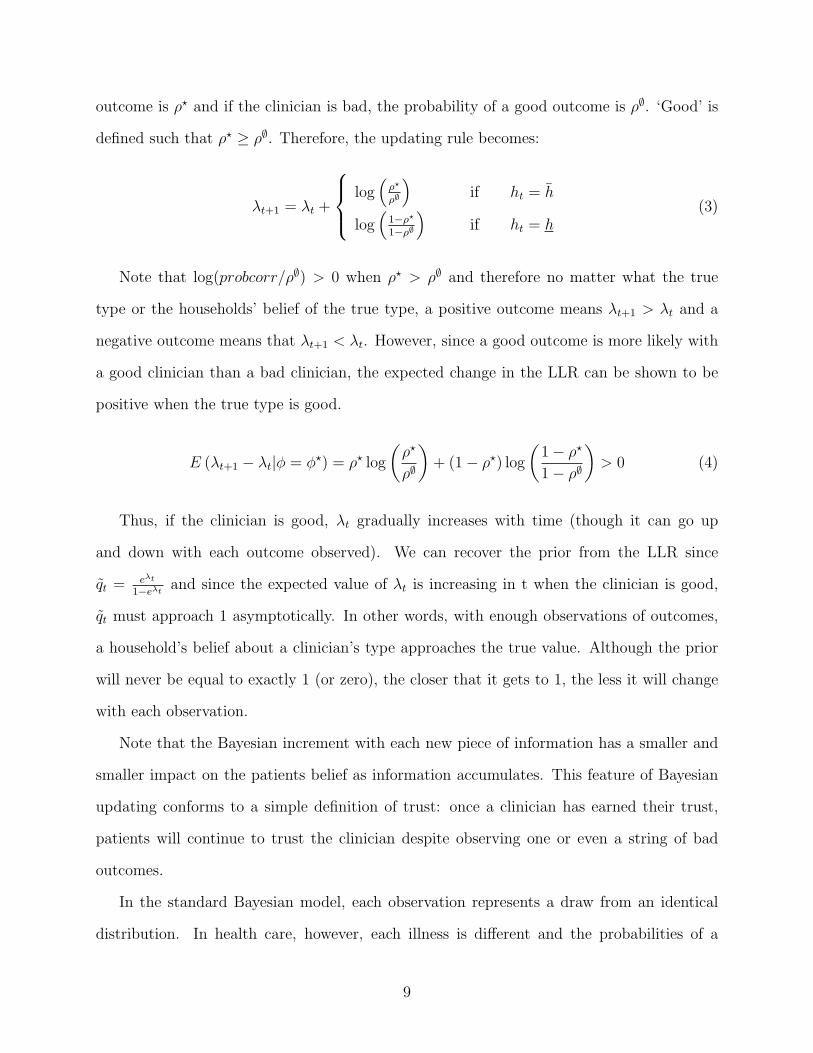
outcome is ρ? and if the clinician is bad, the probability of a good outcome is ρ∅. ‘Good’ is
defined such that ρ? ≥ ρ∅. Therefore, the updating rule becomes:
λt+1 = λt +
log(
ρ?
ρ∅
)if ht = h̄
log(
1−ρ?
1−ρ∅
)if ht = h
(3)
Note that log(probcorr/ρ∅) > 0 when ρ? > ρ∅ and therefore no matter what the true
type or the households’ belief of the true type, a positive outcome means λt+1 > λt and a
negative outcome means that λt+1 < λt. However, since a good outcome is more likely with
a good clinician than a bad clinician, the expected change in the LLR can be shown to be
positive when the true type is good.
E (λt+1 − λt|φ = φ?) = ρ? log
(ρ?
ρ∅
)+ (1 − ρ?) log
(1 − ρ?
1 − ρ∅
)> 0 (4)
Thus, if the clinician is good, λt gradually increases with time (though it can go up
and down with each outcome observed). We can recover the prior from the LLR since
q̃t = eλt
1−eλtand since the expected value of λt is increasing in t when the clinician is good,
q̃t must approach 1 asymptotically. In other words, with enough observations of outcomes,
a household’s belief about a clinician’s type approaches the true value. Although the prior
will never be equal to exactly 1 (or zero), the closer that it gets to 1, the less it will change
with each observation.
Note that the Bayesian increment with each new piece of information has a smaller and
smaller impact on the patients belief as information accumulates. This feature of Bayesian
updating conforms to a simple definition of trust: once a clinician has earned their trust,
patients will continue to trust the clinician despite observing one or even a string of bad
outcomes.
In the standard Bayesian model, each observation represents a draw from an identical
distribution. In health care, however, each illness is different and the probabilities of a
9
good and bad outcome are different for each illness. Thus, ρ? and ρ∅ are not constant
for each observed outcome. However, as long as ρ? ≥ ρ∅ for all illnesses (good clinicians
are better than bad clinicians for all illnesses) and patients know the values of ρ?j and ρ∅j
for each illness j, observation of sufficient outcomes will lead the prior to approach the
true value asymptotically. Thus, for every illness where ρ?j > ρ∅j , the household can learn
something from either good or bad outcomes. However, some illnesses are more informative
than others. In particular, the expected value of the updating increment (E (λt+1 − λt)) is
increasing in both ρ?j and ρ?
j/ρ∅j . If there is no cost to gathering information, households will
update their prior for every possible visit, but if there is some cost to gathering information,
the household will prefer to gather information about illnesses for which the value of the
additional information is large. Thus, households should be more likely to recall illnesses
when ρ?j and ρ?
j/ρ∅j are large. In addition, the expected value of additional information is
much larger when t is small. In other words, when there is little information about a provider,
additional information is particularly valuable.
Therefore, we predict that households will be more likely to recall information about
illnesses that are differentially responsive to quality and that resulted in visits to providers
about whom comparatively less is already known—new providers. In addition, households
may choose to learn about health episodes that have unexpected outcomes or they may
choose to learn, not from the illnesses or outcomes, but from the choices of their neighbors.
Thus we examine the characteristics of the illnesses that are likely to be recalled, looking at
the illness itself, the choices households make and the results of their choices.
To test these hypotheses we examine a model of the variable indicating whether a re-
spondent household knew about a subject household illness. In the results below, we use the
set of all possible illnesses that a respondent household could mention, even if they do not
know anyone in that household. We choose this specification because it is possible that one
way that households get to know each other is through sharing information about health
episodes. Thus, if the respondent household does not know anyone in the subject household,
10
this may mean that there was no illness worth knowing about. In addition, in those cases
where the respondent household recalled an illness that we could not match to the subject
household’s list of health episodes, we count this as if they did not know anything about the
subject household.6
We use a random effects probit model (also known as variance components or error com-
ponents model) with random effects for every respondent household, to control for features
of the household that would make them more or less likely to know about any illnesses.
We control for the distance between households by including a variable indicating whether
households are in the same cell, and a variable indicating whether they are in the same
subvillage, but not the same cell. We control for the severity of the illness, as described by
the subject household, and for the seven characteristics of the illness indicated by clinician
coding, in particular the chance or recovery with good care (ρ?) and the ratio of the chance
of recovery with good care to the chance of recovery with bad care (ρ?/ρ∅). In addition, we
examine the choice made by the household and the outcome experienced. One of the key
choices we examine is the choice to visit a new provider. To model this, we use a dummy
variable indicating whether the average tenure of clinicians at a facility is less than two years
at the date of the visit. All facilities with more than two clinicians have average tenure
greater than two years, so this discrete variable only applies to smaller facilities.
Households were asked to indicate the severity of the illness from a list of five possible
severities; “it was nothing”, “it was a mild illness”, “it was an average illness”, “the patient
was very sick” and “the patient could have died.” In addition, households described the
location chosen including no care, folk remedy, traditional healer, pharmacy, a health facility
and a hospital. Possible immediate outcomes included: cured; not cured and not seeking
6To check for the robustness of these assumptions, we explore alternative definitions of the set of pos-sible illnesses in Table 3. Table 3 compares four alternative specifications: (1) all possible illnesses in allhouseholds that a respondent household was asked about, our default specification, (2) all possible illnessesin households that are known to the respondent household, (3) all possible illnesses in subject householdswhen the respondent says they know something about the health history of the subject household, and (4)the set of all illnesses in the subject household when the respondent household correctly recalls at least oneepisode in the subject household. The magnitude and significance of the coefficients does not vary with theset of possible illnesses.
11
follow up care; not cured but seeking care elsewhere; and referred to another location. In
addition, we asked patients if they would return to the facility if they suffered from a similar
illness, an indicator of a favorable experience.
Overall there are 502 respondent households, of which 495 also appear as subject house-
holds, leading to 5,784 household pairs. Each household suffered 4.6 illnesses on average, and
therefore there are 25,992 possible illness matches. Some of these illnesses were not properly
coded by clinicians due to missing information. Therefore we have complete information for
25,186 possible illnesses. 40% of all illnesses recalled were successfully matched. Table 1
shows the sample averages variable names and descriptions for the variables used in the
analysis.
3 Findings
The data show that the average household knows 21 out of 22 households in their cell, 17
out of 29 households in their subvillage (but not in their cell) and 41 out of 136 households
in their village (but not in their subvillage). Thus, the average household knows 80 out of
187 households in their village by name.
The average household can recall details of 5% of the illnesses suffered by families in the
same cell, 1% of the illnesses suffered by families in the same subvillage and 0.7% of the
illnesses suffered by families in the same village.
The average household experiences 4.6 illnesses per year, and therefore, we estimate that
they can recall the details of 5.1 illnesses experienced by families in the same cell over the
past year, 1.3 illnesses experienced by families in the same subvillage over the past year
and 4.4 illnesses experienced by families in the same village. This represents a total of 11
illnesses, compared to the 4.6 suffered by the family itself. These numbers represent only
those illnesses that were matched by the research team to actual illnesses. Since many of the
failures to match illnesses were due to data problems, not necessarily to faulty recall, these
12
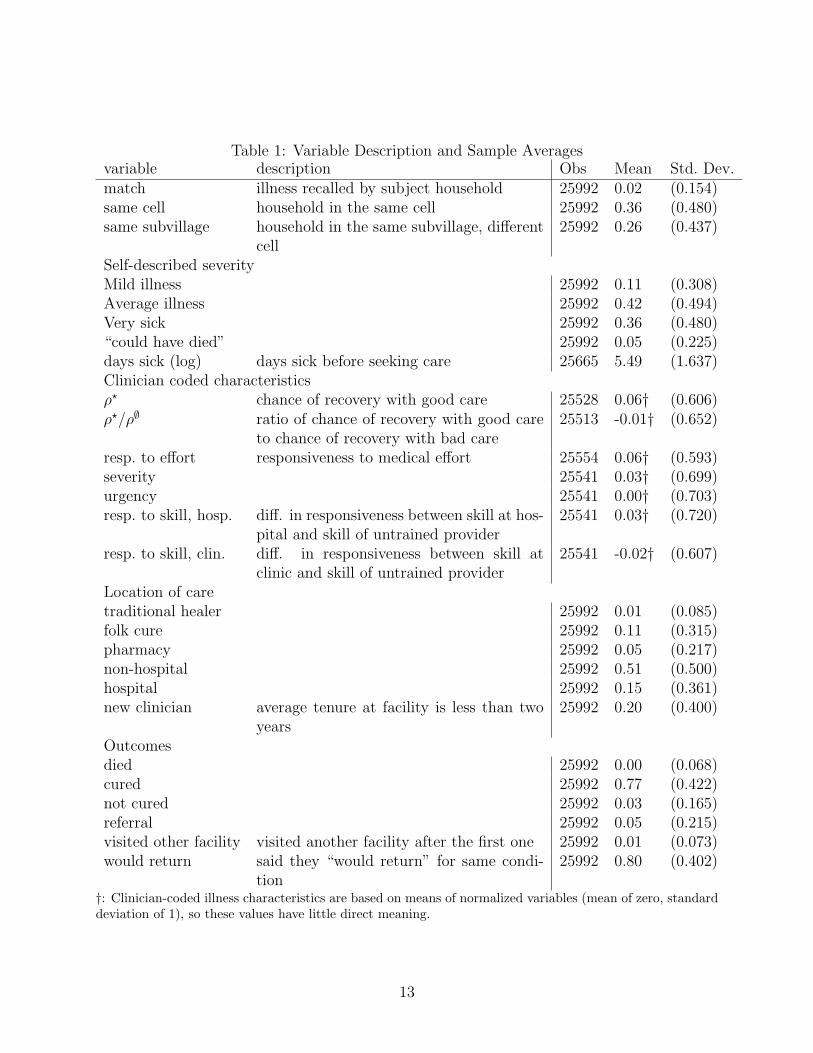
Table 1: Variable Description and Sample Averagesvariable description Obs Mean Std. Dev.match illness recalled by subject household 25992 0.02 (0.154)same cell household in the same cell 25992 0.36 (0.480)same subvillage household in the same subvillage, different
cell25992 0.26 (0.437)
Self-described severityMild illness 25992 0.11 (0.308)Average illness 25992 0.42 (0.494)Very sick 25992 0.36 (0.480)“could have died” 25992 0.05 (0.225)days sick (log) days sick before seeking care 25665 5.49 (1.637)Clinician coded characteristicsρ? chance of recovery with good care 25528 0.06† (0.606)ρ?/ρ∅ ratio of chance of recovery with good care
to chance of recovery with bad care25513 -0.01† (0.652)
resp. to effort responsiveness to medical effort 25554 0.06† (0.593)severity 25541 0.03† (0.699)urgency 25541 0.00† (0.703)resp. to skill, hosp. diff. in responsiveness between skill at hos-
pital and skill of untrained provider25541 0.03† (0.720)
resp. to skill, clin. diff. in responsiveness between skill atclinic and skill of untrained provider
25541 -0.02† (0.607)
Location of caretraditional healer 25992 0.01 (0.085)folk cure 25992 0.11 (0.315)pharmacy 25992 0.05 (0.217)non-hospital 25992 0.51 (0.500)hospital 25992 0.15 (0.361)new clinician average tenure at facility is less than two
years25992 0.20 (0.400)
Outcomesdied 25992 0.00 (0.068)cured 25992 0.77 (0.422)not cured 25992 0.03 (0.165)referral 25992 0.05 (0.215)visited other facility visited another facility after the first one 25992 0.01 (0.073)would return said they “would return” for same condi-
tion25992 0.80 (0.402)
†: Clinician-coded illness characteristics are based on means of normalized variables (mean of zero, standarddeviation of 1), so these values have little direct meaning.
13
numbers are a lower limit.
In addition, the types of illnesses that households are likely to recall have particular
characteristics, as shown by our analysis of the probability of a match. Table 2 reports
the results of four random effects conditional probit regressions on the probability that
a respondent household would recall a particular illness of a subject household. All four
columns include the two variables describing the distance between households. The first three
columns look at the characteristics of the illness both as described by the household and as
coded by clinicians. The first column examines only the self-described characteristics of the
illness, the second includes both self-described and clinician-coded characteristics, and the
third includes only the clinician-coded characteristics. The fourth column includes all illness
characteristics, variables describing the location chosen and variables describing the outcome
of treatment. We include four specifications to check for correlation between self-reported
and clinician-coded illness characteristics and the correlation between illness severity and
the location or outcome. The significance of the coefficients across the specifications shows
the importance of self-reported and clinician-coded severity even after taking into account
the choices and outcomes.
Clearly, the distance between households is important to whether they recall an illness. In
addition, the more severe the illness, the more likely is the household to recall it. The length
of time that a person was sick before seeking care is negatively related to the probability that
the illness would be recalled. Including the clinician-coded illness characteristics reduces
the size of the coefficients for self-described illness characteristics, but not their relative
magnitude. Respondent households remain more likely to report patients who are very sick,
or illnesses where the subject household thought the patient might die. Except for the
coefficient on severity, the coefficients for clinician-coded characteristics change little from
column 2 to 3. Patients are more likely to recall illnesses that clinicians see as having a
high chance of recovery at a good clinician (ρ?) and which are responsive to the effort at a
hospital. Patients are less likely to recall illnesses in which the ratio of the change of recovery
14
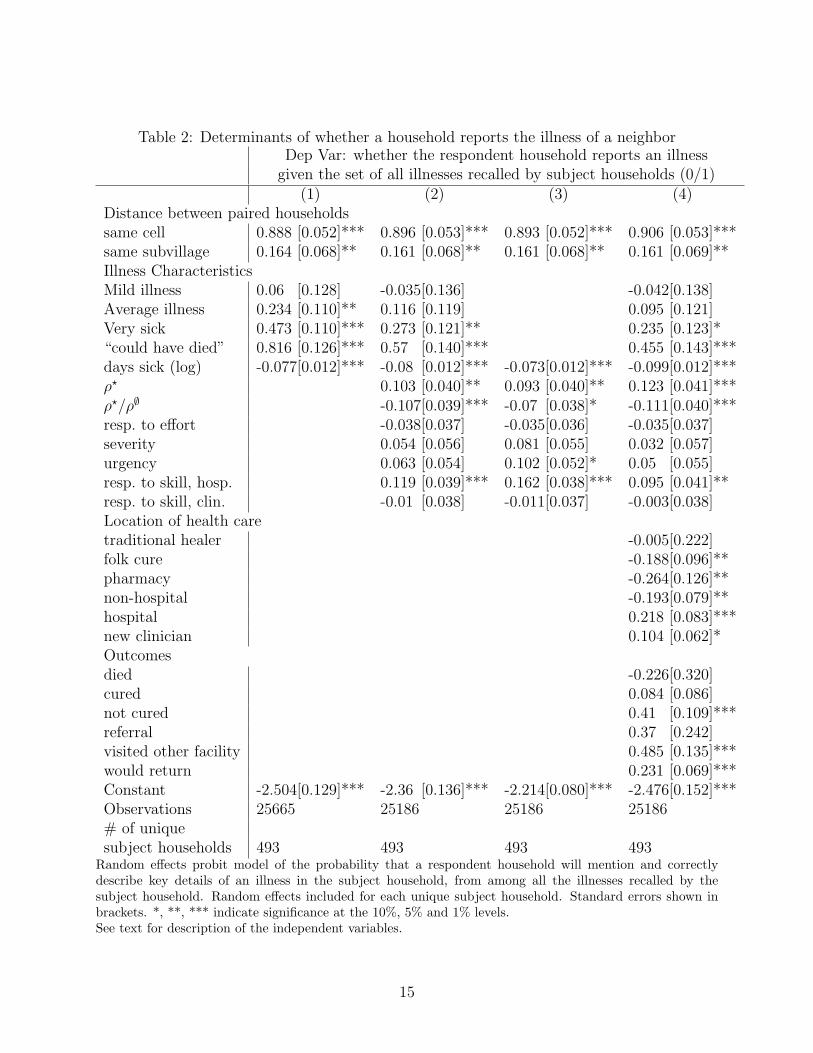
Table 2: Determinants of whether a household reports the illness of a neighborDep Var: whether the respondent household reports an illness
given the set of all illnesses recalled by subject households (0/1)(1) (2) (3) (4)
Distance between paired householdssame cell 0.888 [0.052]*** 0.896 [0.053]*** 0.893 [0.052]*** 0.906 [0.053]***same subvillage 0.164 [0.068]** 0.161 [0.068]** 0.161 [0.068]** 0.161 [0.069]**Illness CharacteristicsMild illness 0.06 [0.128] -0.035[0.136] -0.042[0.138]Average illness 0.234 [0.110]** 0.116 [0.119] 0.095 [0.121]Very sick 0.473 [0.110]*** 0.273 [0.121]** 0.235 [0.123]*“could have died” 0.816 [0.126]*** 0.57 [0.140]*** 0.455 [0.143]***days sick (log) -0.077[0.012]*** -0.08 [0.012]*** -0.073[0.012]*** -0.099[0.012]***ρ? 0.103 [0.040]** 0.093 [0.040]** 0.123 [0.041]***ρ?/ρ∅ -0.107[0.039]*** -0.07 [0.038]* -0.111[0.040]***resp. to effort -0.038[0.037] -0.035[0.036] -0.035[0.037]severity 0.054 [0.056] 0.081 [0.055] 0.032 [0.057]urgency 0.063 [0.054] 0.102 [0.052]* 0.05 [0.055]resp. to skill, hosp. 0.119 [0.039]*** 0.162 [0.038]*** 0.095 [0.041]**resp. to skill, clin. -0.01 [0.038] -0.011[0.037] -0.003[0.038]Location of health caretraditional healer -0.005[0.222]folk cure -0.188[0.096]**pharmacy -0.264[0.126]**non-hospital -0.193[0.079]**hospital 0.218 [0.083]***new clinician 0.104 [0.062]*Outcomesdied -0.226[0.320]cured 0.084 [0.086]not cured 0.41 [0.109]***referral 0.37 [0.242]visited other facility 0.485 [0.135]***would return 0.231 [0.069]***Constant -2.504[0.129]*** -2.36 [0.136]*** -2.214[0.080]*** -2.476[0.152]***Observations 25665 25186 25186 25186# of uniquesubject households 493 493 493 493
Random effects probit model of the probability that a respondent household will mention and correctlydescribe key details of an illness in the subject household, from among all the illnesses recalled by thesubject household. Random effects included for each unique subject household. Standard errors shown inbrackets. *, **, *** indicate significance at the 10%, 5% and 1% levels.See text for description of the independent variables.
15
at a good clinician to the chance of recovery at a bad clinician is high.
Household are less likely to recall illnesses that were treated by folk medicine or that
result in a visit to traditional healers, pharmacies or non-hospital facilities. They are more
likely to recall an illness that results in a visit to a hospital (even after controlling for illness
characteristics). They are more likely to recall an illness if it resulted in a visit to a facility
where the average tenure is less than two years.
Surprisingly, households are not more or less likely to recall illnesses that result in death
or a cure. They are more likely to recall illnesses if the patient is not cured, or if the patient
chooses to visit another facility. They are more likely to recall episodes when the household
says they would return if they had a similar illness.
4 Discussion and Conclusion
The average household experiences 4.6 illness episodes a year, and can recall the details of
at least 11 other illnesses experienced by their neighbors. Because we were able to match
only 40% of all the illnesses recalled, it is possible that households recall up to twice as
many illnesses. Thus, by talking with neighbors and friends, the average household at least
doubles the number of illness episodes from which it can learn about medical care in its area.
However, these households more than double the available information because, whereas their
own illnesses are average, the recalled illnesses not average or random. Households recall
illnesses that are particularly useful for assessing the quality of care provided by clinicians
in their area. Households are more likely to know about severe illnesses, illnesses that are
responsive to high quality care, illnesses that result in visits to hospitals or to facilities with
new clinicians, illnesses where the subject is satisfied enough that they would return.
Although these findings are supported by the model of deliberate learning outlined above,
they are also supported by a model of gossip: households enjoy talking about new, interesting
and different things. It is not necessarily the case that households deliberately collect useful
16
information, but it is the case that, when they are trying to assess health care in their area,
they have access to salient information from at least twice as many additional health episodes
as they experience on their own. The fact that households are more likely to know about
illnesses that result in visit to new providers points to the potential role of this information
in learning.
The possibility that households can learn about the quality of care provided by facili-
ties in their region has important implications for discussions of asymmetric information as
well as trust. Trust is often evoked as an institution that partially resolves the economic
problems of asymmetric information and imperfect agency (Bloom et al., 2008; Gilson, 2003,
2005). As households learn about the characteristics of the facilities in their area, they will
seek and trust better providers, improving the health care they receive through choice and
trustLeonard (2007). Some authors explicitly consider trust to be the product of individ-
uals’ experiences with the health system including, but not limited to, their experience of
quality (Russell, 2005; Tibandebage and Mackintosh, 2005). Unlike other experiences with
the health system, the experience of quality and trustworthiness requires multiple interac-
tions before the household can develop a reasonable picture of what to expect. Tibandebage
and Mackintosh (2005, pp. 1397) suggest that “Each transaction is thus understood, not as
a one-off market event, but rather as shaped by information, expectations, levels of trust,
norms of behaviour and incentives, all of which evolve over time through market and other
social interaction.” This paper suggests that trust can also be shaped by the interaction
of market and social forces: using social networks to accumulate and transmit information
gathered in market interactions.
Olsen and Norheim (forthcoming) suggest that trust is more likely to be developed when
patients interact with the health care system for curative or hospital-based care than when
patients interact with the health system for preventive care. In other words, the interactions
in which trustworthy clinicians are most likely to be recognized are those for which outcomes
are also most likely to vary. This concept is formalized in our analysis of learning. Although
17
we only analyze curative care, we find that households are more likely to collect information
about facilities and clinicians when illnesses are severe, when quality has an important role
or when patients visit hospitals. Although we do not observe the creation of trust, the
information that would allow for the creation of trust is clearly biased towards important
curative events.
18
References
Bloom, Gerald, Hilary Standing, and Robert Lloyd, “Markets, information asymme-try and health care: Towards new social contracts,” Social Science and Medicine, 2008,66 (10), 2076–2087.
Chamley, Christophe P., Cambridge: Cambridge University Press, 2004.
Conley, Timothy G. and Christopher Udry, “Social Learning through Networks: TheAdoption of New Agricultural Technologies in Ghana,” American Journal of AgriculturalEconomics, 2001, 83 (3), 668–73.
and , “Learning about a new technology: Pineapple in Ghana,” Working Paper 817,Economic Growth Center, Yale 2005.
Das, Jishnu and Jeffrey Hammer, “Which Doctor?: Combining Vignettes and Item-Response to Measure Doctor Quality,” Journal of Development Economics, 2005, 78, 348–383.
and , “Location, location, location: Residence, Wealth and the Quality of MedicalCare in Delhi, India,” Health Affairs, 2007, 26 (3).
and , “Money for Nothing, The Dire Straits of Medical Practice in Delhi, India,”Journal of Development Economics, 2007, 83 (1), 1–36.
and Thomas Pave Sohnesen, “Variations In Doctor Effort: Evidence From Paraguay,”Health Affairs, 2007, 26 (3).
Fafchamps, M. and B. Minten, “Relationships and traders in Madagascar,” Journal ofDevelopment Studies, 1999, 35 (6), 1–35.
Fafchamps, Marcel, “Ethnicity and Credit in African manufacturing,” Journal of Devel-opment Economics, 2000, 61 (1), 205–35.
, Market Institutions in Sub–Saharan Africa: Theory and Evidence, Cambridge: MITpress, 2005.
Feder, G., R. Just, and D. Zilberman, “Adoption of Agricultural Innovations in Devel-oping Countries: A Survey,” Economic Development and Cultural Change, 1985, 33 (2),255–298.
Foster, A. and M. Rosenzweig, “Learning by doing and learning from others: Humancapital and technical change in agriculture,” Journal of Political Economy, 1995, 103 (6),1176–1209.
Gilson, Lucy, “Trust and the development of health care as a social institution,” SocialScience and Medicine, 2003, 56 (7), 1453–1468.
, “Editorial: building trust and value in health systems in low- and middle-income coun-tries,” Social Science and Medicine, 2005, 61 (7), 1381–1384.
Leonard, Kenneth L., “Learning in Health Care: Evidence of Learning about ClinicianQuality in Tanzania,” Economic Development and Cultural Change, 2007, 55 (3), 531–555.
and Melkiory C. Masatu, “Variation in the quality of care accessible to rural commu-nities in Tanzania,” Health Affairs, 2007, 26 (3), w380–w392.
19
, Gilbert Mliga, and Damen Haile Mariam, “Bypassing Health Facilities in Tanza-nia: Revealed Preferences for Observable and Unobservable Quality,” Journal of AfricanEconomies, 2002, 11 (4), 441–471.
, Melkiory C. Masatu, and Alex Vialou, “Getting Doctors to do their best: theroles of ability and motivation in health care,” Journal of Human Resources, 2007, 42 (3),682–700.
Olsen, Øystein Evjen and Ole Frithjof Norheim, “Restoring Trust: Rethinking FailedFrameworks for Improved Health Care Provision in Resource Poor Environments,” Lancet,forthcoming.
Russell, Steven, “Treatment-seeking behaviour in urban Sri Lanka: Trusting the state,trusting private providers,” Social Science and Medicine, 2005, 61 (7), 1396–1407.
Tibandebage, Paula and Maureen Mackintosh, “The market shaping of charges, trustand abuse: health care transactions in Tanzania,” Social Science and Medicine, 2005, 61(7), 1385–1395.
20
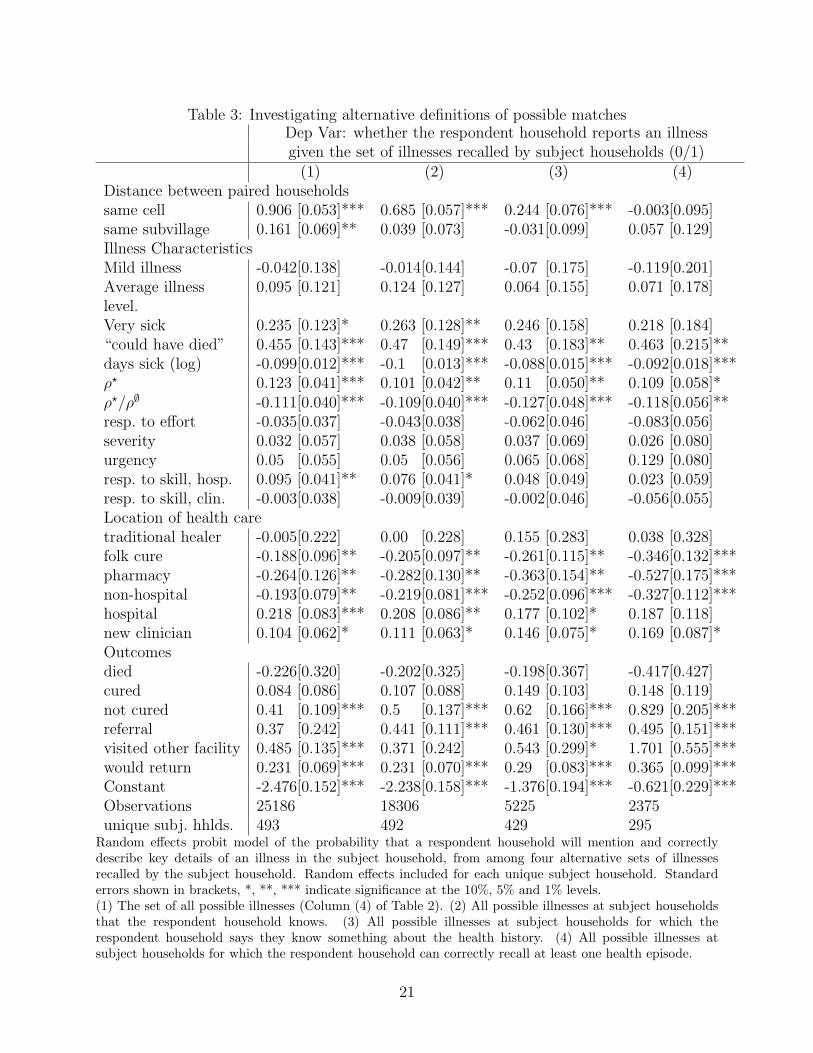
Table 3: Investigating alternative definitions of possible matchesDep Var: whether the respondent household reports an illnessgiven the set of illnesses recalled by subject households (0/1)
(1) (2) (3) (4)Distance between paired householdssame cell 0.906 [0.053]*** 0.685 [0.057]*** 0.244 [0.076]*** -0.003[0.095]same subvillage 0.161 [0.069]** 0.039 [0.073] -0.031[0.099] 0.057 [0.129]Illness CharacteristicsMild illness -0.042[0.138] -0.014[0.144] -0.07 [0.175] -0.119[0.201]Average illness 0.095 [0.121] 0.124 [0.127] 0.064 [0.155] 0.071 [0.178]level.Very sick 0.235 [0.123]* 0.263 [0.128]** 0.246 [0.158] 0.218 [0.184]“could have died” 0.455 [0.143]*** 0.47 [0.149]*** 0.43 [0.183]** 0.463 [0.215]**days sick (log) -0.099[0.012]*** -0.1 [0.013]*** -0.088[0.015]*** -0.092[0.018]***ρ? 0.123 [0.041]*** 0.101 [0.042]** 0.11 [0.050]** 0.109 [0.058]*ρ?/ρ∅ -0.111[0.040]*** -0.109[0.040]*** -0.127[0.048]*** -0.118[0.056]**resp. to effort -0.035[0.037] -0.043[0.038] -0.062[0.046] -0.083[0.056]severity 0.032 [0.057] 0.038 [0.058] 0.037 [0.069] 0.026 [0.080]urgency 0.05 [0.055] 0.05 [0.056] 0.065 [0.068] 0.129 [0.080]resp. to skill, hosp. 0.095 [0.041]** 0.076 [0.041]* 0.048 [0.049] 0.023 [0.059]resp. to skill, clin. -0.003[0.038] -0.009[0.039] -0.002[0.046] -0.056[0.055]Location of health caretraditional healer -0.005[0.222] 0.00 [0.228] 0.155 [0.283] 0.038 [0.328]folk cure -0.188[0.096]** -0.205[0.097]** -0.261[0.115]** -0.346[0.132]***pharmacy -0.264[0.126]** -0.282[0.130]** -0.363[0.154]** -0.527[0.175]***non-hospital -0.193[0.079]** -0.219[0.081]*** -0.252[0.096]*** -0.327[0.112]***hospital 0.218 [0.083]*** 0.208 [0.086]** 0.177 [0.102]* 0.187 [0.118]new clinician 0.104 [0.062]* 0.111 [0.063]* 0.146 [0.075]* 0.169 [0.087]*Outcomesdied -0.226[0.320] -0.202[0.325] -0.198[0.367] -0.417[0.427]cured 0.084 [0.086] 0.107 [0.088] 0.149 [0.103] 0.148 [0.119]not cured 0.41 [0.109]*** 0.5 [0.137]*** 0.62 [0.166]*** 0.829 [0.205]***referral 0.37 [0.242] 0.441 [0.111]*** 0.461 [0.130]*** 0.495 [0.151]***visited other facility 0.485 [0.135]*** 0.371 [0.242] 0.543 [0.299]* 1.701 [0.555]***would return 0.231 [0.069]*** 0.231 [0.070]*** 0.29 [0.083]*** 0.365 [0.099]***Constant -2.476[0.152]*** -2.238[0.158]*** -1.376[0.194]*** -0.621[0.229]***Observations 25186 18306 5225 2375unique subj. hhlds. 493 492 429 295
Random effects probit model of the probability that a respondent household will mention and correctlydescribe key details of an illness in the subject household, from among four alternative sets of illnessesrecalled by the subject household. Random effects included for each unique subject household. Standarderrors shown in brackets, *, **, *** indicate significance at the 10%, 5% and 1% levels.(1) The set of all possible illnesses (Column (4) of Table 2). (2) All possible illnesses at subject householdsthat the respondent household knows. (3) All possible illnesses at subject households for which therespondent household says they know something about the health history. (4) All possible illnesses atsubject households for which the respondent household can correctly recall at least one health episode.
21