Embed Size (px)
Citation preview
Identifying the policy leversgenerating wage suppressionand wage inequalityReport • By Lawrence Mishel and Josh Bivens • May 13, 2021
• Washington, DC View this report at epi.org/215903
SECTIONS
1. Centering power andpolicy, not apolitical‘market forces,’ indebates over U.S.wages • 4
2. Wage trends andpatterns to beexplained • 6
3. The failure ofautomation and skillgaps to explain wagesuppression or wageinequality • 17
4. A more convincingtheory of sluggishwage growth andinequality in the U.S.:Policy-driven wagesuppression • 22
5. The aggregate impactof the policy choicesgenerating wagesuppression • 57
Acknowledgments • 71
Appendix A: The failureof automation and skillgaps to explain wagesuppression or wageinequality • 72
Appendix B: Theintentionality ofmacroeconomic policies• 84
Notes • 87
References • 92
Inequalities abound in the U.S. economy, and a centraldriver in recent decades is the widening gap between thehourly compensation of a typical (median) worker andproductivity—the income generated per hour of work. Thisgrowing divergence has been driven by two otherwidening gaps, that between the compensation receivedby the vast majority of workers and those at the top, andthat between labor’s share of income and capital’s. Thispaper presents evidence that the divorce between thegrowth of median compensation and productivity, theinequality of compensation, and the erosion of labor’sshare of income has been generated primarily throughintentional policy decisions designed to suppress typicalworkers’ wage growth, the failure to improve and updateexisting policies, and the failure to thwart new corporatepractices and structures aimed at wage suppression.Inequality will stop rising, and paychecks for typicalworkers will start rising robustly in line with productivity,only when we enforce labor standards and embracepolicies that reestablish individual and collectivebargaining power for workers.
Between 1979 and 2017, the compensation of medianworkers trailed economywide (net) productivity growth byroughly 43%, leading to rising inequality. The effects havebeen felt broadly: During this time 90% of U.S. workersexperienced wage growth slower than the economywideaverage, while workers at the top (mostly highlycredentialed professionals and corporate managers) andowners of capital reaped large rewards made possible onlyby this anemic wage growth for the bottom 90%. Becausethe historical legacy of racism has concentrated Black andLatinx workers in the lower half of the wage scale more sothan white workers, widespread wage suppression basedon class position has inflicted disproportionate harm onthem. Further, while women’s wages have grown fasterthan those for men in recent decades, women’s wagegrowth still has lagged the economy’s potential. In the fightfor a piece of the ever-shrinking share of economic growthavailable to the bottom 90%, any one group’s gain can feellike another’s loss, leading to political divisions andhindering the formation of cross-racial coalitions based oncommon interests as workers. In other words, thedisappointing wage growth of recent decades is animportant economic and political issue.
1
Yet sluggish wage growth is not a political secret; it has been widely recognized across thepolitical spectrum, even cited by both the Republican and Democratic Party platforms in2016.1 The root causes of the trend have frequently been misidentified, however. Oneprominent interpretation is that disappointing wage growth is an unfortunate result ofapolitical market forces that one neither can nor would want to alter. Since labor marketsare generally competitive and workers and employers have roughly balanced degrees ofmarket power, this argument naively assumes, fundamental apolitical forces liketechnological change and automation, as well as globalization, have mechanically shifteddemand away from non-college-educated and middle-wage workers. But, as this paperwill show, the premier research cited in support of an automation/technological theory hasitself actually offered empirical metrics that demonstrate that automation/technologicalchange fails to explain wage trends and wage inequality, especially in the period since1995. Since the automation/technological change explanation is the preeminentexplanation drawn from competitive labor market analyses based on equal bargainingpower between employers and employees, the failure of automation/technological changeto explain wage suppression and wage inequality represents the inability of competitivelabor market analyses to adequately explain one of the most salient features of theeconomy over the last four decades.
Thus, we need to look further for more convincing empirical explanations of why, during aperiod of rising productivity, hourly compensation for the bottom 90% of all workers hasrisen so slowly in spite of overall income growth. Doing so requires explaining the keydynamics. The growing wedge between rising productivity and compensation growth forthe typical worker financed the increased share of compensation going to top earners,especially those in the top 1% and 0.1%, along with a declining share of income going tolabor. In addition, over the last four decades there has been a persistent disparity in thegrowth of earnings between those in the 90–99% range and those in the middle. Further,wage disparities by gender, race, and ethnicity from the late 1970s, reflecting systemicsexism and racism, remain with us and have sometimes even worsened. Any accountingof where we are and what policies we need must address these issues.
This paper offers a narrative and supporting evidence on the mechanisms that havesuppressed wage growth since the late 1970s. We refer in this analysis to wagesuppression rather than wage stagnation because it was an actively soughtoutcome—engineered by policymakers who invited and enabled capital owners andbusiness managers to assault the leverage and bargaining power of typical workers, withthe inevitable result that those at the top claim a larger share of income. These policychanges and the change in business practices they enabled have systematically undercutindividual workers’ market (exit and voice) options and the ability of workers to obtainhigher pay, job security, and better-quality jobs. These corporate and policy decisions hadthe most adverse consequences for low- and middle-wage workers, who aredisproportionately women and minorities, the groups whose legacy of being discriminatedagainst in labor markets means that they especially need low unemployment, unions,strong labor standards, and policy supports for leverage when bargaining with employers.
Neither slow productivity growth nor inevitable economic forces can explain U.S. wageproblems. Rather, wage suppression reflects the failure of economic growth to reach the
2
vast majority. It was a “failure by design” (Bivens 2010), engineered by those with the mostwealth and power. The dynamics are primarily located in the labor market and thestrengthening of employers’ power relative to their rank-and-file workforce (whichincreasingly includes those workers with a four-year college degree). In other words, thedynamics that have challenged the growth of living standards for the vast majority arebased on workers not sharing in economic gains, not, as some have argued, onconsumers suffering from monopolistic prices. Changes in product market monopoly andcorporate structures have had an impact, but primarily by squeezing supply chain profitsand wages rather than by spurring higher consumer prices through much wider profitmargins.
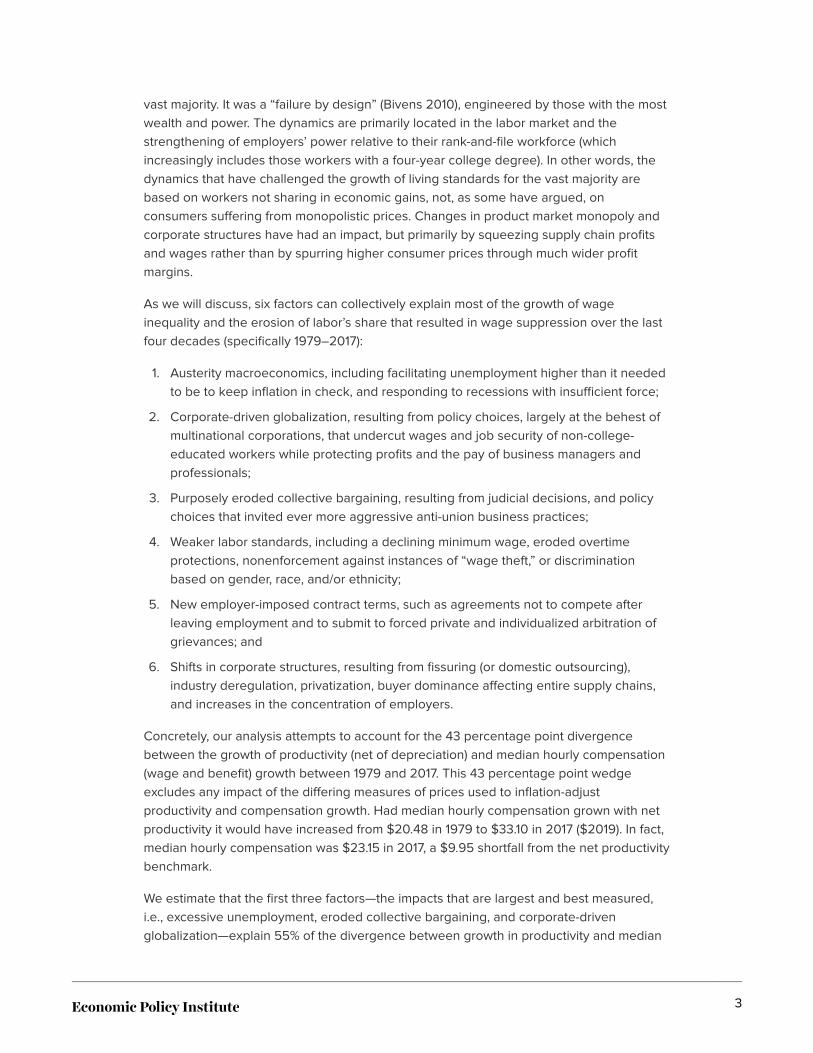
As we will discuss, six factors can collectively explain most of the growth of wageinequality and the erosion of labor’s share that resulted in wage suppression over the lastfour decades (specifically 1979–2017):
1. Austerity macroeconomics, including facilitating unemployment higher than it neededto be to keep inflation in check, and responding to recessions with insufficient force;
2. Corporate-driven globalization, resulting from policy choices, largely at the behest ofmultinational corporations, that undercut wages and job security of non-college-educated workers while protecting profits and the pay of business managers andprofessionals;
3. Purposely eroded collective bargaining, resulting from judicial decisions, and policychoices that invited ever more aggressive anti-union business practices;
4. Weaker labor standards, including a declining minimum wage, eroded overtimeprotections, nonenforcement against instances of “wage theft,” or discriminationbased on gender, race, and/or ethnicity;
5. New employer-imposed contract terms, such as agreements not to compete afterleaving employment and to submit to forced private and individualized arbitration ofgrievances; and
6. Shifts in corporate structures, resulting from fissuring (or domestic outsourcing),industry deregulation, privatization, buyer dominance affecting entire supply chains,and increases in the concentration of employers.
Concretely, our analysis attempts to account for the 43 percentage point divergencebetween the growth of productivity (net of depreciation) and median hourly compensation(wage and benefit) growth between 1979 and 2017. This 43 percentage point wedgeexcludes any impact of the differing measures of prices used to inflation-adjustproductivity and compensation growth. Had median hourly compensation grown with netproductivity it would have increased from $20.48 in 1979 to $33.10 in 2017 ($2019). In fact,median hourly compensation was $23.15 in 2017, a $9.95 shortfall from the net productivitybenchmark.
We estimate that the first three factors—the impacts that are largest and best measured,i.e., excessive unemployment, eroded collective bargaining, and corporate-drivenglobalization—explain 55% of the divergence between growth in productivity and median
3
hourly compensation, and specific other factors included above—a diminished overtimesalary threshold, employee misclassification, employer-imposed noncompete agreements,and corporate fissuring-subcontracting and major-buyer dominance—explain another 20%.Together, the factors for which we have been able to assess their impact on the medianwage can account for three-fourths of the divergence between productivity and medianhourly compensation growth from 1979 to 2017. Other factors that we have not been ableto empirically assess—increased wage theft and weak enforcement, anti-poachingagreements, increased discrimination, forced arbitration agreements, guestworkerprograms, and increased prevalence of employer-created “lawless zones” in the labormarket where workers are deprived of effective labor protections because of theirimmigration status—have also contributed to wage suppression.
Our analysis also seeks to account for the falling wages at the 10th percentile and thegrowth of the wage gap between the 10th percentile and the 50th. We find that these arereadily explained by excessive unemployment and the failure to maintain the real value ofthe minimum wage, factors that have lowered the earnings of the bottom third. Otherfactors for which we do not yet have good measures of their impact (increased wage theft,the increased share of workers without effective legally protected rights due to theirimmigration status, and employee misclassification) likely play a role as well. In contrast,our analysis of data (in a section below and in Appendix A) related to automation and skill-biased technological change finds that these factors have had no impact on thesuppression of median wages for at least the last 25 years.
Centering power and policy, notapolitical ‘market forces,’ in debatesover U.S. wagesThe large increase in inequality in the U.S. economy coincided with a pronounced politicalmovement that called for increasing the reach and influence of markets in American life.This movement, known as market fundamentalism and often shorthanded asneoliberalism, has a long history in both U.S. and international policy debates. By the late1970s, it achieved great prominence, even within the Democratic Party. Neoliberalism’sbelief that markets are more efficient and effective than alternative instruments fordistributing resources and organizing economic life led it straight to many of the policyrecommendations that drove the rise in inequality. Neoliberals, for example, see minimumwages as an inefficient friction in otherwise competitive and efficient labor markets. So,minimum wages have been allowed to be battered by inflation.
The neoliberal policy agenda has often had its most enthusiastic proponents amongeconomists. Under the influence of neoliberalism the economics profession,encompassing both the liberal and conservative wings, shed many older but supremelyvaluable insights about the importance of institutional checks on markets (especially labormarkets) and began analyzing all labor market developments through the lens of textbookcompetitive models. In these models, the great wage deceleration for the vast majority of
4
workers after 1979 and the resulting rise in inequality could only have happened ifimpersonal market forces shifted relative demand or supply curves for different sorts oflabor.
The mistake of assuming that markets are always well characterized by the simplestcompetitive models of textbooks proliferated well beyond the labor market. With regard toproduct markets, the assumption led economists to argue for a retreat from robust anti-trust enforcement and for the deregulation of industries in sectors such as trucking,airlines, interstate busing, and utilities. The assumption that financial markets werecompetitive led economists to argue for financial deregulation. The promotion ofshareholder primacy, that corporations and executives should only advance the profitneeds of shareholders, was an important component of this market fundamentalism.
But the greatest damage occurred in labor markets. The focus on labor marketcompetition led to the promotion of “labor flexibility” to achieve growth; this policy agendasought to weaken collective bargaining, worker protections, and the social safety net (e.g.,unemployment insurance). If your model says that only apolitical market-driven shifts ofdemand and supply curves can explain wage and employment trends, then what mightthese forces be? As wage suppression took hold, the consensus of elite economists, bothliberals and conservatives, excused it as the result of computer-driven automation, a factorwe would neither want to nor could restrain. In this scenario, the sole answer is to providemore skills and college education for the workers who have skill deficits—or essentiallytelling workers that they themselves are to blame for their loss of quality jobs.
But these explanations just don’t fit the data, and when data and model conflict, the wisemove is to follow the data. So, if the neoliberal analysis fails to explain wage trends, thenthe resulting neoliberal policy recommendations should be jettisoned. If we manage to dothis, our analysis of just what has happened to U.S. wages and inequality will be strongerand provide a better basis for fixing these issues going forward.
A good example of how the policies we have adopted rather than markets explain wagetrends can be found by looking at the wage gaps between workers of different races,genders, and ethnicities. Understanding wage suppression as the result of the exercise ofpower in labor markets widens our understanding of the potential sources of these long-standing race and gender disparities, gaps that widened during the coronavirus pandemic.The systemic racism that slots minority workers into lesser-paid jobs has made theseworkers the primary victims of the systematic weakening of worker power. Consequently,one of the key mechanisms to lessen racial and gender inequities is to restore workerpower generally as well as to shape policy to ensure all workers have access to good jobs.
This paper’s analysis complements and points in the same direction as other recentresearch that has focused attention on worker power. For instance, Stansbury andSummers (2020) also argue that reduced worker power explains sluggish wage growthand a declining labor share of income. New empirical examinations of employermonopsony power have identified a growing (at least since the late 1990s) and pervasiveemployer ability to mark down wages from 20% to 50% and to exert more power over low-wage workers than others. This new monopsony literature provides a top-down analysis,
5

estimating the aggregate potential employer power to suppress wages and thenexamining the contributing role of countervailing forces like unionization, high-pressurelabor markets, and high values of minimum wages in explaining an aggregate net metric ofemployer power. In contrast, we provide a bottom-up analysis examining the impact ofmany specific factors and gauging their contribution to the overall divergence betweenproductivity and median compensation growth.
Joseph Stiglitz (2012, 2021) has long focused on power in markets, emphasizing bothproduct market monopoly power and the weakening of employee power relative toemployers. He recently provided an analysis similar to the framework of this paper:
The commonsense statement that employers have power over their employees haslong been heretical in the economics profession…. More and more, firms havedemonstrated high and increasing levels of market power. At the same time, thebargaining power of workers has weakened…. [T]his imbalance of market powerhas consequences…. It enables firms to suppress wages of workers below whatthey would be in a competitive marketplace—contributing to the inequality crisisfacing the country…. Employers and employees need to be able to bargain onmore-equal footing. (Stiglitz 2021)
Our research and these other recent findings demonstrate that employer power isubiquitous in labor markets, and that wages will be lower and wage growth suppressedabsent institutions and policies that provide countervailing power. In other words,employer power is a constant of modern labor markets, but what has changed over thepast generation or two is the erosion of institutions and policies—high-pressure labormarkets, robust enforcement, unions, and meaningful minimum wages—that onceprovided that countervailing power.
The paper proceeds as follows. The first step is examining the wage and profit trends thatany theory of wage suppression needs to explain. The second section assesses theconventional explanation of “skill-biased technological change”—namely, that in the faceof rapid technological change or automation workers lack the skills necessary for moremodern production systems. The third section identifies the six factors, from excessiveunemployment and eroded collective bargaining to shifts in corporate structures, that webelieve much better explain wage suppression. The final section reviews how this paperfits into the overall literature on wage inequality and draws on the estimated impact of thevarious factors to establish how much they explain the overall divergence betweenproductivity and median hourly compensation as well as the growth of the 50/10 wage gapand changes of the 10th percentile wage.
Wage trends and patterns to beexplainedThere are three remarkable disparities in growth of wages by workers’ wage rankings thatpolicymakers need to understand and economists need to explain: the one between the
6

highest earners (the top 1% and top 0.1%) and other high-wage earners; the one betweenhigh-wage and middle-wage earners (the 95/50 or the 90/50 wage gaps); and the onebetween middle- and low-wage earners (the 50/10 wage gap). In addition, a theory aboutwage trends will need to explain the decline in the share of overall income accruing tolabor, since this drop saps wage growth; the differing growth rates by educationalcredential, especially four-year college degrees; the growing divergence between typicalworkers’ pay (including both wages and benefits) and economywide productivity; and thewidening wage gaps that appear between workers of different races, genders, andethnicities.
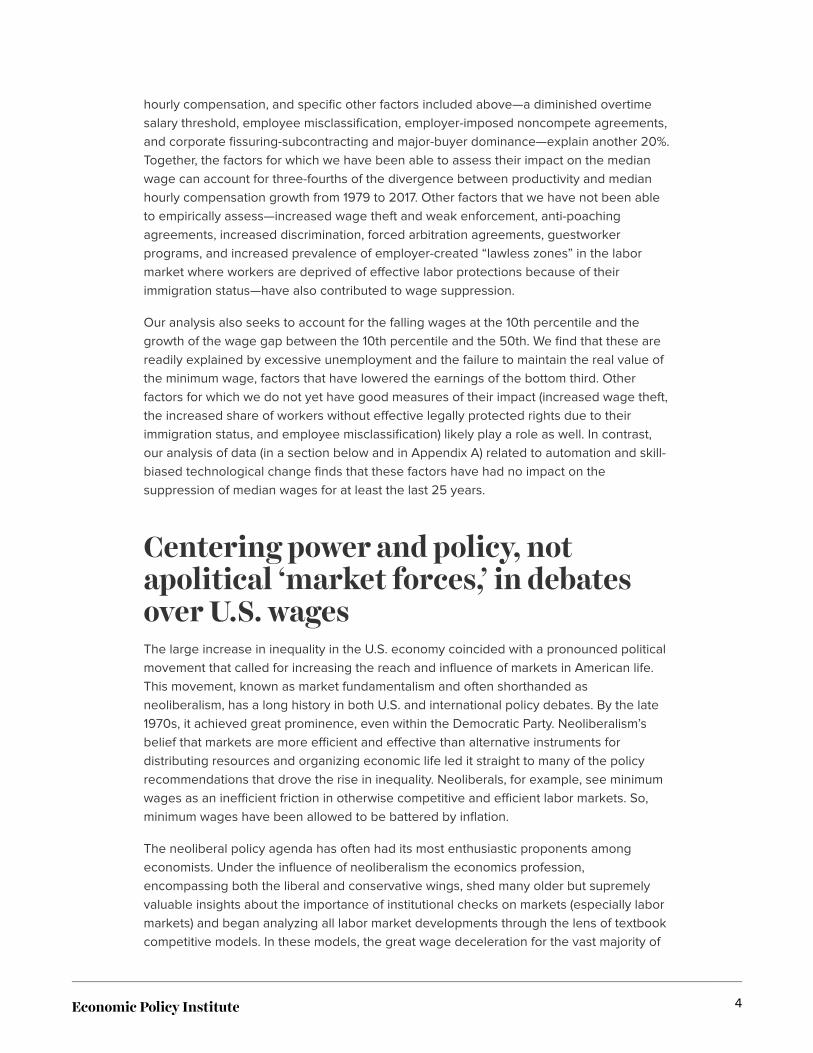
Wage growth trends by percentileBelow we delve into some detail in these trends. The rough summary of inflation-adjustedwage growth, detailed below, is as follows. Between 1979 and 2019 (the end of the lastbusiness cycle), inflation-adjusted annual wages at the very top have grown tremendously.Those in the top 1% enjoyed 160% growth, and those at the very top—the top0.1%—experienced growth of 345%. Growth was much slower at the 95th percentile—63%(using hourly wage data), slower still at the 50th (15%), and a snail’s pace at the 10th(3%)—though it is worth noting that growth rates at the middle and the bottom were notremarkably different since the late 1980s. Two key wage gaps have grown since the late1980s: the one between the top and very top on the one hand and all other earners,including even those at the 95th percentile, on the other, and the gap between highearners and middle earners, illustrated by the ratio of wages at the 95th (or 90th)percentile and the median wage.
Wages at the top—the upper 1% and 0.1%
One of the trends that went unrecognized and unexamined in the mainstream laboreconomics literature for decades was the remarkable growth for those in the upper 1% andthe even faster growth among those in the top 0.1% of wage earners. This growth in wagesfor the highest-earning households is a key cause of the better-known phenomenon ofgrowth in the household incomes of the top 1%, a finding popularized by Occupy WallStreet and based on the well-known data developed by Thomas Piketty and EmmanuelSaez (2003). The headline Piketty and Saez data are for households (“tax units” to beprecise, but importantly they are not for individual workers) and include both wagesearned by household members but also other income such as dividends, capital gains,and business income. However, one can analyze data to focus solely on wage and salaryincome of individual earners. Such an examination also shows superlative growth at thevery top and demonstrates the importance of the upward redistribution of wage and salaryincome to the overall growth of top 1% household incomes.
Figure A, based on Social Security Administration data (see Mishel and Kandra 2020 fordetails), shows wage growth by the differing wage groups, including those at the top andvery top. The Social Security data include all W-2 earnings as reported by employers(including the value of realized stock options and vested stock awards received byexecutives). Between 1979 and 2019, annual wages for the top 1% grew 160%. The wage
7
Figure A Cumulative percent change in real annual wages, by wagegroup, 1979–2019
Source: Authors’ analysis of Kopczuk, Saez, and Song (2007, Table A3) and Social Security Administrationwage statistics. State of Working America Data library: Wages for Top 1.0%, 0.1%, and Bottom 90%. SeeMishel and Kandra (2020) for details.
2007: 156.2% 160.3%
55.4%75.1%
34.1%51.8%
16.7% 26.0%
Top 1%95th–99th90th–95thBottom 90%
-50
0
50
100
150
200%
1980 1990 2000 2010 2020
Top 0.1%: ↑ 345.2%
growth of the top 0.1%—345%—is listed but not represented on the graph because it is onsuch a different scale.
In contrast, the wages of the bottom 90% grew by just 26% over those 40 years, with mostof the growth occurring in a couple of brief and discrete periods of sustained lowunemployment. The total wage growth in the 1995–2000 and 2013–2019 periods was20%, roughly three-quarters of the cumulative wage growth for the bottom 90% over theentire 1979–2019 period. High earners in the 90th to 95th percentiles had wage growthfaster than the vast majority (up 52%) but nowhere near that of those at the very top.
The share of all wages earned by those in the top 1% nearly doubled from 1979 to 2019,from 7.3% to 13.2%. Correspondingly, the share of wages earned by the bottom 90%eroded throughout this time, from 69.8% in 1979 to 60.9% in 2019 (Mishel and Kandra2020). Had this redistribution not taken place, wages for those in the bottom 90% couldhave grown by 44.6%, 18.5 percentage points more than was the case.2 In short, theredistribution of wages from low and middle to high percentiles has greatly mattered forwhat the vast majority took home in their paychecks.
Wage gaps for most everyone else: The 95/50 and 50/10gaps
Outside the top 1%, the clearest growth in wage gaps between percentiles in the wagedistribution has been between high earners and middle-wage earners. This is oftenillustrated by the wage gap between the earners at the 95th percentile and the median
8

Figure B Wage gap between the 95th and 50th percentiles, bygender, 1973–2019
*Ratio of workers' wages at the 95th earnings percentile to wages at the 50th percentile.
Source: Authors' analysis of State of Working America Data library: Wages by percentile and wage ratios.See Gould (2020).
Wag
e ga
p*
95/50 wage gap: men
95/50 wage gap: women
1980 1990 2000 2010 20202
3
4
5
(50th percentile) worker. Perhaps surprisingly to some, wage gaps in the bottom half of thedistribution of wages (those between middle-wage and low-wage workers) have notgrown for more than 30 years (basically since 1987–1988).
Figures B and C show the trends in the 95/50 and 50/10 wage gaps by gender. Onestriking dimension of the growth of wage inequality is the persistent, continuous growth ofthe wage gap between those higher up, the 95th percentile, and middle-wage workerssince 1979, among both men and women (Figure B). The growth of the 95/50 wage gaphas accelerated over time, growing faster in the more recent period (either 1995–2019 or2000–2019) than it did earlier.3 The growth of the gap between those at the top and themiddle of the wage distribution, and its acceleration after the late 1990s, is one of the keywage patterns that need to be explained.
In contrast, there has been little change (or an actual decline) in the 50/10 wage gap sincethe late 1980s (Figure C). The log 50/10 wage gap (using the same data as in the figure)grew from 0.57 in 1979 to 0.75 in 1987 and then declined to 0.68 in 2000 and to 0.65 in2019. There was a jump in this gap in the early and mid-1980s, especially among women.The fact that there was a much more modest increase in the 50/10 wage gap among menprovides an important clue as to the source of this rising gap: the erosion of the real valueof the federal minimum wage. Federal inaction on the minimum wage in the 1980s had amuch larger impact on low-wage women than low-wage men because women are farmore likely to earn wages low enough to be affected by the minimum wage. Theimportance of institutions (the federal minimum wage) in this case will become a pattern aswe look at the data on wage gaps and their causes more generally. The decline in the 50/
9

Figure C Wage gap between the 50th and 10th percentiles, bygender, 1973–2019
*Ratio of workers' wages at the 50th earnings percentile to wages at the 10th percentile.
Source: Authors' analysis of State of Working America Data library: Wages by percentile and wage ratios.See Gould (2020).
Wag
e ga
p*
50/10 wage gap: men
50/10 wage gap: women
1980 1990 2000 2010 20201
1.5
2
2.5
10 wage gap since 1987–1988 presents a severe challenge to explanations of wageinequality focused on skill or education premiums, since it appears that those with theleast education fared somewhat better than those with middling educations. The fact thatthe 50/10 wage gaps were relatively constant since the late 1980s indicates that a similar,or related, set of forces were at work suppressing wages at both the bottom and themiddle.
Wage differences by educationThe academic and policy debate about wage inequality has often focused on wage gapsacross education groups, especially between those with a (four-year) college degreeversus those without. Growing education wage differentials have been the basis of thepremier conventional explanation of growing wage inequality, which attributes it to “skill-biased technological change.” This theory holds that labor markets are well characterizedby competitive models and that an exogenous technology shock—often identified asautomation driven by information technologies—has reduced the relative demand forworkers without a college degree relative to their college peers, leading to wideninginequality between wage earners. The policy corollary to this view has been a call forworkers to get college degrees.
The automation-driven skills-gap narrative is critically examined in a later section and inAppendix A. In this section the basic contours of education wage gaps over time areexamined. The key metric for capturing education wage differentials is the college–high
10
Figure D College wage premium, by gender, 1973–2019
*Percent by which wages of college graduates exceed those of otherwise-equivalent high schoolgraduates, regression-adjusted.
Source: Authors’ analysis of State of Working America Data library: College wage premium. See Gould(2020).
Pre
miu
m*
Women
Men
Premium (women regression-based)Premium (men regression-based)
1980 1990 2000 2010 202020
30
40
50
60%
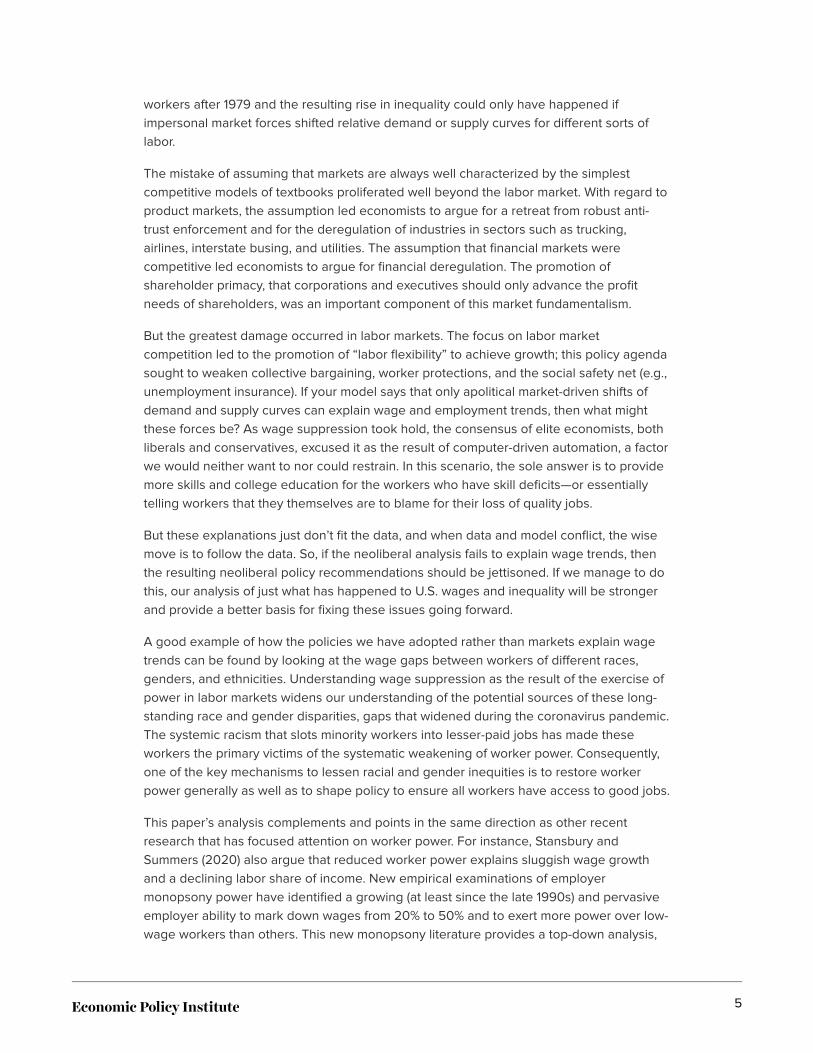
school premium, or simply the college wage premium, the difference in hourly wagesbetween a college graduate and a high school graduate, controlling for demographiccharacteristics such as gender, race, and experience. The trend in the college wagepremium since 1979 is shown in Figure D.4
The college wage premium grew sharply in the 1980s and early 1990s, the era whenresearch arguing for a skills-based explanation of wage inequality grew in prestige.However, growth in the college wage premium has been quite modest since themid-1990s: It rose by 17.5 log points over the 16 years between 1979 and 1995 but by only6.4 log points in the 24 years from 1995 to 2019. In annual terms the premium grew 1.1% inthe 1979–1995 period but just 0.3% between 1995 and 2019—and just 0.1% per year in the2000s. The deceleration did not occur because there was an upsurge in the availability ofcollege graduates; in fact, Autor, Goldin, and Katz (2020) show that the relative supply ofcollege graduates grew more slowly in the 1999-2017 period than in the earlier 1979–1999period.5
It is worth noting that other education wage differentials, such as that between high schoolgraduates and those who left high school and between associate-degree holders and highschool graduates, have been fairly stable since 1995. For example, the wage gap,regression-adjusted, between those with a high school degree and those not completinghigh school (or a GED) rose only slightly between 1979 and 1987—up 2.6 logpoints—hardly sufficient to explain the sharp rise in the 50/10 wage gap over that period.Between 1987 and 2018 this wage gap shrank by 3.0 log points, reversing the entire1979–1987 rise and leaving the wage gap where it was in 1979. Since there was hardly any
11
growth in education wage gaps among the bottom three education groups, anyexplanation for wage gaps in the bottom half that relies on education gaps has littleexplanatory power.
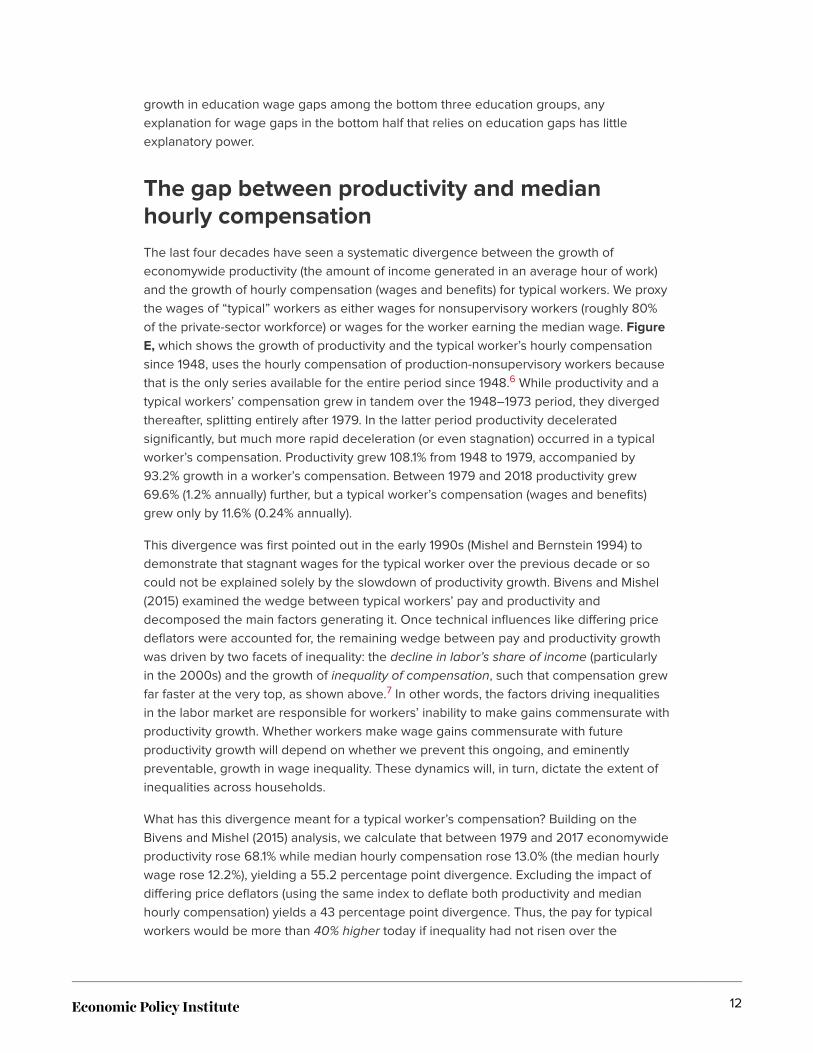
The gap between productivity and medianhourly compensationThe last four decades have seen a systematic divergence between the growth ofeconomywide productivity (the amount of income generated in an average hour of work)and the growth of hourly compensation (wages and benefits) for typical workers. We proxythe wages of “typical” workers as either wages for nonsupervisory workers (roughly 80%of the private-sector workforce) or wages for the worker earning the median wage. FigureE, which shows the growth of productivity and the typical worker’s hourly compensationsince 1948, uses the hourly compensation of production-nonsupervisory workers becausethat is the only series available for the entire period since 1948.6 While productivity and atypical workers’ compensation grew in tandem over the 1948–1973 period, they divergedthereafter, splitting entirely after 1979. In the latter period productivity deceleratedsignificantly, but much more rapid deceleration (or even stagnation) occurred in a typicalworker’s compensation. Productivity grew 108.1% from 1948 to 1979, accompanied by93.2% growth in a worker’s compensation. Between 1979 and 2018 productivity grew69.6% (1.2% annually) further, but a typical worker’s compensation (wages and benefits)grew only by 11.6% (0.24% annually).
This divergence was first pointed out in the early 1990s (Mishel and Bernstein 1994) todemonstrate that stagnant wages for the typical worker over the previous decade or socould not be explained solely by the slowdown of productivity growth. Bivens and Mishel(2015) examined the wedge between typical workers’ pay and productivity anddecomposed the main factors generating it. Once technical influences like differing pricedeflators were accounted for, the remaining wedge between pay and productivity growthwas driven by two facets of inequality: the decline in labor’s share of income (particularlyin the 2000s) and the growth of inequality of compensation, such that compensation grewfar faster at the very top, as shown above.7 In other words, the factors driving inequalitiesin the labor market are responsible for workers’ inability to make gains commensurate withproductivity growth. Whether workers make wage gains commensurate with futureproductivity growth will depend on whether we prevent this ongoing, and eminentlypreventable, growth in wage inequality. These dynamics will, in turn, dictate the extent ofinequalities across households.
What has this divergence meant for a typical worker’s compensation? Building on theBivens and Mishel (2015) analysis, we calculate that between 1979 and 2017 economywideproductivity rose 68.1% while median hourly compensation rose 13.0% (the median hourlywage rose 12.2%), yielding a 55.2 percentage point divergence. Excluding the impact ofdiffering price deflators (using the same index to deflate both productivity and medianhourly compensation) yields a 43 percentage point divergence. Thus, the pay for typicalworkers would be more than 40% higher today if inequality had not risen over the
12
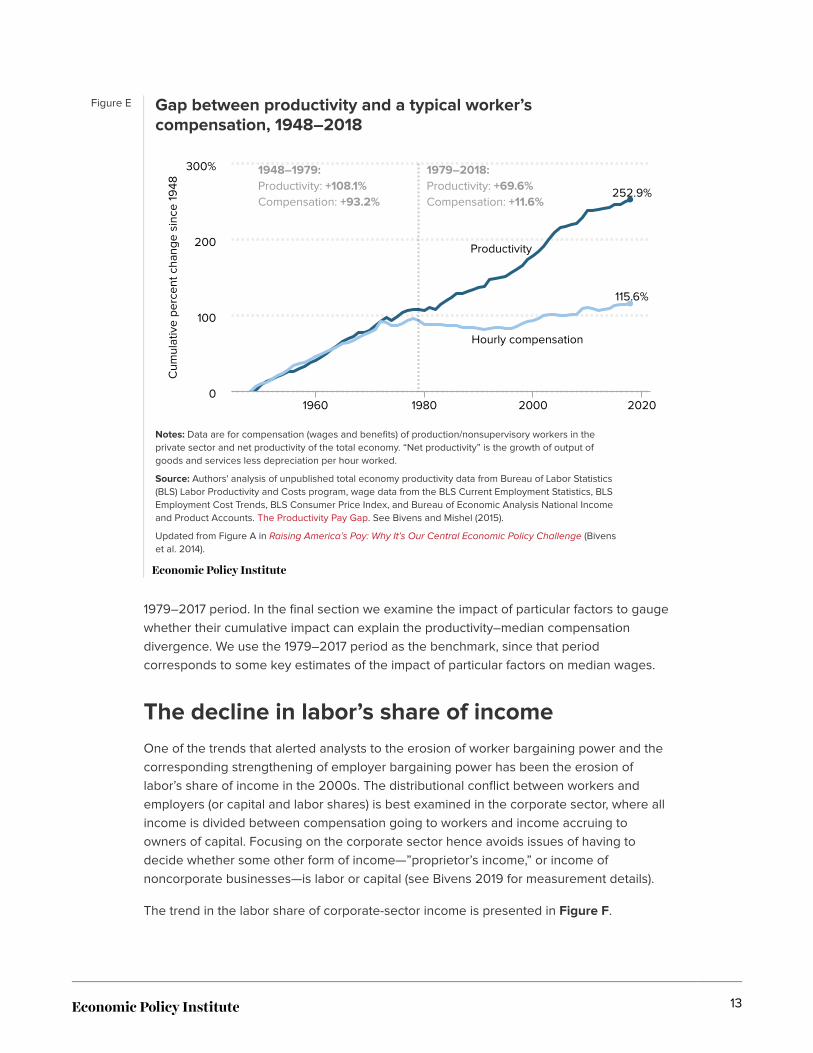
Figure E Gap between productivity and a typical worker’scompensation, 1948–2018
Notes: Data are for compensation (wages and benefits) of production/nonsupervisory workers in theprivate sector and net productivity of the total economy. “Net productivity” is the growth of output ofgoods and services less depreciation per hour worked.
Source: Authors' analysis of unpublished total economy productivity data from Bureau of Labor Statistics(BLS) Labor Productivity and Costs program, wage data from the BLS Current Employment Statistics, BLSEmployment Cost Trends, BLS Consumer Price Index, and Bureau of Economic Analysis National Incomeand Product Accounts. The Productivity Pay Gap. See Bivens and Mishel (2015).
Updated from Figure A in Raising America’s Pay: Why It’s Our Central Economic Policy Challenge (Bivenset al. 2014).
Cum
ulat
ive
perc
ent c
hang
e si
nce
1948
Productivity
252.9%
Hourly compensation
115.6%
1960 1980 2000 20200
100
200
300% 1948–1979:Productivity: +108.1%Compensation: +93.2%
1979–2018:Productivity: +69.6%Compensation: +11.6%
1979–2017 period. In the final section we examine the impact of particular factors to gaugewhether their cumulative impact can explain the productivity–median compensationdivergence. We use the 1979–2017 period as the benchmark, since that periodcorresponds to some key estimates of the impact of particular factors on median wages.
The decline in labor’s share of incomeOne of the trends that alerted analysts to the erosion of worker bargaining power and thecorresponding strengthening of employer bargaining power has been the erosion oflabor’s share of income in the 2000s. The distributional conflict between workers andemployers (or capital and labor shares) is best examined in the corporate sector, where allincome is divided between compensation going to workers and income accruing toowners of capital. Focusing on the corporate sector hence avoids issues of having todecide whether some other form of income—”proprietor’s income,” or income ofnoncorporate businesses—is labor or capital (see Bivens 2019 for measurement details).
The trend in the labor share of corporate-sector income is presented in Figure F.
13
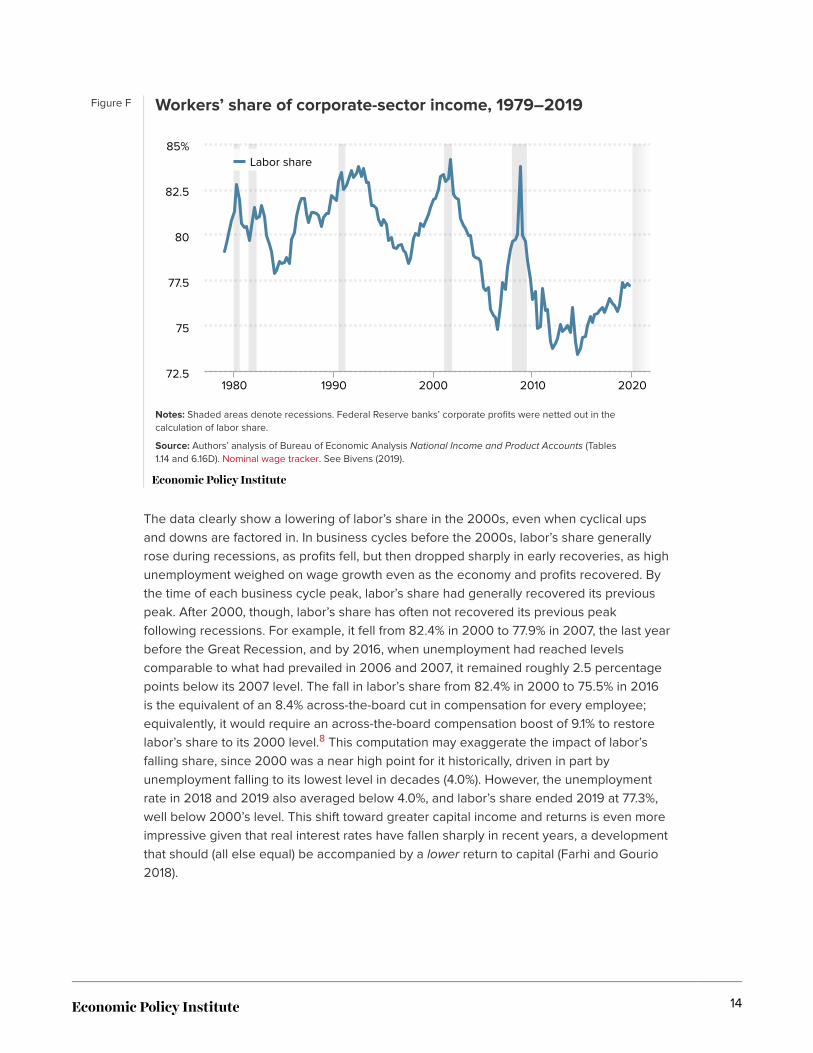
Figure F Workers’ share of corporate-sector income, 1979–2019
Notes: Shaded areas denote recessions. Federal Reserve banks’ corporate profits were netted out in thecalculation of labor share.
Source: Authors’ analysis of Bureau of Economic Analysis National Income and Product Accounts (Tables1.14 and 6.16D). Nominal wage tracker. See Bivens (2019).
Labor share
1980 1990 2000 2010 202072.5
75
77.5
80
82.5
85%
The data clearly show a lowering of labor’s share in the 2000s, even when cyclical upsand downs are factored in. In business cycles before the 2000s, labor’s share generallyrose during recessions, as profits fell, but then dropped sharply in early recoveries, as highunemployment weighed on wage growth even as the economy and profits recovered. Bythe time of each business cycle peak, labor’s share had generally recovered its previouspeak. After 2000, though, labor’s share has often not recovered its previous peakfollowing recessions. For example, it fell from 82.4% in 2000 to 77.9% in 2007, the last yearbefore the Great Recession, and by 2016, when unemployment had reached levelscomparable to what had prevailed in 2006 and 2007, it remained roughly 2.5 percentagepoints below its 2007 level. The fall in labor’s share from 82.4% in 2000 to 75.5% in 2016is the equivalent of an 8.4% across-the-board cut in compensation for every employee;equivalently, it would require an across-the-board compensation boost of 9.1% to restorelabor’s share to its 2000 level.8 This computation may exaggerate the impact of labor’sfalling share, since 2000 was a near high point for it historically, driven in part byunemployment falling to its lowest level in decades (4.0%). However, the unemploymentrate in 2018 and 2019 also averaged below 4.0%, and labor’s share ended 2019 at 77.3%,well below 2000’s level. This shift toward greater capital income and returns is even moreimpressive given that real interest rates have fallen sharply in recent years, a developmentthat should (all else equal) be accompanied by a lower return to capital (Farhi and Gourio2018).
14
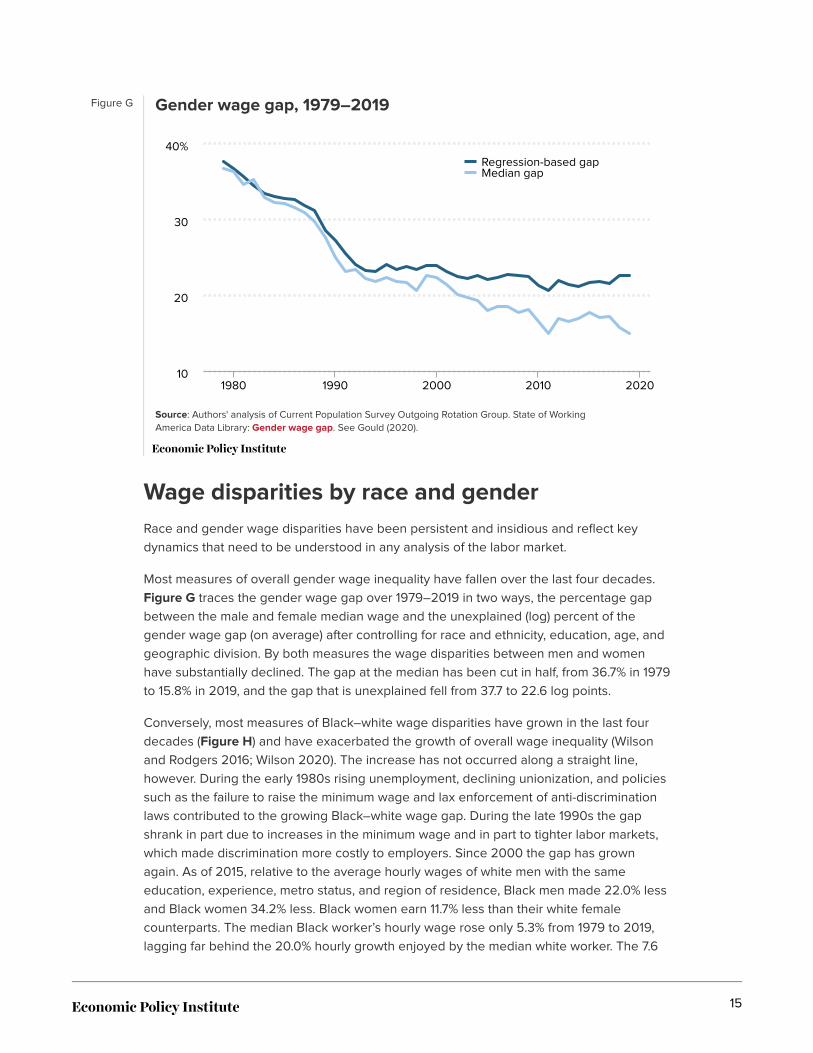
Figure G Gender wage gap, 1979–2019
Source: Authors' analysis of Current Population Survey Outgoing Rotation Group. State of WorkingAmerica Data Library: Gender wage gap. See Gould (2020).
Regression-based gapMedian gap
1980 1990 2000 2010 202010
20
30
40%
Wage disparities by race and genderRace and gender wage disparities have been persistent and insidious and reflect keydynamics that need to be understood in any analysis of the labor market.
Most measures of overall gender wage inequality have fallen over the last four decades.Figure G traces the gender wage gap over 1979–2019 in two ways, the percentage gapbetween the male and female median wage and the unexplained (log) percent of thegender wage gap (on average) after controlling for race and ethnicity, education, age, andgeographic division. By both measures the wage disparities between men and womenhave substantially declined. The gap at the median has been cut in half, from 36.7% in 1979to 15.8% in 2019, and the gap that is unexplained fell from 37.7 to 22.6 log points.
Conversely, most measures of Black–white wage disparities have grown in the last fourdecades (Figure H) and have exacerbated the growth of overall wage inequality (Wilsonand Rodgers 2016; Wilson 2020). The increase has not occurred along a straight line,however. During the early 1980s rising unemployment, declining unionization, and policiessuch as the failure to raise the minimum wage and lax enforcement of anti-discriminationlaws contributed to the growing Black–white wage gap. During the late 1990s the gapshrank in part due to increases in the minimum wage and in part to tighter labor markets,which made discrimination more costly to employers. Since 2000 the gap has grownagain. As of 2015, relative to the average hourly wages of white men with the sameeducation, experience, metro status, and region of residence, Black men made 22.0% lessand Black women 34.2% less. Black women earn 11.7% less than their white femalecounterparts. The median Black worker’s hourly wage rose only 5.3% from 1979 to 2019,lagging far behind the 20.0% hourly growth enjoyed by the median white worker. The 7.6
15
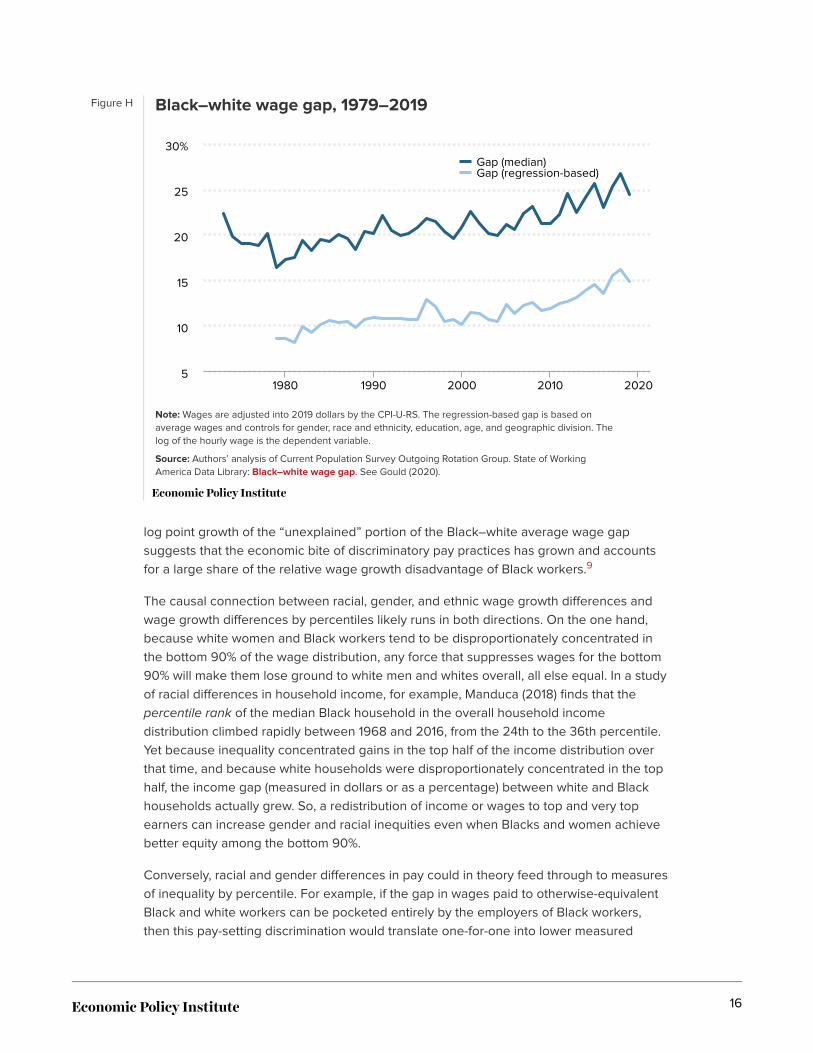
Figure H Black–white wage gap, 1979–2019
Note: Wages are adjusted into 2019 dollars by the CPI-U-RS. The regression-based gap is based onaverage wages and controls for gender, race and ethnicity, education, age, and geographic division. Thelog of the hourly wage is the dependent variable.
Source: Authors’ analysis of Current Population Survey Outgoing Rotation Group. State of WorkingAmerica Data Library: Black–white wage gap. See Gould (2020).
Gap (median)Gap (regression-based)
1980 1990 2000 2010 20205
10
15
20
25
30%
log point growth of the “unexplained” portion of the Black–white average wage gapsuggests that the economic bite of discriminatory pay practices has grown and accountsfor a large share of the relative wage growth disadvantage of Black workers.9
The causal connection between racial, gender, and ethnic wage growth differences andwage growth differences by percentiles likely runs in both directions. On the one hand,because white women and Black workers tend to be disproportionately concentrated inthe bottom 90% of the wage distribution, any force that suppresses wages for the bottom90% will make them lose ground to white men and whites overall, all else equal. In a studyof racial differences in household income, for example, Manduca (2018) finds that thepercentile rank of the median Black household in the overall household incomedistribution climbed rapidly between 1968 and 2016, from the 24th to the 36th percentile.Yet because inequality concentrated gains in the top half of the income distribution overthat time, and because white households were disproportionately concentrated in the tophalf, the income gap (measured in dollars or as a percentage) between white and Blackhouseholds actually grew. So, a redistribution of income or wages to top and very topearners can increase gender and racial inequities even when Blacks and women achievebetter equity among the bottom 90%.
Conversely, racial and gender differences in pay could in theory feed through to measuresof inequality by percentile. For example, if the gap in wages paid to otherwise-equivalentBlack and white workers can be pocketed entirely by the employers of Black workers,then this pay-setting discrimination would translate one-for-one into lower measured
16
wages of typical workers of all races. If, on the other hand, pay-setting discriminationreflects employer preferences for white workers over Black workers, then some of thisBlack/white wage gap is a de facto transfer from Black workers to white workers. Lessmechanically, if the maintenance of racial and gender wage gaps fosters division andhamstrings collective cross-race and cross-gender efforts to raise wages in workplaces,then these gaps could be a powerful force for employers looking to keep overall wagessuppressed.
The failure of automation and skillgaps to explain wage suppression orwage inequalityThat a huge proportion of U.S. workers have “skills deficits,” i.e., lack the skills necessaryto deal with technological change (including primarily automation of the tasks performedby workers without a four-year college degree), has been the predominant explanationoffered by economists, pundits, policymakers, and the media to explaining sluggish wagegrowth and inequality in the United States, at least until recently (see Box A for why wefocus on “automation” rather than a more general “technological” explanation). This is theskill-biased technological change hypothesis, which points to the increased use ofcomputer equipment in the workplace and the onset of the information age. One version,focused on education wage gaps, argues that computerized automation has made more-educated workers—generally referring to those with at least a four-year collegedegree—more valuable to employers and has correspondingly reduced the value of thosewithout a college degree (Katz and Murphy 1992; Goldin and Katz 2007, 2008). Thisgrowing wage gap between college-educated and non-college-educated workers—thecollege wage premium—is used to explain rising wage inequality between high earnersand the majority of earners who lack a four-year college credential (62% of earners in2019, down from 82% in 197910).
BOX A
The difference between ‘technology’ and‘automation’ as a driver of inequality
Economists inadvertently talk past the public when they refer to “technology”driving wage inequality when they are really talking about the skill-biasedtechnological change thesis, which centers on workplace automation of tasksperformed by workers without a four-year college degree. Technological changeis a broad term that applies to everyday life and involves communicationstechnology, technology embedded in consumer products (e.g., phones, cars,energy-saving appliances), and other technologies separate and independent of
17
workplace automation. There may be rapid change in the technologies observedin consumer products or in telecommunications even though workplaceautomation—and its relative effect on workers with different educationcredentials—is proceeding at a historically average or slower pace. Changes incommunications technology may help fuel globalization and may help enabledomestic outsourcing (“fissuring”) to be undertaken more cheaply, but thesechannels through which technology may affect labor market trends are quitedifferent than those sketched out by theories of skill-biased technologicalchange in the workplace.
Skill-biased technological change represents automation, the change inproduction methods where machinery and software replace the tasks formerlyperformed by workers without a four-year college degree, thereby generating anew mix of the human capital needed (more “skilled labor,” less “less-skilled”labor).
A second version of the automation story, frequently referred to as the “job polarizationthesis,” argues that technological change
has increased the value of abstract reasoning, of creativity, of expertise, ofjudgment and devalued a lot of skilled work that people did that followed well-understood rules and procedures. So that would be many clerical jobs, phoneanswering jobs, calculating, accounting, bookkeeping, copying, and filing, but alsomany production jobs, which often involved skilled, repetitive tasks. Butincreasingly once we understand the rule book for that type of work, it’s feasible toencode it in software and have it executed by machines or by computers.” (DavidAutor, interviewed by Greenhouse 2020)
This type of automation sees the replacement of human labor by computers or othermodes of automation as not just falling along the lines of greater/fewer educationcredentials (whether a worker has a college degree or not). Instead, occupationalsusceptibility to having tasks automated is said to be “polarized”—middle-wageoccupations specializing in routine, automatable tasks shrink while employment expandsin both higher-wage “abstract reasoning” occupations and in lower-wage non-routinizedoccupations.
These versions of skill-biased technological change portray the cause of wagesuppression and wage inequality as due to a factor, automation, that is both inevitable(one can’t stop technology’s forward march) and desirable (after all, technological changeis a key driver of rising living standards). Thus, the resulting economic adversity for someworkers is the unfortunate byproduct of a dynamic that one would neither want to norcould change. Given this view, the only appropriate remedy is to adapt to automation,primarily by upgrading workers’ skills and education and perhaps by providing a moreadequate safety net for workers temporarily displaced.
18
The skills narrative is the premier explanation of wage inequality that relies on theexistence of competitive labor markets and sees a role for policy only in fostering skillsdevelopment—not in boosting workers’ bargaining power or mandating changes incorporate practices. As such, the failure of the skills narrative to explain wage suppressionand wage inequality also reflects the failure of analyses based on equal bargaining powerbetween employers and employees and competitive labor markets to adequately addressone of the most salient features of the economy over the last four decades.
As examined in detail in Appendix A, skill-biased technological change has always been aweak explanation for the wage trends since 1979, but is a prima facie implausibleexplanation for the trends since the mid-1990s or since 1999. None of the basic indicatorsof automation’s impact and of skill deficits used to establish these narratives has beenevident over the last 25 years. Consequently, there is no basis for considering automation-driven skill-biased technological change as a significant factor in wage suppression or thegrowth of wage inequality since the mid-1990s—and we assign it an impact of zero since1995 in our analysis below.
The extreme weakness of the hypothesis is why the consensus, at least of center-lefteconomists, no longer highlights it in discussions of wage problems. Lawrence Summerswent so far as to say:
I am concerned that if we allow the idea to take hold that all we need to do is thereare all these jobs with skills and if we just can train people a bit then they will beable to get into them and the whole problem will go away. I think that isfundamentally an evasion of a profound social challenge. (Summers 2015, 75–76)
The following sections, drawing on Appendix A, offer some critiques of the skills narrative,focusing particularly on its inability to explain wage trends since the mid-1990s.
Omissions in the skills-based wage-gap storyOne problem with the automation narratives is that they ignore, or perhaps fail to address,important dimensions of wage suppression and wage inequality. For instance, theysidestep the superlative wage growth of the top 1% (and the top 0.1%) and thecorresponding upward shift of 6 percentage points of aggregate earnings to the top 1%between 1979 and 2019 (Mishel and Kandra 2020). The growth of wages for the top 1%primarily reflects the growth of executive compensation and the expansion of the financialsector (and its high earners). Similarly, the narratives accord no attention to the erosion oflabor’s share of income, and the data show that the link between automation and thedecline of labor’s share is at least as inconsistent with real-world data as is the linkbetween automation and wage inequality (Stansbury and Summers 2020). These aresubstantial oversights.
19
Evidentiary problems with the skills-gap, orautomation, hypothesisRecent research by the leading proponents of the skill-biased narrative (Autor, Goldin, andKatz 2020) demonstrates the failure of this hypothesis to contribute to our understandingof wage suppression since the mid-1990s. The three biggest evidentiary failures are thefollowing.
There has been little growth in the college wage premium
Autor, Goldin, and Katz (2020) note that “returns to a year of college rose by 6.5 logpoints, from 0.076 in 1980 to 0.126 in 2000 to 0.141 in 2017.” Yet note the slowdown fromthe 1980–2000 period to the 2000–2017 period. In the former period, the log collegewage premium rose 0.0325 percentage points each year, far faster than the 0.0088percentage point increase each year between 2000 and 2017. This represents a 70%reduction in growth. Given that the log 95/50 wage gap grew faster between 2000 and2019 than in 1979–2000 (see Appendix Figure A), it is evident that the education wagegap has not driven wage inequality in the top half since 2000.
There has been a sharp deceleration in automation-drivenrelative demand for college graduates since themid-1990s
The substantial deceleration in the college wage premium, even as the supply of collegegraduates slowed, implies a dramatic slowing in the growth of relative demand for collegegraduates. As Autor, Goldin, and Katz (2020) note:
[T]he model’s results…divulge a puzzling slowdown in the trend demand growth forcollege equivalents starting in the early 1990s. Rapid and disruptive technologicalchange from computerization, robots, and artificial intelligence is not to be foundthough the impact of these technologies may not be well captured by this two-factor setup.
Their results (based on Autor, Goldin, and Katz, Table A2) show a deceleration in growth ofrelative demand for college graduates in the 1999–2017 period relative to earlier periods:a 45.8% deceleration relative to the 1979–1999 period and a 41.8% deceleration relative tothe longer 1959–1999 period. The period since 1999, therefore, has been one featuring ahistorically small impact of automation on (relative) demand for college graduates.
Autor (2017) provides similar findings in an update of the Katz and Murphy (1992) metric ofrelative demand for college graduates and dates the slowdown to the mid-1990s.
If automation’s impact has been far less in the last 25 years than in earlier decades, itcannot explain the ongoing strong, even faster, growth of wage inequality in the top half,illustrated by the growth of the 95/50 wage gap.
20
There has been no expansion of the wage gap in thebottom half since 1987
In the skills-gap story, the more education workers have, the more they are in demand andthe higher their wages. Yet over the last three decades there have been no increases inthe wage gaps between those with some college, those with a high school diploma, andthose who left high school. Similarly, that the wage gap between median (50th percentile)workers and low-wage (10th percentile) workers has been stable or declining since 1987stands as a long-standing critique of the education wage-gap hypothesis (Mishel,Bernstein, and Schmitt 1997a; Card and DiNardo 2002; Acemoglu and Autor 2012).
Evidentiary problems with claims that‘occupational polarization’ of labor demand canexplain wage patternsAs mentioned earlier, a recent twist on the traditional story of skills-driven wage trends isthe idea of labor market “polarization.” In this view, labor demand has not been risingcommensurately with every level of education; rather, there has been an increase in labordemand for high-skill occupations but also for nonroutine manual occupations generallyassociated with low wages. The losers are those with routine, nonabstract skills that havetraditionally been associated with middle-wage occupations, such as in manufacturing.
There are two clear empirical problems with the polarization narrative as an explanationfor the wage trends over the full 1979–2019 period.
There has been no occupational employment polarizationsince 1999
Most strikingly, Autor (2010) and Acemoglu and Autor (2012) document that jobpolarization has not been evident since 1999:
[G]rowth of high-skill, high-wage occupations (those associated with abstract work)decelerated markedly in the 2000s, with no relative growth in the top two decilesof the occupational skill distribution during 1999 through 2007, and only a modestrecovery between 2007 and 2012. Stated plainly, the U-shaped growth ofoccupational employment came increasingly to resemble a downward ramp in the2000s. (Autor 2014)
A “downward ramp” and the absence of a “U-shaped growth of occupational employment”amount to an acknowledgment, although offered in a less-than-direct fashion, that jobpolarization was not present between 1999 and 2012.
21
Occupational employment patterns do not correspond towage patterns
The job polarization narrative relies on mapping occupational employment patterns toexplain wage trends. But surprisingly, the polarization literature has never presentedevidence that these occupational employment shifts directly affect wages. And indeed,they don’t. Mishel, Shierholz, and Schmitt (2013) show that in the 1980s, 1990s, and 2000s,changes in occupational employment shares (whether employment in an occupationexpands or contracts relative to other occupations) were not related to changes in relativewages by occupation (whether wages rose or fell in that occupation relative to wages ofother occupations). It is also worth noting that middle-wage occupations have shrunk andhigher-wage occupations have expanded since the 1950s, but median wages and wageinequality have risen and fallen over this time with no apparent correspondence toemployment polarization trends.
If occupational employment patterns do not directly correlate with occupational relativewages, then the narrative that employment polarization reflects a shift in the relativedemand for specific types of skills makes little sense; shifting relative labor demand curvesshould cause both employment and wages to move together. Moreover, if occupationaljob polarization does not shape relative occupational wages, then it is certainly not muchof an explanation for wage inequality.
A more convincing theory of sluggishwage growth and inequality in the U.S.:Policy-driven wage suppressionIf forces unrelated to policy decisions, particularly automation, do not seem to be drivingwage trends, what are the factors leading to wage suppression? Our answer is that therehas been an intentional policy assault—including policy forbearance in the face of newanti-worker business practices—that diminished the institutional sources of leverage andbargaining power for typical workers in the labor market. The point was to suppress laborcosts. This policy assault (acts of commission and omission, such as failing to update laborlaw or the value of the minimum wage) either directly undercut these institutional sourcesof power or accommodated employers’ efforts to undercut them. Business forces weresecure knowing that policymakers (legislators, executive branch officials, and judges)would not change legislation, enforcement priorities and effectiveness, or legalinterpretations to countermand this assault on a typical workers’ power in the labormarket.
Why this policy and corporate assault began when it did, and why it was successfulpolitically, are questions mostly outside the bounds of this paper. (See two relatively recentbooks by Hacker and Pierson (2011, 2020) for the political science explanations.) Amongacademic and policy economists starting in the 1970s, policies promoting wagesuppression were forwarded as the solution to decelerating productivity growth,
22
accelerating inflation, and high unemployment, where the goal was to improve aggregateefficiency and growth. But it did not work: Economic growth between 1979 and 1995 washistorically slow, and the brief pickup between 1995 and 2000 was driven by a burst ofbusiness spending to connect to the internet and the decision by the Federal Reserve toshunt aside inflation fears and allow unemployment to fall to historically low levels. Slowproductivity growth reasserted itself quickly in the 2000s as the burst of information-technology investment receded.
BOX B
Wage suppression and the upward distribution tothe top 1%
The data are clear that wage growth for the vast majority of U.S. workersdecelerated radically in the post-1979 era. This near-stagnation of wages cannotbe nearly fully explained by the slowdown in the economy’s overall ability to payhigher wages (measured, for example, by growth in economywide productivity).Overall economic growth did slow significantly post-1979, but growth for thebottom 90% of wage earners slowed far more. This pattern left a large excessavailable for the top 10% to grab, and most of it went to the top 1% and,especially, the top 0.1%. While this paper does not undertake to directly explainthe growth of wages at the very top—those of the top 0.1% and 1%—we wouldargue that this growth is just the mirror image of wage suppression at thebottom. The forces that weighed on wage growth for the majority (excessunemployment, stagnation of the minimum wage, deunionization) largely do notslow wage growth for the top 1%; instead, they just allow more income (income,wages, and profits that are not going to typical workers’ paychecks) to beclaimed by the very top. In a sense, the wage suppression felt by the bottom90% was zero-sum (or even negative sum), as their loss financed a sharpredistribution of wages and incomes to the very top.
As Bivens and Mishel (2013) argue:
The increase in the incomes and wages of the top 1% over the last threedecades should be interpreted as driven largely by the creation and/orredistribution of economic rents, and not simply as the outcome of well-functioning competitive markets rewarding skills or productivity based onmarginal differences. This rise in rents accruing to the top 1% could be theresult of increased opportunities for rent-shifting, increased incentives forrent-shifting, or a combination of both. Second, this rise in incomes at thevery top has been the primary impediment to having growth in livingstandards for low- and moderate-income households approach thegrowth rate of economywide productivity. Third, because this rise in topincomes is largely driven by rents, there is the potential for checking (or
23
even reversing) this rise through policy measures with little to no adverseimpact on overall economic growth.
As evidence for this view, Bivens and Mishel highlight the growth of chiefexecutive officer (and other executive) pay and the incomes of financial-sectorprofessionals. A vast body of research demonstrates that no plausible forcecoming from the interplay of competitive markets could account for the explosiveincome growth of these actors. These are not the “just deserts” of the highearners reflecting their heightened productivity.
The opinions of academic economists aside, the larger political dynamics of why thiswage-suppression campaign began and became a key priority for corporate and businessinterests in the 1970s are clearly important. Levy and Temin (2007), Bivens (2010), andMishel, Rhinehart, and Windham (2020) provide an overview of this period and documentthe concerted shift of the corporate sector away from the “Treaty of Detroit” regimeestablished in the early 1950s that tolerated (or even encouraged) collective bargainingand toward policies maximizing shareholder value and deregulation. The fallingprofitability of the corporate sector in the 1970s was clearly a part of this dynamic, as wasthe rising ease of moving production offshore.
While the root causes and the political support behind the policy assault on bargainingpower are not addressed here, a growing body of evidence shows that the specificpolicies launched in this attack can explain the overwhelming majority of wagesuppression experienced in recent decades. This section examines these policies andestimates the impact of each. When added together, as we do in the final section, theimpact is large enough to explain the lion’s share of the 43% difference since the late1970s between the growth of median hourly compensation and economywide productivity.
Austerity macroeconomic policy: ExcessiveunemploymentThe Federal Reserve Board’s dual mandate is to pursue the maximum level of employmentconsistent with stable inflation. However, since 1979 the Fed’s actions suggest that it tookthe inflation mandate more seriously, thereby tolerating (by failing to lower) or actuallygenerating excessive unemployment for extended periods in the name of keepinginflation tame. Whenever an economic expansion pushed unemployment down, the Fedoften feared that tighter labor markets would mean that workers, endowed with moreleverage since they were now in a better position to quit or strike, would demand highernominal wages, in turn putting upward pressure on inflation.
Wage growth resulting from tight labor markets can indeed feed into price growth, and sosufficiently empowered workers may demand even higher wages, allowing wage/inflationmomentum to build. The policy recourse for stopping the wage/price spiral hastraditionally relied on the Fed raising interest rates to slow the expansion and stop the
24

downward movement of unemployment.
Presumably in this policy vision there is a sweet spot where workers can experiencedecent wage growth without fostering unsustainable inflationary pressure. But nobodyknows for sure beforehand where that level is, and efforts to empirically identify theeconomy’s “natural rate of unemployment” are notoriously imprecise (Staiger, Stock, andWatson 1997). Given this uncertainty, the Fed must exercise judgment in weighing thebenefits of tighter labor markets against the risks of inflationary pressure. Too often in thepost-1979 period, Fed policymakers have been so worried about the inflation risks and notimpressed enough by the benefits of full employment that they have raised interest ratesprematurely and cut expansions short before they generated decent wage growth. Theresult has been unemployment higher than it had to be to ensure stable inflation.
Historically, the anti-inflation orientation of the Fed was quite political and conscious of theinstitutional determinants of wage growth. Specifically, past Fed chairs, determined tokeep wage growth “moderate,” explicitly saw the use of high unemployment as a means torestrain union-negotiated wage increases or even to seek union wage concessions.
Mitchell and Erickson (2005) characterized this policy orientation during the era of PaulVolcker’s chairmanship of the Fed (1979–1987), when there was a deep recession and asharp reduction in unionization (40% of the erosion of unions over the 1979–2017 periodoccurred in 1979–1984):
Volcker viewed affecting union wage determination through monetary restraint asimportant for the Fed’s disinflation campaign. One commentator characterized theFed chair’s view as founded on the idea that “inflation would not be securelydefeated…until all those workers and their unions agreed to accept less. If theywere not impressed by words, perhaps the liquidation of several million more jobswould convince them.” …Others at the Fed apparently had similar wage-push ideas.To Volcker, direct intervention in particular wage settlements was not desirable (andclearly not the province of the Fed). But a monetary squeeze that forced the unionsector to hold down nominal wages in the hopes of preserving jobs was anappropriate policy instrument. Squeeze the unions and other wages (and prices)would fall into line.
Hooper, Mishkin, and Sufi (2019, 25) note that “since the 1980s the Fed focused muchmore on avoiding labor market overheating in order to stabilize inflation.” The discussionin Appendix B provides a further analysis of the Federal Reserve policy that maintainedexcessive unemployment.
Bivens and Zipperer (2018), analyzing the links between excess unemployment and wagegrowth, note that full employment (at least by the too conservative measure of matchingactual unemployment to preexisting estimates of the “natural rate”) was the norm afterWorld War II but became the exception after 1979. Between 1949 and 1979, the cumulativedifference between the actual unemployment rate and estimates of the unemploymentrate consistent with stable inflation—the “natural rate” or the NAIRU, the nonacceleratinginflation rate of unemployment—was negative 15.3 percentage points, meaning that onaverage actual unemployment was 0.52 percentage points below the estimated NAIRU
25

each year. In contrast, between 1979 and 2017 the cumulative difference was positive 35.7percentage points, meaning that actual unemployment was persistently above theestimated natural rate. This trend was not driven only by the Great Recession: Between1979 and 2007 the cumulative difference was a positive 15.5 percentage points. Putanother way, unemployment was 1 percentage point higher each year in 1979–2007 thanin 1949–1979.
This consistent excess unemployment was deeply damaging to wage growth. Researchindicates that a 1 percentage point drop in unemployment results in annual wage growth0.5–1.5 percentage points faster for workers at the 10th percentile. For example, if annualreal wage growth is 1%, then a 1 percentage point fall in unemployment would result inannual real wage growth rising to 1.5% to 2.5%. For workers near the median of the wagedistribution, wage growth is faster by 0.4–0.9 percentage points, and for workers at the90th percentile it is 0.3–0.5 percentage points faster. These estimates indicate thatexcessive unemployment generates increases in both the 50/10 and 90/50 wage gaps.11
Using the lower bound of the Bivens and Zipperer estimates to assess the impact ofexcessive unemployment on median and 10th percentile wages in the 1979–2017 period,we find excessive unemployment had lowered the median hourly wage by 12.2%. Theseestimated impacts of unemployment are far below those of Katz and Krueger (1999, Table8), whose Phillips curve estimates using a 1973–1998 time series were double those ofBivens and Zipperer at the median and three times those at the 10th percentile.
However, to err on the side of caution we make an adjustment to our estimates of thewage impact of higher unemployment to account for the “flattening” of the Phillips curve inrecent years (a lessening of the relationship between unemployment and wage growth):We apply one impact for the 1979–2007 years and a lesser impact for the 2008–2017years.12 The coefficient on unemployment levels in regressions explaining wage growth isnotably smaller in the time period after 2008.13 It should be noted that, as Hooper, Mishkin,and Sufi (2019) found, the “wage-Phillips curve…flattened significantly less and retainedgreater nonlinearity” than the price Phillips curve. However, one should be clear what isdriving the flattening of the wage Phillips curves in the post-2008 period: the failure ofhigh unemployment to force actual reductions in nominal wages in just a small number ofyears (2008-2014, mostly), a finding highlighted in Bivens (2019). If one removes thissubset of years from the sample, the regression coefficient for the overall post-1979sample is far closer to what one obtains from running the regression over the period from1979 to 2007. It seems clear that this is the issue of “downward nominal wage rigiditybending the Phillips curve,” as expressed by Daly and Hobijin (2014). This implies that weare overcorrecting in our markdown of the impact of unemployment on wages post-2008;that is, we are understating the negative impact of high unemployment.
Taking this flattening of the Phillips curve into account we find that, if unemployment over1979–2017 had averaged just the “natural rate” of 5.5% rather than 6.3%, median wageswould have been 10.0% higher in 2017. If the unemployment rate had been held evenlower, say 5.0%, median wages would have been 18.3% higher by 2017.
About a fourth of this impact is the result of the corrosive effects of the extended period of
26
high unemployment following the Great Recession. In those years, the real culprit forkeeping labor markets too soft to generate decent wage growth was not the FederalReserve Board (the Fed actually tried hard to boost economic growth in those years).Instead, fiscal policymakers—both the Republican-led Congress and state and localgovernments after 2010—imposed historically contractionary degrees of spendingausterity.
As analyzed in the final section, excessive unemployment’s impact on the median wage of10.0% can explain nearly a fourth of the productivity–median compensation divergence of43.0% and is a sizable factor expanding the wage gaps in both the bottom and top halvesof the wage structure. For instance, excessive unemployment had a larger impact on low-wage workers, lowering the 10th percentile wage by 11.6% by 2017 and raising the 50/10wage gap by 2.7 percentage points. If our analysis uses 5.0% rather than 5.5% as the fullemployment target, then the 10th percentile wage would have been 21.2% higher in 2017absent excessive unemployment.
Because Black workers are disproportionately concentrated in the bottom half of the wagedistribution, the corrosive effect on wage growth of excess unemployment falls moreheavily on them. Wilson (2015) has found that the wage-depressing effect of eachadditional percentage point of unemployment is roughly twice as large for the medianBlack wage as for the median white wage. Wilson and Rodgers (2016) find that the wagepenalty for the median Black worker relative to the median white worker increased bynearly 9 percentage points between 1979 and 2014. This growth in the Black–white wagegap could be entirely explained by excessive unemployment over this period, given thediffering responsiveness of Black and white wages to unemployment.
Erosion of workers’ rights to form unions andbargain collectivelyThe erosion of collective bargaining has been a major factor that has depressed wagegrowth in the middle and drove the growth of wage inequality over the last four decades.In fact, the only factor having a larger impact is the excessive unemployment perpetratedby policymakers. The impact has been especially adverse for men because they were farmore likely to be unionized in 1979 than women (31.5% versus 18.8%), so men had more tolose from the subsequent attack on unions and collective bargaining.14
That collective bargaining leads to more equal wage outcomes was firmly established byresearch by Richard Freeman and James Medoff in the late 1970s and popularized in theirimportant book, What Do Unions Do?, published in 1984 (Jake Rosenfeld’s 2014 book,What Unions No Longer Do, provides an update of the issues). Consider first the ways thatcollective bargaining leads to more equal wage outcomes among unionized workers andin unionized industries and occupations.15 First, unions make wage differences betweenoccupations more equal because they give a larger wage boost to low- and middle-wageoccupations than to high-wage occupations. Second, unions have boosted wages for low-wage workers the most, and increases have been larger at the middle than at the highestwage levels, larger for Black and Hispanic workers than for white workers, and larger for
27

those with lower levels of education. This pattern of wage increases narrows wageinequalities. Third, unions make wages of workers with similar characteristics more equalin union settings because wages are “standardized,” meaning that wages are set forparticular types of work and do not vary across people doing the same work to the samedegree as exists in nonunion settings. Fourth, unions have historically been more likely toorganize middle-wage than high-wage workers, which lowers inequality by closing gapsbetween, say, blue-collar and white-collar workers.16 The union impact on inequality iseven greater with compensation than with wages alone (Pierce 1999).
Research from the early 1990s documented that the erosion of collective bargaining wasresponsible for around a fifth of the rise in wage inequality among men in the 1980s (Card1991; DiNardo, Fortin, and Lemieux 1996; Freeman 1991) but had a more modest impact onwomen’s wage inequality.
More recent research has incorporated an assessment of the impact of unions onnonunion workers’ wages—sometimes referred to as “spillover effects”—and finds a muchlarger impact. When the share of workers who are union members is relatively high, as itwas in 1979, wages of nonunion workers are higher. For example, had union densityremained at its 1979 level, weekly wages of nonunion men in the private sector wouldhave been 5% higher in 2013, equivalent to an additional $2,704 in earnings for year-round workers; among those same workers but without a college education wages wouldbe 8% higher, or $3,016 more per year (Rosenfeld, Denice, and Laird 2016; Denice andRosenfeld 2018).17 Consequently, estimates of the impact of eroded collective bargainingon wage inequality that incorporate union spillover impacts find a larger role of the impactof unions on wage inequality. For instance, Western and Rosenfeld (2011, Table 2 andanalyzed in Mishel et al. 2012, Table 4.38) find that the weakening of collective bargainingexplains a third of the increase in male wage inequality and a fifth of the rise of wageinequality among women over the 1973–2007 period. Such research demonstrates thatthe erosion of collective bargaining has been the largest single factor driving a wedgebetween middle- and high-wage male workers, which, as established above, is the maindimension of wage inequality that grew among men other than the soaring of earnings forthe top 1% (keep in mind that the wage gap between middle- and low-wage men has notgrown).
The most recent research provides a more up-to-date analysis that incorporates a spilloverimpact and provides additional insight because the results directly report on the impact oferoded collective bargaining on the wage gap between high-wage (90th percentile) andmiddle-wage (50th percentile) workers by gender. These results from Fortin, Lemieux, andLloyd (2021) are shown in Table 1.
The erosion of unions (column 3) can explain from 28.8% to 36.7% of the growth of malewage inequality as measured, respectively, by the standard deviation of log wages and theGini coefficient. The most salient finding is that eroded unionization explains 37.3% of thegrowth of the 90/50 wage gap over the 1979–2017 period. As discussed earlier, this is theonly source of growing wage inequality among men in the bottom 90% of earners. Fortin,Lemieux, and Lloyd (2021) show a smaller impact of eroded unions on women’s wageinequality; the erosion explains 6.7% to 8.8% of the growth of women’s wage inequality as
28
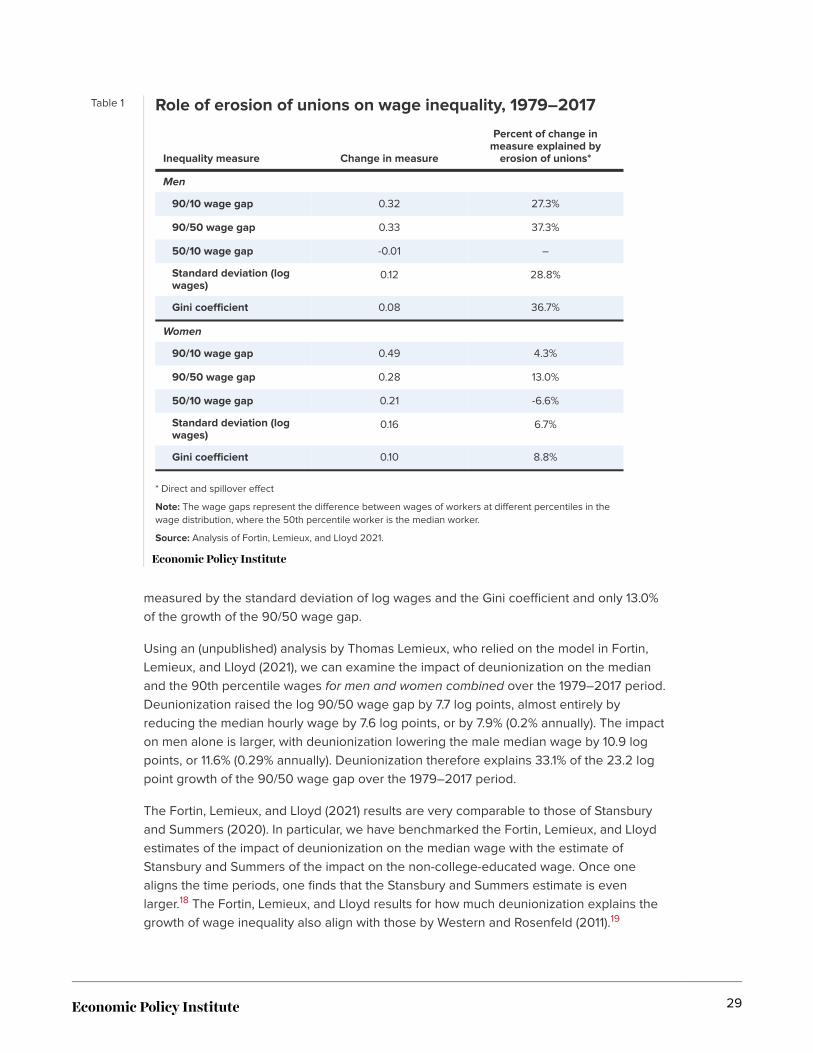
Table 1 Role of erosion of unions on wage inequality, 1979–2017
Inequality measure Change in measure
Percent of change inmeasure explained by
erosion of unions*
Men
90/10 wage gap 0.32 27.3%
90/50 wage gap 0.33 37.3%
50/10 wage gap -0.01 –
Standard deviation (logwages)
0.12 28.8%
Gini coefficient 0.08 36.7%
Women
90/10 wage gap 0.49 4.3%
90/50 wage gap 0.28 13.0%
50/10 wage gap 0.21 -6.6%
Standard deviation (logwages)
0.16 6.7%
Gini coefficient 0.10 8.8%
* Direct and spillover effect
Note: The wage gaps represent the difference between wages of workers at different percentiles in thewage distribution, where the 50th percentile worker is the median worker.
Source: Analysis of Fortin, Lemieux, and Lloyd 2021.
measured by the standard deviation of log wages and the Gini coefficient and only 13.0%of the growth of the 90/50 wage gap.
Using an (unpublished) analysis by Thomas Lemieux, who relied on the model in Fortin,Lemieux, and Lloyd (2021), we can examine the impact of deunionization on the medianand the 90th percentile wages for men and women combined over the 1979–2017 period.Deunionization raised the log 90/50 wage gap by 7.7 log points, almost entirely byreducing the median hourly wage by 7.6 log points, or by 7.9% (0.2% annually). The impacton men alone is larger, with deunionization lowering the male median wage by 10.9 logpoints, or 11.6% (0.29% annually). Deunionization therefore explains 33.1% of the 23.2 logpoint growth of the 90/50 wage gap over the 1979–2017 period.
The Fortin, Lemieux, and Lloyd (2021) results are very comparable to those of Stansburyand Summers (2020). In particular, we have benchmarked the Fortin, Lemieux, and Lloydestimates of the impact of deunionization on the median wage with the estimate ofStansbury and Summers of the impact on the non-college-educated wage. Once onealigns the time periods, one finds that the Stansbury and Summers estimate is evenlarger.18 The Fortin, Lemieux, and Lloyd results for how much deunionization explains thegrowth of wage inequality also align with those by Western and Rosenfeld (2011).19
29
Newly developed historical data from the early postwar period affirm that collectivebargaining was a strong force for greater equality of wages. For instance, Callaway andCollins (2017), using data from a survey of men living in Philadelphia; New Haven, Conn.;Chicago; St. Paul, Minn.; San Francisco; and Los Angeles in 1951, found “the [union] wagepremium was larger at the bottom of the income distribution than at the middle or higher,larger for African Americans than for whites, and larger for those with low levels ofeducation,” findings that are “consistent with the view that unions substantially narrowedurban wage inequality at mid-century.” It follows, of course, that the consequent erosion ofcollective bargaining would increase wage inequality and have the most adverse impacton nonwhite workers, those with the least education, and low- and moderate-wageworkers.
Likewise, Farber et al. (2021, 33), who developed data on union households from Gallupsurveys going back to 1936, find that “mid-century unions [were] a powerful force forequalizing the income distribution.” This happened because unions disproportionatelyrepresented “disadvantaged” workers (nonwhite or less educated), raised the wages oflow- and moderate-wage workers the most, and had a large, stable impact of raisingwages for union workers by roughly 15–20 log points over the last 80 years.20
Some pundits and analysts, skeptical about the impact of weaker unions on wages orwage inequality, claim that the decline of unions reflects a decline in worker interest inunions or is due to globalization and automation, i.e., endogenous factors. Neitherobjection is well founded.
Kochan et al. (2018) examined the level of interest in joining a union among unorganizedworkers and found that the “demand for unions” has risen substantially since the late1970s. Kochan and Kimball (2019) described these results as
differences in the percentage of non-union workers who indicated a preference forunion representation in nationally representative surveys in 1977, 1995, and 2017.Note that the 1977 and 1995 results were nearly identical: approximately one thirdof the non-union workforce indicated they would vote to have union representationif given an opportunity to do so on their current job. In 2017 that number increasedto 48 percent. This number translates into an under-representation of unions ofapproximately 58 million workers.
Mishel, Rhinehart, and Windham (2020) assess the endogeneity of union decline and findthat manufacturing employment decline can account for only a small part of it, perhaps15–20%. Ongoing automation of manufacturing and globalization surely contributed to theshrinkage of manufacturing employment and the loss of union jobs in manufacturing, butthe authors point out that the share of workers covered by collective bargaining declinedstrongly across the private sector in sectors not heavily affected by globalization, includingconstruction, transportation, communications, utilities, supermarkets, hotels, and mining.So, any focus limited to manufacturing will not capture the full picture. Moreover, theerosion of unions in manufacturing is not due only to automation and globalization.
An Organisation for Economic Co-operation and Development (OECD 2019b) analysis ofthe cross-country decline in collective bargaining across advanced nations found:
30

Contrary to a commonly held belief, the combined contributions of demographicchanges and structural shifts, such as the shrinking of the manufacturing sector, aresmall and leave most of this declining trend [in collective bargaining] unexplained.
This confirmed an earlier analysis by Schmitt and Mitukiewicz (2012) that: “The observedpatterns suggest that national politics are a more important determinant of recent trends inunionization than globalization or technological change.”
The primary reason that collective bargaining eroded was a concerted corporate attack onunions starting in the 1970s that exploited weaknesses in our labor laws to suppress theability of workers to choose collective bargaining and organize (Windham 2017). The scaleof union organizing collapsed, dramatically, in the 1970s as the share of nonagriculturalworkers in private-sector National Labor Relations Board elections fell from 1.0% to 1.2%each year in the 1950s and 1960s to just 0.3% each year in the 1980s and to 0.1% eachyear in the early 2000s (Mishel, Rhinehart, and Windham 2020). As Windham (2017)documents, this collapse of organizing was due to increased employer aggressivenessand use of both legal and illegal tactics, including captive audience meetings, threats ofshutdowns or relocation, firing of union organizers, use of a rapidly expanded group ofanti-union consultants, and process delays.
McNicholas et al. (2019), analyzing union representation elections that took place in2016–2017 and building on earlier work by Bronfenbrenner (2009), have recentlydocumented the pervasive lawlessness prevailing in union organizing attempts:
Employers are charged with violating federal law in 41.5% of all union electioncampaigns. And one out of five union election campaigns involves a charge that aworker was illegally fired for union activity. Employers are charged with makingthreats, engaging in surveillance activities, or harassing workers in nearly a third ofall union election campaigns.
Other developments, enabled by employer aggressiveness and changes in the rulesgoverning collective bargaining, limited collective bargaining power by eroding coverageand weakening unions’ ability to strike (Mishel, Rhinehart, and Windham, 2020).
Managing globalization on capital’s termsEvaluating the impact of globalization on wages has been controversial because it hasinevitably been intertwined with the politics of trade agreements. Some analysts contendthat globalization has a barely measurable impact, while others see it as an all-encompassing force shaping everything, limiting our ability to have higher wages orpursue regulatory or tax policies. In fact, globalization has indeed put substantialdownward pressure on wages for the vast majority, but its effects are likely not just drivenby the mechanical impacts it has on demand and supply curves for different types of laborin a competitive model. Instead, it is as likely that globalization has played a powerful rolein disempowering workers and giving capital owners and managers a much-improvedfallback position in their bargaining with workers.21 As such, the way that globalization hasproceeded from U.S. workers’ perspective has been profoundly shaped by intentional
31
policy decisions that maximized its wage-suppressing effects.
Bivens (2017a) presents a summary of globalization’s wage impacts, based on his owncalculations and on the wider economics literature. He finds:
The challenge of globalization for American workers is often painted as a problemof industrial workers losing their jobs to imports. Because manufacturingemployment is now a small share of overall employment, these trade-inducedlosses are often described as “small and concentrated”.… But this assessment ofthe situation is wrong—growing trade (particularly with poorer nations) actuallyinflicts losses on the majority of the American workforce.… [T]he big damage is thepermanent wage loss resulting from America’s new pattern of specialization thatrequires less labor and more capital. Further, this wage loss is not just suffered byworkers in tradeable goods sectors who are displaced by imports; it’s suffered byall workers who resemble these workers in terms of credentials and labor marketcharacteristics. A simple way to say this is that while landscapers may not bedisplaced by imports, their wages suffer from having to compete with apparel (andauto, and steel) workers who have been displaced by imports…. The wage-suppressing effects of globalization hit all workers without college degrees, acrossthe country. Workers of all races and ethnicities are affected, and communities ofcolor are disproportionately harmed. The harm of globalization is absolutely not aniche issue affecting only white working-class workers in the upper Midwest.
Globalization has contributed significantly to wage suppression. The first round of theacademic debate about trade and wages was spurred by debate over approval in 1993 ofthe North American Free Trade Agreement, and accordingly the debate relied largely ondata from the late 1980s or early 1990s. The majority view of economists coming out ofthis debate was that trade was not putting significant downward pressure on wages. Butthis view persisted even as the underlying reality changed significantly. For example,Bivens (2013) found that the implied wage effects of trade expanded rapidly after 1995, astrade with lower-wage nations (particularly Mexico and China) picked up significantly. Healso found that, by 2013, trade flows with low-wage nations were likely reducing wages forworkers without a four-year college degree by roughly 5.6%. For a non-college-degreedworker making the median hourly wage and working full time, full year, the earningsreduction translated into just under $2,000 annually.
This estimate is nearly identical to what Autor, Dorn, and Hanson (2013) found in aregression-based investigation of the wage impacts of imports from low-wage countries.Their results indicate that each $1,000 in imports per worker from low-wage countrieslower American wages by 0.7%. Imports from all low-wage countries in 2016 stood atroughly $8,000 per worker, implying a wage reduction of roughly 5.6%, or about $2,000annually, for a full-time worker earning the median wage.
Policy decisions have amplified globalization’s downward wage pressure. Much of theconventional wisdom among Washington policymakers has assumed that the tradeagreements signed in the past 20-odd years have been exercises in good-faithliberalization of trade and have greatly expanded access by the world’s poor to U.S.
32

markets. But this is not the right way to think about these agreements. Instead, theseagreements have been the result of corporate capture creating selective and regressiveprotectionism that has severely restricted the policy space of our trading partners.
Even globalization that was driven solely by changes in communications andtransportation technology and political change among our trading partners would havebeen likely to depress wage growth for the majority of American workers. But U.S. policyfailures significantly amplified these damaging effects, turning globalization from amanageable challenge into a deep economic wound for workers—and a political disasterfor the country. These policy failures include failing to secure any reasonablecompensation or countervailing domestic boost to bargaining power and leverage in labormarkets for those on the losing end of globalization; failing to address currencymisalignments that have led to large trade deficits and hemorrhaging employment inmanufacturing; and passing trade agreements that have consistently aimed to undercutworkers’ economic leverage while carving out ample protections for corporate profits. Thisunbalanced feature of trade agreements has encouraged U.S.-based employers tosubstitute imports for the production formerly made by U.S. workers, and thus their jobs.
Weakened labor standardsRecent decades have seen the steady weakening of a number of key labor standards thatonce provided leverage and bargaining power for workers to improve job quality. Therapid erosion of the federal minimum wage’s purchasing power is the most dramatic andmost consequential; others are the erosion of overtime protection for salaried workers,weaker labor-standards enforcement and rising wage theft, the increased share of theworkforce with no effective labor protections because of its immigration status, and moreextensive misclassification of workers as independent contractors.
Erosion of the federal minimum wage
The failure to update the value of the minimum wage in line with wage or productivitygrowth is a premier illustration of policy choices, made on behalf of capital owners andcorporate managers, that have had a huge impact on wage growth for low-wage workersand is the primary explanation for any growth in the wage gap between low- and middle-wage workers over the last four decades. Specifically, the failure to raise the federalminimum wage to an adequate level (defined for our purposes as $15 an hour by 2025)has lowered the wages of at least the bottom 22.2% of earners and a full 31.0% of earnersif one includes those benefitting from state and local minimum wage increases since2017.22
In 2019, the federal minimum wage of $7.25 was worth 16.3% less, after adjusting forinflation, than when it was last raised in 2009—the longest period of history without aminimum wage increase—and 25% below its peak inflation-adjusted value in 1968. Incontrast, productivity doubled (up 103.3%) and the average wage grew by 65% from 1968to 2019.23 Thus, the value of the minimum wage fell while the labor market became farmore capable of paying higher wages overall. This lag in the minimum wage occurred
33
despite low-wage workers being older (and therefore likelier to have greater workexperience) and significantly more educated than their counterparts in 1968 (Mishel 2014).
Another way of illustrating how low the minimum wage has fallen is by examining theimpact of raising the federal minimum wage to $15 in 2025, which represents a 79.0% realincrease24 over its current value and a 25.6% increase in purchasing power from the 1968peak. This is a substantial, bold increase from the current policy, yet still falls short ofupdating the minimum wage to correspond to the growth of average wages or productivity(projected in 2025 to be 119% greater than in 1968), and would barely make up for itsshortfall relative to median wages. Yet, increasing the minimum wage to $15 in 2025(Cooper 2019) would have a tremendous impact.
The growth of the minimum wage shapes the entire wage distribution of the bottom half,essentially setting the scale of the gap between the lowest-wage workers at the 10thpercentile and the wages at the median. In 1968, the federal minimum wage was equal toroughly half (52.8%) of the wage of the typical (median) U.S. full-time worker. In 2019, thatshare was less than a third (31.7%). An increase of the minimum wage to $15 in 2025 wouldreset it to 55.1% of the typical or median worker’s wage, restoring the wage standardachieved in 1968.25 This outcome implies that the declining value of the minimum wagemore than explains the increase in the 50/10 wage gap over the 1968–2019 (or1979–2019) time frame, and the rise to $15 in 2025 would totally reverse the increase inwage inequality in the bottom half, despite the modesty of the $15 proposal.
The work by Fortin, Lemieux, and Lloyd (2021), presented earlier in Table 1 (see the“changes in wage measure” column), provides further evidence. The 50/10 wage gapamong women grew by 21.2 (log) percentage points from 1979 to 2017, and three-fourths(73.6%) of that increase can be explained by the erosion of the inflation-adjusted value ofthe minimum wage. Among men there was essentially no increase in the 50/10 wage gap,which is not surprising since men’s wages at the bottom have been less affected by afalling or rising minimum wage.
Using (unpublished) analyses provided by Thomas Lemieux based on the Fortin, Lemieux,and Lloyd (2021) model, we can pinpoint the impact of the decline in the minimum wageon the 10th percentile wage and on the 50/10 wage gap for men and women combined(Table 2). Over the 1979–2017 period the fall in the real value of the minimum wage meantthat the 10th percentile wage fell 0.022 log percentage points instead of rising by 0.133 logpercentage points, a 0.155 log point impact of the failure to maintain the value of theminimum wage. The impact of the declining minimum wage threshold was comparably aslarge among both men and women at the 10th percentile. Breaking out the 1979–1988period shows that it was the dramatic fall in the minimum wage in the 1980s (a 0.179 logpoint decline in the 10th percentile wage) that explains the impact over the longer-term1979–2017 trend.
These results are echoed in the 50/10 wage gap. Among men and women combined the50/10 gap grew 0.091 log percentage points from 1979 to 2017 but would have fallen by0.047 log points had the minimum wage been maintained. The 50/10 wage gap’s increaseof 0.214 log points among women would have been just 0.060 log points absent the fall in
34

Table 2 Impact of declining minimum wage on 10th percentile wageand 50/10 wage gap, 1979–2017
Log changes in 10th percentile
Actual W/out min wage impact Min wage impact
1979–1988
Men -0.176 -0.040 -0.137
Women -0.207 -0.006 -0.201
All -0.194 -0.014 -0.179
1979–2017
Men -0.056 0.101 -0.156
Women -0.009 0.164 -0.173
All -0.022 0.133 -0.155
Log changes in 50/10 wage gap
Actual W/out min wage impact Min wage impact
1979–1988
Men 0.096 -0.035 0.130
Women 0.248 0.058 0.191
All 0.163 -0.008 0.171
1979–2017
Men -0.006 -0.156 0.150
Women 0.214 0.060 0.154
All 0.091 -0.047 0.138
Source: Computed from unpublished analyses provided by Thomas Lemieux using the same model inFortin, Lemieux, and Floyd (2021).
the minimum wage. Again, the results over the entire 1979–2017 period were driven by thedevelopments in the 1979–1988 period.
The timing and pattern of changes in the wage gap in the bottom half (the 50/10 wagegap) seems to be entirely explained by changes in minimum wage policy—the choice tonot maintain the real value let alone restore it to its 1968 peak. This can also be seen inFigure C above, where the growth of the 50/10 wage gap was limited to the 1979–1987period. The 50/10 wage gap has been stable or falling since the late 1980s as theminimum wage was raised moderately26 (in 1990–1991, 1996–1997, and 2007–2009) andperiods of persistent low unemployment boosted the lowest wages.
Other research confirms the major impact of the fall in the minimum wage on the
35
expansion of the wage gap in the bottom half. For instance, the analysis of Autor, Manning,and Smith (2010) in Mishel et al. (2012, Table 4.41) shows that the fall in the minimum wageexplains 65.5% of the 25 (log) percentage point increase in the 50/10 wage gap between1979 and 2009. The wage gap at the bottom half grew very little among men (as they arefar less likely to be affected by the minimum wage) over the 1979–2009 period, rising just5.3 (log) percentage points.
That analysis, however, understates the degree to which policy changes have adverselyaffected the earnings in the bottom half if the standard applied is restoring the real valueof the minimum wage to its 1979 value. Other reasonable counterfactuals would yieldsubstantially higher estimated effects of a lower minimum wage. For instance, one couldhold the ratio of the minimum to the median at its 1979 level or even benchmark to the1968 peak rate. Further, using the standard of the ratio of the minimum wage to themedian wage understates the impact of policy since the median itself was suppressed.That is, the minimum wage could be raised substantially more if median wage growth hadnot been suppressed. In this light, the fall of the median due to rising inequality of wagesand the falling labor share of income—what we estimate to be a 43% decline—alsoadversely affected low-wage earners. If, for example, the minimum wage had kept up witheconomywide productivity growth after its high-water mark of 1968 (as it roughly had forthe first 30 years of its existence), the federal minimum wage would be roughly $20 today.
The erosion of overtime protection among salariedworkers
To be exempt from the minimum wage and overtime protections of the Fair LaborStandards Act under the “white collar” rule, a worker must be paid a salary (i.e., not bepaid by the hour), must have bona fide “executive, administrative, or professional” duties(i.e., be an executive or a highly credentialed professional, or have supervisory duties), andearn above a specific salary threshold. Without a strong salary threshold, salaried workerswho spend only a small share of their time actually doing exempt/”professional” work canbe required to do hourly-worker-type duties (e.g., a store “manager” stocking shelves,unloading trucks, doing checkout at the cash register) for most of their worktime, includingthose beyond 40 hours in a week. Those hours beyond 40 are essentially unpaid.
The eroded share of the salaried workforce eligible for this overtime protection (i.e.,receiving 150% of regular hourly wages when working more than 40 hours a week) isanother example of a labor standard that was substantially weakened in the last fourdecades. The share of the salaried workforce automatically eligible for overtime based onits pay was whittled down from roughly half (49.6%) in 1975 to just 9.9% in 2014 (Kimballand Mishel 2016).
This issue gained prominence in the latter years of the Obama administration when theDepartment of Labor issued a rule that raised the annual salary threshold from $23,700 to$47,476 (an increase that still fell short of returning it to its 1975 level) (Department ofLabor 2016). The benefit to workers of receiving overtime protection is a combination ofhigher hourly and annual wages and more leisure (as overtime hours are scaled back by
36

employers when they are required to pay for them). The Department of Labor’s analysis(2016) of the 2016 rule showed that raising the salary threshold increased hourly wages by1.1%, 2.8%, and 1.4% for salaried workers directly affected by the rule who, respectively,occasionally worked overtime, who regularly worked overtime and were newly covered byovertime protections, and who regularly worked overtime and remained exempt.27
However, because these groups comprised only about 40% of the 4.2 million workersdirectly affected by the higher threshold, the overall impact would be to raise hourlywages of directly affected workers less than 1.0%.
A broader group, however, is affected by the salary threshold. The Department of Laborestimated that another 8.9 million workers would have had their “overtime protectionstrengthened in Year 1 because their status as overtime-eligible will be clear based on thesalary test alone without the need to examine their duties.” Eisenbrey and Mishel in twoanalyses (2015, 2016) presented evidence that much of this broader group had actuallyalready lost overtime protections due to court cases and changes in rules introduced inthe early 2000s and therefore would be directly affected by the new, higher salarythreshold.
The changes in overtime eligibility affected middle-wage workers but not low-wage orhigher-wage (90th percentile) workers. How much has the erosion since 1979 affectedmedian wages? This depends on the impact on hourly wages of those affected and theshare of middle-wage workers, say the middle fifth, affected by these overtime rules. Theimpact on the hourly wages of those affected by eroded protections would likely be about1%.28 But not all mid-level earners have been affected by changes in overtime protections.In 2017 there were 160 million wage and salary earners, so the middle fifth comprised 32million earners. As noted, the changes in the 2016 rule might have affected 13.5 millionworkers and, even if they all fell within the middle fifth, they would comprise only about42% of middle-wage earners. In fact, the workers affected by the lowered overtime salarythreshold fall between the 20th percentile and somewhat above the 60th percentile of theoverall wage distribution.29 One should add in those who would have been covered if the2016 rule had restored the 1979 salary threshold: That measure would increase the totalaffected by 22%.30 If one-third of middle-wage earners lost 1% of wages due to lostovertime protections, then the overall impact would be a 0.3% reduction of hourly wagesfor the middle fifth.
Wage theft and weaker enforcement of labor standards
Many workers, particularly low-wage workers and the women and men of color who aredisproportionately in this category, frequently fail to receive the wages they are owed.31
This is referred to as “wage theft” and reflects workers being paid below the minimumwage, not being paid for all hours worked, not being paid time-and-a-half though legallyeligible for overtime, experiencing illegal deductions from pay, and having their tips stolenby employers or supervisors. A recent example involved Amazon, which agreed to pay theFederal Trade Commission $61.7 million because it shorted its drivers tips over a two-and-a-half-year period starting in late 2016 (Greene 2021).
How extensive is wage theft? The available information shows the problem is pervasive.
37
The best analysis is from a 2008 study of 4,387 workers in low-wage industries inChicago, Los Angeles, and New York; it found that two-thirds of workers surveyedexperienced at least one pay-related violation in any given week. The average violationamounted to 15% of earnings (Bernhardt, Milkman, and Theodore 2009).
Another study (Cooper and Kroeger 2017) examined the wage theft affecting minimumwage workers in the 10 most populous states (accounting for more than half the nationalworkforce); it found that total wages stolen from workers due to minimum wage violationsalone exceeds $15 billion annually on a national basis. The average minimum wageviolation amounted to $64 per week or $3,300 per year for a year-round worker—nearly aquarter of the worker’s earned wages—and affected 17% of low-wage workers. Theauthors detail who was affected:
Young workers, women, people of color, and immigrant workers are more likelythan other workers to report being paid less than the minimum wage, but this isprimarily because they are also more likely than other workers to be in low-wagejobs. In general, low-wage workers experience minimum wage violations at highrates across demographic categories. In fact, the majority of workers with reportedwages below the minimum wage are over 25 and are native-born U.S. citizens,nearly half are white, more than a quarter have children, and just over half work fulltime.
A back-of-the-envelope estimate, extrapolating from the Bernhardt, Milkman, andTheodore (2009) study, suggests that by 2016 aggregate wage theft was on the order of$52 billion annually (McNicholas, Mokhiber, and Chaikof 2017). This estimate does notinclude the stealing of tips where the wage received is nevertheless the minimum orviolations of prevailing wage laws. This understated estimate of aggregate wage theft is,nonetheless, four times greater than the FBI’s $13 billion estimate of the total annual valueof all robberies, burglaries, larceny, and motor vehicle theft.
Other insights can be gleamed by identifying the amounts recovered in wage theft suitsand enforcement actions by the U.S. Department of Labor, by states, and through classaction settlements. McNicholas, Mokhiber, and Chaikof (2017) did so and found $880.3million in 2015 and $1.1 billion in 2016, for a total of $2 billion over both years. Thisestimate, according to the researchers, likely dramatically underrepresents the problem ofwage theft, since probably only a fraction of victims actually file government complaints orare involved in class action settlements.
Shierholz (2021) details the reasons for the prevalence of wage theft:
One reason is workers’ diminished bargaining power relative to their employers.The fact that this unlawful employer behavior is not being “competed away”underscores that, for a variety of reasons, workers do not have the ability to quitthese jobs as a de facto form of enforcement.
Another reason is that government resources devoted to combating violations ofworkplace protections are insufficient and have diminished. For instance, at the federallevel, Shierholz writes: “In 1978, there were 69,000 workers per wage and hour
38
investigator on average, but today that ratio is 175,000 to one.” The increased use offorced arbitration agreements, as detailed in a later section, has prevented workers fromholding their employers accountable both in court and in the private arbitrations they areforced to use (frequently without the ability to do so as a class). As Shierholz (2021) notes:
To underscore the importance of class-action lawsuits in our enforcementframework: in 2015 and 2016, the top 10 private wage and hour class-actionsettlements alone exceeded the combined total wages recovered by all state andfederal enforcement agencies. Forced arbitration with class and collective actionwaivers make it virtually impossible for low-wage workers to get any meaningfultype of remedy.
Last, declining unionization enables more wage theft to go unchallenged. In effect, nearlyevery option workers have of holding employers accountable for stealing their wages haseroded in recent years: There is less protection through government enforcement, weakeraccess to legal recourse, and far less union advocacy in workplaces.
How much does wage theft affect wages in the middle and at the bottom? We do not havean estimate of aggregate wage theft across the wage spectrum or for middle-wageworkers, so it is not possible to assess the impact of wage theft on the median wage.Among low-wage workers, Bernhardt, Milkman, and Theodore (2009) found that 68%experience wage theft violations averaging 14.95% of earnings. This translates into anaverage loss across all low-wage workers of 10.2%.32 Even this estimate omits certaintypes of wage theft, and we do not know how representative the study’s sample is of thenational low-wage workforce. Nevertheless, the Bernhardt, Milkman, and Theodore studyindicates that wage theft drains a substantial amount of low-wage workers’ earnings. Wealso do not know the extent of wage theft’s growth over the 1979–2017 period, thoughresearchers judge that there has been substantial growth. A speculative estimate is that ifwage theft has doubled to the 10.2% level implied by the Bernhardt, Milkman, andTheodore study, then it caused low-wage workers’ earnings to fall 5% over the 1979–2017period due to weaker wage standards enforcement, less access to legal recourse, anderoded unionization. For mid-level wages, theft of overtime pay, unpaid worktime, and theundercutting of prevailing wages likely also had an adverse impact.
Misclassifying employees as contractors
Employers in an array of industries have increasingly (and illegally) misclassifiedemployees as independent contractors or are paying workers “off-the-books.” Thispractice cheats workers of fringe benefits, social insurance protection (Social Security,unemployment insurance, workers’ compensation), labor protections (regarding safety/health and race, age, and gender discrimination), and union rights. The point of thismisclassification is to lower labor costs, and it undercuts labor standards and “underminesother, more responsible employers who face costs disadvantages arising from compliancewith labor standards and responsibilities” (Weil 2017).
It is difficult to quantify the extent of misclassification, since it is an illegal activity, and theextent to which it lowers wage and benefit costs. The fact that venture capitalists force this
39

model on gig economy upstarts provides practical confirmation that the business strategylowers labor costs and shifts risks to workers.33 Uber, a prominent example of a firmwhose business strategy is built on misclassifying rideshare drivers, acknowledged in itsregistration for an initial public offering (Uber 2019) that misclassification providessubstantial cost savings:
If, as a result of legislation or judicial decisions, we are required to classify Driversas employees (or as workers or quasi-employees where those statuses exist), wewould incur significant additional expenses for compensating Drivers, potentiallyincluding expenses associated with the application of wage and hour laws(including minimum wage, overtime, and meal and rest period requirements),employee benefits, social security contributions, taxes, and penalties.
David Weil, who has studied misclassification and has served as the administrator of theWage and Hour Division of the Department of Labor (which oversees this issue), hasnoted:
Week after week, it seemed, I was witness to an investigation from our districtoffices involving the incorrect classification of all types of workers: janitors, homehealth aides, drywall workers, cable installers, cooks, port truck drivers, and loadingdock workers in distribution centers. In one telling case, construction workers wenthome at the end of the week as employees only to be informed on the followingMonday that, perhaps by the magic of some unknown force, they had become“member/owners” of hundreds of limited liability companies, effectively strippingthem of federal and state job protections…. At the Department of Labor…we sawlong-standing practices of employment undermined as misclassification spreadquickly across sectors like restaurants, residential construction, and trucking andlogistics. (Weil 2017)
Indications are that the practice has greatly increased. The last comprehensive federalestimate of independent contractor misclassification, a General Accounting Office (GAO)examination of tax year 1984, “found that 15% of employers nationwide and acrossindustrial sectors engaged in misclassification of a total of 3.4 million workers” (Carré2015). There is no national estimate for recent years, but Carré’s review (2015) of stateaudits of unemployment compensation data across 21 states completed as of 2012showed that “the prevalence of misclassification ranges from 11% to 30% depending on themethod used by state unemployment insurance agencies to select companies for audits….[T]here is remarkable consistency in the prevalence of misclassification found acrossstates using similar audit methods.” Weil’s (2017) interpretation is that “anywhere from 10%to 20% of employers misclassify at least one employee.”
Industry analyses provide information, too, on the numbers of workers affected. Ormiston,Belman, and Erlich (2020) estimate that in construction “between 1.30 and 2.16 millionworkers were misclassified or working in cash-only arrangements in an average month of2017.” The major rideshare companies, whose business model incorporatesmisclassification, have between 1 million and 2 million drivers. Other online demand firmsalso rely on misclassification. A newspaper investigation by Locke and Ordonez (2014)
40

analyzing payroll records for government-backed construction housing projects across 28states found that “companies using stimulus money routinely snubbed labor law and theInternal Revenue Service by treating workers as independent contractors in a clearviolation of what’s allowed.” These companies “listed workers as contractors instead ofemployees in order to beat competitors and cut costs….Scofflaws can save 20% or more inlabor costs by treating employees as independent contractors.”
Misclassification is common in trucking. Following deregulation, large transport companies“sold their trucks to the drivers, then contracted with them on a per-load basis” (Bensman2009, cited in Carré 2015). Appel and Zabin (2019) summarize the history:
The trucking firm practice of contracting with drivers for their services became astandard strategy across many parts of the commercial trucking industry by themid-1990s. Contracting allows companies in many instances to shift responsibilityfor equipment to truck drivers, reduce payroll expenses such as employment taxesand employee fringe benefits, and retain the same effective control over thetransporting of loads. Some trucking firms transformed their business model afterderegulation entirely, becoming brokers by selling their trucks to former employeedrivers and leasing those drivers’ services on an exclusive basis….For twice asmuch measurable output today, long-haul truckers now make 40% less in wagesthan they did in the late 1970s, when trucking was considered highly desirable blue-collar work.
A series of articles in USA Today in 2017 focusing on port truck drivers, who haul goodsfrom ports to warehouses, found that
a good chunk of the port trucking industry relies heavily on a modern-day form ofindentured servitude. The abuse starts when a trucking company pressures itsdrivers to sign lease-to-own contracts on their tractor-trailer rigs. Often, thesedrivers speak little English and do not understand what they are getting into. Onceunder contract and in debt, these short-haul drivers are at the mercy of thecompanies they’ve signed on with. The truckers can work days on end withoutmaking enough to cover expenses the companies charge them. If they complain,they are fired or given less profitable routes.
Precise estimates of the impact of rising misclassification are not possible with availabledata, but one can speculate about a range of possible impacts. To gauge the impact weassume that the 3.4 million misclassified workers found by GAO in 1984 (4.4% ofnonagricultural wage and salary employment) have risen to 9.0 million (a 7.4% share), andthat misclassification lowers wages by either 15% or 30%. Further, we will assume thatmisclassification is either spread throughout the private nonagricultural wage and salaryworkforce or, more likely, targeted at the bottom two-thirds; in the former case the share ofmisclassified workers in total employment rises by 3.0 percentage points, while in thelatter case it rises by 4.5 percentage points. The impact is likely to have been on both low-wage and middle-wage workers. These parameters provide a range of impacts:Misclassification lowered wages by between 0.5% and 0.9% if applied across the wholeworkforce and between 0.7% and 1.4% if affecting and applied to only the bottom two-
41

thirds.34 If one included all workers, including those in the public sector, then theestimated impacts would be proportionally less. We take a 1% decline in the median wageas our ballpark estimate.
Immigration policy that creates ‘labor standard free zones’
Employers have increasingly hijacked immigration policy to create zones in the labormarket where workers’ ability to obtain enforceable basic labor standards is compromisedby their immigration status. Note that the issue is not just the presence, or supply, ofimmigrants, but the legal situation that makes undocumented workers exploitable. In oureconomy, if you can be exploited, you will be. This exploitation of a sizable share of theworkforce lowers the wages of migrants as well as those of the workers in theiroccupations and industries.
Costa (2019) has examined this issue and argues:
[I]n certain local labor markets and industries where a significant share of workersare migrants who do not have access to worker protections and basic laborrights—either because they are unauthorized immigrant workers or because theyare migrants employed through nonimmigrant, temporary work visa programs (i.e.,“guestworkers”)—the migrant workers’ lack of rights makes it difficult for them tobargain effectively for decent wages, and their weak leverage spills over toundercut the leverage of U.S. workers—i.e., citizens and immigrants who are lawfulpermanent residents.
Unauthorized immigrants comprise nearly 5% of the U.S. labor force, and these nearly 8million workers (Krogstad, Passel, and Cohn 2019) are not fully protected by U.S. laborlaws because of their precarious immigration status.35
As of 2013 approximately 1.4 million guestworkers were employed through temporarywork visa programs, and they accounted for roughly 1% of the labor force (Costa andRosenbaum 2017); the Organisation for Economic Co-operation and Development recentlyestimated that 1.6 million full-time equivalent jobs in the U.S. were filled by guestworkers in2017 (OECD 2019a).36 Although they are legally authorized to work, guestworkers areamong the most exploited laborers in the U.S. workforce because the employmentrelationship created by the visa programs leaves workers powerless to defend and upholdtheir rights.
Combining the estimates of unauthorized immigrants and guestworkers means that 6% ofthe workforce is vulnerable to exploitation due to its legal status. The presence of theseexploitable migrants is greatest in various service industries—hospitality, restaurants—aswell as in construction and agriculture. But there is also evidence that skilled, college-educated guestworkers are underpaid and have been subjected to financial bondage andeven human trafficking (Costa and Hira 2020; Smith, Gollan, and Sambamurthy 2014;Stockman 2013). Costa and Rosenbaum (2017) estimate that there were roughly 800,000skilled guestworkers employed in the United States in 2013.
42
Wage theft is a common form of exploitation of migrants, and estimates are that it occursto an extreme degree. As Costa (2019) notes:
The exploitation described here is not theoretical. A landmark study and survey of4,300 workers in three major cities (Bernhardt et al. 2009) found that 37.1% ofunauthorized immigrant workers were victims of minimum wage violations, ascompared with 15.6% of U.S.-born citizens. Further, an astounding 84.9% ofunauthorized immigrants were not paid the overtime wages they worked for andwere legally entitled to.
Research by Apgar (2015) comparing the wages of comparable migrant Mexican workerswho were undocumented, had legal permanent resident status, or were temporaryguestworkers in the H-2A and H-2B visa programs,37 found that unauthorized workersearned about 13% less than legal permanent residents; temporary foreign workers (i.e.,guestworkers) earned about 11% less than legal permanent residents, and their wages didnot significantly differ from unauthorized workers’ wages.
Apgar concluded: “Wage gaps suggest that employers use fear of deportation to paylower wages—not just to unauthorized immigrant workers but to temporary foreignworkers as well.”
The presence of exploitable migrant workers therefore undercuts labor standards inimmigrant-intensive occupations and industries and thereby depresses wages andbenefits of nonmigrants. This exploitation is likely to affect wages in the bottom twodeciles more than those at the mid-level, although there are probably some impacts in themiddle and further up the scale, where technology-sector guestworkers depress laborstandards.
While there is not a deep economic literature that quantifies this type of spillover effect,much qualitative and historical research highlights that it is exactly the intent of manyemployers in expanding the pool of workers in the U.S. who lack basic worker rightsbecause of their immigration status. Nevertheless, the conscious policy decisions to allowthese circumstances clearly contribute to wage suppression.
Failures to police or check new forms ofemployment ‘contracts’Employers are increasingly requiring employees to relinquish various rights when theyaccept employment or even after they are already employed. Noncompete and forcedarbitration agreements are chief among these restrictions, and employers within variousfranchise chains also collude against employees through anti-poaching agreements. All ofthese agreements limit workers’ options by limiting access to courts and the ability toreadily find another job or even to know the basic terms of their employment arrangement.This works to suppress wages.
43
Noncompete agreements
Employers have increasingly required employees to sign noncompete agreements, whichlimit options for future employment and are now widespread. The practice suppressesworker mobility and suppresses wages, and it depresses firm entry and dynamismbecause employees are prohibited from starting their own firms.
This section draws heavily on the Federal Trade Commission testimony of Evan Starr(2020) and Starr’s recent review (2019b) of the evidence on noncompete agreements.John Lettieri’s recent American Enterprise Institute study provides an additional usefulanalysis.
An example of a noncompete agreement is the one Amazon requires its employees tosign (Woodman 2015):
During employment and for 18 months after the Separation Date, Employee will not,directly or indirectly, whether on Employee’s own behalf or on behalf of any otherentity (for example, as an employee, agent, partner, or consultant), engage in orsupport the development, manufacture, marketing, or sale of any product or servicethat competes or is intended to compete with any product or service sold, offered,or otherwise provided by Amazon (or intended to be sold, offered, or otherwiseprovided by Amazon in the future) that Employee worked on or supported, or aboutwhich Employee obtained or received Confidential Information.
This is a remarkable agreement for the breadth of its scope (Amazon sells a wide array ofgoods) and for the fact that it applies to low-wage warehouse workers, even seasonalones, and that Amazon is one of America’s largest private-sector employers.
How widespread are noncompete agreements? According to a national survey of private-sector American business establishments with 50 or more employees in 2017 (Colvin andShierholz 2019), “roughly half, 49.4%, of responding establishments indicated that at leastsome employees in their establishment were required to enter into a noncompeteagreement. Nearly a third, 31.8%, of responding establishments indicated that allemployees in their establishment were required to enter into a noncompete agreement,regardless of pay or job duties.” The researchers estimate that “somewhere between27.8% and 46.5% of private-sector workers are subject to noncompetes.”
These data indicate that noncompetes have grown in their use since a survey (Starr,Prescott, and Bishara 2020) of employees in 2014 showed just 18% of the U.S. workforcecovered by them, though 38% were subject to one at some point in their careers. Theprecise extent of the increased incidence of noncompetes is uncertain, however: TheColvin and Shierholz employer-based survey probably captures more noncompete usethan the earlier employee-based survey, since many employees are unaware of havingsigned a noncompete agreement.
Noncompetes are intensively used in establishments with high pay or high levels ofeducation, but they are also common in those with low pay and low education credentials.The 2014 employee survey found that 53% of those covered by noncompetes were paid
44
by the hour and had median earnings around $14 an hour; 33% of the surveyed workersearning under $40,000 reported signing a noncompete agreement during their careers.
Job-to-job mobility is critical for earnings growth—employers don’t have to pay as much ifthey know workers don’t have good outside options—and so noncompetes, especiallyenforceable ones (not every state allows their enforcement) can be expected to lowerwages. Some workers will be pushed to industries in which they are paid less. There isevidence that employers require employees to sign noncompete agreements even instates where they are not enforceable and that even in those states the agreementshamper wage growth and mobility.38
The contrary view is that noncompetes must be advantageous to employees or theywould not have signed them. This “freedom of contract” paradigm presumes employeesand employers have equal power and options in a competitive labor market. Lettieri(2020) rejects the freedom of contract interpretation:
The vast majority of noncompete agreements are not subject to any negotiationbetween the employer and employee, suggesting that the employee is unlikely toreceive any benefits in return for their signature. A large share of these agreementsare presented for signature only after the employee has already accepted the joboffer—often on the first day of work. Employers frequently exploit workers’ lack ofknowledge and resources when crafting noncompetes. For example, employerscommonly request that workers sign noncompetes even in states where they arecompletely unenforceable—and workers nevertheless sign the agreementsassuming they are valid. Likewise, employers often craft extremely broad provisionsknowing that employees generally lack both an understanding of what isenforceable and the wherewithal to challenge the terms in court.
In fact, Starr (2019b) reports that “less than 10% of workers reported negotiating over non-competes”; 83% of affected workers simply read and signed the contract. “When you askworkers, what did you—what were you promised in exchange for signing a non-compete,86% of them say nothing, and roughly a third of non-competes were delayed until after theworker accepted the job without any change in responsibilities or a promotion.”
Starr (2019b), assessing studies examining the relationship between noncompeteenforceability and wages, found:
[W]orkers in states that enforce non-competes earn less than equivalent workers instates that do not enforce non-competes. One recent study finds that the Hawaiiban on noncompetes for technology workers increased new-hire wages by 4%. Thesame study also documents that technology workers who start jobs in an averageenforceability state have 5% lower wages even eight years later relative toequivalent workers in non-enforcing states. Another two studies looking at broadersegments of the labor market document that the negative wage effects of non-compete enforceability are generally borne by those with less education.
Simply put, noncompetes lower wages and mobility for both technical and low-wageworkers, whether they reside in states where the contracts are enforceable or in those,
45

such as California, where they are not. Moreover, “where non-competes are reallycommon and highly enforced, the whole labor market suffers” (Starr 2019b), as wages, jobmobility, and job satisfaction decline even among those not directly affected.
In his testimony to the Federal Trade Commission, Starr (2020) noted that noncompetesare frequently accompanied by other restrictive agreements, such as nondisclosure,nonsolicitation of clients, nonsolicitation of co-workers, intellectual property assignment(giving the firm ownership of any intellectual property created on the job), and forcedarbitration. That noncompetes are included in this cluster of agreements provides furtherevidence that their purpose is to restrict employee options rather than to protect beneficialinvestments in and information held by employees. Colvin and Shierholz (2019) also find astrong correlation between the presence of noncompete and forced arbitrationagreements.
What is the impact of increased use of noncompete agreements on median wages, lowwages, and various wage gaps? The best evidence regarding noncompetes and wagelevels is the Lipsitz and Starr (2020) examination of the relationship between Oregon’s2008 ban on noncompetes for low-wage workers and the average hourly wages of hourlypaid workers. The finding that the ban raised wages for hourly workers by 2.2% to 3.1%reflects the impact on those directly affected (about 14% of hourly workers are subject tononcompetes) and the spillover effects on other comparable workers. It is important tonote that these results are for hourly, not all, workers, and hourly workers comprised 67%of Oregon earners. Two indications in the Lipsitz and Starr research provide clues to theimpact on the median worker. One is that the ban’s impact was comparable across the20th to 80th wage percentiles of hourly workers, suggesting that the impact on themedian would be comparable to the 2–3% average effect (if hourly workers comprise thebottom 67% of earners, then the overall median is the 75th percentile of hourly workers).On the other hand, Lipsitz and Starr report that the impact of the noncompete ban washigher for two occupation groups with wage levels close to the overall median: Inconstruction occupations and installation, maintenance, and repair occupations wagesrose by 4.9% and 4.3%, respectively.39 The ban’s impact on wages in constructionoccupations occurred even though the incidence of noncompetes in construction wasbelow average.40 The ban had basically no effect on a low-wage occupation, food servicepreparation. These differences across occupations reflect both the incidence and directimpact of noncompetes. In sum, these results suggest that the impact of noncompetes onthe median is in the 4.3% to 4.9% range, there is little if any impact for the lowest-paidworkers, and noncompetes actually narrow the wage gap (50/10) in the bottom half bydepressing the median wage but not affecting the lowest-wage workers.
Another study, Johnson, Lavetti, and Lipsitz (2020), analyzed how the legal enforceabilityof noncompetes affects wages and labor market mobility. Using a newly constructedstate–year panel of noncompete enforceability spanning 1991 to 2014, the authors foundthat enforceability of noncompetes leads to a decline in workers’ earnings and mobilityand increases racial and gender wage gaps (“the earnings effect among women and blackworkers is twice as large as the effect among white men”). They estimate that averageearnings would increase by 8.5% nationally if noncompetes were made unenforceable. Wedo not draw on these results for our assessment of noncompetes on the median wage, but
46
the 4.3% to 4.9% range we do rely on is far below that of these results. Johnson, Lavetti,and Lipsitz also show that noncompetes lower the wages of college-educated workersmore than non-college-educated workers, suggesting that noncompetes narrow the 90/50wage gap, especially since there is a greater incidence of noncompetes among college-educated workers (25% compared to the average incidence of 18%, according to Starr,Prescott, and Bishara 2020, Figure 3). Elimination of noncompetes would also drain thebusiness profits that accrue to upper-income households, so the overall impact ofeliminating them or scaling back their use and enforceability on overall income inequalityis uncertain.
Assessing the impact of the increased use of noncompetes on median wage growth since1979 requires quantifying that increased use. Unfortunately, there is no historical series onnoncompete incidence. The agreements have been used for many years, especiallyamong higher-wage professionals and executives, and use has increased as evidenced bythe increased public and policymaker attention to the agreements, particularly for middle-wage or lower-wage (e.g., Jimmy John’s sandwich shop workers) workers. If, say, theincidence among hourly workers has doubled since 1979 and the wage impact is roughly4.5% in recent years, then noncompetes have lowered the median wage by about 2.25%.The impact might be lower if we base the assessment on the 2.2% to 3.1% overall wageeffect identified by Lipsitz and Starr (2020) or if the rise in incidence is less than double. Itseems equally plausible to us, however, that “doubling” is an underestimate, since weknow the incidence of forced arbitration agreements has enormously increased since theearly 1990s (from 2% in 1992 to more than 50% in 2017), and firms insisting on forcedarbitration also tend to insist on noncompetition agreements. So, we take the 2.25%impact on median wage growth as a rough estimate.
Forced arbitration and class action waivers
Employers increasingly requiring their workers to sign arbitration agreements is anotherclear example of policy decisions, this time from court decisions starting in 1991, limitingworkers’ options to resist workplace exploitation and contributing to wage suppressionand inequalities. As noted above, forced arbitration is among a suite of agreements beingforced on workers as a condition of employment (Colvin and Shierholz 2019). This trendaccompanies the weaker enforcement of labor standards and workplace civil rights bypublic authorities, as discussed in the wage theft section. Forced arbitration suppressesclaims, makes them less likely to succeed, and reduces awards. The consequence is theundermining of the enforcement of employment rights ranging from minimum wage andovertime pay to rights to equal pay and freedom from discrimination or harassment basedon race, gender, or religion (see Stone and Colvin 2015, Colvin 2018, and Deutsch et al.2019).
The incidence of forced arbitration agreements took off after key Supreme Court decisionsin 1991 and 2001 made clear “that an American employer may, with near total impunity,require an employee, as a condition of hiring and continued employment, to use privatearbitration as the means of resolving public claims against the employer that involve astatutorily protected right” (Lipsky 2007). In 1992, just over 2% of the workforce was
47
covered by forced arbitration agreements, but that share rose to almost a quarter by theearly 2000s. By 2017 the share was 56.2% (Colvin 2018).
Of the employers who mandate arbitration, some 30.1% also mandate class action waivers,meaning that besides losing the right to file a lawsuit on their own behalf employees alsocannot pursue even their private arbitrations through collective legal action. Colvin (2018)found that “23.1 percent of private-sector nonunion employees, or 24.7 million Americanworkers, no longer have the right to bring a class action claim if their employment rightshave been violated.” Individual lawsuits are often unrealistic for low-wage and evenmiddle-income workers because the cost of legal representation may exceed their lostwages. In contrast, class and collective actions allow workers to aggregate claims, makinglitigation cost-effective (Deutsch et al. 2019). The Supreme Court’s 2018 Epic Systems v.Lewis decision held that employers can require employees to give up their right to sueeither as an individual or on a collective basis, a development expected to lead to a furthersurge in the incidence of mandatory individual and class forced arbitration agreements.
Mandatory arbitration agreements are required across the wage spectrum but have thehighest incidence among low-wage workers: Workplaces paying less than $13 per hourmandated arbitration 64.5% of the time, while those with higher wages did so 48–54% ofthe time (Colvin 2018, Table 4). The largest employers mandate arbitration most often:Those with at least 5,000 employees mandate it 67.7% of the time, while employers withfewer than 500 employees do so 49% of the time (Colvin 2018, Table 1).
There’s a catch-22 to the mandatory arbitration scheme, as illustrated by this example(Deutsch et al. 2019):
Low-wage employers like Chipotle have demonstrated that they never intendedarbitration to be a viable alternative to class-action litigation. After being sued forsystemic wage theft, Chipotle forced workers to sign arbitration clauses to preventthem from joining the suit. Then when individual workers filed for arbitration,Chipotle blocked the arbitrations from proceeding by refusing to pay its share ofthe fees.
It is not possible to assess the wage impact of the spread of forced arbitrationagreements. The practice is intended to and does undermine the enforcement ofemployment and civil rights workplace protections, further limiting employee options toresist employer exploitation.
Has any harm done by forced arbitration agreements been offset by the gains made byworkers in agreeing to such terms? The majority opinion in Epic Systems asked, “Shouldemployees and employers be allowed to agree that any disputes between them will beresolved through one-on-one arbitration?” and assumed that when employers andemployees have a “freedom” to contract they will both obtain optimal outcomes. JusticeGinsburg in her dissent noted the incongruity of such a claim given that these forcedarbitrations were imposed on already-employed workers given “a Hobson’s choice: acceptarbitration on their employer’s terms or give up their jobs.” Justice Ginsburg asked:
Were the “agreements” genuinely bilateral? Petitioner Epic Systems Corporation e-
48
mailed its employees an arbitration agreement requiring resolution of wage andhours claims by individual arbitration. The agreement provided that if theemployees “continue[d] to work at Epic,” they would “be deemed to have acceptedth[e] Agreement.” Ernst & Young similarly e-mailed its employees an arbitrationagreement, which stated that the employees’ continued employment wouldindicate their assent to the agreement’s terms.
Employer collusion and anti-poaching agreements
Do employers collude to suppress pay and restrict competition in the labor market? AdamSmith is often cited as recognizing extensive collusion, writing that employers “are alwaysand everywhere in a sort of tacit, but constant and uniform combination, not to raise thewages of labour above their actual rate.” This behavior cannot be readily studied since, asSmith also said, “We seldom, indeed, hear of this combination, because it is the usual, andone may say, the natural state of things, which nobody ever hears of” (quoted in Kruegerand Ashenfelter 2018). A remarkable case of collusion did come to light in recent yearswhen a class action civil suit on behalf of more than 64,000 software engineers and otheremployees of Apple, Google, Adobe, Intel, Intuit, Pixar, and Lucasfilm was settled in 2015for half a billion dollars.
We do not know the extent of collusion among employers and how it has changed overtime. It is, after all, illegal. There is research on explicit collusion in franchising, however,because this is a gray area in the law.41 Krueger and Ashenfelter (2018) report on anti-poaching agreements in franchises, agreements that limit a particular franchise ofMcDonald’s, for instance, from hiring a worker from another McDonald’s franchise. To beclear, this type of agreement differs from a noncompete, where employers limit a worker’soptions. An anti-poaching agreement is a direct collusion among employers not to recruitworkers from each other.
In discussing their findings, Krueger (2018) noted:
58 percent of franchise companies have a no-poaching clause that prevents orrestricts the ability of one franchisee in a chain from hiring workers employed byother franchisees. This is up from 36 percent in 1996. The practice is particularlycommon in fast food chains. We find that 80 percent of the 40 largest Quick ServiceRestaurant franchise chains have a no-poaching requirement. Since the humancapital would remain within the chain, there is little business justification for such aclause other than to restrict worker mobility and opportunities.
No-poaching agreements are more common in low-wage and high-turnover industries(Krueger and Ashenfelter 2018).
Krueger and Ashenfelter (2018) provide a quantitative example to illustrate the impact ofno-poaching agreements to facilitate employer market power over workers withinfranchise chains. In Rhode Island, for instance, instead of 261 employers competing forQuick Service Restaurant workers, anti-poaching agreements effectively limit thecompetition to just six.
49

Of course, employers do not have to pay as much when workers have fewer options.Unfortunately, there is no systematic evidence of no-poaching agreements’ impact onworkers’ pay and within-franchise job mobility. We do know that these agreements grewsubstantially over the 1996–2016 period, however, and disproportionately affect workers inlow-wage industries and “potentially affect a large number of workers” (Krueger andAshenfelter 2018).
Tolerating new business structures thatdisempower workersIn recent decades, employers have increasingly tried to build up concentrated power inproduct markets (as well as labor markets directly) and to leverage this increased productmarket power to augment their profitability and the pay of executives by lowering costsand suppressing wages. One mechanism has been to match market concentration withefforts to outsource key parts of their production or workforce to keep those costs frommaking a claim on the firm’s income. In past years, policymakers might have used industryregulation such as in airlines and trucking and antitrust enforcement to keep thesechanges in check. But in recent decades, the pushback against these changes in businessstructure has been rare and muted.
Fissuring: contracting out/outsourcing, temping, andfranchising
Perhaps the most pronounced way that employers have attempted to shape labor marketoutcomes to their advantage through changes in business structure is the “fissuring” ofworkplaces. David Weil’s book, The Fissured Workplace (2014), as well as analyses byAppelbaum and Batt (2014), provide the details about what fissuring is and how it works tothe advantage of employers.
In fissuring, Weil explains, companies seek to focus on the tasks that provide the greatestreturn while shedding those that are harder to reap extra-normal returns from. The “leadbusiness” maintains tight control of the outcomes of the tasks it sheds by carefulmonitoring of the spun-off or contracted supplier firms. A classic example is universities:Many once hired employees directly to run student services like cafeterias, but they nowhire outside firms instead. In retailing, detailed mechanisms of monitoring and control existbetween the lead firm and contracted firms, including franchising agreements, supplychain monitoring mechanisms, and increasingly sophisticated software algorithms.Essentially, lead firms insist on a high degree of control over much of the contracted firms’output, but abdicate any responsibility for the contracted firms’ employment conditions.
Weil points out that fissuring should be distinguished from contingent work or alternativework arrangements. “Fissured workplace arrangements can exist even thoughemployment itself might be traditional (that is, ongoing and full time) when the worker isemployed by a subcontractor, franchisee, or other business organization undertaking thework of a lead business.” In fact, as discussed below, traditional employment
50

arrangements dominate the fissured workplace, and the increase in fissuring, as best aswe can surmise, has primarily occurred through subcontracting to firms still usingtraditional employment arrangements. In short, most of the “fissured economy” does notreflect independent contractors, the gig economy, or other forms of contingent work.
Fissuring is a corporate strategy that emerged from the focus on shareholder value. Itraises profits in part by squeezing the costs of subcontractors, who in turn cut wages, andshifting risks onto other firms and workers. Further, fissuring allows workers who may haveonce benefited from firm-specific economic rents to be cast out of the firm and forced todo the same work at a contracted firm that does not have access to these rents. In a realsense, part of the rationale for fissuring is to hire contracting firms to do the dirty work ofcutting pay for workers who were once in the lead firm but who happened to not beperforming tasks where rents could be extracted. Fissuring also redistributes profits fromcontractors to the lead firms. It does not reflect a new way of producing goods andservices but rather a rearranging of the business hierarchy in which particular workplacesfit (Appelbaum and Batt 2014). As such, fissuring probably has no impact on aggregateproductivity, or on making the production of goods and services more efficient. Instead, itseffects are overwhelmingly distributional. Fissuring also does not reflect technologicalchange in how goods and services are produced. Technology does, though, play a role inthat communications and other connectivity better enable firms to monitor dispersedeconomic activity and the fulfillment of standards.42
Appelbaum and Batt (2014) argue that political and institutional factors have also enabledfissuring:
[F]inancial market deregulation gave investors and stockholders more power topressure firms to maximize shareholder value, and the lax enforcement of laborlaws and the decline of union power freed them from prior constraints to do so.
So, fissuring and domestic outsourcing should be interpreted is a business strategy choiceand not a beneficial “market force” that satisfies consumer preferences or adapts tonewfound abilities to improve efficiency.
Weil’s (2019) estimates show the fissured economy to be substantial:
[C]lose to 19 percent of the private-sector workforce were in industries wherefissured arrangements predominate…prevalence could easily double, the presenceof fissuring in one workplace spills over to the wage-setting decisions of otherbusinesses and to the labor markets in which they compete for workers.
But estimating the size of the fissured economy is a major challenge researchers are onlynow undertaking. However, it seems clear that somewhere between a fifth and a third ofthe economy is characterized by fissuring as a dominant force. Moreover, where fissuringis present it can be extensive, as witnessed by the fact that “about half of Google’sworkers are contractors who don’t receive the same benefits as direct employees”(Bergen and Eidelson 2018).
For fissuring to contribute to wage suppression in recent decades it would have to have
51
grown in size and/or provided a more intense push downward on wages and job quality inthis time. In terms of growth there is much we don’t know and some things we do.Bernhardt et al. (2016, 40) concluded that “available information points to rapid growth indomestic outsourcing in a wide range of industries since the 1980s.” Fissuring’s growthseems to have primarily occurred in its least-well-measured component, business-to-business subcontracting (frequently relying on traditional employment arrangements), andnot through any substantial growth in other components that are better measured, such asuse of independent contractors,43 staffing agencies,44 or franchising.45
In any case, there are likely to be downward wage pressures from fissuring. As Weil (2019)notes: “The fissured workplace has been accompanied by the erosion of wage and otherworkplace norms in many industries and occupations” (p. 160). This is because “[b]yshedding their employees in a variety of ways and making those workers the employeesof other organizations, a wage-setting problem becomes a pricing problem. The janitor,maintenance person—or even lawyer—who no longer is a member of the company also nolonger need be bounded by the pay considerations of that company’s wage structure” (p.154).
Various studies confirm that workers in contractor firms earn less, including securityguards and janitors (Berlinski 2008; Dube and Kaplan 2010); call center workers (Batt,Doellgast, and Kwon 2006; Batt, Holman, and Holtgrewe 2009; Batt and Nohara 2009);airline workers (Callaci 2019); and logistics (i.e., truck drivers, warehouse workers),cleaning, security, and food services workers (Goldschmidt and Schmieder 2017). Reviewsof this literature all indicate the adverse impact of outsourcing on wages (Weil 2019;Appelbaum 2017; Bernhardt et al. 2016; and Rosenfeld 2021).
Moreover, outsourcing not only lowers wages; it also leads to greater wage theft and moredangerous working conditions (Weil 2014, 2019).
Fissuring, and particularly the outsourcing of particular tasks, is probably responsible forthe fact that workers in the largest firms no longer receive higher pay than those inmedium-sized firms. Where large firms once likely had a core competency that generatedeconomic rents for workers but also directly employed many in occupations outside thiscore competency, fissuring has allowed lead firms to outsource these noncoreoccupations and restrict employment to only those jobs performing the tasks thatgenerate or share rents. At the same time, large subcontracted firms dominated by thecast-offs of lead firms now provide relatively low-wage work concentrated in occupationswhere rents are harder to generate and protect.
As Bloom et al. (2018) show, those in firms with more than 2,500 employees were not paidmore in the 2007–2013 period than those in firms that had 1,000 to 2,500 employees, asharp drop from what prevailed in the 1980s. For instance, a firm with 10,000–15,000employees paid 15 (log) percentage point more than a firm with 1,000–2,500 employees inthe 1980s, but that differential was absent in the 2007–2013 period. The impact is feltbeyond wages, since large firms also provide better-quality jobs overall, including higherbenefits and better working conditions (Maestas et al. 2017). This erosion of the quality ofjobs in large firms affected a large swath of the workforce, as employment in firms
52
exceeding 2,500 employees comprised 39.0% of all jobs in 2014 compared to 37.0% in1999 and 35.3% in 1979.46
Weil (2019) drives home the point in showing the wage disparities in delivery services: atraditional union employee at UPS earns $23.10 an hour, an “independent contractor” forFedEx earns $14.40, and an Amazon contracted worker (driving the “last mile” of a deliveryscheme) earns $5.30, less than the minimum wage.47 In all three case the basic tasks arethe same but the corporate structure differs.
A speculative gauge of the impact of fissuring might find that a shift of 15 percentagepoints of employment into fissured workplaces earning 15.0% less (Goldschmidt andSchmieder 2017) would yield an overall decline of wages of 2.25% overall but even moreamong non-college-educated and more vulnerable segments of the workforce.
Product and labor market concentration
There has been increasing interest in two key changes in corporate structure in recentdecades: product and labor market concentration (sometimes referred to as monopoly andmonopsony). We will not use the label “monopsony” here for labor market concentration,as modern labor economics has adopted the term “monopsony” to describe a wide rangeof influences—including but not limited to market concentration—that give employerspower to set wages. It seems clear that there are many reasons for policymakers to beconcerned about market concentration, and robust efforts (antitrust or regulation) toconfront the malign effect of concentration should be part of the policy toolkit goingforward.
Labor market concentration. Though labor market concentration is definitely associatedwith lower wages, evidence remains lacking that it has increased so as to greatlycontribute to wage suppression. Key papers assessing the effect of labor marketconcentration include Azar, Marinescu, and Steinbaum (2017); Benmelech, Bergman, andKim (2018); Rinz (2018); and Naidu, Posner, and Weyl (2018). Bivens, Mishel, and Schmitt(2018) surveyed the evidence presented in these papers and found it to show persuasivelythat labor market concentration is negatively correlated with average wages. Theevidence also shows that the average labor market is highly concentrated but the averageworker is not employed in a concentrated labor market. This is because concentration isprevalent in rural areas and other labor markets with lower population density, but mostpeople work in labor markets with low to moderate degrees of concentration. Thedisproportionate labor market concentration faced by rural workers is a key source of theeconomic stress felt by such workers.
Evidence on trends in aggregate labor market concentration is harder to obtain. Labormarket concentration within manufacturing shows a modest increase between 1979 and2009. This time-series analysis also shows that the adverse wage effects of concentrationwithin the manufacturing sector are greatly attenuated by unionization. If overall labormarket concentration rose as fast as concentration within manufacturing over the1979–2014 period, then rising concentration would have lowered average wages byroughly 1% over the period.
53
Rinz (2018) found that local labor markets (which he defines as industry by geography)have become substantially less concentrated over time, while national labor markets havebecome more concentrated. He explains this finding by noting that large players in locallabor markets may have become bigger national players over time. For example, if 30years ago regional fast-food chains dominated local labor markets but now just one or twonational chains dominate all local labor markets, local labor market concentration wouldbe unchanged (there was always only a small number of players in any local labor market)but national concentration would be greater. The effect of this pattern of concentration onearnings and wage inequality depends on what is more important—local or national labormarkets.
Product market concentration—monopoly power in product markets. The growth ofproduct market monopoly power over prices does not seem to have contributed to wagesuppression, though firms may have leveraged their monopoly positions to suppresswages and profits in supplier chains. Key papers directly assessing the effect of productmarket concentration include Autor et al. (2017b); Barkai (2020); De Loecker, Eeckhout,and Unger (2020); Grullon, Larkin, and Michaely (2015); and an analysis by Goldman Sachs(Struyven 2018). Bivens, Mishel, and Schmitt (2018) surveyed some of the evidencepresented in these papers and found that they demonstrated that product marketconcentration rose steadily across six sectors from 1982 to 2012 (manufacturing, retail,wholesale, services, finance, and utilities and transportation). The magnitude of this risehas varied substantially across sectors. Data after 2012 are not yet available from theCensus Bureau. Other sources of data on industry concentration (for example, fromCompustat, a private database of publicly owned firms) are often viewed with somesuspicion by scholars of industrial organization.
The main channel through which increased product market concentration would affectwages in most textbook conceptions is through a shift in income from wages to profits.The increased concentration gives firms pricing power, and the higher prices increaseprofit margins while reducing the purchasing power of wages. Between 1997 and 2012,during the time when concentration in a number of industries increased, the overall shareof corporate-sector income claimed by labor shrank significantly. However, labor marketswere very different in 1997 as compared to 2012; the unemployment rate was 4.9% in 1997and 8.4% in 2012. As labor markets tightened after 2012, labor’s share rose in thecorporate sector.
To more rigorously test the hypothesis that there has been a secular decline in productmarket competition that has transferred income from wages to profits through higherprices, one would want to see the labor share in equivalently tight labor markets over time.Bivens (2018) notes that economists have often been too quick to declare declines in thelabor share “structural” and hence not amenable to reversal by more expansionarymacroeconomic policy. That is, the fall in labor’s share could be the result of firm monopolypower but could also be due to eroded worker power due to excessive unemployment.Many of the studies of monopoly’s impact on labor’s share cannot distinguish betweenthese two competing, or complementary, explanations.48
The rise in labor’s share as unemployment fell in the recent recovery suggests a strong
54

role for eroded worker power, since monopoly power is not expected to diminish withlower unemployment. For instance, labor’s share (in the corporate sector) rose from 75.6%in 2016, when unemployment was 4.9%, to 77.3% in 2019, when unemployment averaged3.7%.49 Stansbury and Summers (2020) note in support of the eroded worker powerexplanation that “Greenwald, Lettau, and Ludvigson (2019) find that a reallocation ofincome from labor to shareholders can account for a large share of the rise in equityvaluations from 1989 to the present.”
Barkai (2020) finds that increases in product market concentration in recent decades havereduced both labor and capital shares across detailed industries, with a concomitant risein the “pure profit” share, which he interprets as evidence of declining competition andgreater monopoly power. His framework of parsing out profit and capital shares separatelyis extremely useful. However, the capital share requires estimating a return to physicalcapital, and because this return and the pure profit return are bundled together in anyobservable data series, it is a real empirical challenge to do and no professionalconsensus exists on the scale of his estimates.
Autor et al. (2017b) estimate that the increase in product market concentration between1997 and 2012 could account for a third of the decline in the labor share over that period.Bivens, Mishel, and Schmitt (2018) calculate that this translates into a reduction in overallwages of roughly 2.9% over that time. It is also possible that what Autor et al. aremeasuring reflects fissuring rather than product market concentration.
While the rise of profit shares is consistent with evidence of rising monopoly power inproduct markets, Stansbury and Summers (2020) note that this is also consistent withreduced labor market power of workers. They further note that textbook models ofincreased monopoly power in product markets should also see faster inflation, reducedoutput, and an increase in the unemployment rate consistent with stable inflation, i.e., thenonaccelerating inflation rate of unemployment, or NAIRU. Decreased worker power,conversely, should see slower inflation and a reduced NAIRU—and these seem moreconsistent with real-world macroeconomic evidence over recent decades. In short, risingmonopoly power in product markets that has harmed U.S. households through excessiveprice growth seems unlikely to be a major channel through which concentration may bedragging on wage growth.
Product market concentration—dominant buyers squeezing suppliers. In traditionalconceptions of the harms done by product market concentration, firms’ monopoly power isleveraged against consumers of their output, with prices being pushed above what wouldprevail in competitive markets. However, many real-world firms with substantial marketshare (Walmart and Amazon, for example) charge their own customers seemingly lowprices while leveraging their market power instead against the firm’s own suppliers,coercing them into providing supplies at low prices. This in turn squeezes both profits andwages for the supplier firms.
Path-breaking research by Wilmers (2018) has identified and quantified the impact of these“dominant buyers.” He documents that dominant buyers have been able to squeezeprofits and lower wages in their supplier chains, and their economic heft has grown over
55
time. Using Securities and Exchange Commission filings of publicly owned companies todocument the large increase in dominant buyers, Wilmers estimates that the share ofnonfinance suppliers’ revenue obtained from dominant buyers increased from 5% in 1979to 19% in 2014 overall and from 6% to 26% in manufacturing and logistics.50 The biggestincrease in the role of dominant buyers came in manufacturing, wholesale and shipping,primary resource extraction, utilities, construction, and information and professionalservices. Over the course of the last four decades “the composition of these dominantbuyers shifted toward large retailers [e.g., Walmart] and other intermediaries“ (Wilmers2018, 221).
Wilmers argues that there was not only an increase in the role of dominant buyers but alsoan intensification of their wage impact:
[N]egative wage effects have intensified since the early 2000s, and in several yearsin the 1980s, reliance on dominant buyers had negligible effects. During the periodof wage stagnation and the restructuring of buyer-supplier relations, the wageeffects of dominant buyer reliance turned increasingly negative. (Wilmers 2018,229)
Wilmers estimates that the increase in dominant buyers lowered the growth of averageannual earnings by 3.4 percentage points over the 1979 to 2014 period among publiclyowned nonfinancial firms. The impact among low- and moderate-wage workers almostsurely was larger than this.51
Deregulation of industries
Starting in the late 1970s, Congress deregulated various industries, including airlines,trucking, interstate busing, telecommunications, utilities, and railroads.52 In each of theseindustries, deregulation had a strong adverse impact on the wages and compensation ofblue-collar workers. Fortin and Lemieux (1997) showed that 9% of the workforce in the1980s was affected by industry deregulation and that in such industries there was a muchlarger erosion of middle-wage jobs.53 According to their estimates, deregulation explainedabout 7% of the rise in male wage inequality between 1979 and 1988, especially for thoseabove a low-wage threshold. Card (1996) showed a 10% decline over 1980–1990 in therelative earnings of airline workers after deregulation. Deregulation weakened the abilityof employers to pay high wages and in many sectors, most notably trucking, led to a steeperosion of unionization (Viscelli 2016). A New York Times (2018) editorial noted, forexample, that “the 1.7 million heavy and tractor-trailer truck drivers in the United Statesearned an average of $44,500 last year…and far below the $55,500 (in 2017 dollars)earned in 1979, despite drivers working longer hours.”
56
The aggregate impact of the policychoices generating wage suppressionThis section draws on the earlier assessments of the factors generating wage suppressionto account for the divergence between the growth of net productivity and median hourlycompensation over the 1979–2017 period and the suppression of the growth of the 10thpercentile wage and the wage gap in the bottom half (i.e., the 50/10 wage gap). We startby looking at the relationship between our analysis and that of other contributions tounderstanding wage inequality and, specifically, how our analysis complements and pointsin the same direction as other recent research that has focused attention on workerpower.
Relation to other literatureOur analysis builds on what Stansbury and Summers (2020) referred to as a “long historyof progressive institutionalist work exemplified by Freeman and Medoff (1984), Levy andTemin (2007), and Bivens, Mishel, and Schmitt (2018).”
An important recent marker in this tradition was the keynote address by former chairmanof the Council of Economic Advisers and Princeton economist Alan Krueger (Krueger 2017)to the Federal Reserve Board Jackson Hole conference. Krueger said that certaineconomic models “give employers some discretion over wage setting” and, in a footnote,said, “Notice that I don’t call these features ‘imperfections.’ They are the way the labormarket works. The assumption of perfect competition is the deviation from the norm of‘imperfection’ as far as the labor market is concerned.”
Krueger’s speech reflects a shift away from the conventional labor market view that hasbeen accepted by both liberal and conservative economists for decades: that competitivelabor markets are the same as any other market and are characterized by equallyempowered employers and employees. What is emerging, however, is an appreciationthat labor is a distinct type of commodity and that unequal bargaining power is an inherentcharacteristic of the employer-employee relationship. This change of perspective has aprofound impact on the analysis of labor market dynamics and which labor policies andeconomic policies in general are required to rebalance power in the labor market and thusobtain robust wage growth and better-quality jobs for the vast majority.
There has also been a growing acceptance that anemic U.S. wage growth can beexplained by the “rigging of the system” against the typical worker. This framework wasadopted by former President Trump, who picked up on themes earlier laid out by SenatorsElizabeth Warren and Bernie Sanders.
That the economic system is rigged to create upward redistribution has been the theme ofeconomists (e.g., Dean Baker, Josh Bivens, Jared Bernstein, Joseph Stiglitz, LawrenceMishel, Heidi Shierholz, Elise Gould, and James K. Galbraith) and policymakers for some
57

time, though articulations of how the system is rigged vary. President Trump, for instance,focused on immigration, trade treaties, and bureaucracy. Others focus on growing productmarket monopoly power affecting consumers. Some analyses focus on the need for morecompetition (Block and Harris 2021). The approach in this paper is to pinpoint andmeasure the impact of the factors that have empowered employers in the labor market tobe able to suppress wage growth for the vast majority; these include maintainingexcessive unemployment, weakening labor standards, diminishing unions and theireconomic and political power, leveraging monopoly power to lower labor costs throughfissuring and subcontracting, and by adopting forced arbitration, noncompetes, and othercontractual mechanisms to undercut worker options.
This paper returns to a mode of analysis, dominant in the 1990s but abandoned in recentliterature, that focuses on empirically identifying the impact of specific causes of wageinequality and evaluating their contribution to explaining overall wage inequality trends.
Comparison to the new monopsony literature
The new monopsony literature reinforces our narrative in important ways and furtherhighlights the need to identify the specific factors generating employer power over wagesand ways this power has changed over time. A broad interpretation of employers’“monopsony” power does not hinge on labor market concentration (i.e., the proverbialone-company town), but instead diagnoses labor markets as being affected by employers’exercise of power that allows them to cut wages without fear of losing a large portion oftheir workforces—regardless whether the source of this power is market concentration oranything else.
A number of studies—including Webber (2015 and 2020); Dube, Giuliano, and Leonard(2019); Dube et al. (2020); Bassier, Dube, and Naidu (2020); Azar, Marinescu, andSteinbaum (2019); Langella and Manning (2020); Card et al. (2018); and the meta-analysisby Sokolova and Sorensen (2020)—show that employer power is ubiquitous in the modernU.S. labor market. These studies estimate the labor supply elasticities facing firms, i.e., theresponsiveness of employees to exit following changes in wages offered by employers.For instance, Webber (2020, 18) notes:
The majority of firms (median labor supply elasticity=0.85) compete for workers inlabor markets where the typical employee is highly unlikely to move in response tosmall or even modest changes in their wage. This gives these firms considerablelatitude to pay lower wages without worrying about a mass exodus of employees.
The monopsony literature has identified a substantial amount of employer power such thatemployers are able to, as Bassier, Dube, and Naidu (2020) put it, “mark down” wages byanywhere from 20% to 50%. There is some evidence on the time trend of employermonopsony power; two studies have shown that employer power increased since the late1990s (Webber 2020; Langella and Manning 2020), though Bassier, Dube, and Naidu(2020, Table 6) show stability over the 2003–2012 period. One consistent finding of thesestudies is that employers are able to exert more power over low-wage than other workers,affirming that employer power generates wage inequalities.
58

What these studies, which overwhelmingly focus on recent data, convincingly demonstrateis that employers wield power over U.S. wages. These studies also point to influences thatseem to blunt the effect of employer power—like unionization, high-pressure labormarkets, and high values of minimum wages. For example, Bassier, Dube, and Naidu(2020), examining the 2003–2012 period, find that monopsony power was greater in the2007–2010 period of very high unemployment than in the preceding or subsequent years.Langella and Manning (2020) find monopsony power in the U.S. declining in recoveries(1996–2000 and 2002–2007) and increasing as unemployment escalates (2000–2002and after 2008 but continuing through 2016).
What these studies suggest is that employer power is ubiquitous in labor markets and,absent institutions and policies that provide countervailing power, wages will be lower andwage growth suppressed. One way to interpret the review of evidence in the currentpaper is that employer power is the constant of modern labor markets, but what haschanged over the past generation in the United States to generate anemic wage growth isthe erosion of institutions and policies—high-pressure labor markets, unions, and bindingminimum wages—that once provided countervailing power.
Naidu and Sojourner (2020) usefully place this shift into a broader context:
It is not clear that monopsony power has increased over time, but that is also notnecessary to make monopsony an important force for explaining inequality…. It isclear that the scope that employers have to exercise the market power they dohold has increased over time, as argued by Erickson and Mitchell [2008]. In aneconomy without unions, without strong internal labor markets, and with low-costworker performance monitoring, the forces that may have restrained employersfrom exercising the latent market power they held (collective bargainingagreements, implicit seniority rules, within-firm equity norms, and efficiency wages)have diminished. It may not be that monopsony has gone up, but it is certainly truethat the countervailing forces have declined.
In this light, this paper’s analysis can be considered an examination of “what has changed”in the face of ongoing employer power in labor markets.
This new monopsony literature provides a top-down analysis, which has primarily focusedon estimating the aggregate scale of employer power. Some of the recent contributionshave started to identify the underlying factors, examining the role of unionization, high-pressure labor markets, and high values of minimum wages, in explaining an aggregatemetric of monopsony power. In contrast, our study is a bottom-up analysis examining theimpact of myriad specific factors and gauging their contribution to the productivity–mediancompensation divergence over the past four decades.
59
Explaining the divergence between productivityand median hourly compensation growthIn examining the corporate and government policy levers that have suppressed wages,our conclusion is that they can account for the vast majority of wage suppression. In thenext section we find that these policies can account for the entirety of the fall in wages atthe 10th percentile and the corresponding growth of the wage gap between low-wageworkers and the median worker.
It can be difficult to assess causality and take interactions into account. But looking at thesum of the impact of the key factors supports the narrative that intentional policy decisions(either of commission or omission) have generated wage suppression. Analysts may differon the assessment of particular factors, but our hope is that this compilation inspiresfurther efforts, including ones for which we do not have sufficient empirical work to evenmake guesses.
How much needs to be explained? Above we estimated that by 2017 rising inequality andthe erosion of labor’s share of income had lowered compensation of median workers byroughly 43% relative to net productivity growth. Table 3 summarizes the estimated impacton median hourly compensation of the factors that have driven rising inequality and thedecline in labor’s share of income. The first panel details the productivity andcompensation trends. Between 1979 and 2017 net productivity (economywide productivitynet of depreciation) grew 56.0% while median hourly compensation (wages and benefits)grew 13.0%, leaving a 43.0% divergence. If we used hourly compensation of productionworkers (82% of payroll employment) as the pay measure rather than the median wage,the divergence would be even greater. Benefits are included in these analyses using theratio of compensation to wages from the National Income and Product Accounts toconvert wages to compensation. By deflating both net productivity and the pay measuresby the CPI-U-RS index, we have stripped out the influence of differing deflators (forproductivity and compensation) from our calculation of the divergence, leaving only thechanges in labor’s share of income and changes in compensation inequality as drivers ofthe divergence (see Bivens and Mishel 2015).
The impact of specific factors on the growth of the median wage is detailed in the secondpanel and discussed next. For purposes of the analysis we equate the impacts on medianwages, identified above, with that on median hourly compensation: this is not aconsequential decision since the 13.0% growth of median hourly compensation over the1979–2017 period just slightly exceeded the 12.2% growth of median hourly wages.54
The share of the various factors in explaining the overall divergence of net productivityand real hourly compensation is presented in Table 4 and illustrated in Figure I (examininggrowth, in percent, of factors) and Figure J (examining growth, in dollars, of factors).
60

Table 3 Impact of policy decisions on median wage growth,1979–2017
Factor Impact on median wage
Growth (deflated by CPI-U-RS), 1979–2017
1 Net productivity 56.0%
2 Median hourly compensation 13.0%
3Production worker hourlycompensation
10.9%
4Productivity–median hourlycompensation divergence (1 − 2)
43.0%
Factors
1 Excessive unemployment* 10.0%
2 Erosion of collective bargaining 7.9%
3 Globalization 5.6%
4 Weaker labor standards
Erosion of minimum wage 0.0%
Overtime coverage forsalaried workers
0.3%
Wage theft n.a.
Misclassification 1.0%
Increased presence ofundocumented
n.a.
Guestworker programs n.a.
Increased racialdiscrimination
n.a.
5 Employer-imposed contract terms
Noncompetes 2.25%
Anti-poaching n.a.
Forced arbitration n.a.
6 Corporate structure
Labor concentration 0.0%
Dominant buyer 3.4%
Fissuring 2.25%
Product market monopoly 0.0%
Industry deregulation n.a.
61
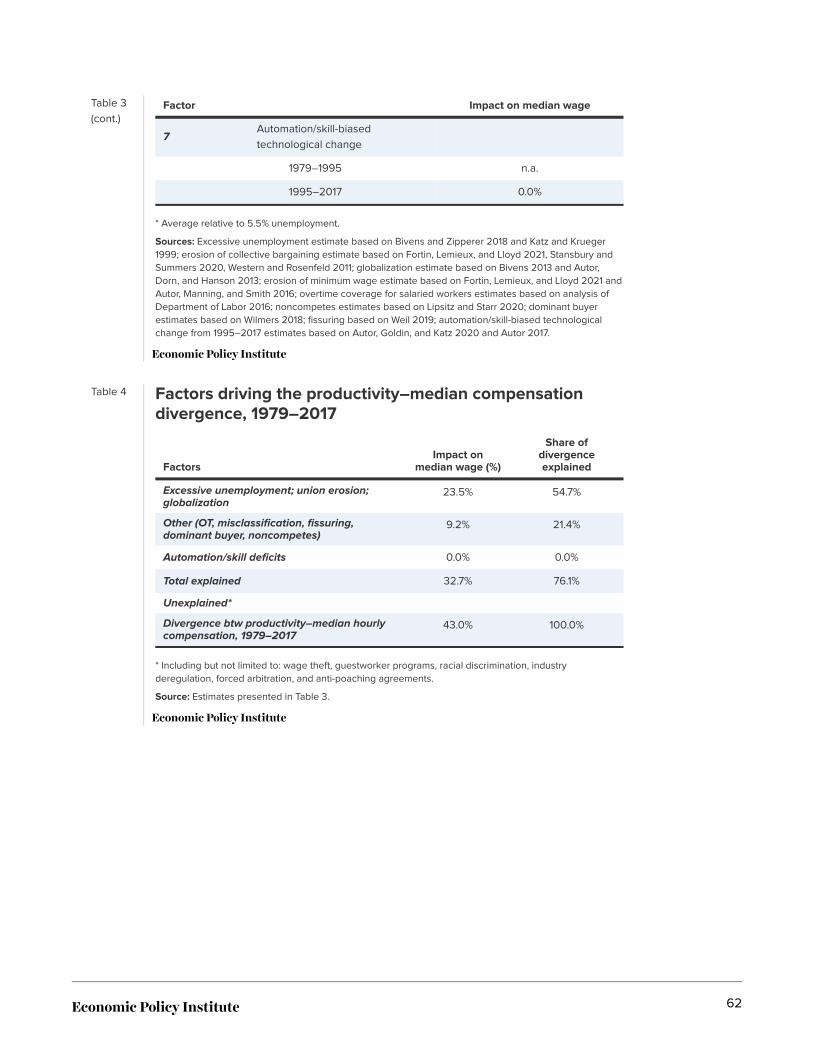
Table 3(cont.)
Factor Impact on median wage
7Automation/skill-biasedtechnological change
1979–1995 n.a.
1995–2017 0.0%
* Average relative to 5.5% unemployment.
Sources: Excessive unemployment estimate based on Bivens and Zipperer 2018 and Katz and Krueger1999; erosion of collective bargaining estimate based on Fortin, Lemieux, and Lloyd 2021, Stansbury andSummers 2020, Western and Rosenfeld 2011; globalization estimate based on Bivens 2013 and Autor,Dorn, and Hanson 2013; erosion of minimum wage estimate based on Fortin, Lemieux, and Lloyd 2021 andAutor, Manning, and Smith 2016; overtime coverage for salaried workers estimates based on analysis ofDepartment of Labor 2016; noncompetes estimates based on Lipsitz and Starr 2020; dominant buyerestimates based on Wilmers 2018; fissuring based on Weil 2019; automation/skill-biased technologicalchange from 1995–2017 estimates based on Autor, Goldin, and Katz 2020 and Autor 2017.
Table 4 Factors driving the productivity–median compensationdivergence, 1979–2017
FactorsImpact on
median wage (%)
Share ofdivergenceexplained
Excessive unemployment; union erosion;globalization
23.5% 54.7%
Other (OT, misclassification, fissuring,dominant buyer, noncompetes)
9.2% 21.4%
Automation/skill deficits 0.0% 0.0%
Total explained 32.7% 76.1%
Unexplained*
Divergence btw productivity–median hourlycompensation, 1979–2017
43.0% 100.0%
* Including but not limited to: wage theft, guestworker programs, racial discrimination, industryderegulation, forced arbitration, and anti-poaching agreements.
Source: Estimates presented in Table 3.
62

Figure I Factor’s percent contribution to productivity–mediancompensation divergence, 1979–2017
Notes: Automation/skill deficits had no effect.* Dominant buyer and fissuring** Including but not limited to: wage theft, guestworker programs, racial discrimination, industry deregulation,forced arbitration, and anti-poaching agreements
Source: Authors’ analysis from Table 3.
63

Figure J Factor’s dollar contribution to productivity–mediancompensation divergence, 1979–2017
Notes: Automation/skill deficits had no effect.
* Dominant buyer and fissuring
** Including but not limited to: wage theft, guestworker programs, racial discrimination, industry deregulation,forced arbitration, and anti-poaching agreements
Source: Authors’ analysis from Table 3.
64
Austerity macroeconomic policy (excessiveunemployment)
The impact of excessive unemployment caused by contractionary macroeconomic policy,promulgated to control inflation, (suppressing labor costs in the name of controllinginflation) reduced wages for the median worker by 10.0% between 1979 and 2017.Adjusting for the “flattening” of the Phillips curve since 2008, as we do here, lessens theimpact of higher unemployment on wage growth; without this adjustment the impactwould have been 12.2%. These contractionary policies caused unemployment to remain0.8 percentage points above even a conservative estimate of full employment (theNAIRU)—5.5%—between 1979 and 2017, a sharp contrast from the 0.51 percentage pointsthat unemployment remained below the NAIRU in the prior 30 years. If the unemploymentrate had been held lower, say to 5% on average, then median wages would have beenabout 18.3% higher by 2017.
Of course, a 5.5% target for full employment is a modest goal, and if policymakers hadachieved a reasonable target of 4.5% the impact of excessive unemployment would bedouble the 10% presented in Table 3.
Erosion of collective bargaining
The erosion of collective bargaining had an adverse impact by lowering the wages of non-college-educated workers, particularly men, and has also lowered the wages and benefitsof nonunion workers in sectors where collective bargaining had previously set wagepatterns. Fortin, Lemieux, and Lloyd (2021) estimated that eroded unionization (includingspillovers) explains 37.3% of the growth of the 90/50 wage gap (which rose 0.33 logpoints) among men over the 1979–2017 period, equivalent to a 0.32 percentage pointannual decline and a 12% (log point) decline in wages over the entire period for themedian male earner. Union coverage fell less for women (due to less unionization amongwomen in 1979), so union erosion explains only 13% of the growth of the 90/50 wage gap(which rose 0.28 log points) among women, equivalent to a 0.10 percentage point annualdecline and a 3.6% (log point) decline in wages over the entire period for the medianfemale earner.
We relied on an unpublished analysis of the Fortin, Lemieux, and Lloyd (2021) model topinpoint at 7.9% the impact of deunionization on the median wage of all workers (men andwomen combined) for the 1979–2017 period:
Deunionization raised the log 90/50 wage gap by 7.7 log points, almost entirely byreducing the median hourly wage by 7.6 log points, or by 7.9% (0.2 percentannually). The impact on men is larger, with deunionization lowering the malemedian wage by 10.9 log points, or 11.6% (0.29 percent annually). Deunionizationtherefore explains 33.1% of the 23.2 log point growth of the 90/50 wage gap overthe 1979–2017 period.
Above we noted that Mishel, Rhinehart, and Windham (2020) show that automation and
65

globalization can explain less than a fifth of the erosion in private-sector collectivebargaining; the lion’s share has been due to changes in corporate practices enabled by laxlegal protections and changing rules.
Globalization on capital’s terms
Bivens (2013) found that, by 2013, trade flows with low-wage nations were likely reducingwages for workers without a four-year college degree by roughly 5.6%. For a non-college-degreed worker making the median hourly wage and working full time, full year, thistranslates to about $2,000 annually. This estimate is nearly identical to what Autor, Dorn,and Hanson (2013) find in a regression-based investigation of the wage impacts of importsfrom low-wage countries.
Policy decisions have amplified globalization’s downward wage pressure. Tradeagreements, for instance, have been the result of corporate capture that has engaged inselective and regressive protectionism that has severely restricted the policy space of ourtrading partners.
Impact of the top three factors
As summarized in Table 4 and Figure I, together these three factors alone—excessiveunemployment, eroded collective bargaining, and corporate-driven globalization—canaccount for a 23.5% decline in the median wage from 1979 to 2017 and for 54.7% of thedivergence between net productivity and median hourly compensation. Figure J showsthat excessive unemployment, eroded collective bargaining, and corporate-drivenglobalization lowered the growth of median hourly compensation by $5.45: absent thesefactors median hourly compensation would have risen to $28.59 rather than to $23.59.
Weaker labor standards
The failure to update the value of the federal minimum wage is a premier example ofpolicy action shaping the wage structure and undermining the wages of the bottom thirdof earners (heavily women and minorities), or 46 million workers. The minimum wage’simpact probably does not extend to the median, so we express that as zero in Table 3. Theimpact on the 10th percentile wage is considered below.
The erosion of other labor standards likely had an impact throughout the wage structure.Overtime protections for salaried workers declined precipitously and nicked medianworkers’ wages by 0.3%, while growing misclassification of workers as independentcontractors lowered the median wage by 1.0%. Other practices and policies, like laxprotections against wage theft, the increased presence of undocumented workers andguestworkers, and more extensive racial discrimination have likely lowered wages, but weare not able to provide an empirical assessment.
66

Employer-imposed contract restrictions
Employers have increasingly required employees to relinquish various rights when theyaccept employment, or even after they are already employed, through agreementsregarding noncompetition and forced arbitration. Employers within franchise chains havealso colluded against employees through anti-poaching agreements, which limit workers’employment options. The effort to quantify the impact of these policies is still in thebeginning stages. We estimate that noncompete agreements have reduced the medianwage by 2.25%, but we have not been able to derive good estimates of the impact offorced arbitration (now covering more than half of nonunion employees) nor of anti-poaching agreements among franchisers.
Changes in corporate structure
Changes in corporate structure—from deregulation to fissuring to rising marketconcentration—likely pushed down wages by at least 5% by 2017. A speculative gauge ofthe impact of a shift of 15 percentage points of employment into fissured workplaceswhere wages are 15% less would imply an overall decline of wages of 2.25% and probablyan even larger decline at the median. Wilmers’ (2018) estimated that the increase indominant buyers lowered annual earnings by 3.4% over the 1979–2014 period amongworkers in publicly owned nonfinancial firms; the impact presumably fell disproportionatelyon low- and moderate-wage workers. Industry deregulation in airlines, trucking, interstatebusing, telecommunications, utilities, and railroads permanently lowered wages for blue-collar workers in the affected industries. Fortin and Lemieux (1997) estimated that 9% ofthe workforce in the 1980s was affected by industry deregulation, and this explains about7% of the rise in male wage inequality between 1979 and 1988. Increased product marketconcentration’s direct impact on prices and profits may not have added to wagesuppression, though the leverage of monopoly enables fissuring and the dominant buyer’sability to squeeze wages and profits in supplier chains.
There is likely to be some double counting when aggregating the fissuring and dominantbuyer factors, but it is also likely that the unassessed components of corporate structuresexerted at least as much downward wage pressure to offset it.
Automation/skill-biased technological change
As detailed earlier and in Appendix A, automation and skill-biased technological changeare prima facie implausible explanations of the wage suppression or wage inequalityexperienced at least since 1995. It is notable that productivity and investments in capital,software, and information equipment—the footprints of automation—have all decelerated,at least since 2005. Moreover, the rate of change of occupational employment patternshas been historically slow. Indirect or deduced measures of automation-driven relativedemand for skills (measured in terms of a college education) have also grown remarkablyslower since the mid-1990s (Autor, Goldin, and Katz 2020; Autor 2017). In addition,occupational job polarization has not been present since the late 1990s (Autor 2010; Autor2015; Mishel, Shierholz, and Schmitt 2013; and others). Given this deceleration of the
67
salient indicators of automation and automation’s impact on key labor market metrics(relative demand for college education, occupational polarization), we assign no impact inTable 3 to automation or skills gaps in driving the productivity–pay divergence for the1995–2017 period. Our discussion above did not cover the 1979–1995 period, so we donot assign any impact one way or another to automation and skills gaps then. We remainskeptical that there was any impact, though, following the analysis in Mishel, Bernstein,and Schmitt (1997a) and Card and DiNardo (2002).
Suppressed wage growth at the 10th percentileand growth in the 50/10 wage gapWe can also draw on our analyses of the various factors to explain the trend in the wagegap in the bottom half—between the median and the 10th-percentile earner—and thedisappointing wage growth at the bottom. Recall that wages at the bottom fared similarlyto those in the middle from about 1987 onward, and for low-wage workers wagesplummeted in the 1979–1987 period, especially among women. The 50/10 wage gap grewonly in the 1979–1987 period. Two factors, the lowering of the inflation-adjusted value ofthe federal minimum wage and excessive unemployment, can readily explain these trends.
Contribution of the eroded minimum wage
The failure to maintain the value of the minimum wage since 1979 greatly shaped thewage gap in the bottom half and the level of wages at the 10th percentile; this wasdiscussed above and presented in Table 2, based on analysis of the Fortin, Lemieux, andLloyd (2021) model (which includes spillover effects). Table 5 draws on these results andshows that the fall in the minimum wage lowered the 10th percentile wage by 16.7percentage points between 1979 and 2017, far more than the actual 2.1% decline of the10th percentile wage. Almost the entire growth—15.0 percentage points—of the 50/10wage gap can be explained by a lower minimum wage (impact of 13.8 percentage points);absent that the 50/10 wage gap would have shrunk modestly (by 4.7 log points). It wasprimarily the lowering of the real value of the minimum wage in the 1979–1987 period thatdrove the growth of the 50/10 wage gap and the lowering of 10th percentile wages,especially among women.
These estimates of the minimum wage’s impact on low-wage earners would be evengreater if the counterfactual were maintaining the threshold relative to the median eitheras it was in 1979 or at the historic peak value in 1968. For instance, the ratio of theminimum wage relative to the median wage of all full-time, year-round workers fell from52.8% in 1968 to 45.7% in 1979 and to 33.3% in 2017 (Cooper 2019, Figure C). Thus, theminimum wage in 2017 would have to increase by 37% to reach the 1979 level or by 59%to reach its level of 1968. In contrast, if the standard is the real value of the minimum wage,in 2017 it would have needed to be increased by 26% to attain its 1979 level. The minimumwage’s threshold could be targeted at a much higher level if not for the dramatic shortfallof the growth in the median wage relative to net productivity—the 43% shortfallhighlighted in this paper.
68
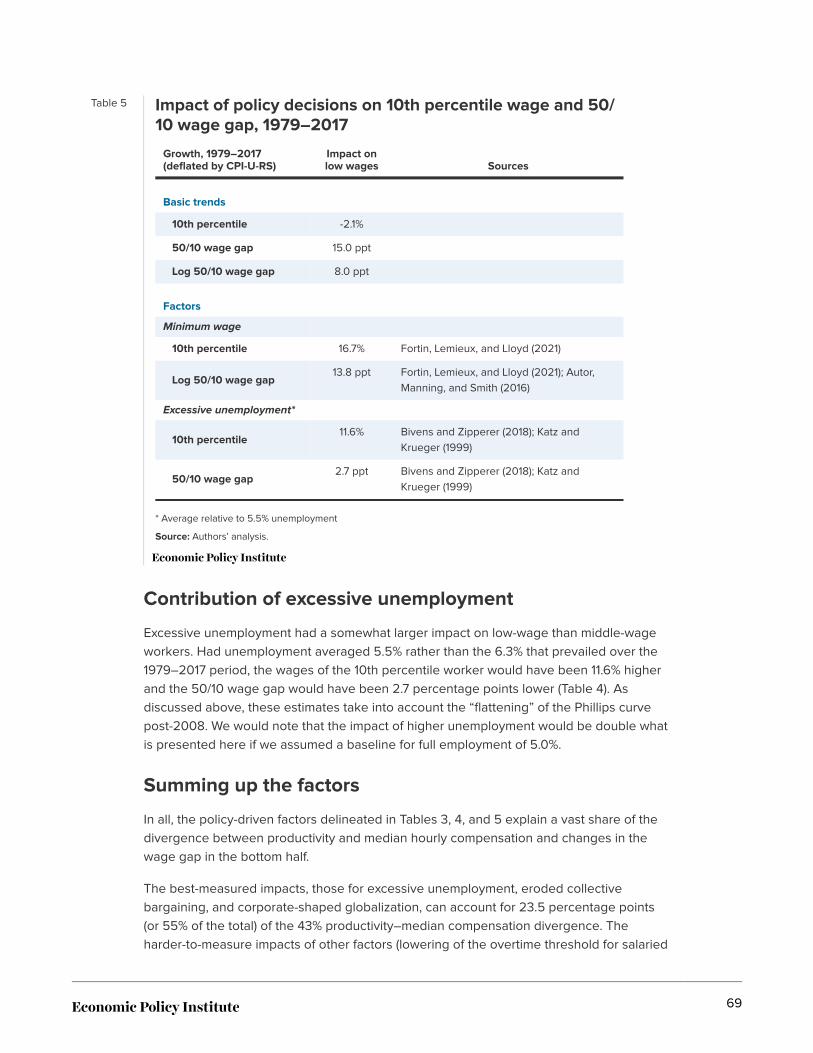
Table 5 Impact of policy decisions on 10th percentile wage and 50/10 wage gap, 1979–2017
Growth, 1979–2017(deflated by CPI-U-RS)
Impact onlow wages Sources
Basic trends
10th percentile -2.1%
50/10 wage gap 15.0 ppt
Log 50/10 wage gap 8.0 ppt
Factors
Minimum wage
10th percentile 16.7% Fortin, Lemieux, and Lloyd (2021)
Log 50/10 wage gap13.8 ppt Fortin, Lemieux, and Lloyd (2021); Autor,
Manning, and Smith (2016)
Excessive unemployment*
10th percentile11.6% Bivens and Zipperer (2018); Katz and
Krueger (1999)
50/10 wage gap2.7 ppt Bivens and Zipperer (2018); Katz and
Krueger (1999)
* Average relative to 5.5% unemployment
Source: Authors’ analysis.
Contribution of excessive unemployment
Excessive unemployment had a somewhat larger impact on low-wage than middle-wageworkers. Had unemployment averaged 5.5% rather than the 6.3% that prevailed over the1979–2017 period, the wages of the 10th percentile worker would have been 11.6% higherand the 50/10 wage gap would have been 2.7 percentage points lower (Table 4). Asdiscussed above, these estimates take into account the “flattening” of the Phillips curvepost-2008. We would note that the impact of higher unemployment would be double whatis presented here if we assumed a baseline for full employment of 5.0%.
Summing up the factors
In all, the policy-driven factors delineated in Tables 3, 4, and 5 explain a vast share of thedivergence between productivity and median hourly compensation and changes in thewage gap in the bottom half.
The best-measured impacts, those for excessive unemployment, eroded collectivebargaining, and corporate-shaped globalization, can account for 23.5 percentage points(or 55% of the total) of the 43% productivity–median compensation divergence. Theharder-to-measure impacts of other factors (lowering of the overtime threshold for salaried
69

workers, misclassification, noncompete agreements, and changes in corporate structureslike fissuring) can collectively account for another 9.2% of the erosion of the median wageand explain another 21.4% of the divergence. These sum up to explaining about three-fourths (76.1%) of the divergence (Table 4 and Figure I). This is an understated conclusionsince there are many additional policy factors that we have not been able to empiricallyassess: wage theft, guestworker programs, racial discrimination, industry deregulation,exploitable immigrants, forced arbitration, and anti-poaching agreements.
Excessive unemployment and the erosion of the minimum wage more than fully explainthe (limited) growth of the wage gap in the bottom half and the substantial shortfall in thegrowth of the 10th percentile wage (which fell modestly even though net productivity roseby more than half). Other factors such as exploitable immigrants with limited legal rights,increased wage theft, and employee misclassification also depressed wages at thebottom.
In short, without all of these policy-driven changes in the U.S. economy, the bulk of the gapbetween typical workers’ pay and economywide productivity would not have occurred,and wages at the 10th percentile would have risen instead of fallen. Limited access tocourts, collective bargaining, and employment and the inability to rely on governmentlabor standards have systematically weakened the options that workers have to improvetheir wages, hours, and working conditions.
There are reasons to believe that the impact of these factors is larger than the sum of theirindividual effects. One way of understanding what has happened is to gauge all the waysthat an individual workers’ options to obtain better employment conditions or to affecttheir current employment have been increasingly foreclosed—limiting both exit and voice.When workers want to improve their conditions of work, they have increasingly limitedoptions to organize a union, rely on adequate and enforceable government standards(e.g., the minimum wage, safety and health, overtime, anti-discrimination, correctclassification), or make employers accountable through litigation. Exit is more limitedbecause of anti-poaching agreements, noncompetes, and generally higherunemployment, and the downward pressure on their wages is intensified by globalization,fissuring, and dominant buyer power. Increasingly, resistance is futile.
The lessons here are simple. Wage growth has been greatly directed by policy decisionsand is a political variable. It responds—robustly—to big policy changes. But for decadesthese policy decisions have gone in the wrong direction. Policymakers can deliverprosperity to the vast majority of U.S. workers based on faster wage growth. Whetherworkers obtain a fair share of the economy’s gains in the future will depend not so muchon abstract forces beyond their control but on demanding that their politicalrepresentatives restore bargaining power to workers, individually and collectively.
70

AcknowledgmentsWe gratefully acknowledge the assistance of people who provided information orcommented on particular issues: Eileen Appelbaum, Danny Blanchflower, David Cooper,Daniel Costa, Nick Hanauer, Thomas Lemieux, Mike Lipsitz, Celine McNicholas, SureshNaidu, Heidi Shierholz, John Schmitt, Andrew Sharpe, Anna Stansbury, Evan Starr, MarshallSteinbaum, Thea Lee, David Weil, Nathan Wilmers, and Ben Zipperer. Melat Kassaprovided essential, excellent research assistance. We also are appreciative of the fundingof the Economic Policy Institute’s Unequal Bargaining Power initiative by the Nick andLeslie Hanauer Foundation, the William & Flora Hewlett Foundation, and the Bernard andAnne Spitzer Charitable Trust.
71
Appendix A: The failure of automationand skill gaps to explain wagesuppression or wage inequalityThat U.S. workers have “skills deficits,” that is, lack the skills necessary to deal withtechnological change, including primarily automation, has been the predominantexplanation offered by economists, pundits, policymakers, and the media to explainsluggish wage growth and inequality in the United States, at least until recently. This is theskill-biased technological change hypothesis, which points to the increased use ofcomputer equipment in the workplace and the onset of the information age.
This narrative is sometimes presented as explaining the wage gaps between “skilled” and‘‘unskilled” (meaning those without a college degree) earners and the disappointing wagegrowth for the vast majority. This appendix will show that the skills deficit/automation claimhas always been a weak explanation for the trends since 1979, and, since the mid-1990s,all indications are that there is no basis at all for considering automation as a significantfactor in wage suppression or the growth of wage inequality. For this reason, center-lefteconomists have increasingly stopped highlighting these factors in discussions of thewage problems we face, though the narrative lingers among the punditry.
The conventional wisdom on automation andwage inequalityThe general view of the last 30 years is that inequality and wage stagnation are the resultof technological change in the workplace, meaning automation, and globalization drivenby either technological advances or the political decisions of U.S. trading partners (China’sdecision to join the world trading system, for example). These trends were seen as notonly inevitable but desirable, in that the harm to workers is the byproduct of forces onewould neither want to nor could change. The only appropriate remedy is to adapt,primarily by upgrading workers’ skills and education and perhaps by providing a moreadequate safety net.
We examined in the body of the paper the impact of globalization for wage trends anddrew two conclusions: Globalization played a nontrivial role in lowering the wages of non-college-educated workers, and this downward pressure has been strengthened by policydecisions creating selective and regressive shaping of the global rules. This appendixfocuses on the automation/skills deficit dimension.
72
The automation narrative in the 1990s (the Clinton years)
In the 1990s center-left economists settled on skill deficits as the dominant explanation forgrowing wage inequality. As noted by President Clinton’s Council of Economic Advisers(1995):
The sluggish growth of incomes is due to dramatic changes in technology and inglobal competition that have affected industrialized economies around the world,reducing the relative demand for workers with less education and training…. [M]osteconomists believe that a shift in the demand for labor in favor of more highlyskilled, more highly educated workers has played a key role. Intensifying globalcompetition is also cited as a factor in putting downward pressure on the wages ofless educated workers. However, a number of studies have found that the easilymeasured direct effects of trade on the wage distribution were small….
An array of economists adopted the automation narrative in the 1990s. Conservativesdrew on the work of Kevin Murphy, Gary Becker, and others to conclude that skills deficitsexplained wage gaps, pointing to higher returns to both education and other,unobservable (meaning not captured by specific variables in survey data) skills. Thecenter-left drew on the work of Katz and Murphy (1992) and, later, an important book byGoldin and Katz (2008), The Race Between Education and Technology. Whileconservatives have produced little new empirical work on wage inequality in the last 20years or so, the center-left has focused, until very recently, on developing a newer versionof skill-biased technological change centered on the polarization of occupationalemployment patterns (Autor, Katz, and Kearney 2006; Autor 2010; Acemoglu and Autor2011; Kearney, Hershbein, and Boddy 2015).
The automation narrative in the 2010s (the Obama years)
This narrative was the dominant one offered by the Obama administration, and PresidentObama (USA Today 2018) was still offering it in September 2018:
This change has happened fast, faster than any time in human history. And itcreated a new economy that has unleashed incredible prosperity. But it’s alsoupended people’s lives in profound ways. For those with unique skills or access totechnology and capital, a global market has meant unprecedented wealth. Forthose not so lucky, for the factory worker, for the office worker, or even middlemanagers, those same forces may have wiped out your job, or at least put you in noposition to ask for a raise. As wages slowed and inequality accelerated, those at thetop of the economic pyramid have been able to influence government to skewthings even more in their direction: cutting taxes on the wealthiest Americans,unwinding regulations and weakening worker protections, shrinking the safety net.So you have come of age during a time of growing inequality, of fracturing ofeconomic opportunity.
In this story, rapid technological change has led to substantial growth overall and for those
73
at the very top—the ones with “unique skills” and “access to capital”—while those withoutunique skills and access to capital experience diminished demand and are unable to pushfor higher pay.
Similarly, a leading conservative labor economist and chairman of the George W. BushCouncil of Economic Advisers from 2006 to 2009, Ed Lazear, offered the automation storyin the Wall Street Journal in 2019:
How are American workers doing? Neither the middle class nor the poor have faredwell in recent decades—but don’t blame tax cuts, a too-low minimum wage or thegreed of the 1%. In rich countries around the world, the top half of the incomedistribution has been pulling away from the bottom half. Productivity growth amonghigh-wage workers, driven by technological change, is the reason…. The likelyexplanation is that changes in trade and technology have raised the productivity ofhighly trained, highly educated workers relative to the less skilled. Wages tend tomove with productivity, so that if differences in worker productivity grow, wagedifferences will also grow. (Lazear 2019)
The skills deficit story sounds logical, but it’s not true. It fails to explain wage patterns overthe last four decades, and it is a prima facie implausible explanation for at least the last 20or more years (since 1995 or 1999). Contrary to President Obama’s contention,technological change (or at least automation) has not been especially rapid in the lastdozen years or so (there’s actually been a substantial deceleration). Further, the contentionthat there has been a shift in the demand for labor in favor of more highly skilled, highlyeducated workers was not true in the late 1990s and has happened far more slowly in the2000s than in earlier periods.
Automation: A flawed explanationThere have been two versions of the automation narrative, one based on education wagedifferentials, used to explain the trend in 1980s, and one based on “polarization” inoccupational employment, used to explain the 1990s and beyond. Both versions wererecently offered by economist David Autor as being among four explanations of wageinequality (Greenhouse 2020). Autor was asked, “[D]espite productivity gains of around75% since the 1970s, the average American worker saw their wages increased by only20% since then. There are numerous theories as to what has caused this…. How do youthink this happened?” He responded:
There’s no single answer to that question. I would say there are four reallyimportant forces. One of them is educational attainment—the rate of growth ofeducational attainment in the United States actually slowed in the early 1980s. Sothe rate at which people were completing college, but the demand was growing forcollege-educated workers. And that led to a lot of rising inequality, just because thewages of the more educated rose relative to others….
A second force is the direction of technological change, which has increased thevalue of abstract reasoning of creativity, of expertise, of judgment, and devalued a
74
lot of skilled work that people did that followed well-understood rules andprocedures. So that would be many clerical jobs, phone answering jobs, calculating,accounting, bookkeeping, copying and filing, but also many production jobs, whichoften involved skilled, repetitive tasks. But increasingly once we understand therule book for that type of work, it’s feasible to encode it in software and have itexecuted by machines or by computers. [Autor mentioned two other forces: “tradepressure” and institutional changes that eroded worker protections.]
This section will briefly review the failures of both versions of the automation narrative toexplain the key wage patterns identified in the paper. Our discussion focuses onautomation and not “technology” or “technological change,” since the latter terms imply amore general dynamic than one in which the implementation of new technologies inworkplaces substitutes software and equipment for labor.
The education narrative
The automation story based on educational differentials sees wage inequality as beingdriven by increasing education wage gaps. The reasoning is that workplace automationhas had a “skill bias” in recent decades, meaning that automation has largely just reducedthe demand for a subset of workers—those largely without four-year college degrees. Inmost discussions skill is equated with what people obtain with four-year college degrees.If the supply of college-educated workers keeps up with the demand for collegegraduates driven by ongoing automation, then the wage premium for having a collegedegree will be flat and there will be no increase in wage inequality. If supply fails to keepup with automation-driven relative demand—leading to “skill deficits”—then the relativeprice of college graduates will rise and drive up wage inequality. Some have argued (asmentioned earlier) that the supply of college graduates faltered around 1980 and failed tokeep up with growing demand from ongoing automation.
But for automation to cause a change in wage patterns, technology/automation has tooutrace skills.55 It is not enough for automation to be occurring in workplaces or tocontinue in the same manner as before. Automation, after all, has been a force inworkplaces for over 200 years, while education levels have also grown rapidly. Moreover,it is possible for automation to be a large and ongoing force in shaping the pattern of jobs/occupations (rising white-collar and declining blue-collar employment shares) without itgenerating wage inequality. For instance, automation was ongoing in the 1950s and 1960swhen real median wages rose and wage inequality did not increase.
For a hypothesis to have resonance it should connect the major observations within itspurview, and the theory that skill-biased technological change explains growing wageinequality fails across many dimensions.56
Top 1% wage growth. The leading research promoting education wage differentials as thedriver of overall wage inequality (Katz and Murphy 1992, Goldin and Katz 2008) does notaddress the redistribution to the very top. Some might attempt to explain this as increasedreturns to the skills of executives and professionals in finance corresponding to the rise inthe college wage premium. But there is no persuasive evidence to support a skill
75

explanation for rising top 1% wages and income or, specifically, the superlative executivecompensation growth and expansion in the financial sector that lays behind it (Bivens andMishel 2013).
“The more you learn the more you earn.” The education story, at least as applied to the1980s in Katz and Murphy (1992), offers to explain both the rising 90/50 and 50/10 wagegaps as reflecting the rising relative wage differentials between every level of education:college over some college, some college over high school, high school over less-than-high-school. Such an explanation, however, cannot explain why automation did notgenerate rising education wage differentials between dropouts, high school graduates,and associate college graduates after the 1980s. The flat or declining 50/10 wage gap inthe 30 years after 1987 is inconsistent with the skills-gap narrative, since middle-wageworkers who have more education than low-wage workers have not reaped a growingadvantage since then. Acemoglu and Autor (2012) identified this as a major failure of theeducation narrative in their review of Goldin and Katz (2008). Mishel, Bernstein, andSchmitt (1997a) made that same point years earlier. (The changed behavior of the 50/10wage gap in the 1990s—stable or flat rather than growing, as in the 1980s—has been citedby proponents of the occupational employment polarization story as a motivation foradopting this new framework; see Mishel, Shierholz, and Schmitt 2013 for the history.)
The sharp deceleration in automation-driven relative demand for college graduates in themid-1990s. The college wage premium flattened in the early and mid-1990s. Severalstudies, all by proponents of the automation explanation, found that the impact ofautomation on the relative demand for college graduates substantially declined after themid-1990s relative to earlier decades. Autor (2017) updated the Katz and Murphy (1992)model and showed that the automation-driven relative demand for college graduatesdecelerated by a third in the early to mid-1990s. Goldin and Katz (2007, Table 1) alsoshowed a large deceleration in 1990–2005 relative to earlier decades going back to 1950,noting “a slowdown in demand growth beginning in the early 1990s” (p. 6).
Autor, Goldin, and Katz (2020), updating the Goldin and Katz (2008) metrics from The RaceBetween Education and Technology, confirmed the dramatic deceleration of automation’simpact:
[T]he model’s results…divulge a puzzling slowdown in the trend demand growth forcollege equivalents starting in the early 1990s. Rapid and disruptive technologicalchange from computerization, robots, and artificial intelligence is not to be foundthough the impact of these technologies may not be well captured by this two-factor setup.
Their results (based on Autor Goldin, and Katz 2020, Table A2) show a deceleration ingrowth of relative demand for college graduates in the 1999–2017 period relative to earlierperiods: a 45.8% deceleration relative to the 1979–1999 period and a 41.8% decelerationrelative to the longer 1959–1999 period. The period since 1999, therefore, has been onefeaturing a historically small impact of automation on (relative) demand for collegegraduates.
If automation’s impact has been far less in the last 25 years than in earlier decades, then it
76
cannot explain the ongoing strong or even faster growth of wage inequality in the top half,illustrated by the growth of the 95/50 and 90/50 wage gaps.
It is ironic that just as the education narrative was becoming dominant in the mid-1990sthe actual automation-driven relative demand for college graduates became markedlyslower, negating the story that automation’s impact was accelerating and causinginequality.
Growing within-group wage inequality. The rise of education wage differentials is, at best,only a partial explanation of rising wage inequality because roughly 60% of the increase isdue to greater inequality within education groups (Mishel et al. 2012, Table 4.20; Autor,Goldin, and Katz 2020). Autor, Goldin, and Katz (2020) acknowledge that growing within-group wage inequality is a challenge to the automation narrative.57
Stagnation of wages for college graduates. The story that automation-induced unmetdemand for college graduates is lifting the wages of those with more education whilepunishing the wages of those with less is belied by the actual labor market experience ofcollege graduates. For one, the inflation-adjusted wages of college graduates did not risebetween 2000 and 2014, making the “lifting of the most educated” story not veryconvincing. The widespread use of unpaid internships for college students and graduatesprovides further evidence that employers do not have “unmet needs.” There is also ampleevidence that the wages of entry-level college graduates slumped in the 2000s (Gould2020) and that many young college graduates filled jobs that did not require a collegedegree (Abel and Dietz 2014). The median annual wage of recent college graduates,according to the New York Federal Reserve Board, rose by only 1% from 2000 to 2019,hardly a sign of winning in a race between education and technology/automation.
The slow growth of the college wage premium since 1995 or 2000. This fact makes theeducation wage-gap narrative a prima facie implausible explanation for the growing wagegap in the top half. While the college wage premium grew minimally since 1995 andespecially since 2000, the 95/50 wage gap continued to grow strongly. The log 95/50wage gap rose 0.76 points per year in 1979–2000 and rose even faster, by 1.00 log pointsper year, over 2000–2019 (see Appendix Figure A). In sharp contrast, the key educationwage gap, the college–high school wage premium, grew far more slowly in the latter2000–2019 period—hardly growing at all, just 0.13 log points per year, 87% slower than inthe 1979–2000 period.
As noted above, the growth of the wage gap in the top half, illustrated by the 95/50 or 90/50 gap, is a key wage pattern that needs to be explained, as it was the only source ofgrowing wage inequality other than that of the top 1% in the last three decades. Thesedata show that any explanation of wage inequality based on education wage gaps isimplausible for the period since 2000 (and probably since the mid-1990s). That is, it isimplausible that a sharply decelerating growth of the college wage premium can helpexplain an accelerated growth of the 95/50 wage gap since 2000.
The slowdown of college completion. The education wage-gap narrative sometimesfocuses on the slower growth of college completion post-1979 as the cause of wageinequality. This makes sense within the conventional framework that ignores the role of
77
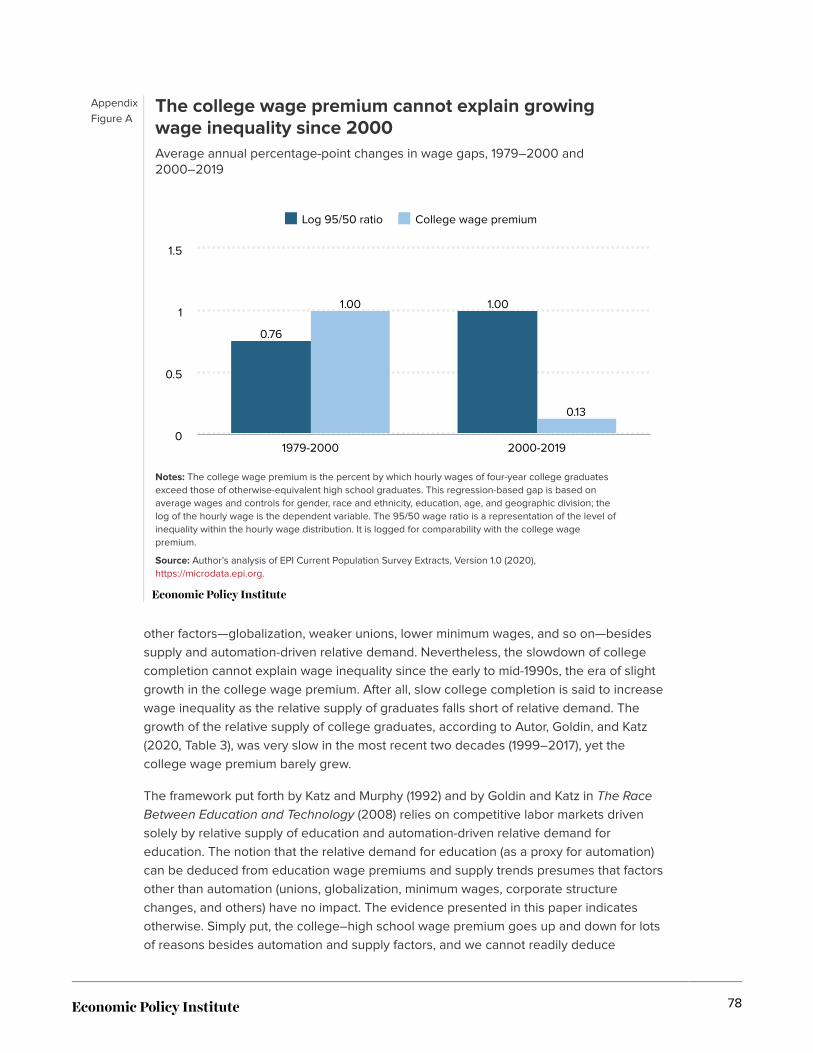
AppendixFigure A
The college wage premium cannot explain growingwage inequality since 2000Average annual percentage-point changes in wage gaps, 1979–2000 and2000–2019
Notes: The college wage premium is the percent by which hourly wages of four-year college graduatesexceed those of otherwise-equivalent high school graduates. This regression-based gap is based onaverage wages and controls for gender, race and ethnicity, education, age, and geographic division; thelog of the hourly wage is the dependent variable. The 95/50 wage ratio is a representation of the level ofinequality within the hourly wage distribution. It is logged for comparability with the college wagepremium.
Source: Author’s analysis of EPI Current Population Survey Extracts, Version 1.0 (2020),https://microdata.epi.org.
0.76
1.001.00
0.13
Log 95/50 ratio College wage premium
1979-2000 2000-20190
0.5
1
1.5
other factors—globalization, weaker unions, lower minimum wages, and so on—besidessupply and automation-driven relative demand. Nevertheless, the slowdown of collegecompletion cannot explain wage inequality since the early to mid-1990s, the era of slightgrowth in the college wage premium. After all, slow college completion is said to increasewage inequality as the relative supply of graduates falls short of relative demand. Thegrowth of the relative supply of college graduates, according to Autor, Goldin, and Katz(2020, Table 3), was very slow in the most recent two decades (1999–2017), yet thecollege wage premium barely grew.
The framework put forth by Katz and Murphy (1992) and by Goldin and Katz in The RaceBetween Education and Technology (2008) relies on competitive labor markets drivensolely by relative supply of education and automation-driven relative demand foreducation. The notion that the relative demand for education (as a proxy for automation)can be deduced from education wage premiums and supply trends presumes that factorsother than automation (unions, globalization, minimum wages, corporate structurechanges, and others) have no impact. The evidence presented in this paper indicatesotherwise. Simply put, the college–high school wage premium goes up and down for lotsof reasons besides automation and supply factors, and we cannot readily deduce
78
automation’s impact from data on wages and education supply.
There have been many critiques of the skills deficit/education wage-gap narrative in thepast, and the analyses have stood the test of time; these include Mishel and Bernstein1994; Mishel, Bernstein, and Schmitt 1997a, 1997b; Mishel and Bernstein 1998; Howell andWieler 1998; Galbraith 1998; Howell 2001; Card and DiNardo 2002; Mishel, Shierholz, andSchmitt 2013; and Howell and Kalleberg 2019.
The job polarization automation narrative
A new automation-causes-wage-inequality narrative emerged around 2005 to replace orsupplement the education wage-gap narrative and to overcome one of the latter’s keyweaknesses—the inability to explain why the 50/10 wage gap grew in the 1980s butflattened or declined in the 1990s. The job polarization story claims that the nature ofautomation changed starting in the 1990s such that automation replaced middle-wageoccupations/jobs more than jobs in low-wage and high-wage occupations. This isdemonstrated by mapping the changes in occupational employment patterns by wagelevel. That is, this story relies heavily on the expansion of low-wage occupationscharacterized by routine manual tasks, the expansion of high-wage occupations requiringabstract, nonroutine tasks, and a corresponding shrinkage of occupations in the “middle,”which perform routine manual tasks.
Autor, Katz, and Kearney (2006) articulated this narrative:
[T]hese models also imply a puzzling deceleration in relative demand growth forcollege workers in the early 1990s, also visible in a recent “polarization” of skilldemands in which employment has expanded in high-wage and low-wage work atthe expense of middle-wage jobs. These patterns are potentially reconciled by amodified version of the skill-biased technical change hypothesis that emphasizesthe role of information technology in complementing abstract (high-education) tasksand substituting for routine (middle-education) tasks.
This occupational employment polarization narrative was introduced into the policy worldin a Center for American Progress/Hamilton Project paper by David Autor (2010) andarticulated as the necessary replacement for the education narrative in Acemoglu andAutor (2012).
But the job or occupational polarization story fails to explain key trends and wagepatterns:
Growth in top 1% wages. The job polarization narrative, as with the education wage-gapnarrative, fails to address the superlative wage growth of the top 1% and top 0.1%, a majordynamic driving wage inequality.
Lack of evidence of job polarization since 1999 or in the 2000s. This was demonstrated inMishel, Shierholz, and Schmitt (2013) and Beaudry, Green, and Sand (2013, 2014) andfurther confirmed in Hunt and Nunn (2019). The key chart in Autor (2010, Figure 1) showedthere was no job polarization in the 1999–2007 period, but that finding was not mentioned
79

in the text. Autor’s paper (2015, 149–50) for the Kansas City Federal Reserve Board’sannual Jackson Hole conference acknowledged the lack of polarization in the post-1999period through 2012, the latest data available at that time:
Although the polarization hypothesis can explain some key features of the U.S. andcross-national data, reality invariably proves more complicated than the theoryanticipates. The clearest evidence for this general dictum is the unexplaineddeceleration of employment growth in abstract task-intensive occupations after2000, which is discussed by Beaudry, Green, and Sand (2013, 2014) and Mishel,Shierholz, and Schmitt (2013)…. The final empirical regularity highlighted by Chart 7is that growth of high-skill, high-wage occupations (those associated with abstractwork) decelerated markedly in the 2000s, with no relative growth in the top twodeciles of the occupational skill distribution during 1999 through 2007, and only amodest recovery between 2007 and 2012. Stated plainly, the U-shaped growth ofoccupational employment came increasingly to resemble a downward ramp in the2000s.
A “downward ramp” and the absence of the “U-shaped growth of occupational employ-ment” are acknowledgments, though expressed in a not-very-straightforward manner, thatjob polarization was not present between 1999 and 2012.
Obviously, a narrative based on the changing composition of employment by occupation(expanding low-wage and high-wage occupations and shrinking middle-wageoccupations) cannot be relevant to explaining post-1999 wage patterns if thoseoccupational employment patterns have not been evident. In fact, the Autor (2014) datashow that nearly all of the employment growth was in low-wage occupations, a patternthat does not readily explain why the wage gap between the top and the middle keptexpanding and did so at an accelerated pace. For occupational employment patterns toexplain top-half wage-gap growth would require finding a rapidly expanding need for high-wage workers able to carry out abstract, nonroutine tasks, a pattern not present since1999.
Lack of a relationship between occupational employment patterns and wage inequality.Remarkably, the job polarization narrative relies on mapping occupational employmentpatterns to explain wage inequality but has never presented evidence that theseoccupational employment shifts affect wages. In fact, Mishel, Shierholz, and Schmitt (2013)show that changes in occupational employment shares (whether an occupation expandsor contracts employment relative to other occupations) are not related to changes inrelative wages by occupation (whether wages in that occupation rose or fell relative towages in other occupations). That is, one would expect that occupations that expand(contract) would have rising (falling) wages relative to other occupations. Looking at therelation between changes in occupational employment shares and the correspondingrelative wages of occupations, Mishel, Shierholz, and Schmitt (2013) found no relationshipin each of the decades of the 1980s, 1990s, and 2000s. It is also worth noting that middle-wage occupations have shrunk and higher-wage occupations have expanded since the1950s, but median wages and wage inequality have risen and fallen over this time with noapparent correspondence to job polarization trends.
80

If occupational employment patterns do not affect occupational relative wages, then theycertainly bear no relationship to changes in wage inequality, since presumably themechanism for automation to cause changes in wage gaps is for automation-inducedchanges in occupational employment patterns to alter the relative wages of occupations.The effort to track occupational employment patterns has no implications forunderstanding wage patterns.
Footprints of automation
The discussion so far has relied on economic analyses that derive the pace and skill biasof automation from patterns of occupational employment growth or from wage andeducation supply trends. It is worthwhile to examine other perhaps more direct footprintsof automation to discern the pace of automation in recent years compared to earlierperiods. These data are illustrated in Appendix Figure B, drawn from Mishel and Bivens(2017) and Mishel and Shierholz (2017).
Automation is what occurs as new technologies are incorporated along with new capitalequipment or software to replace human labor in the workplace. Labor productivity andcapital investment are both measures of automation in that they necessarily accompanythe substitution of capital for labor. Thus, if there were a recent surge of robots orautomation, we would expect to see the footprints in trends in productivity, capitalinvestment, and software investment. The trends shown in the figure suggest thatautomation has been far slower since 2002 than in the three earlier periods: the earlypostwar years from 1973 to 1973; from 1973 to 1995; and over the high-tech boom years of1995–2002. There is certainly no evidence of automation having accelerated. These dataaffirm the findings above that automation, given its slow pace in recent years, is unlikely tohave been a major factor driving wage stagnation or wage inequality in the last twodecades.
Automation (along with shifts in consumer demand and trade) would be expected to be amajor factor in why employment in some occupations expands and employment in otheroccupations declines. Therefore, we can also examine the pace of change in theoccupational composition of employment to deduce trends in automation.
Using the data in Atkinson and Wu (2017), Mishel and Bivens (2017) computed a metric toexamine the pace of occupational employment shifts in each decade. Specifically, Misheland Bivens examined the shares of total employment for each of the 250 occupations inthe data for the beginning and end years of each decade and computed the changes inthese shares. The sum of the occupational share gains will automatically be equal to theoccupational share losses, so the metric of change in each decade is half the sum of theabsolute change in employment shares. This metric adjusts for differences in the rate ofemployment growth in each decade and the absolute employment size of individualoccupations. This metric of shifts in occupational employment measures the shares of totalemployment exchanged between occupations that gain and occupations that loseemployment shares each decade.
Mishel and Bivens found that occupational employment changes were “fairly uniform over
81
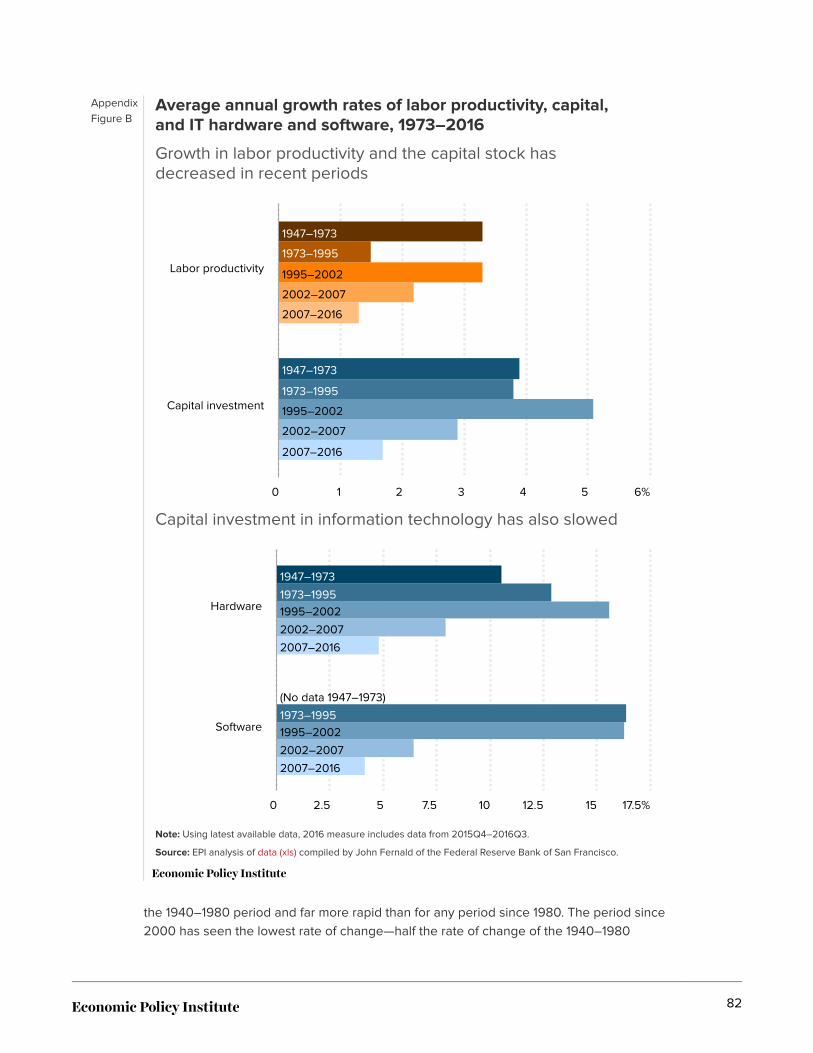
AppendixFigure B
Average annual growth rates of labor productivity, capital,and IT hardware and software, 1973–2016
Note: Using latest available data, 2016 measure includes data from 2015Q4–2016Q3.
Source: EPI analysis of data (xls) compiled by John Fernald of the Federal Reserve Bank of San Francisco.
Growth in labor productivity and the capital stock hasdecreased in recent periods
Capital investment in information technology has also slowed
2007–2016
2007–2016
2002–2007
2002–2007
1995–2002
1995–2002
1973–1995
1973–1995
1947–1973
1947–1973
Labor productivity
Capital investment
0 1 2 3 4 5 6%
2007–2016
2007–2016
2002–2007
2002–2007
1995–2002
1995–2002
1973–1995
1973–1995
1947–1973
(No data 1947–1973)
Hardware
Software
0 2.5 5 7.5 10 12.5 15 17.5%
the 1940–1980 period and far more rapid than for any period since 1980. The period since2000 has seen the lowest rate of change—half the rate of change of the 1940–1980
82

period.” These findings indicate that the pace of occupational employment shifts wasextremely slow in the 2000s, affirming the deceleration found in the slower growth inproductivity, software, and capital investments identified in Appendix Figure B.
83
Appendix B: The intentionality ofmacroeconomic policiesThere is a growing recognition that unemployment was kept excessively high for thepurpose of inflation control over long periods after 1979. Could this have been simply atechnocratic mistake, an instance of policymakers underestimating the sacrifice that wouldbe required to keep inflation in check? We think this proposition lets policymakers off thehook too easily.
First, it was completely predictable who would bear the brunt of a contractionarymacroeconomic shock, and Fed policymakers, charged with maintaining high employmentas well as stable prices, were obligated to construct some portfolio of policies designed tocushion the shock.
Second, macroeconomic policymakers and particularly the Federal Reserve consistentlyovershot their own conservative estimates of the NAIRU—the nonaccelerating inflationrate of unemployment—during most of the 1979–1995 period. Rather than aiming forstable inflation after the 1970s episode of accelerating inflation, they sought to reduceinflationary expectations to a very small number, and they were willing to tolerate theextended periods of unemployment this required.
Finally, if going the severe contractionary route was a technocratic mistake, it was a foolishone. Keeping unemployment rates above the “natural rate” is an expensive way to reduceinflation, especially since evidence that inflation rates like those experienced in the UnitedStates in the 1970s are deeply damaging is very hard to find. In the U.S. postwarexperience, there is no consistent relationship between inflation rates and aggregategrowth. But large distributional shifts can occur with unanticipated bursts of inflation.Inflation does indeed reduce the real value of wealth stocks, but it also reduces the realvalue of liabilities. In essence, it causes a redistribution from net creditors to net debtors.So, for example, Americans who bought a home with a fixed-interest-rate mortgage in thelate 1960s or early 1970s saw a windfall wealth gain as inflation eroded the real burden oftheir mortgage obligation. Inflation hawks tend to emphasize particularly sympatheticeconomic actors who might be hurt by this—retirees living on fixed incomes, for example.Of course, even by the 1970s most retirees’ incomes mainly comprised Social Securitybenefits, which were largely shielded from price increases.
Against these uncertain aggregate benefits, policymakers should weigh the extremelylarge and regressive costs of recessions engineered largely to break inflationaryexpectations. The recessions of the early 1980s and 1990s were both caused in large partby interest rate hikes undertaken by the Federal Reserve to reduce inflation. Thecumulative output loss of the two early 1980s recessions approached 80% of one year’sgross domestic product (GDP) at the time, while the early 1990s recession exacted acumulative cost of nearly one-third of one year’s GDP.
84

Were these costs necessary for reducing the 1970s inflation? While the 1970s inflation wasthe first in post-1900 U.S. history to not to be associated with a war effort, its cause wasnot mysterious: It was the combination of oil price shocks caused by political unrest in theMiddle East and the global slowdown in productivity growth. The real price of oil tripled in1973 (the Yom Kippur War), declined after 1975, and doubled again in 1979 (the IranianRevolution). These exogenous oil shocks were amplified by wage-price spirals, as bothfirms and workers tried to raise the nominal prices under their control (product prices andwages, respectively) to avoid bearing the full brunt of adjusting to higher input costs, allwithout realizing that the economy’s underlying capacity to deliver income growth(productivity) had slowed markedly.
Implicit in this analysis is a view that inflation is at least in part an outcome not just of over-accommodative macroeconomic policy (the conservative view), but of distributionalconflict between capital and labor. When bargaining power is more equal, exogenousprice shocks take longer to propagate through the economy and cause higher and morepersistent inflation. After an exogenous price shock, firms raise their price level topreserve profit margins, at the expense of real (inflation-adjusted) wages. Workers whohave some degree of bargaining power can respond by demanding higher nominal wagesto claw back the lost ground. Firms then pass on the higher wage costs into higher pricesand so on. The longer this process goes on, the steeper and more persistent is theinflation. Conversely, if firms are able to pass on higher prices in response to the initial costshock and workers lack the bargaining power to demand higher nominal wages inresponse, then the shock is muted and leads to lower and less persistent inflation.
What made the oil price shocks especially effective in generating wage-price spirals in the1970s were the atypically strong perceptions held by American workers about their ownbargaining power, as well as expectations of real wage growth fostered by decades ofrapid and equal economic growth.
Coming into the 1970s, American workers had experienced wage growth on par withproductivity growth for most of the past three decades, and this productivity growthaveraged 2% per year. They had also come off a decade from 1959 to 1969 whenunemployment averaged 4.8% and reached a low of 3.5% in 1969. Further, key laborstandards in the U.S. labor market were strong in historical terms. Private-sectorunionization rates were 24.2% in 1973, more than twice as high as they are today. Theinflation-adjusted value of the minimum wage reached its highest point ever in 1968 afterthree decades of rising (roughly) with economywide productivity.
An objection to an analysis putting the 1970s inflation at the feet of wage-price spirals hastraditionally been that it implicitly blames workers for inflation’s rise, and seems toacknowledge the need for reducing workers’ bargaining power as an anti-inflationstrategy. This line of thinking is unjustified and unfair. The root causes of the inflationaryepisode of the 1970s were two oil price shocks, and a wage-price spiral following such anexogenous shock requires, by definition, both wages (driven by workers’ desire to protectwages’ purchasing power) and prices (driven by firms’ desire to protect their profitmargins) to rise. Blaming this spiral on the workers’ side alone is unfair, but typical in ourframing of labor-capital conflicts. We’re more likely to hear about “labor militancy” rather
85
than “capital militancy” when the subject is wage-price spirals, but this is probablybecause it is taken as given that capital will be militant and usually effective in protectingits share of income. Times must be truly remarkable when the economic context allowslabor to push back and protect its gains.
Galbraith (1997) makes the obvious inference from this episode:
It would therefore be reasonable to approach anti-inflation policy in general as amatter, first and foremost, of designing circuit breakers for shock episodes, so as toreduce the cost of adjusting to a new pattern of relative prices and therefore theneed to do it through the brute-force method of mass unemployment. Some simplesteps, like coordinating the timing of wage bargains and providing the presidentwith limited discretion over cost-of-living adjustments in Social Security, federalpensions and other payment streams might help a great deal….
In short, the fact that the 1970s inflation was tamed by the severe contractionary approachdoes not mean that the approach was most efficient way to tame this inflation, or that thebenefits outweighed the costs imposed on the broader economy.
86

Notes1. The Republican Party platform reads: “Our economy has become unnecessarily weak with
stagnant wages. People living paycheck to paycheck are struggling, sacrificing, and suffering.”The Democratic platform reads: “But too many Americans have been left out and left behind. Theyare working longer hours with less security. Wages have barely budged and the racial wealth gapremains wide, while the cost of everything from childcare to a college education has continued torise.”
2. The 44.6% growth is the growth of wages on average over the 1979–2019 period and representswhat each group would have experienced absent changes in the distribution of wages.
3. This acceleration is reflected in the growth of the log 95/50 wage gap, which grew 0.75 log pointsannually from 1979 to 1995 and by 1.0 log points from 2000 to 2019, using the same data as in thefigures.
4. This college–high school wage premium is the premium estimated using log hourly wages, andthe controls are for gender, race and ethnicity, education, age, and geographic division. Thepremium is the coefficient on “college,” having a four-year degree but no further education, as theomitted category is “high school.” The sample is wage and salary workers ages 16 and older in theCPS-ORG data; the data are available at https://www.epi.org/data/#?subject=wagegap-coll.
5. See Table A2 in Autor, Goldin, and Katz 2020. The relative supply of college graduates grew 1.96log points annually from 1999 to 2017, down from 2.28 log points annually from 1979 to 1999. Thisdeceleration of supply should have led to a faster growth of the college wage premium.
6. The most recent version of this chart can be found at https://www.epi.org/productivity-pay-gap/.
7. In addition to these two factors, Bivens and Mishel also identified differential trends in the pricedeflators used to measure productivity and real median hourly compensation. Since our focus ison the inequality-generating factors–inequality within compensation or a shift toward labor’s shareof income—we compute the divergence so as to exclude the impact of differing price deflators(using the CPI-U-Rs to deflate both productivity and median hourly compensation).
8. Restoring labor’s share to 82.4% means a 9.1% across-the-board increase (82.4/75.5 = 9.1%) incompensation); falling to 75.5% is an 8.4% cut ((75.5/82.4 – 1) = 8.4%).
9. This conclusion is based on regression-based estimates of the Black–white wage gap. Wages areadjusted into 2018 dollars using the CPI-U-RS. The regression-based gap is based on averagewages and controls for gender, race and ethnicity, education, age, and geographic division. Thelog of the hourly wage is the dependent variable. See https://www.epi.org/data/#?subject=wagegap-bw.
10. See https://www.epi.org/data/#?subject=wage-education.
11. The range in each estimate brackets the regression results from using state-specificunemployment rates to predict wage growth, as Bivens and Zipperer (2018) did, and results fromusing national time-series data only. The lower state-specific results likely stem predominantlyfrom smaller and noisier samples at the state level.
12. Estimates of the wage impact of unemployment on the median and 10th percentile wage are fromBivens and Zipperer 2018, Figure F. The impact of 1 percentage point higher unemployment
87

lowers the median wage by 0.459 and 0.296 in the earlier and latter period and lowers the 10thpercentile wage by 0.582 and 0.243 in the earlier and latter period.
13. See Bivens and Zipperer 2018 for a demonstration of how including the post-2008 periodreduces the coefficient on unemployment in a wage Phillips curve, and Bivens 2019 for coefficientestimates for just the post-2007 period.
14. These data are the share with collective bargaining coverage for “1979,” calculated as an averageof 1977–1980 shares from May CPS data.
15. This discussion draws heavily from Bivens et al. 2017.
16. Evidence for these effects can be found in Mishel et al. 2012: union impact and coverage bydemographic groups (Table 4.33) and by education, occupation, and wage fifth (Table 4.37).
17. These estimates look at what wages would have been in 2013 had union density remained at its1979 levels.
18. Fortin, Lemieux, and Lloyd (2021) find a 7.6 log point impact of deunionization on the median. Thisamount includes both direct and spillover impacts. Their estimate of the direct union impact on the90/50 wage gap is 52.8% of the total union impact. Applying that share to 7.6 points yields a 4.0log point estimate of a direct union effect on the median wage. Anna Stansbury provided abenchmark for comparisons to the Fortin, Lemieux, and Lloyd results based on her work withSummers (2020): “We estimate for the nonfinancial corporate sector a direct effect of uniondecline on labor rents for noncollege workers of 2.9 percent of compensation over 1984 to 2016.”The Fortin, Lemieux, and Lloyd estimates line up close to, even below, the Stansbury-Summersestimate if one adjusts the Stansbury-Summers results for the longer time period used by Fortin,Lemieux, and Lloyd, 1979–2017. There was a very steep decline in union membership from 1979 to1984, comprising 40% of the total decline from 1979 to 2016. If one scales the Stansbury-Summersestimate to the total decline since 1979, their estimated impact would be 4.8% (2.9% × [1/60.4%]),an even larger impact than Fortin, Lemieux, and Lloyd.
19. Western and Rosenfeld find that deunionization’s impact (direct and spillover) on wage inequalityexplained 33.9% of male wage inequality and 20.4% of women’s wage inequality. The comparableestimate for Fortin, Lemieux, and Lloyd (2021) is deunionization explaining 28.8% and 6.7%,respectively, of men’s and women’s wage inequality.
20. Farber et al. (2021, 33) note: “We show that a combination of low-skill composition, compression,and a large union income premium made mid-century unions a powerful force for equalizing theincome distribution.” Specifically (p. 24): “During our long sample period, the union premium hasremained between ten and twenty log points, with the less-educated receiving an especially largepremium. Moreover, the negative effect of unions on residual income variance is large and alsorelatively stable over time. By contrast, selection into unions is not constant across time. In theGreat Compression period, when unions were at their peak and inequality at its nadir,disadvantaged households were much more likely to be union members than either before orsince.”
21. This conclusion leaves open, however, the question of how useful or good the status quo rules ofthe game governing globalization are, even aside from any downward pressure they may put onAmerican workers’ wages. For example, these rules’ effects on the economic developmentpossibilities of poorer countries or the ability of all countries to tax mobile capital are incrediblyimportant issues in their own right. Saying that the downward wage pressure of the globalizationstatus quo could be overcome with an aggressive domestic policy response does not imply thatthis status quo should be preserved.
88
22. This estimate is based on the impact of raising the minimum to $15 in 2025 and including theimpact on those who received minimum wage increases at the state or local level since 2017. Thisestimate understates the share of earners affected since it ignores those in states that had ahigher minimum than the federal threshold minimum wage in 2017 but did not increase it furthersince then.
23. This calculation refers to net productivity growth (output per hour taking depreciation intoaccount). Average wage data are drawn from NIPA data, deflated by the CPI-U-RS.
24. Increase from July 2019 to October 2025, as per analysis in Cooper 2019.
25. This estimate assumes 0.5% real wage growth in the median worker’s wage from 2019 to 2025.One obtains similar results if one examines the real value of the minimum wage relative to theaverage hourly earnings of production/nonsupervisory workers.
26. See https://www.dol.gov/agencies/whd/minimum-wage/history.
27. The analysis provides estimates of the impact of the higher threshold on weekly hours (Table 21)and weekly wages (Table 22). These data allow a computation of the before and after hourlywages that are the basis for these estimates.
28. Those affected on the post-1979 erosion of the salary threshold include three groups. The firstare those directly affected by the raising of the salary threshold as proposed by the Department ofLabor, the 4.2 million receiving a 1% hourly wage boost. The second group are the broader group,the 8.9 million affected by the 2016 rule change. There was probably a smaller than 1% wageimpact for this group, since it is generally more educationally downscale than those directlyaffected (see Shierholz 2019 analysis of the education composition of those enjoying newprotections versus “strengthened protections” from the 2016 rule change). The remaining groupare those who earned above the 2016 rule change and the salary threshold in 1979.
29. See Table 1 in Gould 2018 for the decile cutoffs in 2017.
30. Judged by the share of the workers covered in 1979, 39.8%, compared to those who would havebeen covered by the 2016 rule in 2015, 32.7% (Kimball and Mishel 2016).
31. This section draws heavily on Shierholz 2021.
32. Calculated as 0.68 * 0.1495 = 0.102.
33. “I was also struck by commentary from leaders at digital platforms in Silicon Valley, as well as ourown discussions with executives, venture capital companies, and workers. Most indicated thatthey viewed an independent contractor status as the default option for employment” (Weil 2017).
34. For instance, a rise of 3.1 percentage points of the entire private nonagriculture workforce yieldsa 0.5% or 0.9% wage reduction if misclassified workers are paid, respectively, 15% or 30% lessthan regular W-2 workers. Similarly, a rise of 4.6 percentage points among the bottom two-thirds ofthe private nonagriculture workforce yields a 0.7% or 1.4% wage reduction if misclassified workersare paid, respectively, 15% or 30% less than regular W-2 workers.
35. This discussion borrows heavily from Costa 2019.
36. For additional discussion and context on OECD’s findings, see Costa and Martin 2019.
37. Also see the literature review in Ortega and Hsin 2018 for evidence of wage disparities betweenunauthorized and authorized workers.
89
38. Starr, Prescott, and Bishara (2020, 15) state: “The ability to enforce noncompetes shouldencourage greater noncompete use, more investment, and higher wages, but employers usenoncompetes virtually as often in states where they are clearly unenforceable.” Starr, Prescott, andBishara (2019) find “that noncompetes are associated with reductions in employee mobility andchanges in the direction of that mobility (i.e., toward noncompetitors) in both states that do and donot enforce noncompetes…. [W]e find that employees with noncompetes—even in states that donot enforce them—frequently point to their noncompete as an important reason for decliningoffers from competitors.”
39. BLS data on “median weekly earnings of full-time wage and salary workers by detailedoccupation and sex” at https://www.bls.gov/cps/cpsaat39.pdf show weekly earnings for full-timeworkers in construction and installation, maintenance, and repair occupations at, respectively, 94%and 102% of U.S. weekly earnings. The noncompete ban estimates are in Figure 5 using fixedeffects and controls. Mike Lipsitz kindly provided the exact estimates.
40. The incidence of noncompetes in construction occupations (12%) was a bit below the average(14%), while that for installation, maintenance, and repair occupations was above average (18%)(Figure 5, Starr, Prescott, and Bishara 2020).
41. As Starr (2019b) suggests, “it’s not clear if different establishments owned by separate franchisesshould be considered competing entities.”
42. Technology plays a role in that communications and other technologies better enable firms tomonitor dispersed economic activity and monitor the fulfillment of standards. Key researchers inthis field have noted the enabling role of technological changes. Weil (2014) wrote, “Informationand communications technologies have enabled this hidden transformation of work.” Bernhardt etal. (2016) write: “New information and communications technologies (ICT) have facilitatedoutsourcing and the decentralization of producing goods and services because ICT lowers thecosts of information processing and coordination of work across organizational boundaries,thereby reducing the cost advantages of internal production. ICT also enhances firms’ capabilitiesto monitor and enforce contracts with external suppliers, thereby reducing the relative advantagesof hierarchy. ICT allows firms to achieve control over productive activities—the advantages ofvertical integration—without assuming the risks of actual ownership or the inflexibility ofbureaucracy.”
43. Self-employment or independent contracting has been stable for the last 25 years, contrary tothe hype about how we are all becoming gig workers and freelancers. The Contingent WorkerSurvey (CWS) (BLS 2018), the gold standard of data tracking “alternative work arrangements,”found that in 2017 those who were independent contractors (and do not themselves have anyemployees) on their main job comprised about 7% of all employment, the same as in 1995 and2005 (BLS 2018). Analysis of tax data through 2016 (Collins et al. 2019) showed that “consistentwith the 2017 CWS results, we find no evidence that ‘traditional’ work arrangements are beingsupplanted by independent contract arrangements reported on 1099s.”
44. There was a modest growth in employment in “staffing firms” as the share of private payrollemployment in “employment services” grew from 2.5% in 1995 to 2.9% in 2018 (see Bureau ofLabor Statistics Current Employment Statistics (CES) Series CES0500000001 andCES6056130001). Staffing employment in 2018 was actually lower than what prevailed at the startof the last two business cycles in 2000 (3.5%) and 2007 (3.1%). However, the composition ofstaffing employment shifted as the presence increased greatly in manufacturing (Mishel 2018).
45. Franchising is a part of fissuring to the extent that the franchisee is not simply a retail outlet forthe franchisor (“traditional franchising”) but actually “relies on the transfer of a complete business
90
format and methods—including extensive business support (e.g., training of the franchisee) andongoing monitoring from the franchisor,” called “business template franchising” (Kosová andLafontaine 2012). Unfortunately, it is hard to track trends in franchising because there are norecent data beyond 2012 (yet), and the data for 2007 and 2012 are not necessarily comparable towhat is available in the 1980s and 1990s. Business-format franchisees provided 5.5% and 5.3% oftotal private-sector employment, respectively, in 2007 and 2012 (this assumes that business-format franchising represents the same share of total franchising employment in 2012 as in 2007).We do not know how much business-format franchising has grown since 2012. We have somehistorical information on total franchising but not for business-format franchising. According to adiscontinued Department of Commerce series of publications, Franchising and the Economy, theshare of (all) franchising in private employment was 6.3% in 1978 and 7.9% in 1986, somewhathigher than the 6.8% and 6.5% employment shares in, respectively, 2007 and 2012. Given thattraditional franchising has fallen since the late 1970s, we can assume that business-formatfranchising has increased since the late 1970s, though we do not know how much. (Lafontaine andBlair [2009] say that “the value of goods sold via outlets of business-format franchisors hasincreased from 2.3% to 3.5% of total GDP” between 1972 and 1986, but we could not locate in theDepartment of Commerce data they cite any reference to business-format franchising. IfLafontaine and Blair are correct, then business-format franchising in the 2007–2012 period was onthe same scale as in the 1972–1986 period.) In sum, we know that the type of franchisingassociated with fissuring represented 5% or so of total private employment in the most recent dataavailable (for 2012) and did not necessarily significantly grow in the prior decades. This type offissured franchising may have grown since 2012, however.
46. Analysis of the Census Bureau’s Longitudinal Business Database.
47. Weil bases this estimate on an analysis undertaken for investors by A/B Bernstein.
48. Stansbury and Summers (2020, 27–28) argue: “In addition, while a fall in worker rent-sharingpower should not have any implication for firms’ underlying markups (which are determined bytheir product market power), it does have implications for measured markups. This is becausemeasures of aggregate markups used in recent literature depend on firms’ costs, including firms’labor costs—even if the labor costs partly represent rents accruing to labor as well as the truemarginal cost of production. This implies that markups, as they have been measured in recentpapers, cannot be used to distinguish between a story of rising product market power and a storyof falling worker power: a rise in measured markups could reflect a fall in worker rent-sharingpower just as much as it could reflect a rise in true markups and firms’ monopoly power.”
49. Measurement of labor’s share described in Bivens 2019 and the data are available at theNominal Wage Tracker: https://www.epi.org/nominal-wage-tracker/.
50. Personal communications with Wilmers. Data based on Figure 1 of Wilmers 2018.
51. Based on personal communications and Wilmers 2018 (p. 230): “[G]rowing buyer power from1979 to 2014 accounts for around 10 percent of the [35 percentage point] decline in earningsgrowth relative to the 1955 to 1978 trend.”
52. This discussion borrows heavily from Mishel, Schmitt, and Shierholz 2014.
53. “The percentage of male workers in the upper middle of the distribution, with hourly wagesbetween $7.50 and $12.50 in 1979 dollars, fell from 52 percent to 38 percent in deregulatedindustries, whereas it fell only from 33 percent to 26 percent in other industries” (Fortin andLemieux 1997, 85).
54. The ratio of compensation to wages, reflecting the scale of nonwage benefits, rose from 1.220 in
91
1979 to just 1.229 in 2017. See Bivens and Mishel 2015 for details on the data construction.
55. Mishel and Bernstein (1994) referred to this as the need to show “acceleration of technology/automation.”
56. The term “college graduate” in this discussion is explicitly restricted to those with a four-yearbachelor’s degree and excludes those with “some college” or an associate degree and those withan advanced degree beyond a bachelor’s. Some discussions lump the college and advanceddegree returns or supply together. That can be misleading when the evidence is used to suggestwe increase the number of college graduates if, in fact, the evidence may suggest we need morepost-college graduates.
57. Some researchers have asserted, without any empirical backup, that within-group inequalityreflects the returns to unobservable (not captured by any metric in our regular data) skills. That is,of course, the only way to preserve the skill-biased technological change story without having tolook beyond pure supply-and-demand factors. It is not, however, persuasive without furtherevidence or even some conjecture about what patterns we would expect returns to unobservedskills to display.
ReferencesAbel, Jaison R., and Richard Deitz. 2014. “Are the Job Prospects of Recent College GraduatesImproving?”Liberty Street Economics (Federal Reserve Bank of New York blog), September 4.
Acemoglu, Daron, and David Autor. 2011. “Skills, Tasks and Technologies: Implications forEmployment and Earnings.” In Handbook of Labor Economics, edited by Orley Ashenfelter andDavid Card, 4, part B: 1043–171. Elsevier.
Acemoglu, Daron, and David Autor. 2012. “What Does Human Capital Do? A Review of Goldin andKatz’s The Race between Education and Technology.” Journal of Economic Literature 50, no. 2:426–63.
Apgar, Lauren A. 2015. “Authorized Status, Limited Returns: The Labor Market Outcomes ofTemporary Mexican Workers.” Economic Policy Institute.
Appel, Sam, and Carol Zabin. 2019. “Truck Driver Misclassification: Climate, Labor and EnvironmentalJustice Impacts.” UC Berkeley Labor Center.
Appelbaum, Eileen. 2017. “Domestic Outsourcing, Rent Seeking, and Increasing Inequality.” Reviewof Radical Political Economics 49, no. 4: 513–28.
Appelbaum, Eileen, and Rose Batt. 2014. Private Equity at Work: When Wall Street Manages MainStreet. Russell Sage Foundation.
Atkinson, Robert D., and John Wu. 2017. “False Alarmism: Technological Disruption and the U.S.Labor Market, 1850–2015.” Information Technology & Innovation Foundation.
Autor, David. 2010. “The Polarization of Job Opportunities in the U.S. Labor Market: Implications forEmployment and Earnings.” Center for American Progress and Brookings Institution: The HamiltonProject.
Autor, David. 2014. “Polanyi’s Paradox and the Shape of Employment Growth.” Working Paper 17040.National Bureau of Economic Research. https://doi.org/10.3386/w20485.
92
Autor, David. 2015. “Polanyi’s Paradox and the Shape of Employment Growth.” Reevaluating LaborMarket Dynamics (Federal Reserve Bank of Kansas City, Economic Policy Proceedings), 129–77.
Autor, David. 2016. “Will Automation Take Away All Our Jobs?” TEDxCambridge.
Autor, David. 2017. “How Long Has This Been Going On? A Discussion of ‘Recent Flattening in theHigher Education Wage Premium: Polarization, Skill Downgrading, or Both?’ by Robert G. Valletta.”Massachusetts Institute of Technology.
Autor, David H., David Dorn, and Gordon H. Hanson. 2013. “The China Syndrome: Local Labor MarketEffects of Import Competition in the United States.” American Economic Review 103, no. 6, 2121–68.
Autor, David, David Dorn, Lawrence F. Katz, Christina Patterson, and John Van Reenen. 2017a.“Concentrating on the Fall of the Labor Share.” American Economic Review: Papers & Proceedings107, no. 5: 180–85.
Autor, David, David Dorn, Lawrence F. Katz, Christina Patterson, and John Van Reenen. 2017b. “TheFall of the Labor Share and the Rise of Superstar Firms.” Working Paper. Massachusetts Institute ofTechnology.
Autor, David, Claudia Goldin, and Lawrence F. Katz. 2020. “Extending the Race Between Educationand Technology.” AEA Papers and Proceedings 110: 347–51.
Autor, David H., Lawrence F. Katz, and Melissa S. Kearney. 2006. “The Polarization of the U.S. LaborMarket.” American Economic Review 96, no. 2: 189–94.
Autor, David H., Lawrence F. Katz, and Melissa S. Kearney. 2008. “Trends in U.S. Wage Inequality:Revising the Revisionists.” Review of Economics and Statistics 90, no. 2: 300–23.
Autor, David, Alan Manning, and Christopher Smith. 2010. “The Contribution of the Minimum Wage toU.S. Wage Inequality over Three Decades: A Reassessment.” Massachusetts Institute of TechnologyWorking Paper.
Autor, David, Alan Manning, and Christopher Smith. 2016. “The Contribution of the Minimum Wage toU.S. Wage Inequality over Three Decades: A Reassessment.” American Economic Journal: AppliedEconomics 8, no. 1: 58–99.
Azar, José, Ioana Elena Marinescu, and Marshall Steinbaum. 2017. “Labor Market Concentration.”National Bureau of Economic Research Working Paper no. 24147. https://doi.org/10.3386/w24147.
Azar, José, Ioana Marinescu, and Marshall Steinbaum. 2019. “Measuring Labor Market Power TwoWays.” AEA Papers and Proceedings 109.
Balasubramanian, Natarajan, Jin Woo Chang, Mariko Sakakibara, Jagadeesh Sivadasan, and EvanStarr. 2020. “Locked In? The Enforceability of Covenants Not to Compete and the Careers of High-Tech Workers.” Journal of Human Resources no. 1218-9931R1.
Barkai, Simcha. 2020. “Declining Labor and Capital Shares.” Journal of Finance 75, no. 5: 2421–63.
Bassier, Ihsaan, Arindrajit Dube, and Suresh Naidu. 2020. “Monopsony in Movers: The Elasticity ofLabor Supply to Firm Wage Policies.” Working Paper 27755. National Bureau of Economic Research.
Batt, Rosemary, Virginia Doellgast, and Hyunji Kwon. 2006. “Service Management and EmploymentSystems in U.S. and Indian Call Centers.” In Brookings Trade Forum 2005: Offshoring White-CollarWork—The Issues and Implications, edited by Susan M. Collins and Lael Brainard. BrookingsInstitution.
93
Batt, Rosemary, David Holman, and Ursula Holtgrewe. 2009. “The Globalization of Service Work:Comparative Institutional Perspectives on Call Centers.” Industrial & Labor Relations Review 62, no.4: 453–88.
Batt, Rosemary, and Hiro Nohara. 2009. “How Institutions and Business Strategies Affect Wages: ACross-National Study of Call Centers.” Industrial & Labor Relations Review 62, no. 4: 533–52.
Beaudry, Paul, David A. Green, and Benjamin M. Sand. 2013. “The Great Reversal in the Demand forSkill and Cognitive Tasks.” Working Paper 18901. National Bureau of Economic Research.
Beaudry, Paul, David A. Green and Benjamin M. Sand. 2014. “The Declining Fortunes of the YoungSince 2000.” Papers and Proceedings of the 126th Annual Meeting of the American EconomicAssociation 104, no. 5: 381–6.
Benmelech, Efraim, Nittai Bergman, and Hyunseob Kim. 2018. “Strong Employers and WeakEmployees: How Does Employer Concentration Affect Wages?” Working Paper 24307. NationalBureau of Economic Research.
Bensman, David. 2009. Stuck on the Low Road: Deregulation Turned Truck Driving from a Good Jobto a Bad One. American Prospect, September.
Bergen, Mark, and Josh Eidelson. 2018. “Inside Google’s Shadow Workforce.” Bloomberg News, July25.
Berlinski, Samuel. 2008. “Wages and Contracting Out: Does the Law of One Price Hold?” BritishJournal of Industrial Relations 46, no. 1: 59–75.
Bernhardt, Annette, Rosemary Batt, Susan Houseman, and Eileen Appelbaum. 2016. “DomesticOutsourcing in the United States: A Research Agenda to Assess Trends and Effects on Job Quality.”Working Paper 16-253. Upjohn Institute.
Bernhardt, Annette, Ruth Milkman, Nik Theodore, Douglas Heckathorn, Mirabai Auer, JamesDeFilippis, Ana Luz González, Victor Narro, Jason Perelshteyn, Diana Polson, and Michael Spiller.2009. Broken Laws, Unprotected Workers: Violations of Employment and Labor Laws in America’sCities. Center for Urban Economic Development, National Employment Law Project, and UCLAInstitute for Research on Labor and Employment.
Bivens, Josh. 2010. Failure by Design: The Story Behind America’s Broken Economy. Ithaca, N.Y.:Cornell Univ. Press.
Bivens, Josh. 2013. “Using Standard Models to Benchmark the Costs of Globalization for AmericanWorkers Without a College Degree.” Economic Policy Institute.
Bivens, Josh. 2017a. Adding Insult to Injury: How Bad Policy Decisions Have AmplifiedGlobalization’s Costs for American Workers. Economic Policy Institute.
Bivens, Josh. 2017b. “President Trump’s Alternative Facts Have Foreigners and Bureaucrats, Not theTop 1 Percent, Reaping the Gains from Economic Growth.” Working Economics (Economic PolicyInstitute blog), January 24.
Bivens, Josh. 2018. “The Fed Shouldn’t Give Up on Restoring Labor’s Share of Income—and MeasureIt Correctly.” Working Economics (Economic Policy Institute blog), January 30.
Bivens, Josh. 2019. “Predicting Wage Growth with Measures of Labor Market Slack: It’sComplicated.” Working Economics (Economic Policy Institute blog), March 19.
94
Bivens, Josh, Lora Engdahl, Elise Gould, Teresa Kroeger, Celine McNicholas, Lawrence Mishel, ZaneMokhiber, Heidi Shierholz, Marni von Wilpert, Valerie Wilson, and Ben Zipperer. 2017. How Today’sUnions Help Working People: Giving Workers the Power to Improve Their Jobs and Unrig theEconomy. Economic Policy Institute.
Bivens, Josh, Elise Gould, Lawrence Mishel, and Heidi Shierholz. 2014. Raising America’s Pay: WhyIt’s Our Central Economic Policy Challenge. Economic Policy Institute, June 4.
Bivens, Josh, and Lawrence Mishel. 2013. “The Pay of Corporate Executives and FinancialProfessionals as Evidence of Rents in Top 1 Percent Incomes.” Journal of Economic Perspectives 27,no. 3: 57–78.
Bivens, Josh, and Lawrence Mishel. 2015. “Understanding the Historic Divergence BetweenProductivity and a Typical Worker’s Pay: Why It Matters and Why It’s Real.” Economic Policy Institute.
Bivens, Josh, Lawrence Mishel, and John Schmitt. 2018. It’s Not Just Monopoly and Monopsony:How Market Power Has Affected American Wages. Economic Policy Institute.
Bivens, Josh, and Ben Zipperer. 2018. The Importance of Locking in Full Employment for the LongHaul. Economic Policy Institute.
Blanchard, Olivier, and Dani Rodrik, eds. 2021. Combating Inequality: Rethinking Government’s Role.MIT Press.
Block, Sharon, and Benjamin H. Harris, eds. 2021. Inequality and the Labor Market: The Case forGreater Competition. Brookings Institution Press.
Bloom, Nicholas, Faith Guvenen, Benjamin Smith, Jae Song, and Till von Wachter. 2018. “Is the LargeFirm Wage Premium Dead or Merely Resting?” AEA Papers and Proceedings 108, no. 1: 317–22.
Bronfenbrenner, Kate. 2009. No Holds Barred: The Intensification of Employer Opposition toOrganizing. Economic Policy Institute and the American Rights at Work Education Fund.
Bureau of Labor Statistics (BLS). 2018. “Contingent and Alternative Employment Arrangements, May2017” (press release). June 7.
Callaci, Brian. 2019. “Fissuring in Flight: Consolidation and Outsourcing in the U.S. Domestic AirlineIndustry, 1997–2018.” Unpublished.
Callaway, Brantly, and William J. Collins. 2017. “Unions, Workers, and Wages at the Peak of theAmerican Labor Movement.” Working Paper 23516. National Bureau of Economic Research.
Card, David. 1991. “The Effect of Unions on the Distribution of Wages: Redistribution or Relabeling?”Working Paper 287. National Bureau of Economic Research.
Card, David. 1996. “The Effect of Unions on the Structure of Wages: A Longitudinal Analysis.”Econometrica 64, no. 4: 957–79.
Card, David, Ana Rute Cardoso, Joerg Heining, and Patrick Kline. 2018. “Firms and Labor MarketInequality: Evidence and Some Theory.” Journal of Labor Economics 36, no. S1: 13–70.
Card, David, and John DiNardo. 2002. “Skill-Biased Technological Change and Rising WageInequality: Some Problems and Puzzles.” Journal of Labor Economics 20, no. 4: 733–83.
Carré, Françoise. 2015. (In)dependent Contractor Misclassification. Economic Policy Institute.
95
Census Bureau. 2020. “Legacy BDS Firm Characteristics Data Tables 1977–2014” [data table],Longitudinal Business Database [February]. Accessed February 2020.
Collins, Brett, Andrew Garin, Emilie Jackson, Dmitri Koustas, and Mark Paynek. 2019. “Is Gig WorkReplacing Traditional Employment? Evidence from Two Decades of Tax Returns.” Internal RevenueService.
Colvin, Alexander J.S. 2018. The Growing Use of Mandatory Arbitration: Access to the Courts Is NowBarred for More Than 60 Million American Workers. Economic Policy Institute.
Colvin, Alexander J.S., and Heidi Shierholz. 2019. Noncompete Agreements: Ubiquitous, Harmful toWages and to Competition, and Part of a Growing Trend of Employers Requiring Workers to SignAway Their Rights. Economic Policy Institute.
Cooper, David. 2019. Raising the Federal Minimum Wage to $15 by 2025 Would Lift Wages for Over33 Million Workers (fact sheet). Economic Policy Institute, July 17.
Cooper, David, Elise Gould, and Ben Zipperer. 2019. Low-Wage Workers Are Suffering from a Declinein the Real Value of the Federal Minimum Wage. Economic Policy Institute.
Cooper, David, and Teresa Kroeger. 2017. Employers Steal Billions from Workers’ Paychecks EachYear: Survey Data Show Millions of Workers Are Paid Less Than the Minimum Wage, at SignificantCost to Taxpayers and State Economies. Economic Policy Institute.
Costa, Daniel. 2019. Employers Increase Their Profits and Put Downward Pressure on Wages andLabor Standards by Exploiting Migrant Workers. Economic Policy Institute.
Costa, Daniel and Ron Hira. 2020. “EPI Comments on USCIS Preference Allocation System for H-1BVisas by Prevailing Wage Level.” Public comments, U.S. Citizenship and Immigration Services,Department of Homeland Security, Modification of Registration Requirement for Petitioners Seekingto File Cap-Subject H-1B Petitions, Notice of proposed rulemaking, CIS Docket No. 2674-20, DHSDocket No. USCIS-2020-001, RIN: 1615-AC61, December 2.
Costa, Daniel, and Philip Martin. 2019. “OECD Highlights Temporary Labor Migration: Almost as ManyGuestworkers as Permanent Immigrants.” Working Economics (Economic Policy Institute blog),December 4.
Costa, Daniel, and Jennifer Rosenbaum. 2017. Temporary Foreign Workers by the Numbers: NewEstimates by Visa Classification. Economic Policy Institute.
Council of Economic Advisers. 1995. Economic Report of the President (1995). U.S. GovernmentPrinting Office.
Daly, Mary, and Bart Hobijin. 2014. “Downward Nominal Wage Rigidities Bend the Phillips Curve.”Journal of Money, Credit and Banking 46, no. 52.
De Loecker, Jan, Jan Eeckhout, and Gabriel Unger. 2020. “The Rise of Market Power and theMacroeconomic Implications.” Quarterly Journal of Economics 135, no. 2: 561–644. https://doi.org/10.1093/qje/qjz041.
Denice, Patrick, and Jake Rosenfeld. 2018. “Unions and Nonunion Pay in the United States,1977–2015.” Sociological Science 5: 541–61.
Department of Commerce. Various years. “Franchising and the Economy.”
Department of Labor. No date. History of Changes to the Minimum Wage Law.
96

Department of Labor (Wage and Hour Division). 2016. Defining and Delimiting the Exemptions forExecutive, Administrative, Professional, Outside Sales and Computer Employees, 81 Fed. Reg.32391–32552 (May 23).
Deutsch, Rachel, Kate Hamaji, Elizabeth Nicolas, Celine McNicholas, Margaret Poydock, and HeidiShierholz. 2019. Unchecked Corporate Power: Forced Arbitration, the Enforcement Crisis, and HowWorkers Are Fighting Back. Center for Popular Democracy and Economic Policy Institute.
DiNardo, John, Nicole M. Fortin, and Thomas Lemieux. 1996. “Labor Market Institutions and theDistribution of Wages.” Econometrica 64, no. 5: 1001–44.
Dube, Arindrajit, Laura Giuliano, and Jonathan Leonard. 2019. “Fairness and Frictions: Impact ofUnequal Raises on Quit Behavior.” American Economic Review 109, no. 2: 620–63.
Dube, Arindrajit, Jeff Jacobs, Suresh Naidu, and Siddharth Suri. 2020. “Monopsony in Online LaborMarkets.” American Economic Review: Insights 2, no. 1: 33–46.
Dube, Arandajit, and Ethan Kaplan. 2010. “Does Outsourcing Reduce Wages in the Low-WageService Occupations? Evidence from Janitors and Guards.” Industrial and Labor Relations Review 63,no. 2: 287–306.
Economic Policy Institute. 2012. “Minimum-Wage Impact on 50/10 Wage Gap, 1979–2009” [chart].The State of Working America. Washington, D.C.: Economic Policy Institute.
Economic Policy Institute. 2019a. “Productivity–Pay Gap.” Last updated July 2019.
Economic Policy Institute. 2019b. “Black–White Wage Gap.” State of Working America Data Library.
Economic Policy Institute. 2019c. State of Working America Data Library, “College Wage Premium.”State of Working America Data Library.
Economic Policy Institute. Various dates. “Wages.” State of Working America Data Library.
Eisenbrey, Ross, and Lawrence Mishel. 2015. “The New Overtime Salary Threshold Would DirectlyBenefit 13.5 Million Workers: How EPI’s Estimates Differ from the Department of Labor’s.” EconomicPolicy Institute.
Eisenbrey, Ross, and Lawrence Mishel. 2016. “Explaining the Differences Between EPI and DOLEstimates of Workers Affected by the New Overtime Salary Threshold.” Working Economics(Economic Policy Institute blog), May 20.
Erickson, Christopher L., and Daniel J.B. Mitchell. 2008. “Monopsony as a Metaphor for the EmergingPost-Union Labour Market.” International Labour Review 146, no. 3–4 (January): 163–87.https://doi.org/10.1111/j.1564-913X.2007.00012.x.
Farber, Henry S., Daniel Herbst, Ilyana Kuziemko, and Suresh Naidu. 2021. “Unions and Inequalityover the Twentieth Century: New Evidence from Survey Data.” Working Paper 24587. May 2018,revised April 2021. National Bureau of Economic Research.
Farhi, Emmanuel, and François Gourio. 2018. “Accounting for Macro-Finance Trends: Market Power,Intangibles, and Risk Premia.” Brookings Papers on Economic Activity (Fall): 147–250.
Federal Reserve Bank of New York. 2020. The Labor Market for Recent College Graduates(interactive web feature). Last updated February 12, 2020.
Fortin, Nicole M., and Thomas Lemieux. 1997. “Institutional Changes and Rising Wage Inequality: Is
97
There a Linkage?” Journal of Economic Perspectives 11, no. 2: 75–96.
Fortin, Nicole M., Thomas Lemieux, and Neil Lloyd. 2021. “Labor Market Institutions and theDistribution of Wages: The Role of Spillover Effects.” Working Paper 28375. National Bureau ofEconomic Research.
Freeman, Richard. 1991. “How Much Has De-Unionization Contributed to the Rise in Male WageInequality?” Working Paper 3826. National Bureau of Economic Research.
Freeman, Richard B., and James L. Medoff. 1984. What Do Unions Do? Basic Books.
Galbraith, James. 1997. “Time to Ditch the NAIRU.” Journal of Economic Perspectives 11, no. 1:93–108.
Galbraith, James K. 1998. Created Unequal: The Crisis in American Pay. Free Press.
Goldin, Claudia, and Lawrence F. Katz. 2007. “The Race Between Education and Technology: TheEvolution of U.S. Educational Wage Differentials, 1890 to 2005.” Working Paper 12984. NationalBureau of Economic Research.
Goldin, Claudia, and Lawrence F. Katz. 2008. The Race Between Education and Technology. HarvardUniv. Press.
Goldschmidt, Deborah, and Johannes Schmieder. 2017. “The Rise of Domestic Outsourcing and theEvolution of the German Wage Structure.” Quarterly Journal of Economics 132, no. 3: 1165–217.
Goos, Maarten, Alan Manning, and Anna Salomons. 2014. “Explaining Job Polarization: Routine-Biased Technological Change and Offshoring.” American Economic Review 104, no. 8: 2509–26.
Gould, Elise. 2018. The State of American Wages 2017: Wages Have Finally Recovered from theBlow of the Great Recession but Are Still Growing Too Slowly and Unequally. Economic PolicyInstitute.
Gould, Elise. 2020. State of Working America Wages 2019: A Story of Slow, Uneven, and UnequalWage Growth over the Last 40 Years. Economic Policy Institute.
Greene, Jay. 2021. “Amazon Shortchanged Drivers $61.7 Million in Tips. Now It Has Settled with theFTC to Pay Up.” Washington Post, February 2.
Greenhouse, Steven. 2020. “02: The Future of Work.” The World as You’ll Know It (podcasttranscript), 32:38.
Greenwald, Daniel L., Martin Lettau, and Sydney C. Ludvigson. 2019. “How the Wealth Was Won:Factors Shares as Market Fundamentals.” Working Paper 25769. National Bureau of EconomicResearch.
Groshen, Erica L., and Harry J. Holzer. 2019. “Improving Employment and Earnings in Twenty-FirstCentury Labor Markets.” Russell Sage Foundation Journal of the Social Sciences 5, no. 5.
Grullon, Gustavo, Yelena Larkin, and Roni Michaely. 2015. “Are U.S. Industries BecomingConcentrated?” Swiss Finance Institute Research Paper 19-41, forthcoming in Review of Finance,posted online May 31, 2015.
Hacker, Jacob S., and Paul Pierson. 2011. Winner-Take-All Politics: How Washington Made the RichRicher—and Turned Its Back on the Middle Class. Simon & Schuster.
98
Hacker, Jacob S., and Paul Pierson. 2020. Let Them Eat Tweets: How the Right Rules in an Age ofExtreme Inequality. Liveright Publishing.
Hooper, Peter, Frederic S. Mishkin, and Amir Sufi. 2019. “Prospects for Inflation in a High PressureEconomy: Is the Phillips Curve Dead or Is It Just Hibernating?” Working Paper 25792. NationalBureau of Economic Research.
Howell, David R. 2001. “The Skills Myth.” American Prospect, December 19, 2001.
Howell, David R., and Arne L. Kalleberg. 2019. “Declining Job Quality in the United States:Explanations and Evidence.” Russell Sage Foundation Journal of the Social Sciences 5, no. 4: 1–53.
Howell, David R., and Susan S. Wieler. 1998. “Skill-Biased Demand Shifts and Wage Collapse in theUnited States: A Critical Perspective.” Eastern Economic Journal 24, no. 3: 343–66.
Hunt, Jennifer, and Ryan Nunn. 2019. “Is Employment Polarization Informative About Wage Inequalityand Is Employment Really Polarizing?” Working Paper 26064. National Bureau of EconomicResearch.
Johnson, Matthew S., Kurt Lavetti, and Michael Lipsitz. 2020. “The Labor Market Effects of LegalRestrictions on Worker Mobility.” Federal Trade Commission, Bureau of Economics.
Katz, Lawrence, and Alan Krueger. 1999. “The High-Pressure Labor Market of the 1990s.” BrookingsPapers on Economic Activity 1.
Katz, Lawrence F., and Kevin M. Murphy. 1992. “Changes in Relative Wages, 1963–87: Supply andDemand Factors.” Quarterly Journal of Economics 107 (February): 35–78.
Kearney, Melissa S., Brad Hershbein, and David Boddy. 2015. “The Future of Work in the Age of theMachine.” Brookings Institution: Hamilton Project.
Kimball, Will, and Lawrence Mishel. 2016. Nearly One-Third of Salaried Workers Will Be GuaranteedOvertime Under the New Rule, but That Falls Short of the Half Covered in the Mid-1970s. EconomicSnapshot. Economic Policy Institute, June.
Kochan, Thomas A., and Will Kimball. 2019. “Unions, Worker Voice, and Management Practices:Implications for a High-Productivity, High-Wage Economy.” Russell Sage Foundation Journal of theSocial Sciences 5, no. 5.
Kochan, Thomas A., Will Kimball, Duanyi Yang, and Erin L. Kelly. 2018. “Worker Voice in America: IsThere a Gap Between What Workers Expect and What They Get?” ILR Review 72, no. 1: 3–38.https://doi.org/10.1177/0019793918806250.
Kopczuk, Wojciech, Emmanuel Saez, and Jae Song. 2007. “Uncovering the American Dream:Inequality and Mobility in Social Security Earnings Data Since 1937.” National Bureau of EconomicResearch Working Paper no. 13345, August 2007.
Kosová, Renáta, and Francine Lafontaine. 2012. “Much Ado About Chains: A Research Agenda.”International Journal of Industrial Organization 30: 303–8.
Krogstad, Jens Manuel, Jeffrey Passel, and D’vera Cohn. 2019. “5 Facts About Illegal Immigration inthe U.S.” Pew Research Center.
Krueger, Alan B. 2017. “The Rigged Labor Market.” Milken Institute Review, April 28.
Krueger, Alan B. 2018. “Reflections on Dwindling Worker Bargaining Power and Monetary Policy.”
99
Luncheon Address at the Jackson Hole Economic Symposium, August 24.
Krueger, Alan B., and Orley Ashenfelter. 2018. “Theory and Evidence on Employer Collusion in theFranchise Sector.” Working Paper 24831. National Bureau of Economic Research.
Lafontaine, Francine, and Roger D. Blair. 2009. “The Evolution of Franchising and FranchiseContracts: Evidence from the United States.” Entrepreneurial Business Law Journal 3, no. 2:381–434.
Langella, Monica, and Alan Manning. 2020. “The Measure of Monopsony.” Video, 56:28. MarshallLecture, Annual Congress of the European Economic Association.
Lazear, Edward P. 2019. “Mind the Productivity Gap to Reduce Inequality: It Isn’t Only an AmericanProblem, but the U.S. Has Lessons to Learn from Other Wealthy Countries.” Wall Street Journal, May6.
Lettieri, John W. 2020. A Better Bargain: How Noncompete Reform Can Benefit Workers and BoostEconomic Dynamism. American Enterprise Institute.
Levy, Frank, and Peter Temin. 2007. “Inequality and Institutions in 20th Century America.” WorkingPaper 13106. National Bureau of Economic Research.
Lipsitz, Michael, and Evan Starr. 2020. “Low-Wage Workers and the Enforceability of Non-CompeteAgreements.” Forthcoming in Management Science. Online version October 20, 2020.
Lipsky, David B. 2007. “Conflict Resolution and the Transformation of the Social Contract.” Labor andEmployment Relations Association Presidential Address, January.
Locke, Mandy, and Franco Ordonez. 2014. “Taxpayers and Workers Gouged by Labor-Law Dodge.”McClatchy Washington Bureau, September 4.
Lopez, German. 2019. “I Was Skeptical of Unions. Then I Joined One.” Vox, August 19.
Maestas, Nicole, Kathleen J. Mullen, David Powell, Till von Wachter, and Jeffrey B. Wenger. 2017.Working Conditions in the United States: Results of the 2015 American Working Conditions Survey.RAND Corporation.
Manduca, Robert. 2018. “Income Inequality and the Persistence of Racial Economic Disparities.”Sociological Science 5: 182–205.
McAdams, John M. 2019. “Non-Compete Agreements: A Review of the Literature.” Federal TradeCommission, Bureau of Economics. http://dx.doi.org/10.2139/ssrn.3513639.
McNicholas, Celine, Zane Mokhiber, and Adam Chaikof. 2017. Two Billion Dollars in Stolen WagesWere Recovered for Workers in 2015 and 2016—and That’s Just a Drop in the Bucket. EconomicPolicy Institute.
McNicholas, Celine, Margaret Poydock, Julia Wolfe, Ben Zipperer, Gordon Lafer, and LolaLoustaunau. 2019. Unlawful: U.S. Employers Are Charged with Violating Federal Law in 41.5% of AllUnion Election Campaigns. Economic Policy Institute.
Mishel, Lawrence. 2014. “Low-Wage Workers Have Far More Education Than They Did in 1968, YetThey Make Far Less.” Economic Snapshot. Economic Policy Institute, January 23.
Mishel, Lawrence. 2018. Yes, Manufacturing Still Provides a Pay Advantage, but Staffing FirmOutsourcing Is Eroding It. Economic Policy Institute, March.
100
Mishel, Lawrence. 2019. “Private Sector Union Density Dynamics, 1951–2017.” Presentation atColumbia University, September 12.
Mishel, Lawrence, and Jared Bernstein. 1994. “Is the Technology Black Box Empty? An EmpiricalExamination of the Impact of Technology on Wage Inequality and the Employment Structure.”Technical Paper. Economic Policy Institute.
Mishel, Lawrence, and Jared Bernstein. 1998. “Technology and the Wage Structure: HasTechnology’s Impact Accelerated Since the 1970s?”Research in Labor Economics 17: 305–56.
Mishel, Lawrence, Jared Bernstein, and John Schmitt. 1997a. The State of Working America1996–1997. An Economic Policy Institute book. M.E. Sharpe.
Mishel, Lawrence, Jared Bernstein, and John Schmitt. 1997b. “Did Technology Have Any Effect onthe Growth of Wage Inequality in the 1980s and 1990s?” Economic Policy Institute.
Mishel, Lawrence, and Josh Bivens. 2013. The Pay of Corporate Executives and FinancialProfessions as Evidence of Rents in Top 1 Percent Incomes. Economic Policy Institute.
Mishel, Lawrence, and Josh Bivens. 2017. “The Zombie Robot Argument Lurches On: There Is NoEvidence That Automation Leads to Joblessness or Inequality.” Economic Policy Institute.
Mishel, Lawrence, Josh Bivens, Elise Gould, and Heidi Shierholz. 2012. The State of WorkingAmerica, 12th Edition. An Economic Policy Institute book. Cornell Univ. Press.
Mishel, Lawrence, and Jori Kandra. 2020. “Wages for the Top 1% Skyrocketed 160% Since 1979 Whilethe Share of Wages for the Bottom 90% Shrunk: Time to Remake Wage Pattern with EconomicPolicies That Generate Robust Wage-Growth for Vast Majority.” Working Economics (Economic PolicyInstitute blog), December.
Mishel, Lawrence, and Melat Kassa. 2019. “Top 1.0 Percent of Earners See Wages Up 157.8% Since1979.” Working Economics (Economic Policy Institute blog), December 18.
Mishel, Lawrence, Lynn Rhinehart, and Lane Windham. 2020. “Explaining the Erosion of Private-Sector Unions: How Corporate Practices and Legal Changes Have Undercut the Ability of Workers toOrganize and Bargain.” Economic Policy Institute.
Mishel, Lawrence, John Schmitt, and Heidi Shierholz. 2014. “Wage Inequality: A Story of PolicyChoices.” SAGE Journals, August 4.
Mishel, Lawrence, and Heidi Shierholz. 2017. “Robots, or Automation, Are Not the Problem: Too LittleWorker Power Is.” Economic Policy Institute.
Mishel, Lawrence, Heidi Shierholz, and John Schmitt. 2013. “Don’t Blame the Robots: Assessing theJob Polarization Explanation of Growing Wage Inequality.” Economic Policy Institute.
Mishel, Lawrence, and Julia Wolfe. 2018. “Top 1.0 Percent Reaches Highest Wages Ever—Up 157Percent Since 1979.” Working Economics (Economic Policy Institute blog), October 18.
Mitchell, Daniel J.B., and C L. Erickson. 2005. “Not Yet Dead at the Fed: Unions, Worker Bargaining,and Economy-Wide Wage Determination.” Industrial Relations, 44, no. 3: 565–606.
New York Times Editorial Board. 2018. “The Trouble with Trucking.” New York Times, August 11.
Naidu, Suresh, Eric A. Posner, and E. Glen Weyl. 2018. “Antitrust Remedies for Labor Market Power.”Coase-Sandor Working Paper Series in Law and Economics, no. 850.
101

Naidu, Suresh, and Aaron Sojourner. 2020. Employer Power and Employee Skills: UnderstandingWorkforce Training Programs in the Context of Labor Market Power. Roosevelt Institute, December.
Organisation for Economic Co-operation and Development (OECD). 2019a. International MigrationOutlook 2019.
Organisation for Economic Co-operation and Development (OECD). 2019b. Negotiating Our Way Up:Collective Bargaining in a Changing World of Work.
Ormiston, Russell, Dale Belman, and Mark Erlich. 2020. An Empirical Methodology to Estimate theIncidence and Costs of Payroll Fraud in the Construction Industry. National Alliance for FairContracting.
Ortega, Francesc, and Amy Hsin. 2018. “Occupational Barriers and the Labor Market Penalty fromLack of Legal Status.” IZA Institute of Labor Economics No. 11680.
Pierce, Brooks. 1999. “Compensation Inequality.” Working Paper 323. Department of Labor, Bureauof Labor Statistics.
Piketty, Thomas, and Emmanuel Saez. 2003. “Income Inequality in the United States, 1913–1998.”Quarterly Journal of Economics 117, no. 1. (Longer updated version published in Top Incomes overthe Twentieth Century, A.B. Atkinson and T. Piketty, eds., Oxford Univ. Press, 2007; tables and figuresupdated to 2017 in Excel format, March 2019.)
Posner, Eric A., Glen Weyl, and Suresh Naidu. 2018. “Antitrust Remedies for Labor Market Power.”Harvard Law Review 132, no. 2: 535–601.
Prescott, J.J., Norman D. Bishara, and Evan Starr. 2016. “Understanding Noncompetition Agreements:The 2014 Noncompete Survey Project.” Michigan State Law Review, no. 2: 369–464.
Rinz, Kevin. 2018. “Labor Market Concentration, Earnings Inequality, and Earnings Mobility.” WorkingPaper 2018-10. U.S. Center for Administrative Records Research and Applications, Census Bureau.
Rosenfeld, Jake. 2014. What Unions No Longer Do. Harvard Univ. Press.
Rosenfeld, Jake. 2021. You’re Paid What You’re Worth and Other Myths of the Modern Economy.Belknap Press.
Rosenfeld, Jake, Patrick Denice, and Jennifer Laird. 2016. Union Decline Lowers Wages of NonunionWorkers: The Overlooked Reason Why Wages Are Stuck and Inequality Is Growing. Economic PolicyInstitute.
Schmitt, John, and Alexandra Mitukiewicz. 2012. “Politics Matter: Changes in Unionization Rates inRich Countries, 1960–2010.” Industrial Relations Journal 43, no. 3: 260–80.
Shambaugh, Jay, Ryan Nunn, Patrick Liu, and Greg Nantz. 2017. Thirteen Facts About Wage Growth.Economic Facts. Brookings Institution: Hamilton Project.
Shierholz, Heidi. 2019. “More Than Eight Million Workers Will Be Left Behind by the Trump OvertimeRule: Workers Would Receive $1.4 Billion Less Than Under the 2016 Rule.” Working Economics(Economic Policy Institute blog), September 25.
Shierholz, Heidi. 2021. “The Importance of Enforcement in Designing Effective Labor Market Tools.”In Combating Inequality: Rethinking Government’s Role, edited by Olivier Blanchard and Dani Rodrik.MIT Press.
102
Smith, Matt, Jennifer Gollan, and Adithya Sambamurthy. 2014. “Job Brokers Steal Wages, EntrapIndian Tech Workers in U.S.” Reveal News, October 27.
Sokolova, Anna, and Todd Sorensen. 2020. “Monopsony in Labor Markets: A Meta-Analysis.”Washington Center for Equitable Growth.
Staiger, Douglas, James H. Stock, and Mark W. Watson. 1997. “The NAIRU, Unemployment andMonetary Policy.” Journal of Economic Perspectives 11, no. 1: 33–49.
Stansbury, Anna M., and Lawrence H. Summers. 2020. “Declining Worker Power and AmericanEconomic Performance.” Brooking Papers on Economic Activity: BPEA Conference Drafts.
Starr, Evan. 2019a. “Consider This: Training, Wages, and the Enforceability of Covenants Not toCompete.” ILR Review 72, no. 4: 783–817. https://doi.org/10.1177/0019793919826060.
Starr, Evan. 2019b. The Use, Abuse, and Enforceability of Non-Compete and No-Poach Agreements:A Brief Review of the Theory, Evidence, and Recent Reform Efforts. Economic Innovation Group.
Starr, Evan. 2020. Non-Competes in the Workplace: Examining Antitrust and Consumer ProtectionsIssues. (Testimony to the Federal Trade Commission). Federal Trade Commission: Panel 2. January 9.
Starr, Evan, J.J. Prescott, and Norman D. Bishara. 2019. “The Behavioral Effects of (Unenforceable)Contracts.” Forthcoming in Journal of Law, Economics, and Organization, online version September18, 2020.
Starr, Evan, J.J. Prescott, and Norman D. Bishara. 2020. “Noncompete Agreements in the U.S. LaborForce.” Forthcoming in Journal of Law and Economics, online version May 7, 2020.
Stiglitz, Joseph E. 2012. The Price of Inequality: How Today’s Divided Society Endangers Our Future.W. W. Norton.
Stiglitz, Joseph E. 2021. “Fostering More-Competitive Labor Markets.” In Inequality and the LaborMarket: The Case for Greater Competition, edited by Sharon Block and Benjamin Harris. BrookingsInstitution Press.
Stockman, Farah. 2013. “Teacher Trafficking: The Strange Saga of Filipino Workers, AmericanSchools, and H-1B Visas.” Boston Globe, June 12.
Stone, Katherine V.W., and Alexander J.S. Colvin. 2015. The Arbitration Epidemic: MandatoryArbitration Deprives Workers and Consumers of Their Rights. Economic Policy Institute.
Stuyven, Dann. 2018. “Superstar Firms, Super Profits, and Shrinking Wage Shares.” U.S. EconomicsAnalyst, Goldman Sachs Economics Research Note, February 4 (not publicly available).
Summers, Lawrence. 2015. “The Future of Work in the Age of the Machine: A Hamilton Project PolicyForum.” Brookings Institution: Hamilton Project, February 19.
Uber Technologies (Uber). 2019. “Form S-1 Registration Statement, United States Securities andExchange Commission.” April 11.
USA Today. 2018. “Read Transcript of Former President Obama’s Speech, Blasting President Trump.”September 7.
USA Today Editorial Board. 2017. “Rigged System Rips Off Port Truckers: Modern-Day IndenturedServitude Thrives in Southern California.” June 20.
103

U.S. Government Accountability Office (U.S. GAO). 1989. “Tax Administration: Information ReturnsCan Be Used to Identify Employers Who Misclassify Workers.” GAO/GGD-89-107.
U.S. Government Accountability Office (U.S. GAO). 2009. “Employee Misclassification: ImprovedCoordination, Outreach, and Targeting Could Better Ensure Detection and Prevention.”
Valletta, Robert G. 2017. “Recent Flattening in the Higher Education Wage Premium: Polarization, SkillDowngrading, or Both?” In Education, Skills, and Technical Change: Implications for Future U.S. GDPGrowth. National Bureau of Economic Research.
Viscelli, Steve. 2016. The Big Rig: Trucking and the Decline of the American Dream. Univ. ofCalifornia Press.
Webber, Douglas A. 2015. “Firm Market Power and the Earnings Distribution” Labour Economics 35:123–134.
Webber, Douglas A. 2018. “Employment Adjustment Over the Business Cycle: The Impact ofCompetition in the Labor Market.” IZA Discussion Papers 11887, Institute of Labor Economics (IZA).
Webber, Douglas A. 2020. “Labor Market Competition and Employment Adjustment over theBusiness Cycle.” Journal of Human Resources 56, no. 2.
Weil, David. 2014. The Fissured Workplace: Why Work Became So Bad for So Many and What CanBe Done About It. Harvard Univ. Press.
Weil, David. 2017. “Lots of Employees Get Misclassified as Contractors. Here’s Why It Matters.”Harvard Business Review, July 5.
Weil, David. 2019. “ The Present and Future of Work in the Fissured Workplace Context.” RussellSage Foundation Journal of the Social Sciences 5, no. 5.
Western, Bruce, and Jake Rosenfeld. 2011. “Unions, Norms, and the Rise in U.S. Wage Inequality.”American Sociological Review 76, no. 4: 513–37.
Wilmers, Nathan. 2018. “Wage Stagnation and Buyer Power: How Buyer-Supplier Relations AffectU.S. Workers’ Wages, 1978 to 2014.” American Sociological Review, 1–28. https://doi.org/10.1177/0003122418762441.
Wilson, Valerie. 2015. The Impact of Full Employment on African American Employment and Wages.Full Employment Project at the Center on Budget and Policy Priorities.
Wilson, Valerie. 2020. “Racism and the Economy: Focus on Employment.” WorkingEconomics (Economic Policy Institute blog), November 21.
Wilson, Valerie, and William M. Rodgers III. 2016. Black–White Wage Gaps Expand with Rising WageInequality. Economic Policy Institute.
Windham, Lane. 2017. Knocking on Labor’s Door: Union Organizing in the 1970s and the Roots of aNew Economic Divide. Univ. of North Carolina Press.
Woodman, Spencer. 2015. “Exclusive: Amazon Makes Even Temporary Warehouse Workers Sign18-Month Non-Competes.” The Verge, March 26.
104