Embed Size (px)
DESCRIPTION
Como identificar el sistema de coordenadas para una localizaciòn geografica
Citation preview

C H A P T E R 1
IDENTIFYING THE TYPE OF COORDINATE SYSTEM FOR DATA USING ARCMAP
“My boss told me to make a map using ArcMap, but when I add the data, I get an error message that says ‘missing spatial reference’ and the data doesn’t line up. I’ve got a deadline! How do I fix it?”
“When I add my new data to ArcMap, I get a Warning box that says ‘Inconsistent extent’ and the data doesn’t line up.
What is the problem?”
The coordinate system for data provides a frame of reference so that users of geographic information systems (GIS) can identify the location of features on the surface of the earth, align data, and create maps. These maps enable users to perform spatial analyses of the data and view its relationship to other features.
Dozens of map projections, the means for displaying features from the curved surface of the earth to a flat sheet of paper, have been calculated by geodesists — scientists who study the shape of the earth. Each of these map projections has been calculated to preserve one or more specific properties of the data — shape, distance, area, or direction. Literally, an infinite number of specific projec-tions can be created for data depending on the extent, location, and particular property of the data that is most important for a specific project, general data storage, and maintenance.
No wonder people are confused by projections.This book is organized to help you to narrow the huge number of possible coordinate systems for data to a manageable selection and
to identify the unknown coordinate systems by following the methods outlined. The book also provides instructions for creating custom projection files, if data is not in a standard coordinate system, so that data will properly line up in ArcMap.
All data is created in some coordinate system. Once you identify which coordinate system your data is in, you can correctly select (define) the map projection file that will render your data in the right location in ArcMap in relation to other data. The first three chapters contain steps to identify the coordinate system of data in ArcMap, and define the coordinate system to match the data, if the data has been created using a standard projection.

2 I D E N T I F Y I N G T H E T Y P E O F C O O R D I N AT E S Y S T E M F O R D ATA U S I N G A R C M A P
FEATURES IN VECTOR DATASETSVector datasets contain point, line, or polygon features that illustrate the position of real or imaginary features on the earth. Water or oil wells are real features that would be maintained in the vector dataset as points. A road is a real feature: the centerline can be maintained as a line feature in the vector dataset. A tax parcel is an imaginary polygon feature, with boundaries and an area defined by national, state, or local laws. Attribute tables for the data store relevant information about the features in the dataset.
Vast quantities of free vector data are available for download from the Internet. Data exchange between GIS analysts is a daily occurrence. Data collected with a Global Positioning System (GPS) unit is part of many users’ workflows. Metadata describes the source of the data, collection methods, relative accuracy of the data, and coordinate system or projection of the data, but in many cases metadata is not provided.
In order to use vector data in ArcMap, the coordinate system for the data must be identified based on the coordinate extent of the data as displayed in ArcMap > Layer Properties > Source tab. Since ArcGIS Desktop installs more than 4,000 projection files with the software, and only one of those projection files properly describes the coordinate system of a specific dataset, the coordinate system of the dataset must be correctly identified so that the proper projection file (PRJ) is applied to the data. The projection must then be correctly defined by applying the projection that describes the coordinate system of the data. ArcMap’s project-on-the-fly utility, used throughout the book, helps identify projections to align data.
All GIS data is created in some coordinate system. All GIS data covers some extent on the surface of the earth, whether the data is points, lines, polygons, annotation, or some other type of feature. The extent coordinates can be in decimal degrees, feet, meters, tenths of an inch, tenths of a foot, millimeters, centimeters, or kilometers — the list is endless. When the data is added to ArcMap, and you right-click the name of the data layer, select Properties > Source tab, and look at the numbers in the Extent box at the top of the tab, the Top, Bottom, Left, and Right coordinates are the extent of the data, in the units and coordinate system used to create the data.
The coordinate system of the data is defined in relation to the units in the Extent box. This book is about identifying the coordinate system for data, so that the coordinate system can be correctly defined and the data will draw in the right location in ArcMap in relation to other data.
ArcGIS Desktop is installed with more than 4,000 projection files. In order to define the coordinate system of the data correctly, you must first identify the projection file that correctly describes the coordinates for the data. You cannot randomly select one of these 4,000 projection files to define the data. You have to pick the one that correctly describes the coordinate extent in the proper units and coordinate system. If none of these projection files matches the properties of the data, you will have to create a custom projection file, as described in chapters 4, 5, and 6.
To define the coordinate system for the data, you will use the Define Projection tool located in ArcToolbox > Data Management Tools > Projections and Transformations. (In ArcGIS Desktop 10, from within ArcMap, select Catalog window > Toolboxes > System Toolboxes to access this path.)
Say you receive data that is in a geographic coordinate system, GCS_North_American_1927. There is no metadata and no projection file, but you use the steps in this book to identify and define the coordinate system as North American Datum 1927.
All your other data is in NAD 1983 StatePlane California VI FIPS 0406 Feet. You cannot perform any analysis using the data unless it matches your other data’s coordinate system. You cannot define the data as NAD 1983 StatePlane Feet, because the coordinates of the data are in decimal degrees, not feet.
(continued)
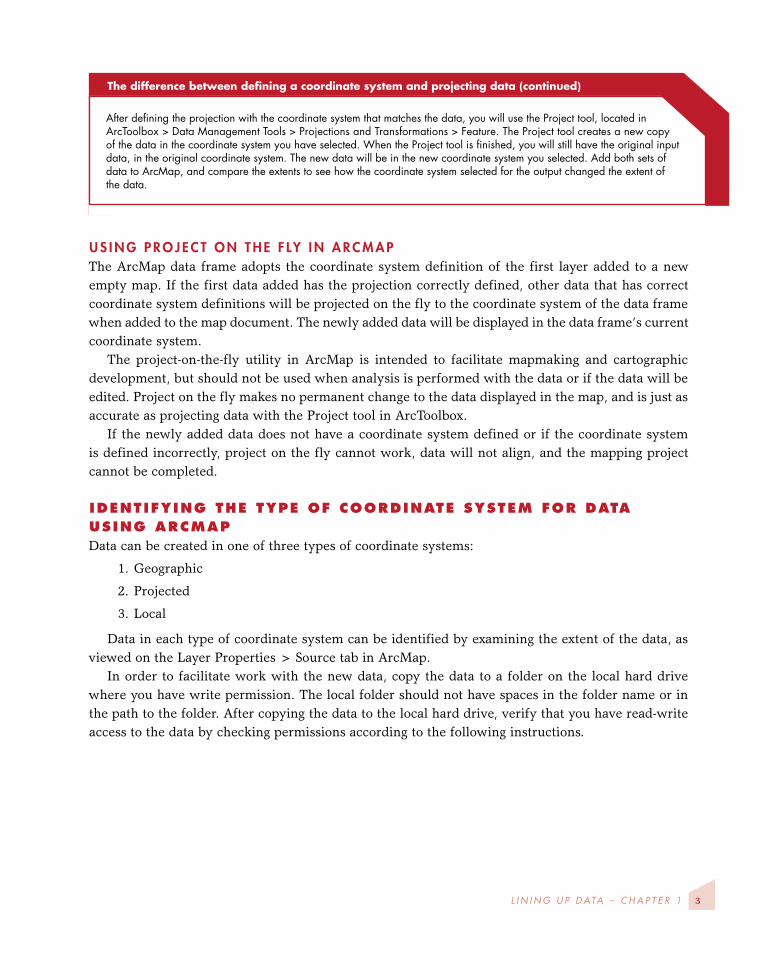
The difference between defining a coordinate system and projecting data
L I N I N G U P D ATA – C H A P T E R 1 3
U S I N G P R O J E C T O N T H E F LY I N A R C M A PThe ArcMap data frame adopts the coordinate system definition of the first layer added to a new empty map. If the first data added has the projection correctly defined, other data that has correct coordinate system definitions will be projected on the fly to the coordinate system of the data frame when added to the map document. The newly added data will be displayed in the data frame’s current coordinate system.
The project-on-the-fly utility in ArcMap is intended to facilitate mapmaking and cartographic development, but should not be used when analysis is performed with the data or if the data will be edited. Project on the fly makes no permanent change to the data displayed in the map, and is just as accurate as projecting data with the Project tool in ArcToolbox.
If the newly added data does not have a coordinate system defined or if the coordinate system is defined incorrectly, project on the fly cannot work, data will not align, and the mapping project cannot be completed.
IDENTIFYING THE TYPE OF COORDINATE SYSTEM FOR DATA USING ARCMAPData can be created in one of three types of coordinate systems:
1. Geographic
2. Projected
3. Local
Data in each type of coordinate system can be identified by examining the extent of the data, as viewed on the Layer Properties > Source tab in ArcMap.
In order to facilitate work with the new data, copy the data to a folder on the local hard drive where you have write permission. The local folder should not have spaces in the folder name or in the path to the folder. After copying the data to the local hard drive, verify that you have read-write access to the data by checking permissions according to the following instructions.
The difference between defining a coordinate system and projecting data (continued)
After defining the projection with the coordinate system that matches the data, you will use the Project tool, located in ArcToolbox > Data Management Tools > Projections and Transformations > Feature. The Project tool creates a new copy of the data in the coordinate system you have selected. When the Project tool is finished, you will still have the original input data, in the original coordinate system. The new data will be in the new coordinate system you selected. Add both sets of data to ArcMap, and compare the extents to see how the coordinate system selected for the output changed the extent of the data.
4 I D E N T I F Y I N G T H E T Y P E O F C O O R D I N AT E S Y S T E M F O R D ATA U S I N G A R C M A P
C H E C K I N G A N D C H A N G I N G P E R M I S S I O N S O N N E W F I L E S O R F O L D E R S
Right-clicktheStartbuttonandselectExplore.
InWindowsExplorer,navigatetothefolderwherethedatahasbeencopied,right-clickthefoldername,andselectProperties>Generaltab.
IftheRead-onlyAttributesboxischecked,clearthecheckbox,clickApply,select“Applychangestothisfolder,subfoldersandfiles,”clickOK,andOKagain.
IftheRead-onlyAttributesboxisempty,orisfilledwithagreensquare,openthefolderandselectthefileswithinthefolder.
Right-click the selected files > Properties > General tab. If the Read-only Attributes box is checked,uncheckit,andclickOK.
Now that you have write access to the data, open ArcMap with a new, empty map and add the newly acquired data. If several datasets have been received from the same source and the new data-sets line up together when added to ArcMap, you know that the new data all has the same spatial reference. To reduce drawing time, you can turn off all but one of the new data layers while working to identify the coordinate system for the data.
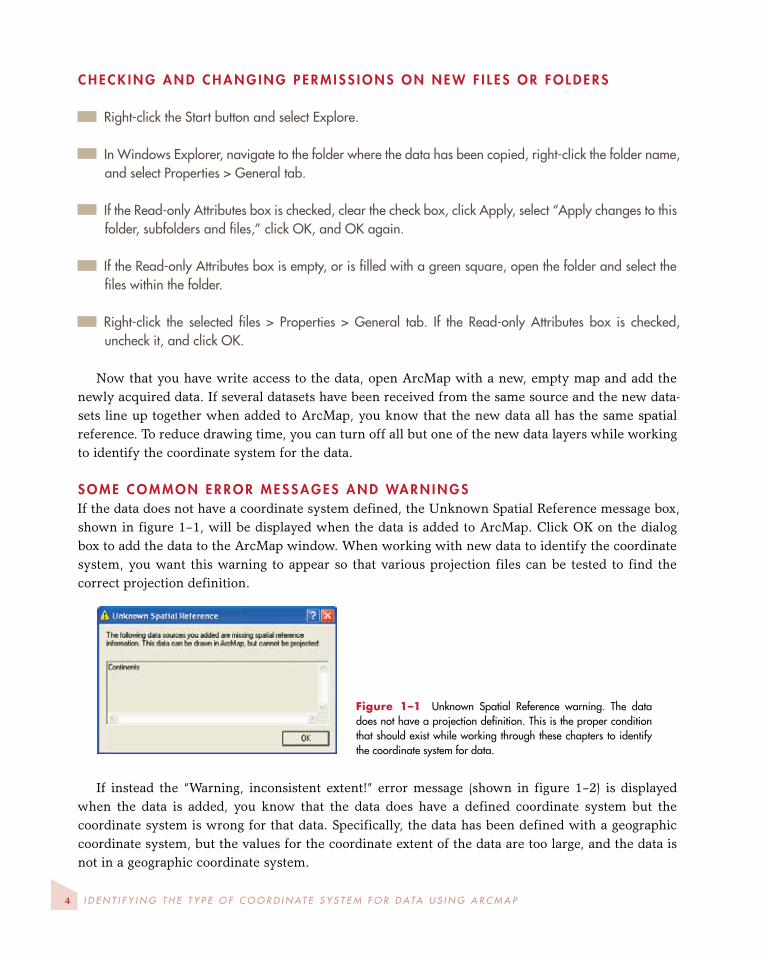
S O M E C O M M O N E R R O R M E S S A G E S A N D WA R N I N G SIf the data does not have a coordinate system defined, the Unknown Spatial Reference message box, shown in figure 1–1, will be displayed when the data is added to ArcMap. Click OK on the dialog box to add the data to the ArcMap window. When working with new data to identify the coordinate system, you want this warning to appear so that various projection files can be tested to find the correct projection definition.
Figure 1–1 Unknown Spatial Reference warning. The datadoesnothaveaprojectiondefinition.Thisistheproperconditionthatshouldexistwhileworkingthroughthesechapterstoidentifythecoordinatesystemfordata.
If instead the “Warning, inconsistent extent!” error message (shown in figure 1–2) is displayed when the data is added, you know that the data does have a defined coordinate system but the coordinate system is wrong for that data. Specifically, the data has been defined with a geographic coordinate system, but the values for the coordinate extent of the data are too large, and the data is not in a geographic coordinate system.

L I N I N G U P D ATA – C H A P T E R 1 5
Figure 1–2 Thecoordinatesystemdefinedforthedatadoesnotmatchthespatialextentofthedata.
The incorrect coordinate system definition must be removed from the data before proceeding. To do this:
Delete the incorrect projection definition associated with the data by opening ArcToolbox > DataManagement Tools>ProjectionsandTransformations. (InArcGISDesktop10, fromwithinArcMap,selectCatalogwindow>Toolboxes>SystemToolboxestoaccessthispath.)
Open theDefineProjection tool,shownin figure1–3,andfromthe InputDatasetorFeatureClassdrop-downlist,selectthenameofthedatasetthatgeneratedtheerrormessage.
ClicktheCoordinateSystembrowsebutton.
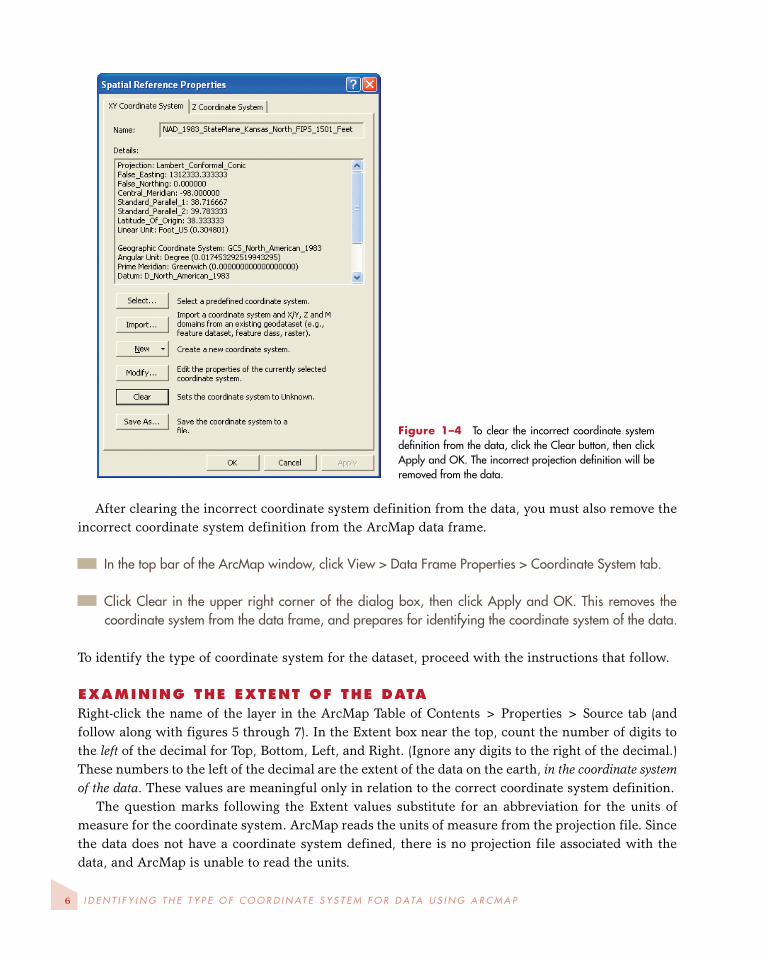
OntheSpatialReferencePropertiesdialogboxthatcomesup,clickClearasshowninfigure1–4,thenApplyandOK.
ClickOKagainontheDefineProjectiontooltoremovetheincorrectcoordinatesystemdefinitionfromthedata.
Figure 1–3 DefineProjectiondialogbox.TheshapefilespecifiedintheInputDatasetorFeatureClassbox,Continents.shp,thecontinentsoftheworld,shouldnothavethecoordinatesystemdefinedasNAD1983StatePlaneforKansas,oranystateplanecoordinatesystem.AprojectionfromthestateplanecoordinatesystemappliesonlytoasinglestateorportionofastateintheUnitedStates,andshouldnotbeusedfordataoutsidethatspecificarea.Refertofigures3–1and3–2(pages28-29)forillustrationsoftheareascoveredbyeachstateplanecoordinatesystemFIPSzone.
6 I D E N T I F Y I N G T H E T Y P E O F C O O R D I N AT E S Y S T E M F O R D ATA U S I N G A R C M A P
After clearing the incorrect coordinate system definition from the data, you must also remove the incorrect coordinate system definition from the ArcMap data frame.
InthetopbaroftheArcMapwindow,clickView>DataFrameProperties>CoordinateSystemtab.
ClickClear in theupperrightcornerof thedialogbox, thenclickApplyandOK.Thisremoves thecoordinatesystemfromthedataframe,andpreparesforidentifyingthecoordinatesystemofthedata.
To identify the type of coordinate system for the dataset, proceed with the instructions that follow.
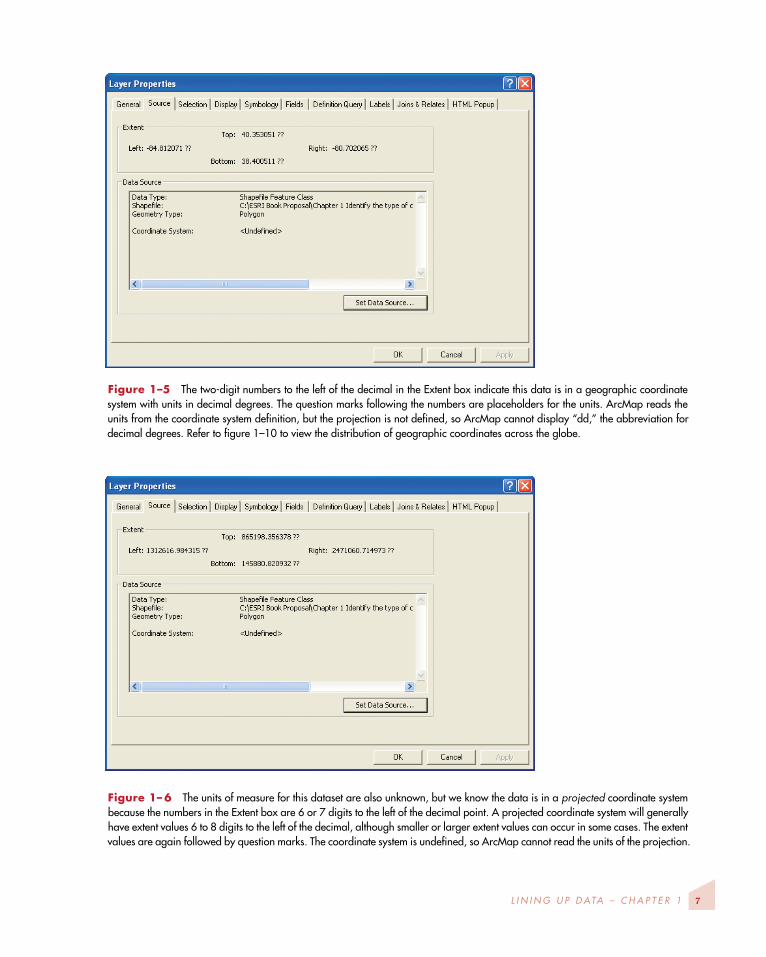
EXAMINING THE EXTENT OF THE DATARight-click the name of the layer in the ArcMap Table of Contents > Properties > Source tab (and follow along with figures 5 through 7). In the Extent box near the top, count the number of digits to the left of the decimal for Top, Bottom, Left, and Right. (Ignore any digits to the right of the decimal.) These numbers to the left of the decimal are the extent of the data on the earth, in the coordinate system of the data. These values are meaningful only in relation to the correct coordinate system definition.
The question marks following the Extent values substitute for an abbreviation for the units of measure for the coordinate system. ArcMap reads the units of measure from the projection file. Since the data does not have a coordinate system defined, there is no projection file associated with the data, and ArcMap is unable to read the units.
Figure 1–4 Toclear the incorrect coordinate systemdefinitionfromthedata,clicktheClearbutton,thenclickApplyandOK.Theincorrectprojectiondefinitionwillberemovedfromthedata.
L I N I N G U P D ATA – C H A P T E R 1 7
Figure 1–5 Thetwo-digitnumberstotheleftofthedecimalintheExtentboxindicatethisdataisinageographiccoordinatesystemwithunitsindecimaldegrees.Thequestionmarksfollowingthenumbersareplaceholdersfortheunits.ArcMapreadstheunitsfromthecoordinatesystemdefinition,buttheprojectionisnotdefined,soArcMapcannotdisplay“dd,”theabbreviationfordecimaldegrees.Refertofigure1–10toviewthedistributionofgeographiccoordinatesacrosstheglobe.
Figure 1– 6 Theunitsofmeasureforthisdatasetarealsounknown,butweknowthedataisinaprojectedcoordinatesystembecausethenumbersintheExtentboxare6or7digitstotheleftofthedecimalpoint.Aprojectedcoordinatesystemwillgenerallyhaveextentvalues6to8digitstotheleftofthedecimal,althoughsmallerorlargerextentvaluescanoccurinsomecases.Theextentvaluesareagainfollowedbyquestionmarks.Thecoordinatesystemisundefined,soArcMapcannotreadtheunitsoftheprojection.

8 I D E N T I F Y I N G T H E T Y P E O F C O O R D I N AT E S Y S T E M F O R D ATA U S I N G A R C M A P
Figure 1–7 Thisdataset isalsoinaprojectedcoordinatesystem,withextentvalues6or7digits to the leftof thedecimal.Comparingfigure1–6withthisscreenshot,noticethatthepositionofthenumberofdigitsisdifferent.Infigure1–6,theTopandBottomvaluesare6digitstotheleftofthedecimal.Inthisfigure,theTopandBottomvaluesare7digitstotheleftofthedecimal.Infigure1–6,theLeftandRightvaluesare7digitstotheleftofthedecimal,whileinfigure1–7thereareonly6digitsinthosepositions.Thisclueisimportantwhenworkingtoidentifythespatialreferenceforthedata,asyouwillsoonsee.
Figure 1–8 ThisAutoCADdrawingfile(DWG)hasanextentinalocalcoordinatesystem.TheLeftandBottomcoordinatesare1digittotheleftofthedecimal,whichcouldindicatedatainageographiccoordinatesystem(GCS),buttheTopandRightvaluesare4digitstotheleftofthedecimal,sothisdatahastobeinalocalcoordinatesystem.

L I N I N G U P D ATA – C H A P T E R 1 9
Note the number of digits to the left of the decimal on a piece of paper as a reference to be used in the following steps. You can make a quick diagram with the number of digits arranged as shown in figure 1–9, four samples of what the coordinates may look like for four given sets of data.
Figure 1–9 DiagramsoffoursampleextentsfordatainArcMap,indatasetLayerProperties>Sourcetab>Extentboxdialog.ThesenumbersrepresentonlythenumberofdigitstotheleftofthedecimalintheTop,Bottom,Left,andRightpositions.
G E O G R A P H I C C O O R D I N AT E S Y S T E M E X T E N T SIn most cases, data that is in a geographic coordinate system (GCS) will have units of decimal degrees. A degree is an angle, and there are 360 degrees in a circle. In a GCS, the 360-degree extent is expressed in coordinates from -180° west to +180° east, measuring degrees of longitude or x-coordinates; and from +90° at the North Pole to -90° at the South Pole, measuring degrees of latitude or y-coordinates. These units are often referred to as “lat/long.”
Within this coordinate extent, the location of data in decimal degrees will be expressed as positive or negative numbers 1, 2, or 3 digits to the left of the decimal for longitude, the Left and Right values. The latitude values, either positive or negative, can be no more than 1 or 2 digits to the left of the decimal for the Top and Bottom coordinates.
Figure 1–10 Distributionofgeographiccoordinatesacrossthesurfaceoftheearth.
Data with coordinates in decimal degrees is in a GCS. This data can be created on hundreds of different datums. To define the coordinate system for data in a geographic coordinate system, the correct GCS and datum must be identified. (For detailed information about GCS and datums, refer to chapters 7 and 8.)

10 I D E N T I F Y I N G T H E T Y P E O F C O O R D I N AT E S Y S T E M F O R D ATA U S I N G A R C M A P
I d e n t i f y i n g t h e c o r r e c t G C S f o r t h e d a t aYou have determined that your data has 1, 2, or 3 digit numbers to the left of the decimal, as viewed in the Layer Properties dialog box > Source tab in ArcMap, so the data is in a geographic coordinate system. Now you must identify the correct GCS for the data so that the coordinate system can be defined correctly.
You need to know which datums are typically used for the area in which this data is located. The most commonly used datums in the United States, for example, are North American Datum 1927 (NAD 1927), North American Datum 1983 (NAD 1983), World Geodetic System 1984 (WGS 1984), and North American 1983 (HARN). (HARN stands for High Accuracy Reference Network.) These datums are part of the Geographic Coordinate Systems named GCS_North_American_1927, GCS_North_American_1983, GCS_WGS_1984, and GCS_North_American_1983_HARN.
Hundreds of GCS and their associated datums for all parts of the world are supported in ArcGIS Desktop. If at all possible, request this critical information from the data source. If the data source is unable to provide this information, turn to chapter 2 for steps to identify the geographic coordinate system for the data.
P R O J E C T E D C O O R D I N AT E S Y S T E M E X T E N T SGIS and computer-aided design (CAD) data can be created using projected coordinate systems (PCS). Instead of angular units like decimal degrees, a PCS expresses the location of data using linear units that can be measured on the ground with a ruler. The most commonly used linear units are feet or meters, although other linear units can also be used. ArcGIS Desktop has a wide variety of pre-defined projection files already installed for PCS that apply to specific geographic areas, as well as to the entire world, using different map projections, coordinate systems, linear units, and datums. (Refer to chapter 10 for more information about projection files and projection parameters.)
C o m m o n l y u s e d p r o j e c t e d c o o r d i n a t e s y s t e m sIn the United States, the most commonly used projected coordinate systems are state plane and universal transverse Mercator (UTM). Data projected to these coordinate systems, with units of feet or meters, will most often have extent values with 6 to 8 digits to the left of the decimal. As long as data projected to these coordinate systems falls completely within the area of the specified zone, the data will never display negative x or y values in the Extent box. Refer to figures 3–2 (page 29) and 3–7 (page 32) for illustrations of state plane and UTM zone extents.
In addition to these commonly used PCS, some states within the United States have created special coordinate systems for the entire state. These statewide projections are primarily created for states that are very large (Alaska, Texas), an odd shape (California, Florida, Michigan), or for distribu-tion of statewide GIS datasets by the state (Georgia, Mississippi, Oregon, Wisconsin). These PCS are supported in ArcGIS Desktop, and should also be considered when identifying the projected coordi-nate system for these states. Data projected to these specialized state coordinate systems may display negative x or y values in the Layer Properties > Source tab > Extent box.
In addition to these PCS options, both Minnesota and Wisconsin have county coordinate systems for the state. Each county in these states has a specific coordinate system developed for use within that county. These county coordinate systems are also supported in ArcGIS Desktop.

L I N I N G U P D ATA – C H A P T E R 1 11
If the data obtained is on a national or continental scale, data can be projected to coordinate systems created specifically for small-scale mapping. Some of these PCS are Albers equal area conic, equidistant conic, or Lambert conformal conic. Data in these coordinate systems may have negative x or y values in the data extent, and these coordinate systems should also be considered when work-ing to identify the coordinate system for data in a PCS. (Turn to chapter 3 for steps to identify the projected coordinate system of the data.)
L O C A L C O O R D I N AT E S Y S T E M E X T E N T S A N D C A DData created using CAD software is frequently in a local coordinate system. A local coordinate system has its origin (0,0 or other values) in an arbitrary location that can be anywhere on the surface of the earth.
For example, when a new subdivision is planned, a surveyor will be hired to map out the parcels, streets, open space, and other land use within the subdivision. The surveyor will begin work at a point of origin that is a known location southwest of the subdivision. From that point, the surveyor will collect bearings and distances for lines that define the parcels and other features. Sometimes this point of origin is in a “real-world” coordinate system, such as state plane, but often it is assigned arbitrary local coordinates like 0,0 or other values.
Referring to what you see in the Layer Properties dialog box, the Extent of data created in a local coordinate system will most often have Top, Bottom, Left, and Right coordinates that are 3, 4, or 5 digits to the left of the decimal. In some cases, the Left and Bottom values may be 0 or other very small values, as illustrated in figure 1–8 (page 8).
If the CAD data has an Extent value that is 6, 7, or 8 digits to the left of the decimal, the CAD data was probably created in a real-world coordinate system such as state plane. (In this case, turn to chapter 3 and apply the techniques for identifying a standard projected coordinate system, before addressing the more complex processes of modifying or creating a custom projection file for the CAD data discussed in chapters 4, 5, and 6.)
CAD data is most often created with units of feet or meters, but other units are sometimes used and they can be unusual. There are CAD files created with units of centimeters, millimeters, kilome-ters, miles, inches, and in units of a tenth of an inch. In cases where the units of measure are very small, the values in the Extent box can have a very large number of digits (up to 14) to the left of the decimal, and still be in the state plane coordinate system. (The method for identifying and customizing units used in a standard coordinate system like state plane is addressed in chapter 4.)
Small-scale vs. large-scale maps
Here the terminology of “small” and “large” is counterintuitive so it can be confusing.
Scale values can be thought of as ratios, and are unitless numbers. As an example, a scale of 1:100 means that 1 inch measured on the map is equal to 100 inches on the ground, 1 foot measured on the map equals 100 feet on the ground, and 1 meter measured on the map equals 100 meters on the ground.
Therefore, a small-scale map is one that displays data over a large area: a state like Alaska, an entire country like France, a continent, or the entire world. Scales shown in ArcMap may range from 1:1,000,000 to 1:750,000,000.
A large-scale map is one that displays data over a small area: a city, a county, a state plane FIPS zone (more about state plane FIPS zones later). Scales shown in ArcMap may range from 1:100 to 1:1,000,000.

12 I D E N T I F Y I N G T H E T Y P E O F C O O R D I N AT E S Y S T E M F O R D ATA U S I N G A R C M A P
CAD data in a local coordinate system can be aligned with other data in a projected coordinate system in ArcMap using one of four methods:
1. Modifying an existing projection file installed with ArcGIS Desktop.
2. Creating a custom projection file to align the data.
3. Transforming the CAD data in ArcMap.
4. Georeferencing the CAD data in ArcMap.
Instructions for options 3 and 4 above are provided in the ArcGIS Desktop Help. These alignment methods are not addressed in this book because the two methods only change the location where the CAD data is displayed in ArcMap. They do not provide for permanent alignment of the data.
Chapters 4, 5, and 6 address various options for aligning CAD data or other types of data files created in a local coordinate system. All of the methods outlined in those three chapters will apply to some CAD data files, depending on the spatial reference and production methods used by the data source.
SUMMARYThis book is about identifying the coordinate system for data, so that the coordinate system can be correctly defined and the data will draw in the right location in ArcMap in relation to other data. Because you may have issues to deal with immediately, chapter 1 starts you off with the information most likely to help you resolve them.
Data in a geographic coordinate system (GCS) most often has units in decimal degrees, which are angles. If the units of the dataset’s coordinate system are in decimal degrees, the extent will have 1, 2, or 3 digit numbers to the left of the decimal, and some of these numbers may be negative. (Turn to chapter 2 for instructions on identifying the GCS for the data.)
Data in a projected coordinate system (PCS) most often has units in feet or meters. These are linear units that can be measured on the ground with a ruler. The extent will most often have 6, 7, or 8 digits to the left of the decimal. Most often these numbers will be positive, but they can also be negative. (Turn to chapter 3 for instructions on identifying the PCS for the data.)
Data in a local coordinate system most frequently has units of feet or meters, but other units might have been used to create the file. Usually CAD data in a local coordinate system has values in the Extent box with 3, 4, or 5 digits to the left of the decimal, although the Left and Bottom extent values in some cases may be 0 or other very small values. Coordinates can also be negative numbers. CAD data may also be created in a standard coordinate system, but the use of unusual units can cause extent numbers to be much larger (up to 14 digits) or smaller than usual.
Turn to chapter 4 for instructions on how to identify and modify a projection file to apply unusual units of measure. Chapter 5 offers instructions for modifying a standard projection file to align these data. Chapter 6 illustrates sample procedures that can be used to align rotated CAD files with other data.